Alert Grouping
Alert grouping gives you the flexibility to customize how your alerts and notifications are generated from monitors, allowing you to specify a grouping condition based on a specific field(s). Each unique value of the field(s) will be evaluated against the alerting and resolution conditions, and if it meets the threshold, an alert will be fired and resolved respectively.
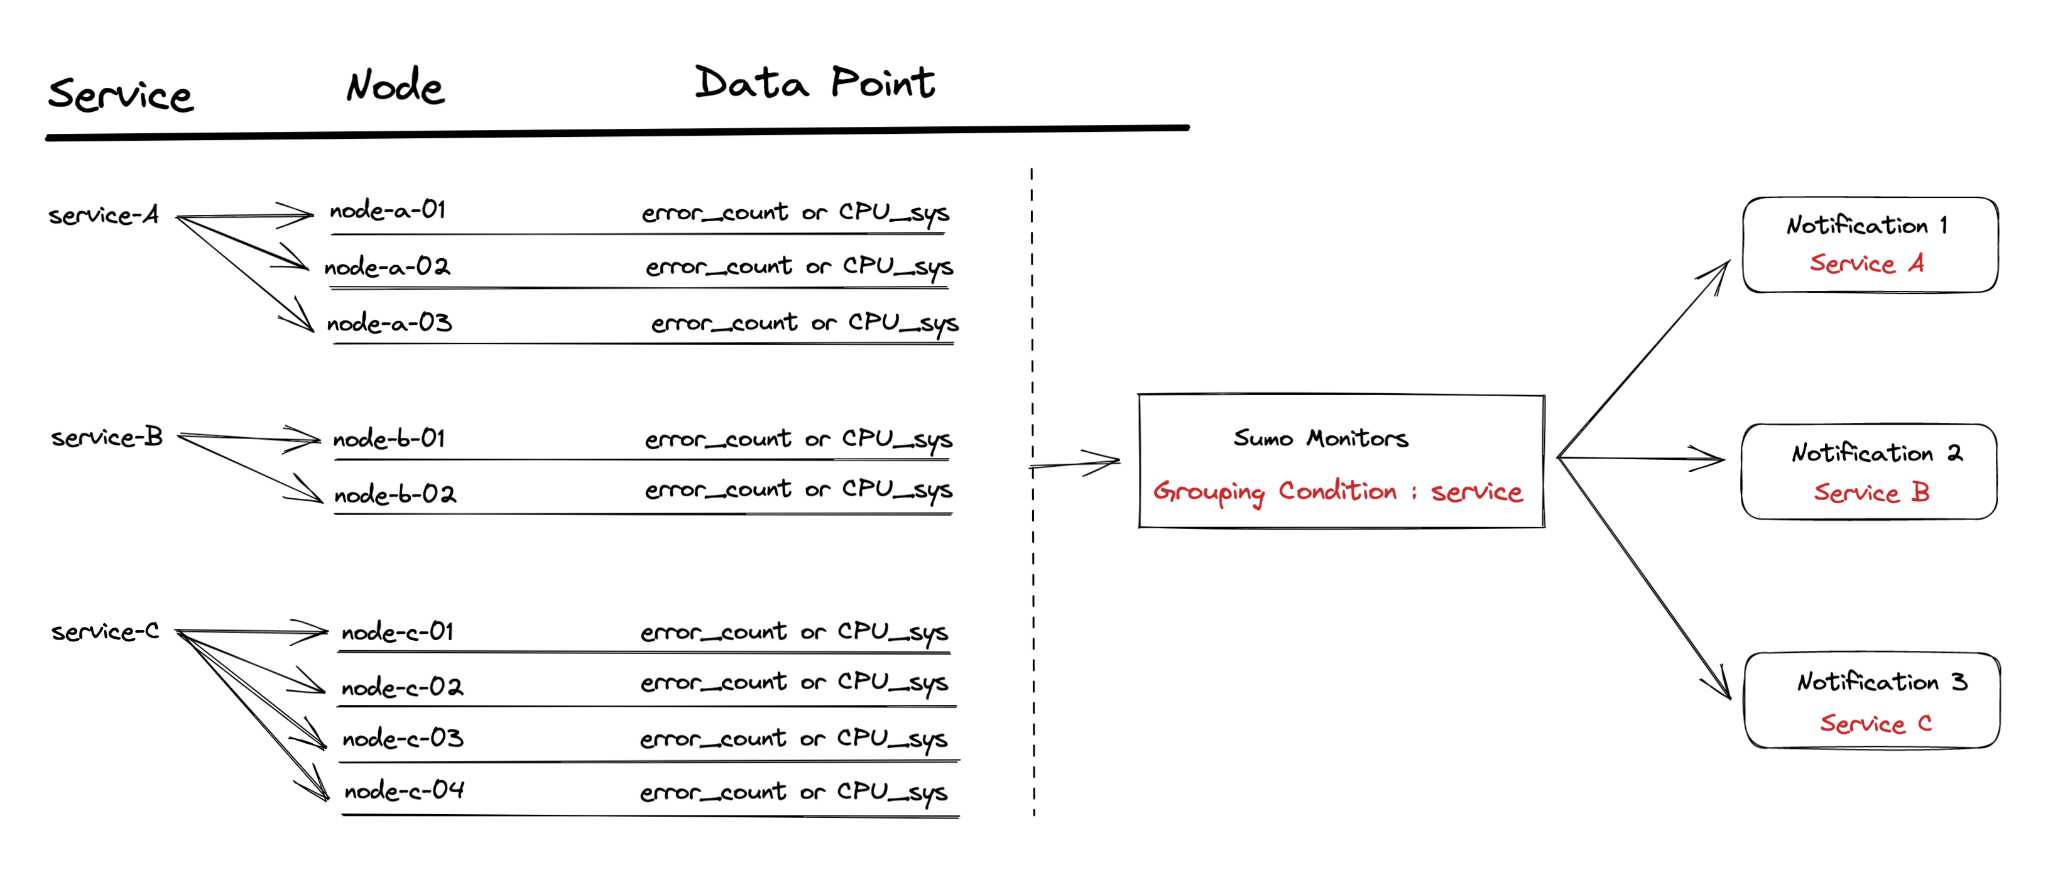
You could group by _collector field, for example, and one alert would be generated per _collector. You can also have a monitor generate and resolve more than one alert based on specific conditions. For this example below, let's say you're monitoring the ErrorRate for all of your services and want to get an alert for each service that breaches a specific error threshold. Rather than creating multiple monitors for each service, you can create one single monitor that does this.
Setup
Alert grouping works for both logs and metrics monitors.
Metrics
- Classic UI. In the main Sumo Logic menu, select Manage Data > Monitoring > Monitors.
New UI. In the main Sumo Logic menu, select Alerts > Monitors. You can also click the Go To... menu at the top of the screen and select Monitors. - Click Add a New monitor.
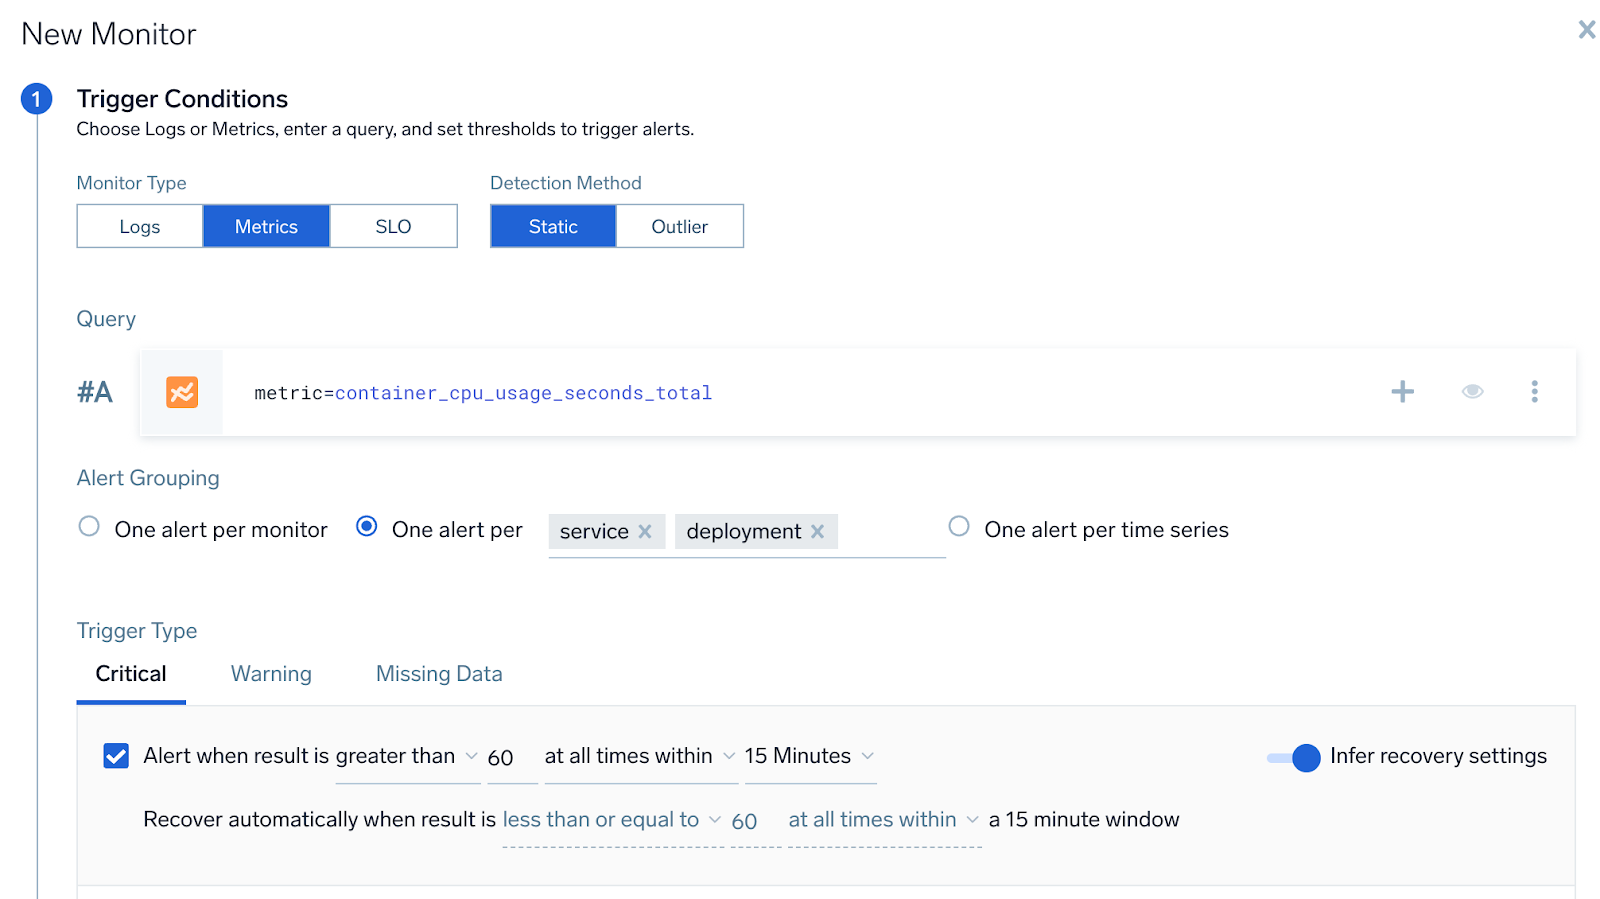
- Select Metrics as the type of monitor.
- Enter your metrics query, then select your desired alert grouping option.
- One alert per monitor. If you only want to receive a single alert for the entire monitor.
- One alert per time series. To receive a single alert for each time-series that is present in the metric query
- One alert per [group]. Allows you to receive one notification per each unique value of the grouping field(s). You can pick more than one field for the grouping condition. In the example below, user will receive one notification when CPU utilization is higher than the threshold for each unique AWS namespace within an account.
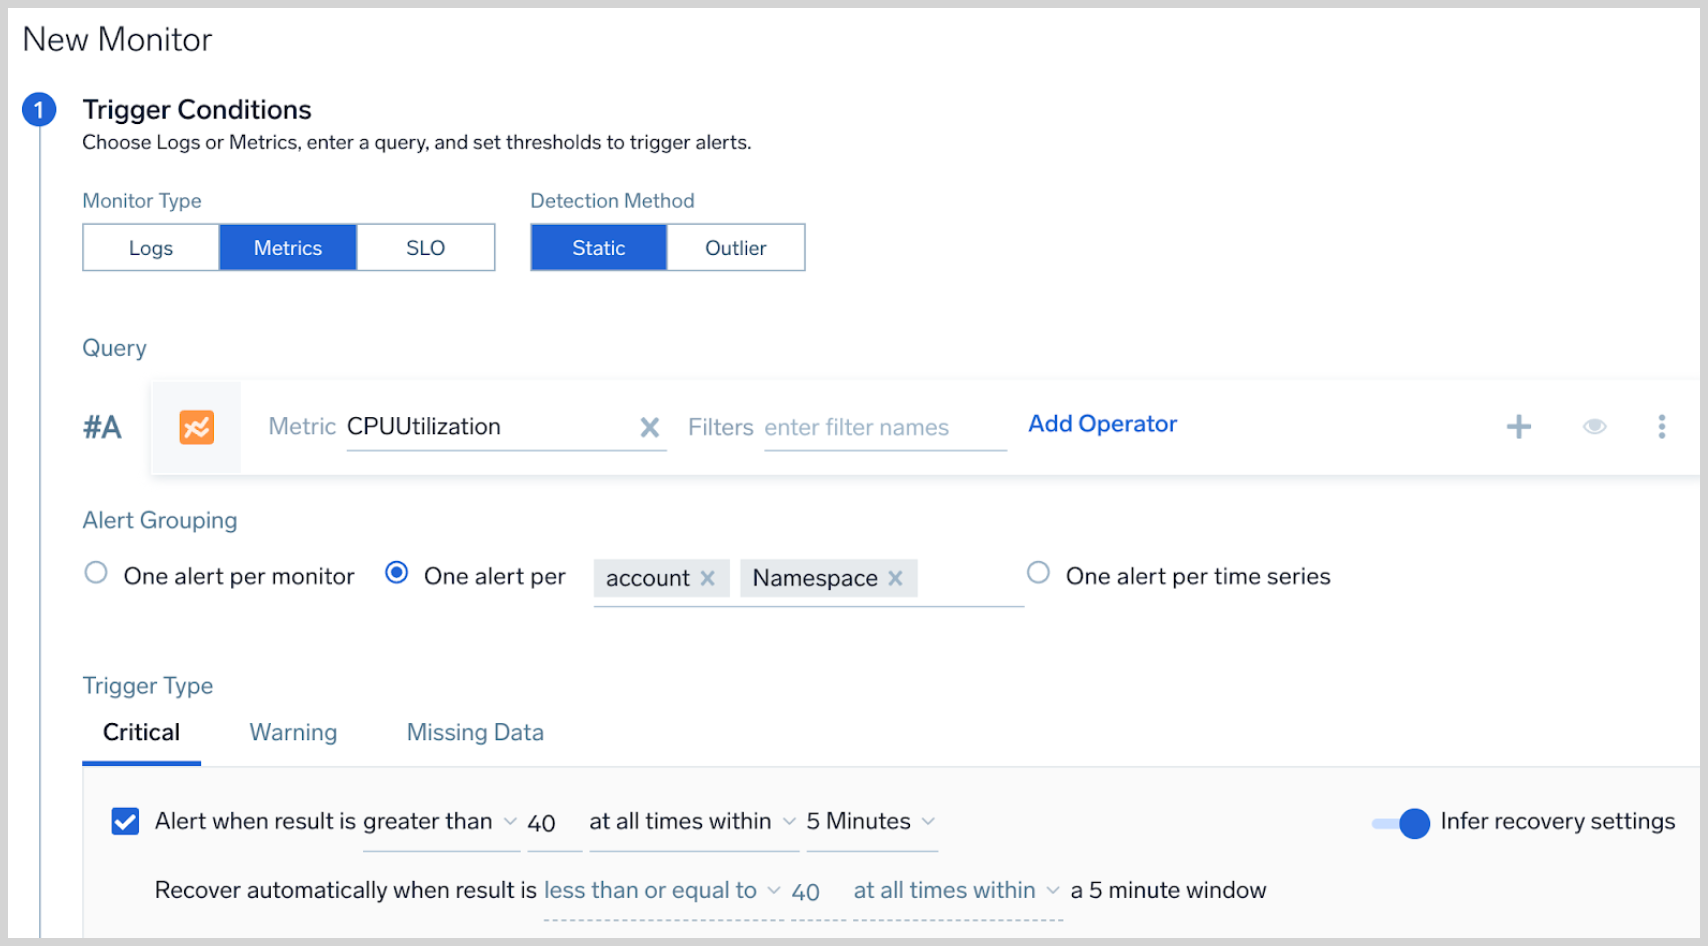
- Configure the rest of your alert condition per standard procedure. Refer to Monitors for more details.
Logs
- Classic UI. In the main Sumo Logic menu, select Manage Data > Monitoring > Monitors.
New UI. In the main Sumo Logic menu, select Alerts > Monitors. You can also click the Go To... menu at the top of the screen and select Monitors. - Click Add a New monitor.
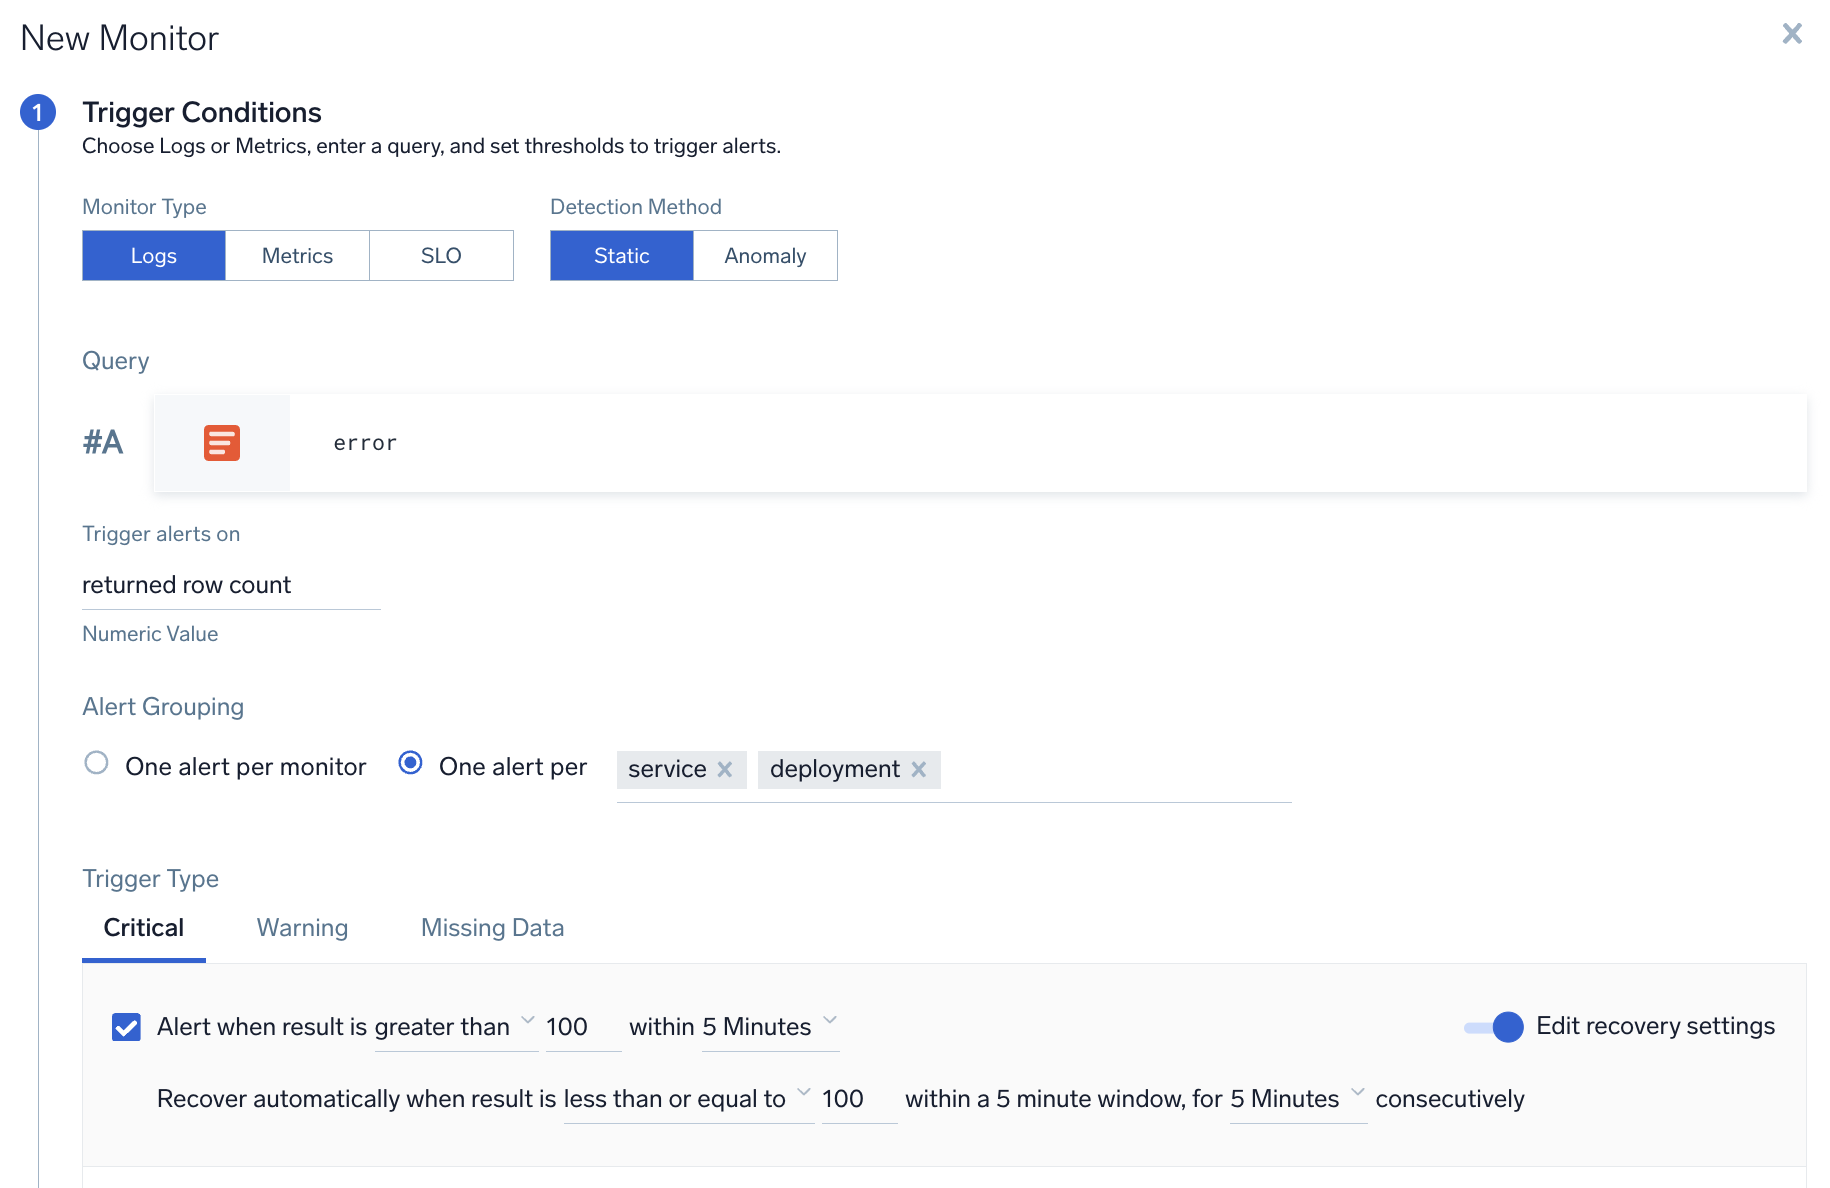
- Select Logs as the type of monitor.
- Enter your logs query, then select your desired alert grouping option:
- One alert per monitor. Choose this option if you want to only receive a single alert for the entire monitor.
- One alert per [group]. Allows you to receive one notification per each unique value of the grouping field(s). You can pick more than one field for the grouping condition. In the example below, you would receive one alert for each
servicethat has error count greater than 50. The input field has an auto-completion dropdown that allows you to select all the applicable fields from your query.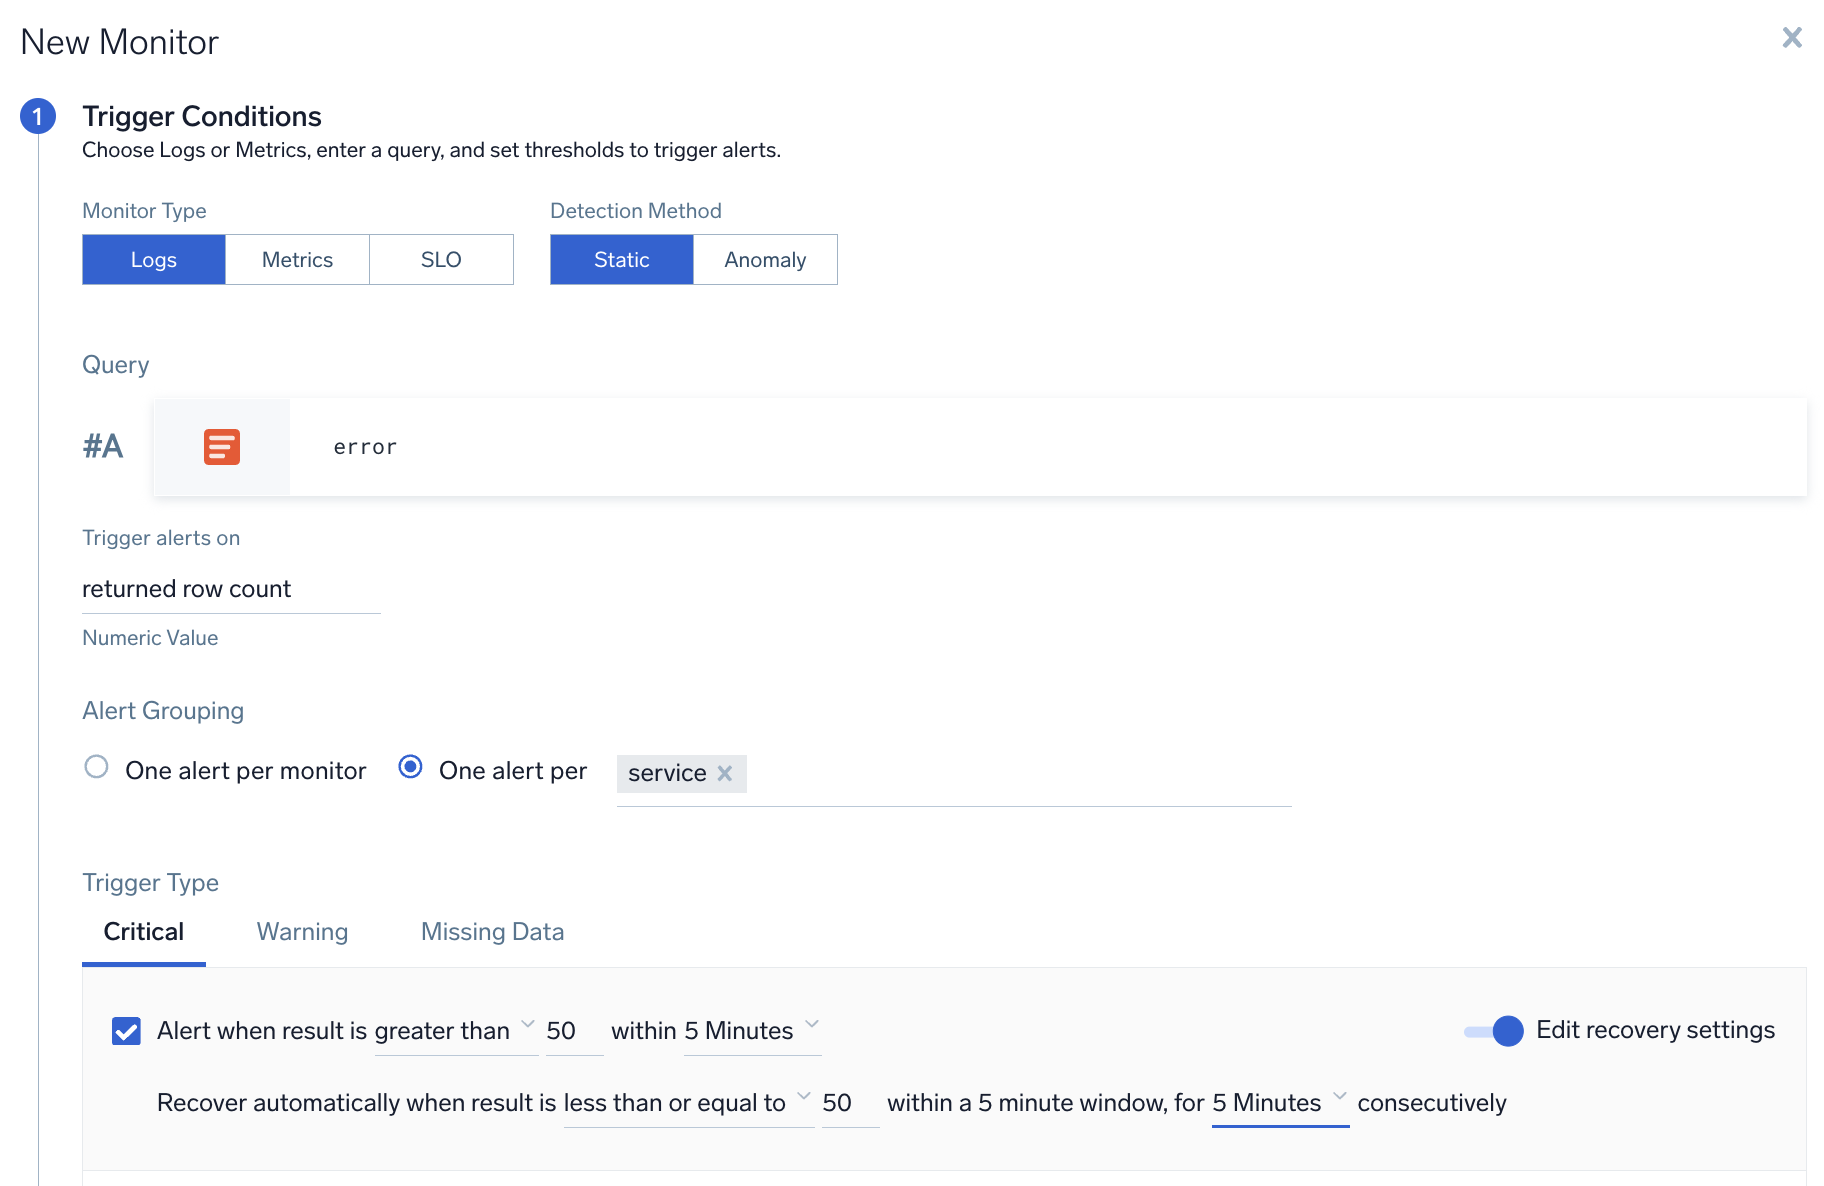
- Configure the rest of your alert condition per standard procedure. Refer to Monitors for more details.
The input field has an auto-completion dropdown that allows you to select all the applicable fields from your query.
Set a Muting Schedule for an alert group
Optionally, you can apply a Muting Schedule to your alert group. Learn more.
Use cases
Notifications will not be sent for alert groups that already have an active alert.
Metrics monitor with single alert group
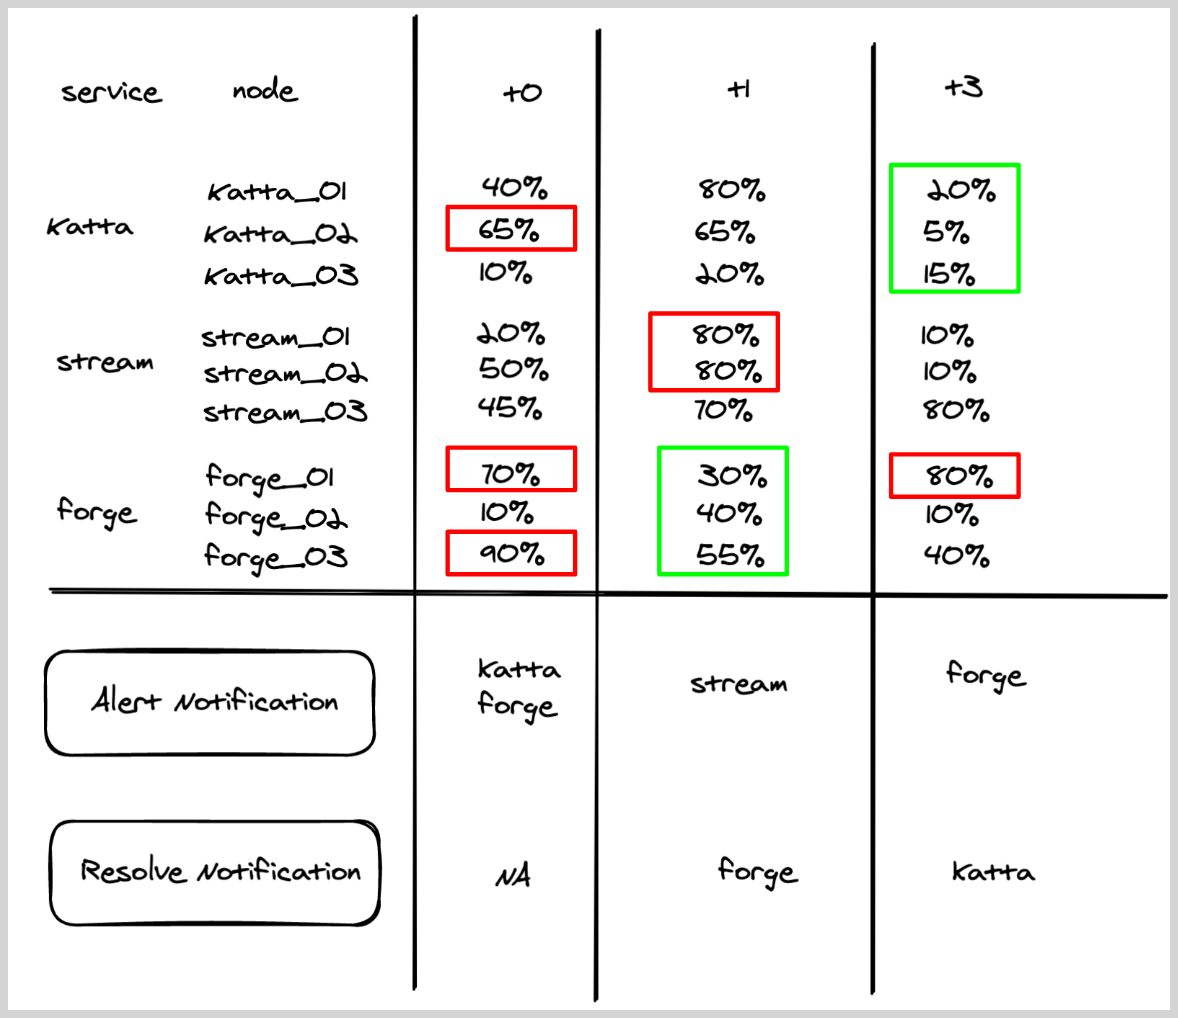
A user wants to create a monitor to track CPU across services, and wants to get notified if any node within a service has CPU > 60%.
- Query.
metric=CPU_sys. - Group Condition service
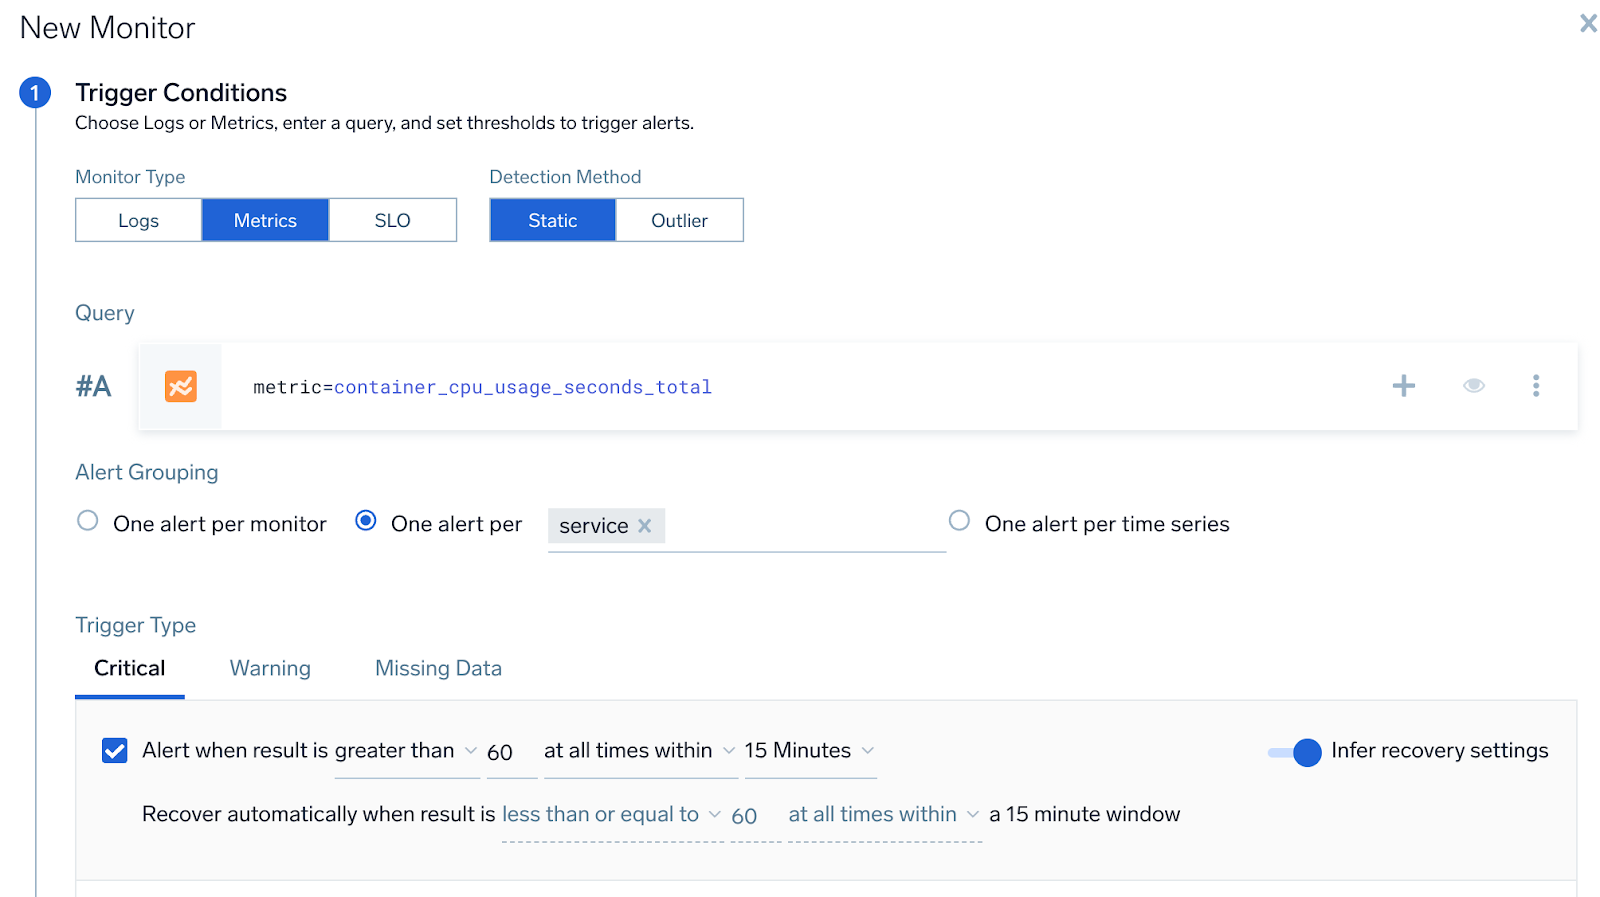
- Alert Evaluation Logic. If
CPU_sysfor any node within a service is greater than60, then an alert notification will be generated for that service (if it was not already generated). - Recovery Evaluation Logic.
- If
CPU_sysfor all the nodes within a service is less than equal to60, then recover the alert for that particular service. - Chart below shows how the alert and recovery notification would have fired for some hypothetical services under various times (t0–t3).
- Red boxes show that triggered the alert, and green boxes show what resolved the alerts.
- If
Metrics monitor with multiple alert group fields
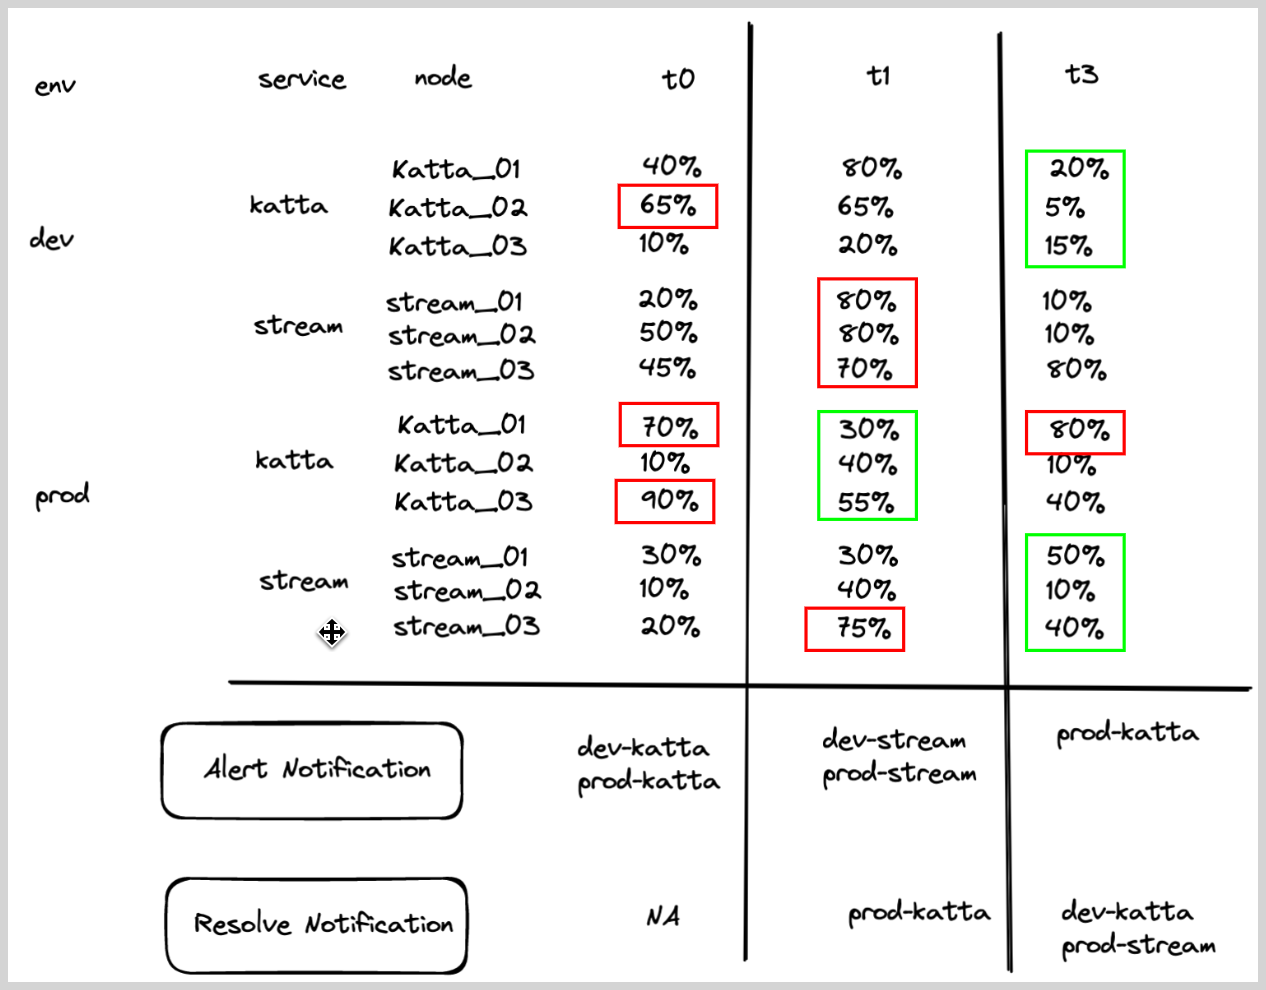
A user wants to create a monitor to track CPU and be notified if any node within a service has CPU > 60%, for a given env.
- Query.
metric=CPU_sys. - Group Condition. service, env
- Alert Evaluation Logic. If
CPU_sysfor any node within a service,env is greater than60, then an alert notification will be generated for that service within a given environment (if it was not already generated). - Recovery Evaluation Logic.
- If
CPU_sysfor all the nodes within a service,env is less than equal to60, then recover the alert for that particular service within a given environment. - Chart below shows how the alert and recovery notification would have fired for some hypothetical service, env under various times (T0 -T3).
- Red boxes shows that triggered the alert, and green boxes shows what resolved the alerts.
- If
Logs monitor with multiple alert group fields
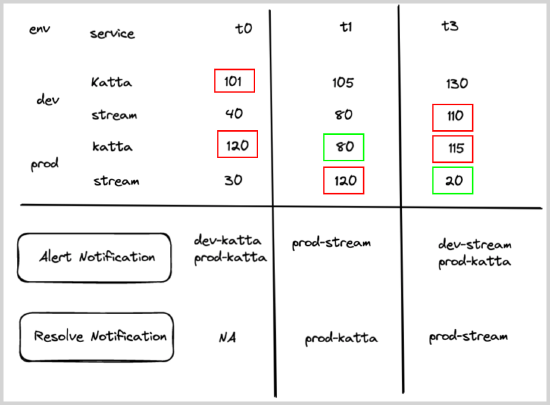
A user wants to create a monitor to track errors and be notified if any service in a given env has more than 100 errors.
- Query.
error - Group Condition. service, env
- Alert Evaluation Logic. If count of
errorsfor any service,env is greater than100, then an alert notification will be generated for that service within a given environment (if it was not already generated). - Recovery Evaluation Logic.
- If count of errors for any service is less than or equal to
100, then recover the alert for that particular service within a given environment. - Chart below shows how the alert and recovery notification would have fired for some hypothetical services under various times (t0–t3).
- Red boxes show what triggered the alert, and green boxes show what resolved the alerts.
- If count of errors for any service is less than or equal to
Logs monitor on a field with alert group
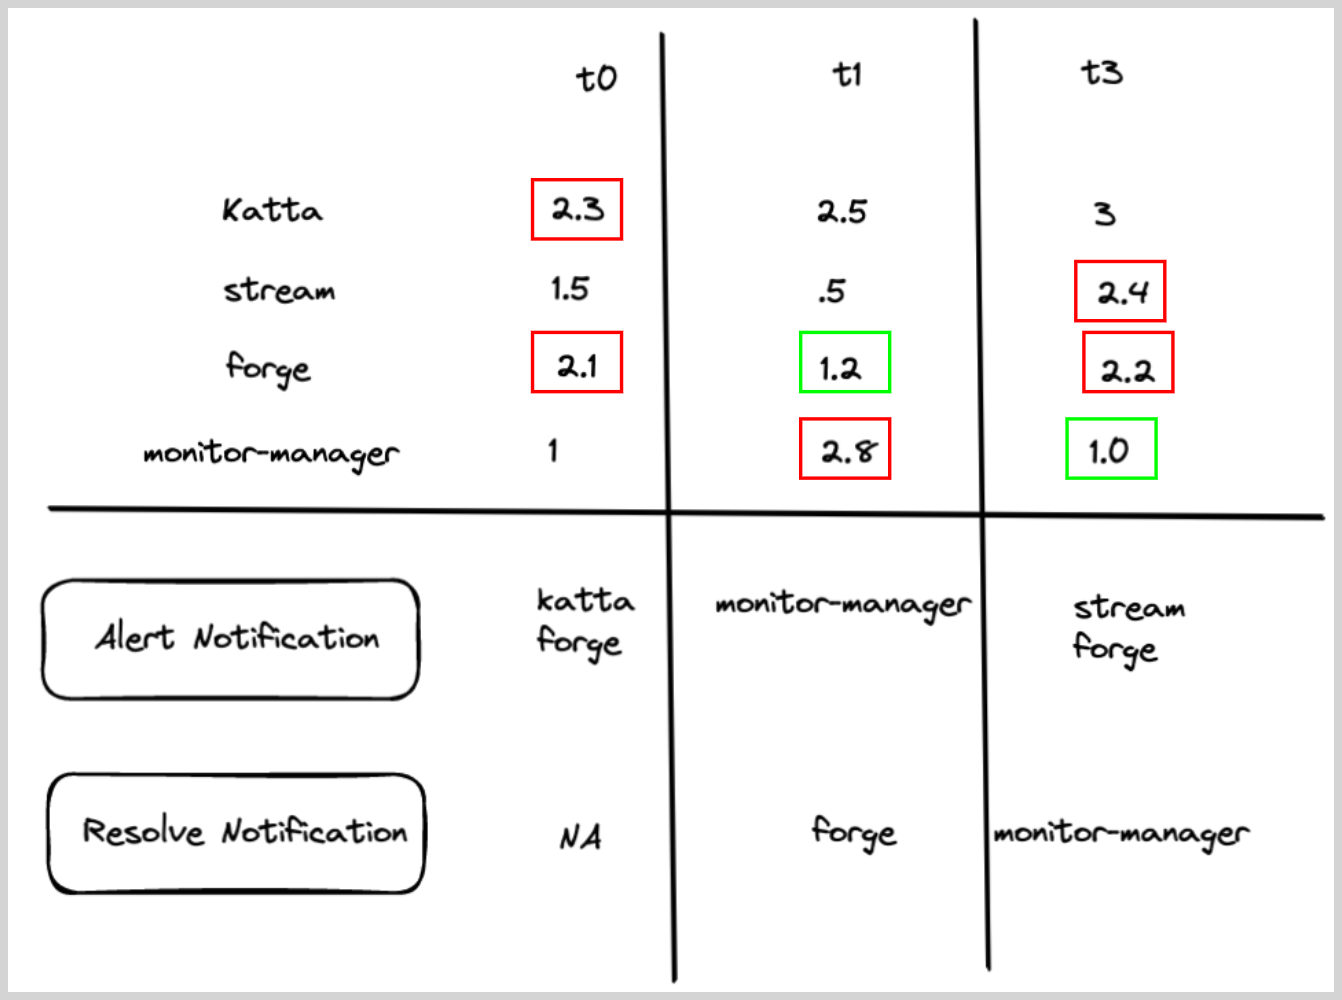
A user wants to create a monitor to track latency from log messages, and wants to get notified if any service has more than 2-second latency.
- Query.
* | parse Latency:*s as latency(parse out latency field from logs) - Group Condition. service
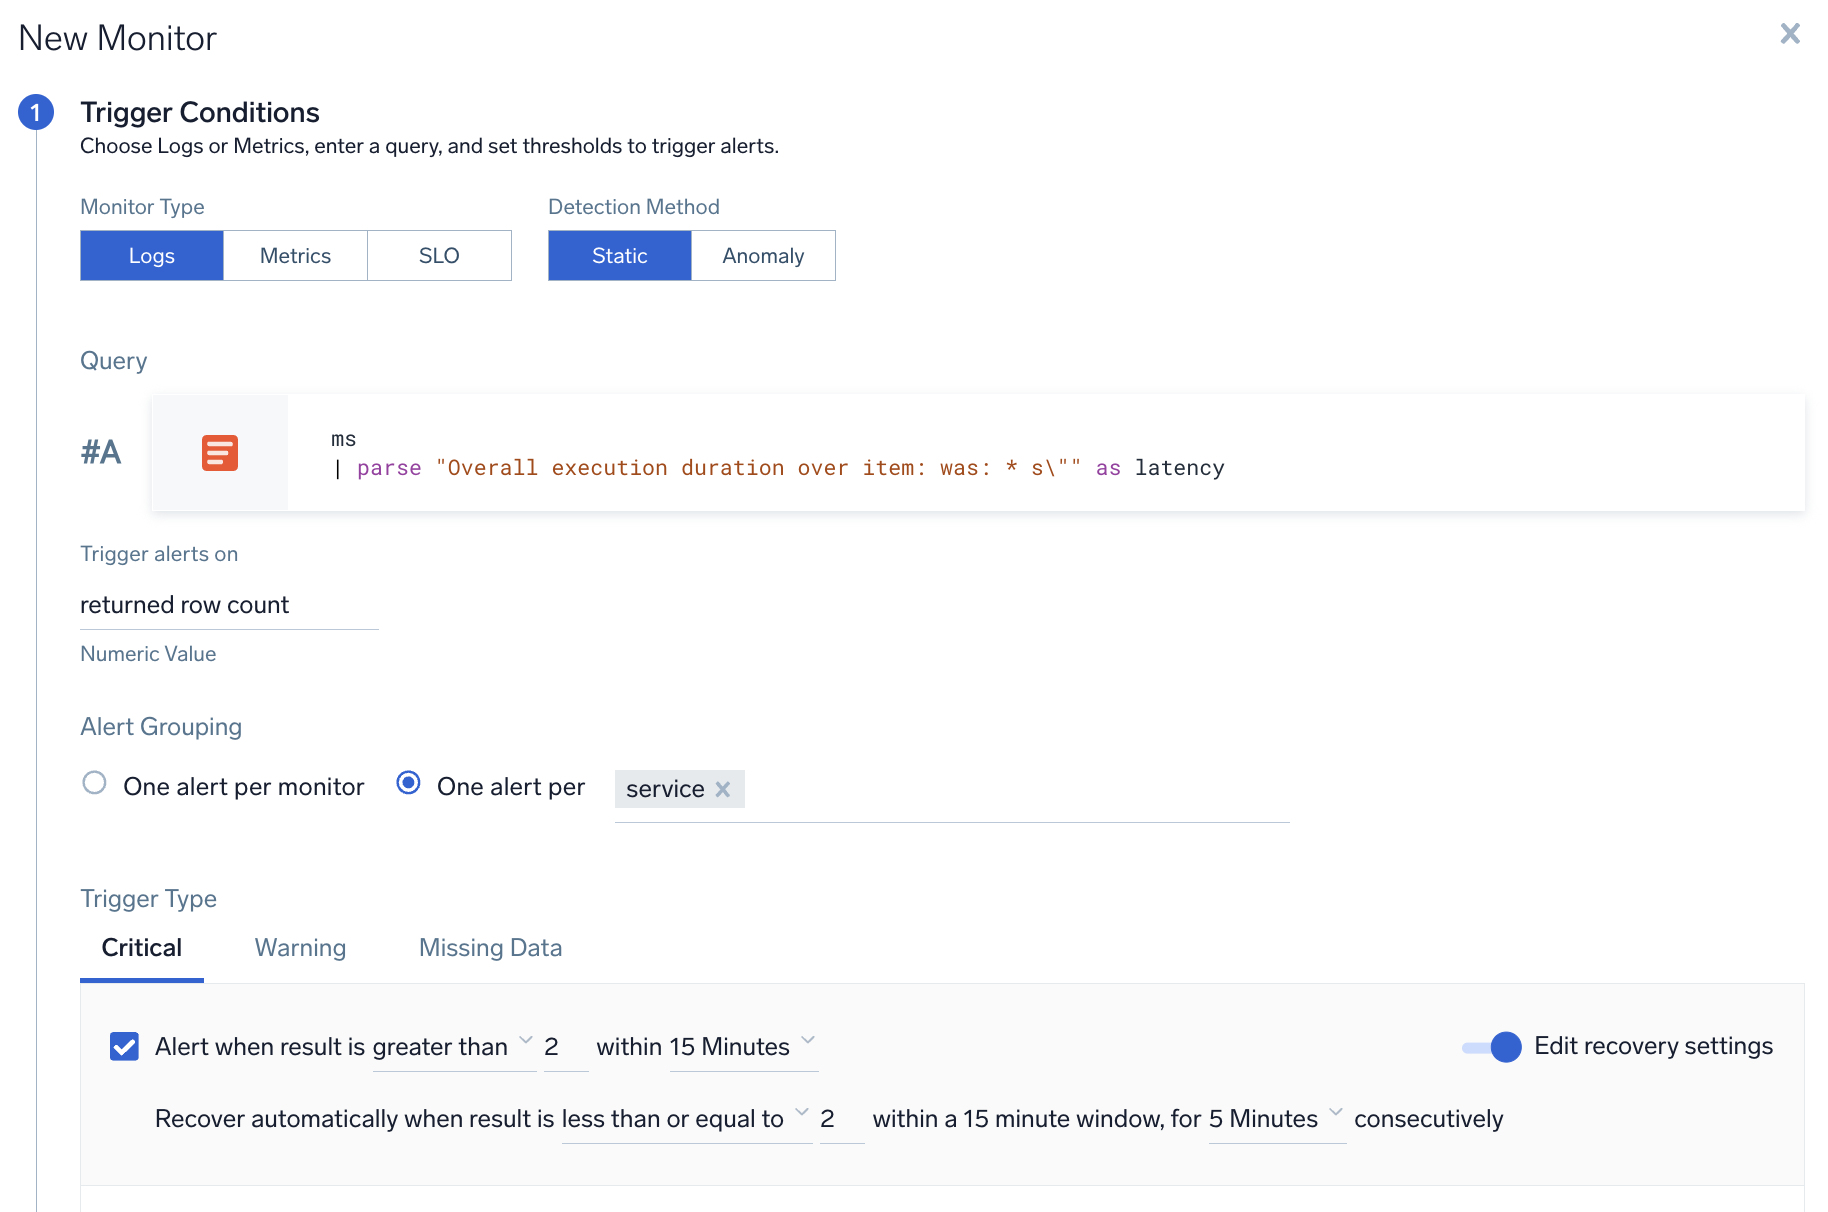
- Alert Evaluation Logic. If Latency field for any service is greater than 2 seconds, then an alert notification will be generated for that service (if it was not already generated).
- Recovery Evaluation Logic.
- If the latency field for any service is less than 2 seconds, then recover the alert for that particular service.
- Chart below shows how the alert and recovery notification would have fired for some hypothetical services under various times (t0–t3)
- Red boxes show what triggered the alert, and green boxes show what resolved the alerts.
Missing data metrics monitor with alert group
A user wants to get an alert if all hosts from a given service has stopped sending data. User wants one part per service.
- Query.
metric=CPU_sys - Group Condition. service
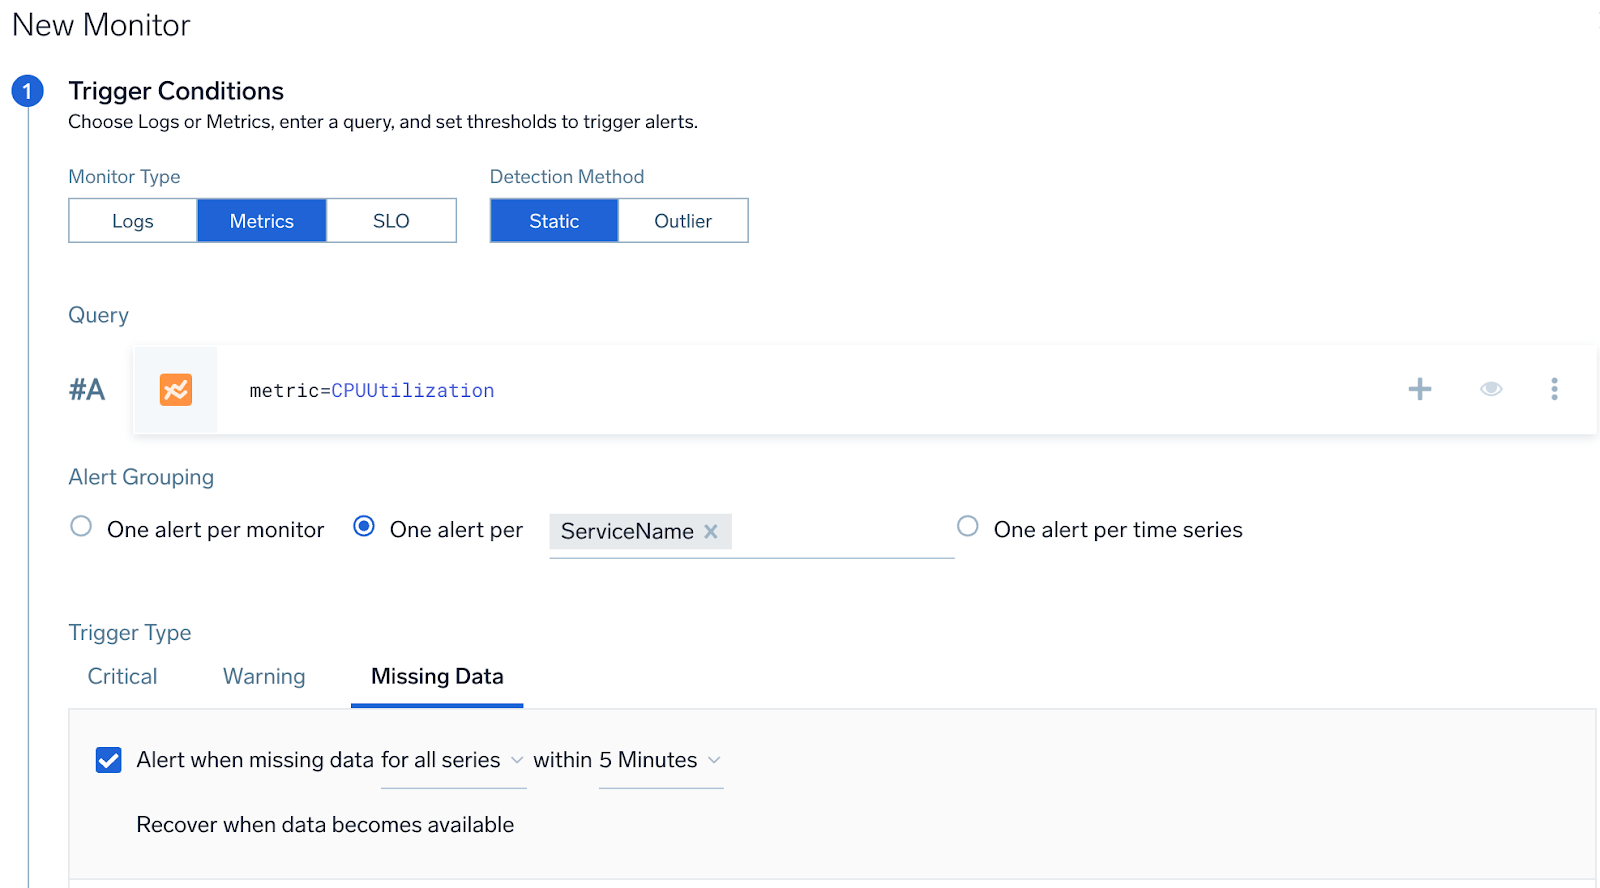
- Alert Evaluation Logic. If all the hosts stop sending data (
CPU_sysmetric is not being sent) then generate an alert for a given service, then an alert notification will be generated for that service (if it was not already generated). The list of hosts for a service will be computed and updated on a periodic basis. - Recovery Evaluation Logic.
- If any of the hosts for a given service start sending the data, then resolve the alert.
- If a host stops sending data for more than 24 hours, then remove that host from the list of hosts for a service. Evaluate again if
missingDatais resolved based on the remaining hosts. If yes, then resolve; if not, then keep it open.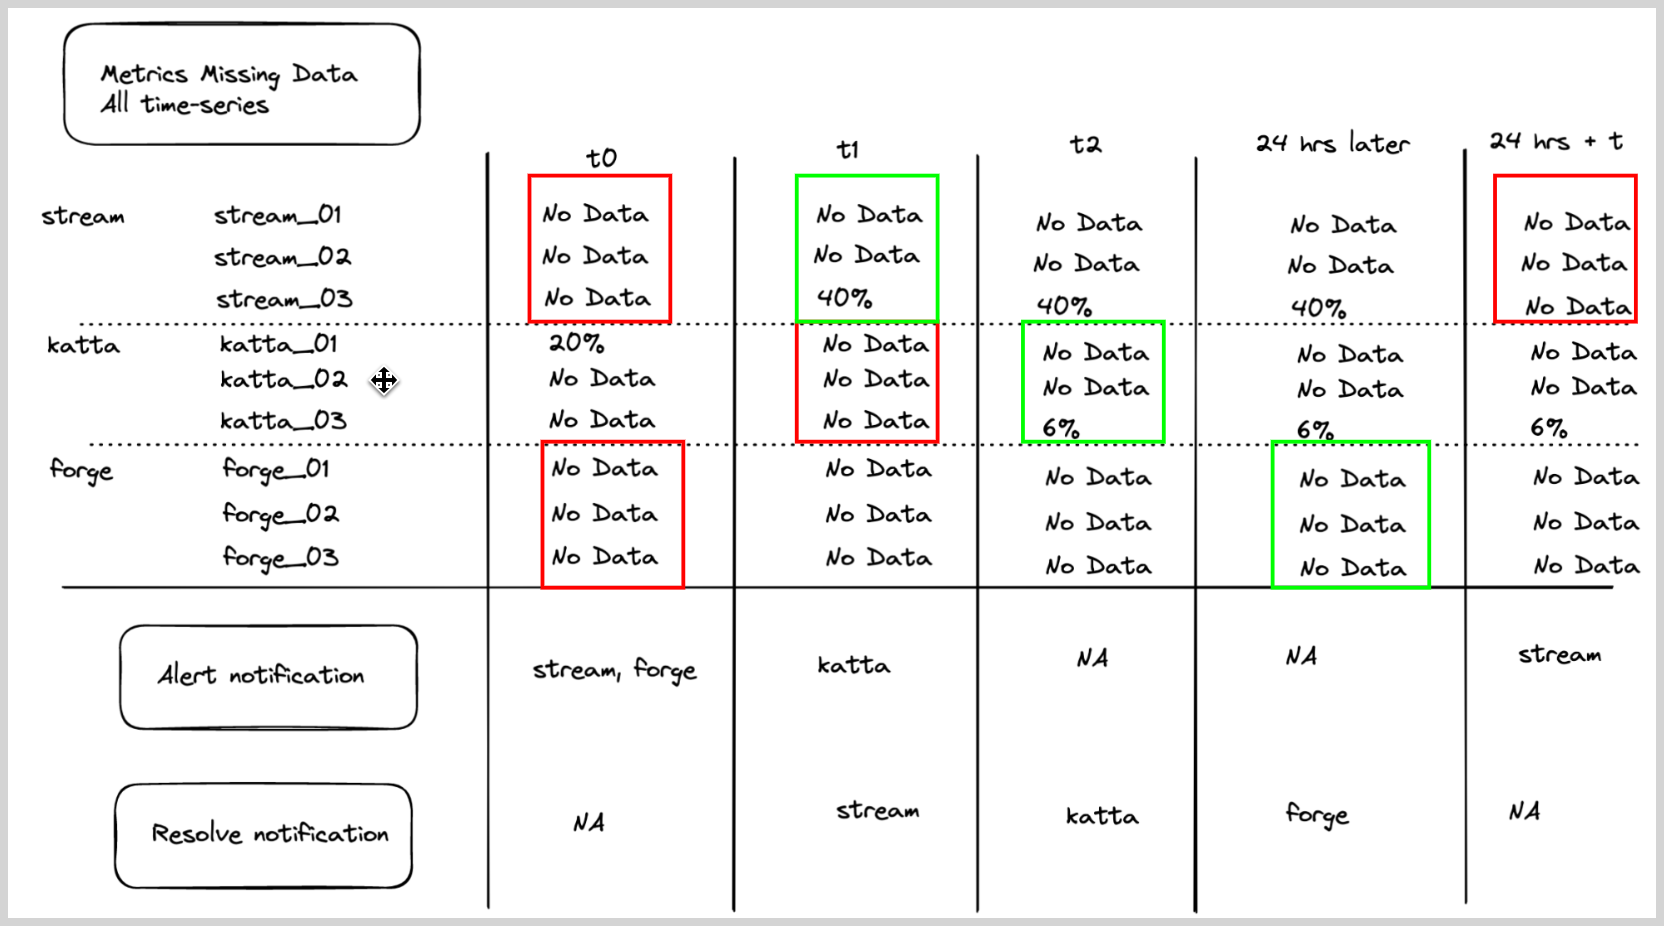
Sumo Logic recommended monitors
This alert can be useful if you suspect that one of your collectors has stopped sending data. Once you set this up, you'll get an alert about collector if it's stopped sending data. This alert will work without any issues, even if you add new collectors to your Sumo Logic account.
- Query.
_index=sumologic_volume AND _sourceCategory=collector_volume
| parse regex "\"(?<collector>[^\"]*)\"\:(?<data>\{[^\}]*\})" multi
| json field=data "sizeInBytes", "count" as bytes, count
| sum(bytes) as total_bytes by collector
| round(total_bytes / 1024 / 1024) as total_mbytes
| fields total_mbytes, collector - Group Condition.
collector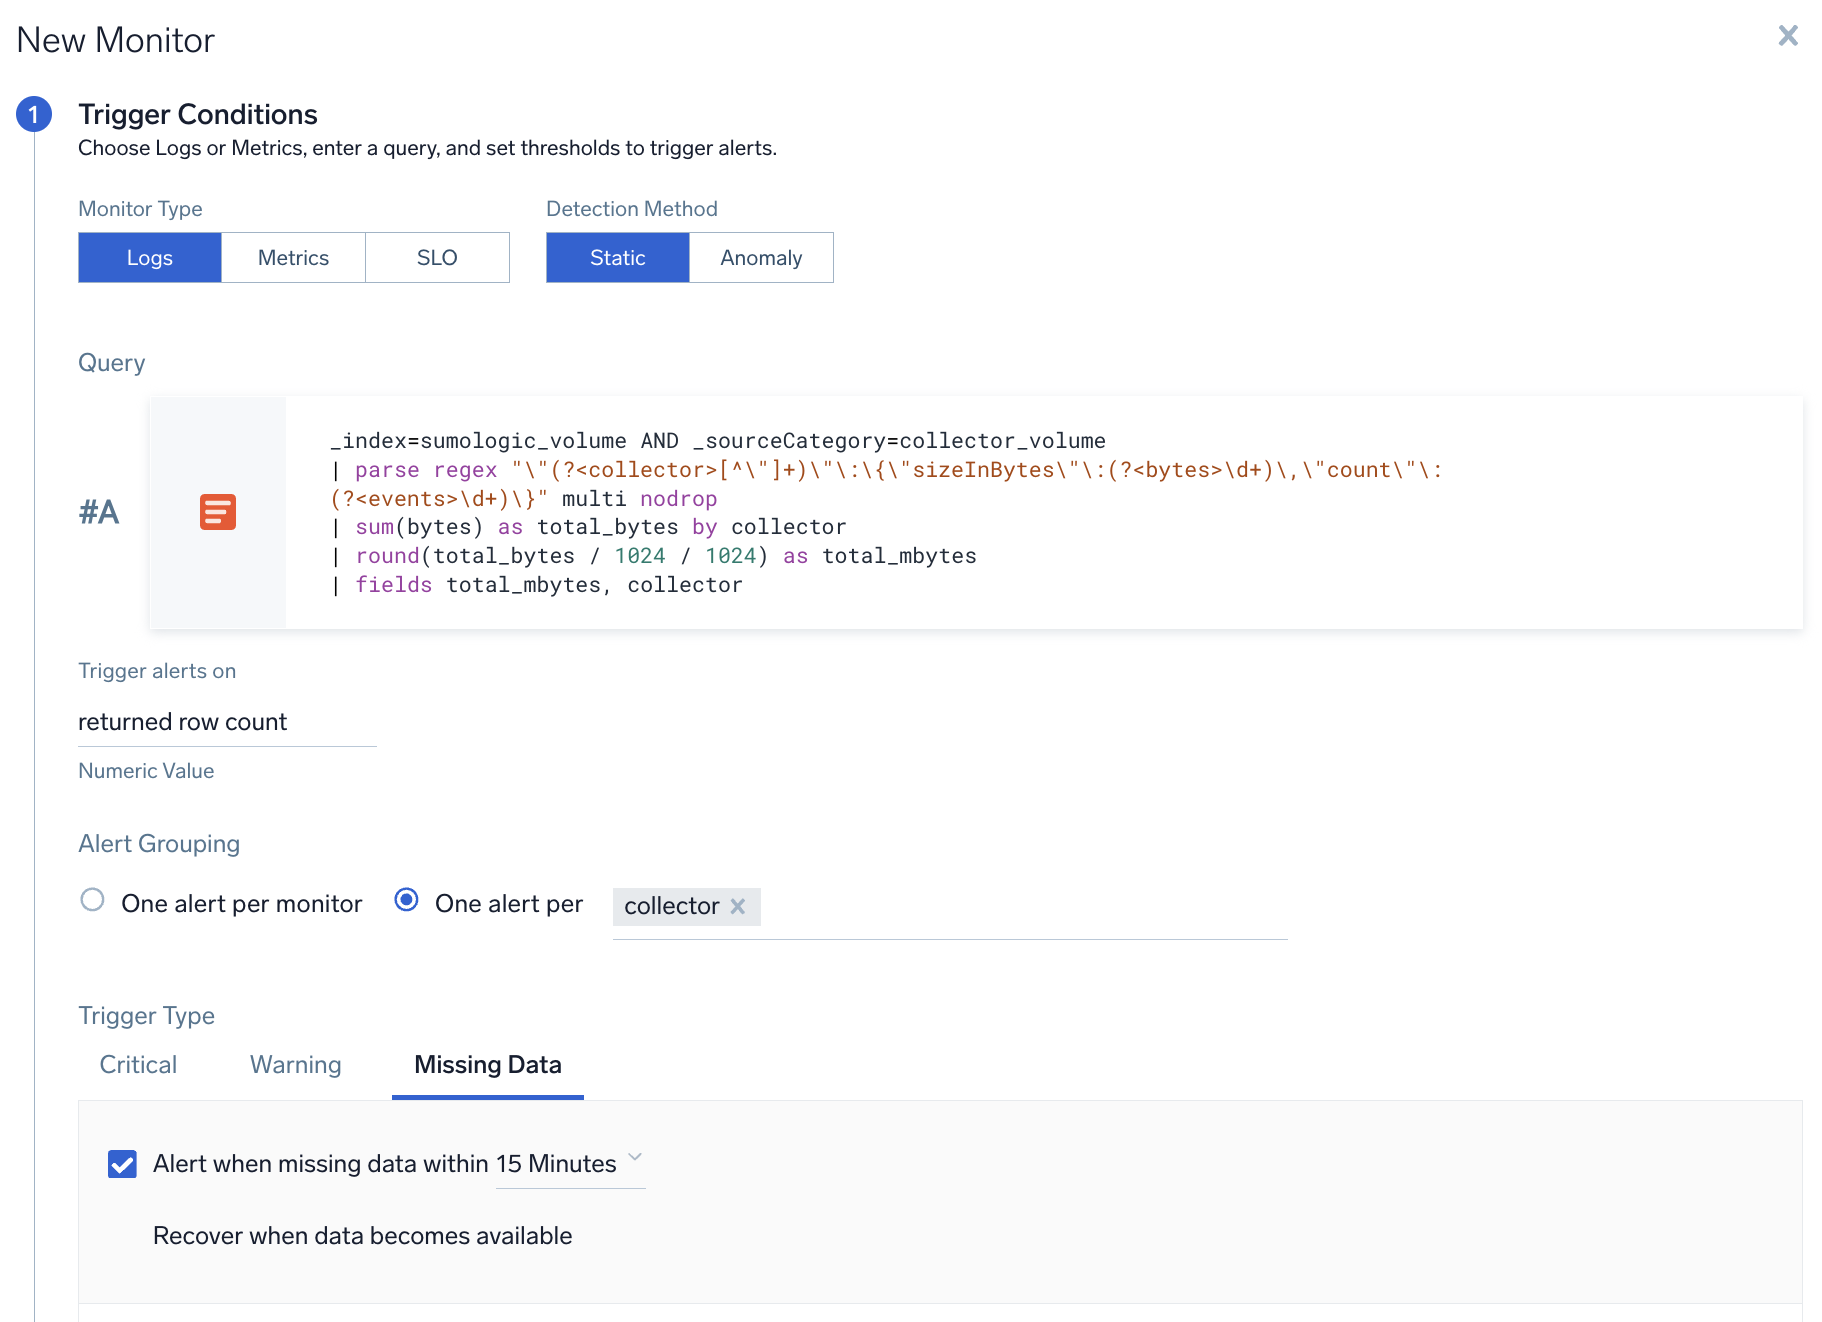
FAQ
How many fields can be selected under "One alert per [group]"?
You can select up to a maximum of 10 fields. This applies to both logs and metrics monitors.
My field is not appearing under "One alert per [group]" fields dropdown. Why is that?
This scenario, which is only applicable for logs monitors (not for metrics), can happen if you have dynamically parsed fields in your query. The auto-complete system uses a 15-minute time range to parse out all the dynamically parsed fields. If those fields are not present in the last 15-minute query, they will not show up in the dropdown. To resolve this, you could manually type in the name of the field, and it should work fine at runtime.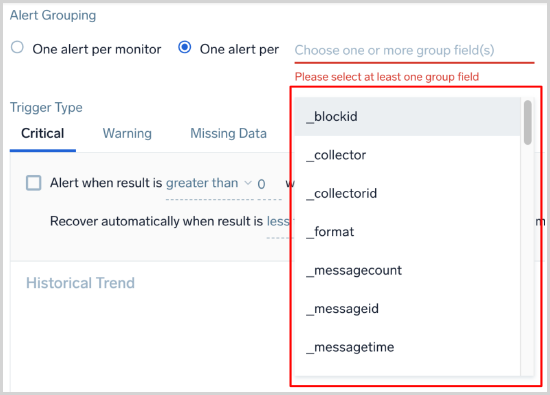
How does "One alert per [group]" impact alert audit logs?
Each alert generated in Sumo Logic generates an Alert Created audit log entry. When an alert is generated for specific grouping condition, the grouping information is captured in the audit log under the alertingGroup > groupKey.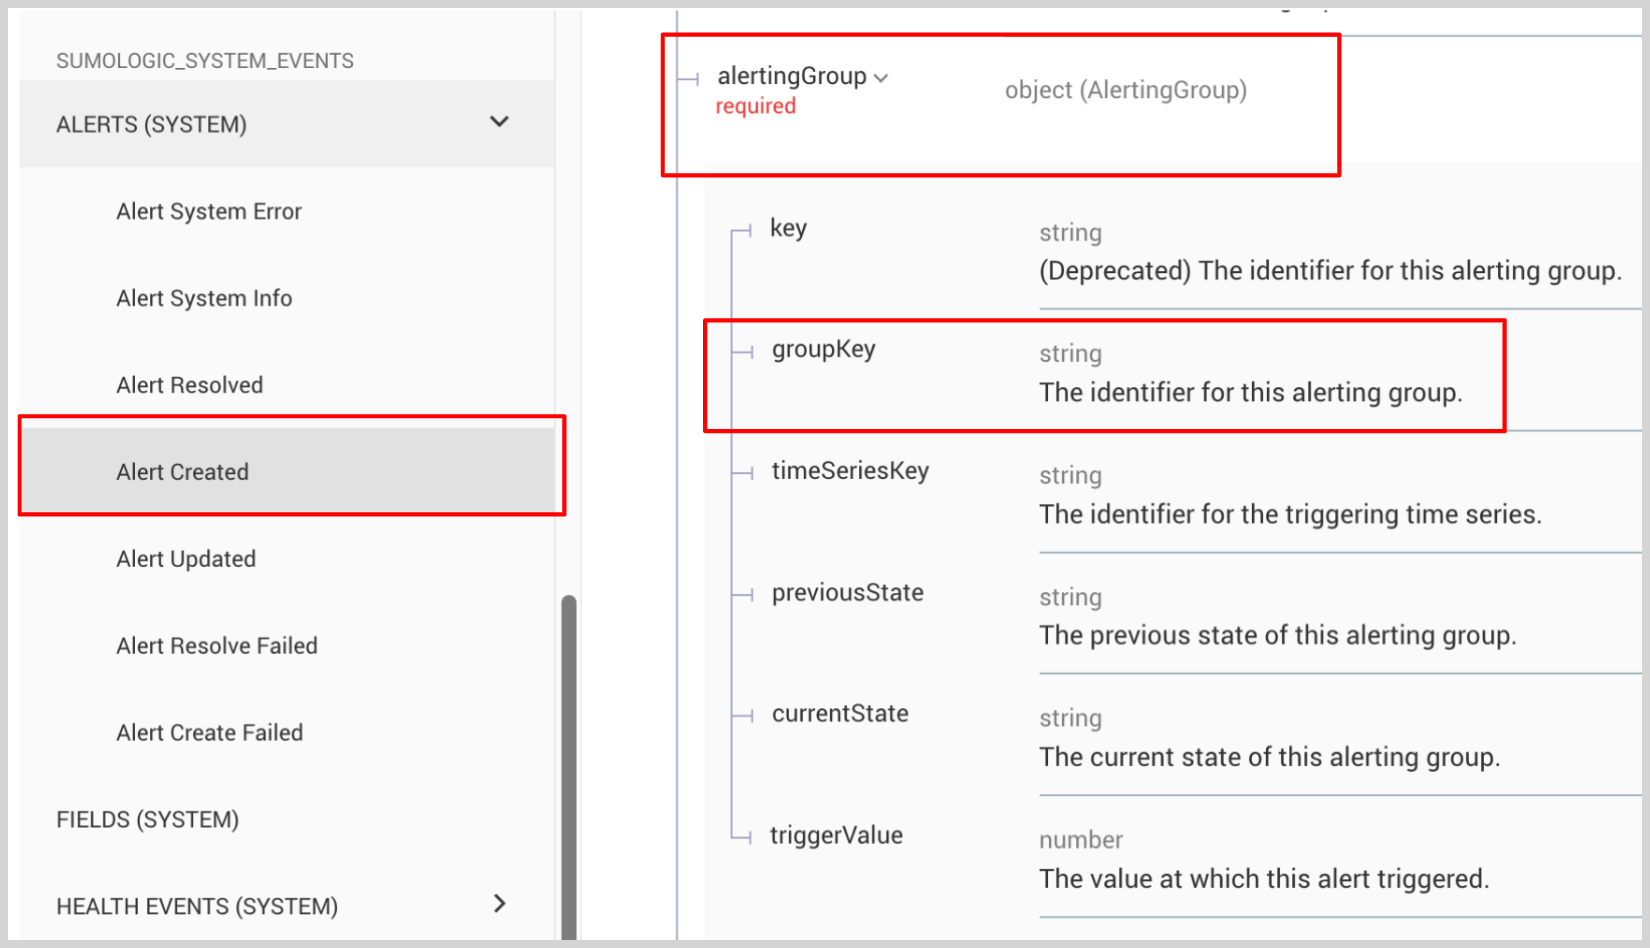
What happens if field(s) used in my alert grouping condition don’t exist or have null values?
Although we validate the fields used in alert grouping when monitor is created/updated, there are cases when these fields might not exist or have empty values.
For example, if over a period of time the structure of log messages changes and the field no longer exists in the logs. If the monitor is not edited to reflect the new log structure, non-existent fields of null values might happen. If this happens, then the monitor will still work fine, but it will behave exactly like the One alert per monitor case.
What happens if the field(s) used for alert grouping have very high cardinality, will I still get alerts for each unique field values?
We do support high cardinality for alert grouping, but there is a limit. If you have more than 1000 unique values of field(s) in a given monitor execution run, then only top 1000 unique values will generate an alert.
For example, let's say that you configured a monitor to generate one alert per customer when the count of error messages (in logs) is more than 5. Now let's assume that when the monitor ran at t0, it found that 5000 customers had an error count more than 5. In this case, it would only generate 1000 alerts for the first 1000 customers that it found with an error count more than 5.
What fields are not allowed for alert grouping?
Fields with very high cardinality such as _blockid, _raw, _messagetime, _receipttime, and _messageid are not allowed for alert grouping.
Fields from aggregate operators such as _count, _avg, and _sum are not allowed.