Alert Response
Alert response provides contextual insights about triggered alerts to minimize the time needed to investigate and resolve application failures. An alert provides curated information to on-calls to help them troubleshoot issues more quickly.
On-call engineers are tasked with firefighting production issues and recovering quickly. They have to investigate issues and try to identify the root cause and fix it, which requires deep knowledge about the production systems, troubleshooting tools, and tons of experience as on-calls.
By assembling relevant context from prior alerts and by analyzing patterns in logs and metrics underlying alerts, Sumo Logic alert response enables on-call engineers to cut down the time spent piecing together insights during an incident from various sources and accelerate recovery.
Learn how to use alert response.
Setting up alert response
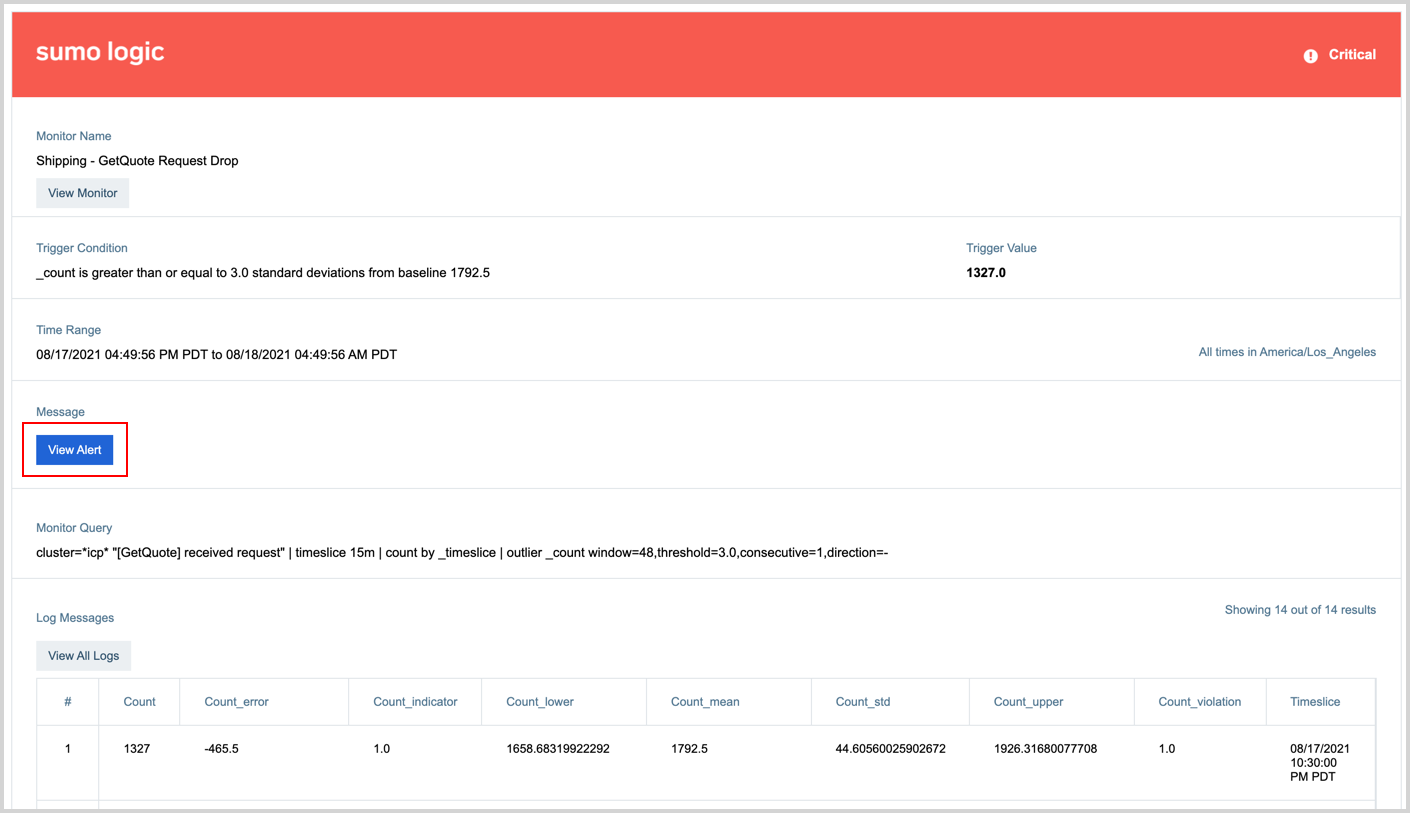
Email alerts automatically get a button labeled View Alert that opens the alert on the alert page, shown in the below image.
If you use Webhook connections offered by Sumo Logic for receiving notifications, you'll need to provide the alertResponseUrl variable in your notification payload of a monitor to receive a link that opens alert response. When your monitor is triggered, it will generate a URL and provide it in the alert notification payload, which you can use to open the alert response.
The following is an example Slack payload with the variable:
{
  "attachments":[
    {
      "pretext":"Sumo Logic Alert",
      "fields":[
        {
          "title":"Alert Page",
          "value":"{{alertResponseUrl}}"
        }
      ],
      "mrkdwn_in":[
        "text",
        "pretext"
      ],
      "color":"#29A1E6"
    }
  ]
}
Alert List
The Alert List shows all alerts triggered by your monitors within the past 30 days. By default, the list is sorted by status (showing Active on top, followed by Resolved), and then chronologically by creation time. The list displays up to 1,000 alerts.
To get to your Alert List:
- From the New UI, select Alerts > Alert List.
- From the Classic UI, click the bell icon in the top menu.
To search alerts, use the search bar and filters.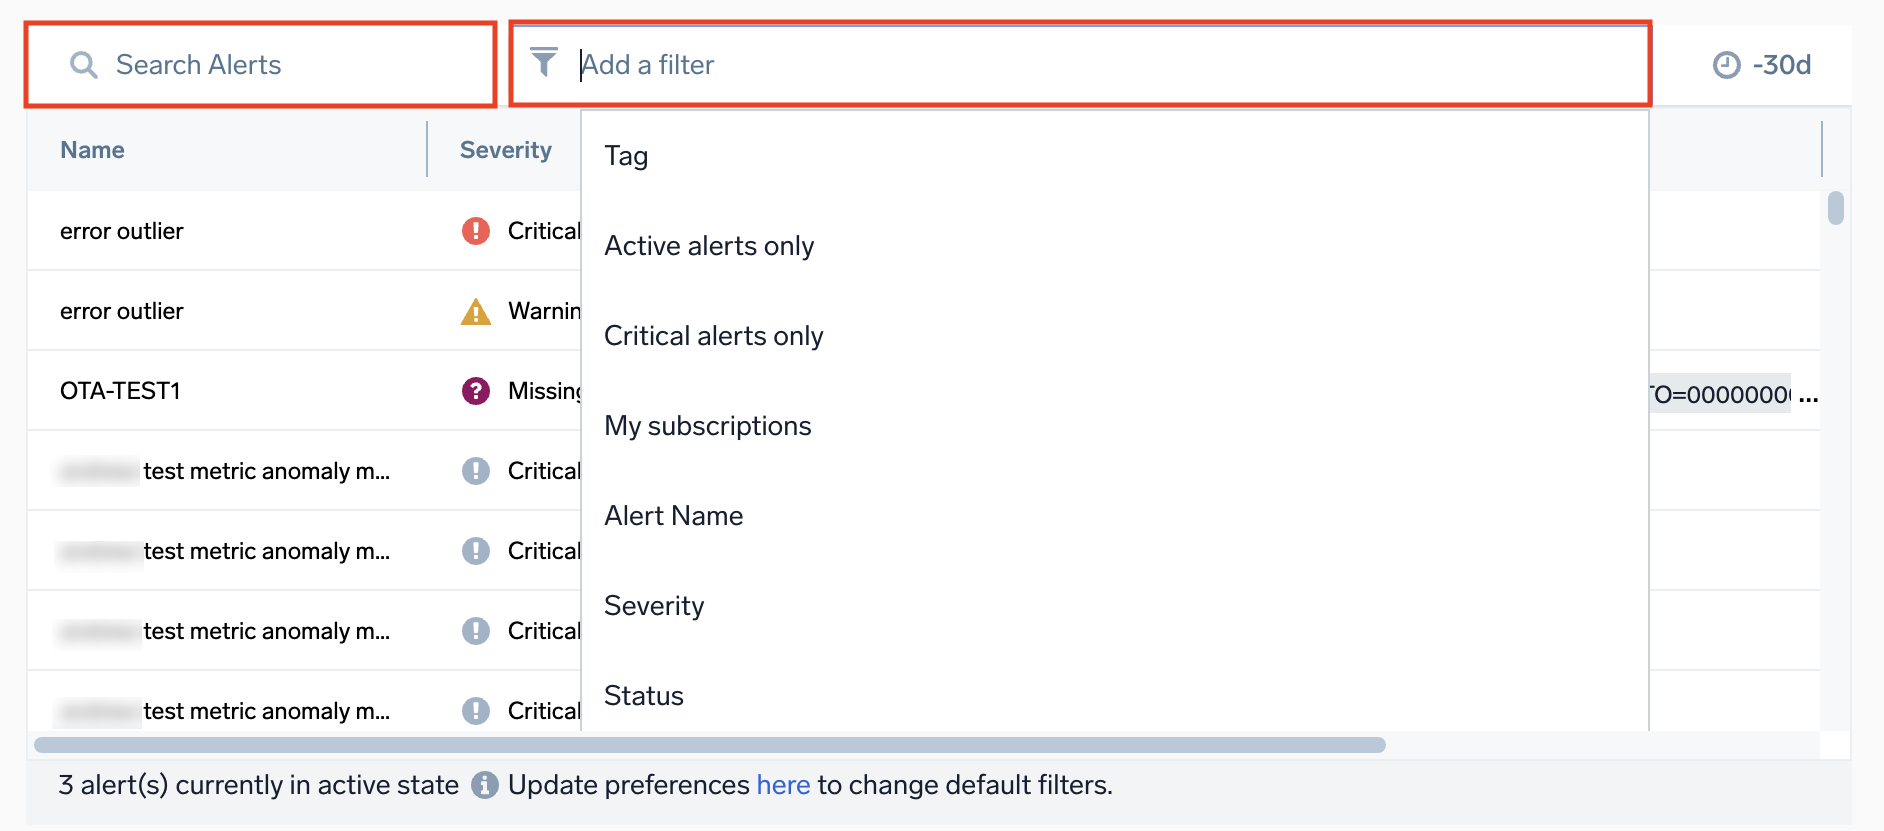
To sort by category (for example, Name, Severity, Status), click on a column header.
Tags
See Using tags in alerts.
Resolving alerts
To resolve an alert, click a row to select it, then click Resolve.
Translating thresholds
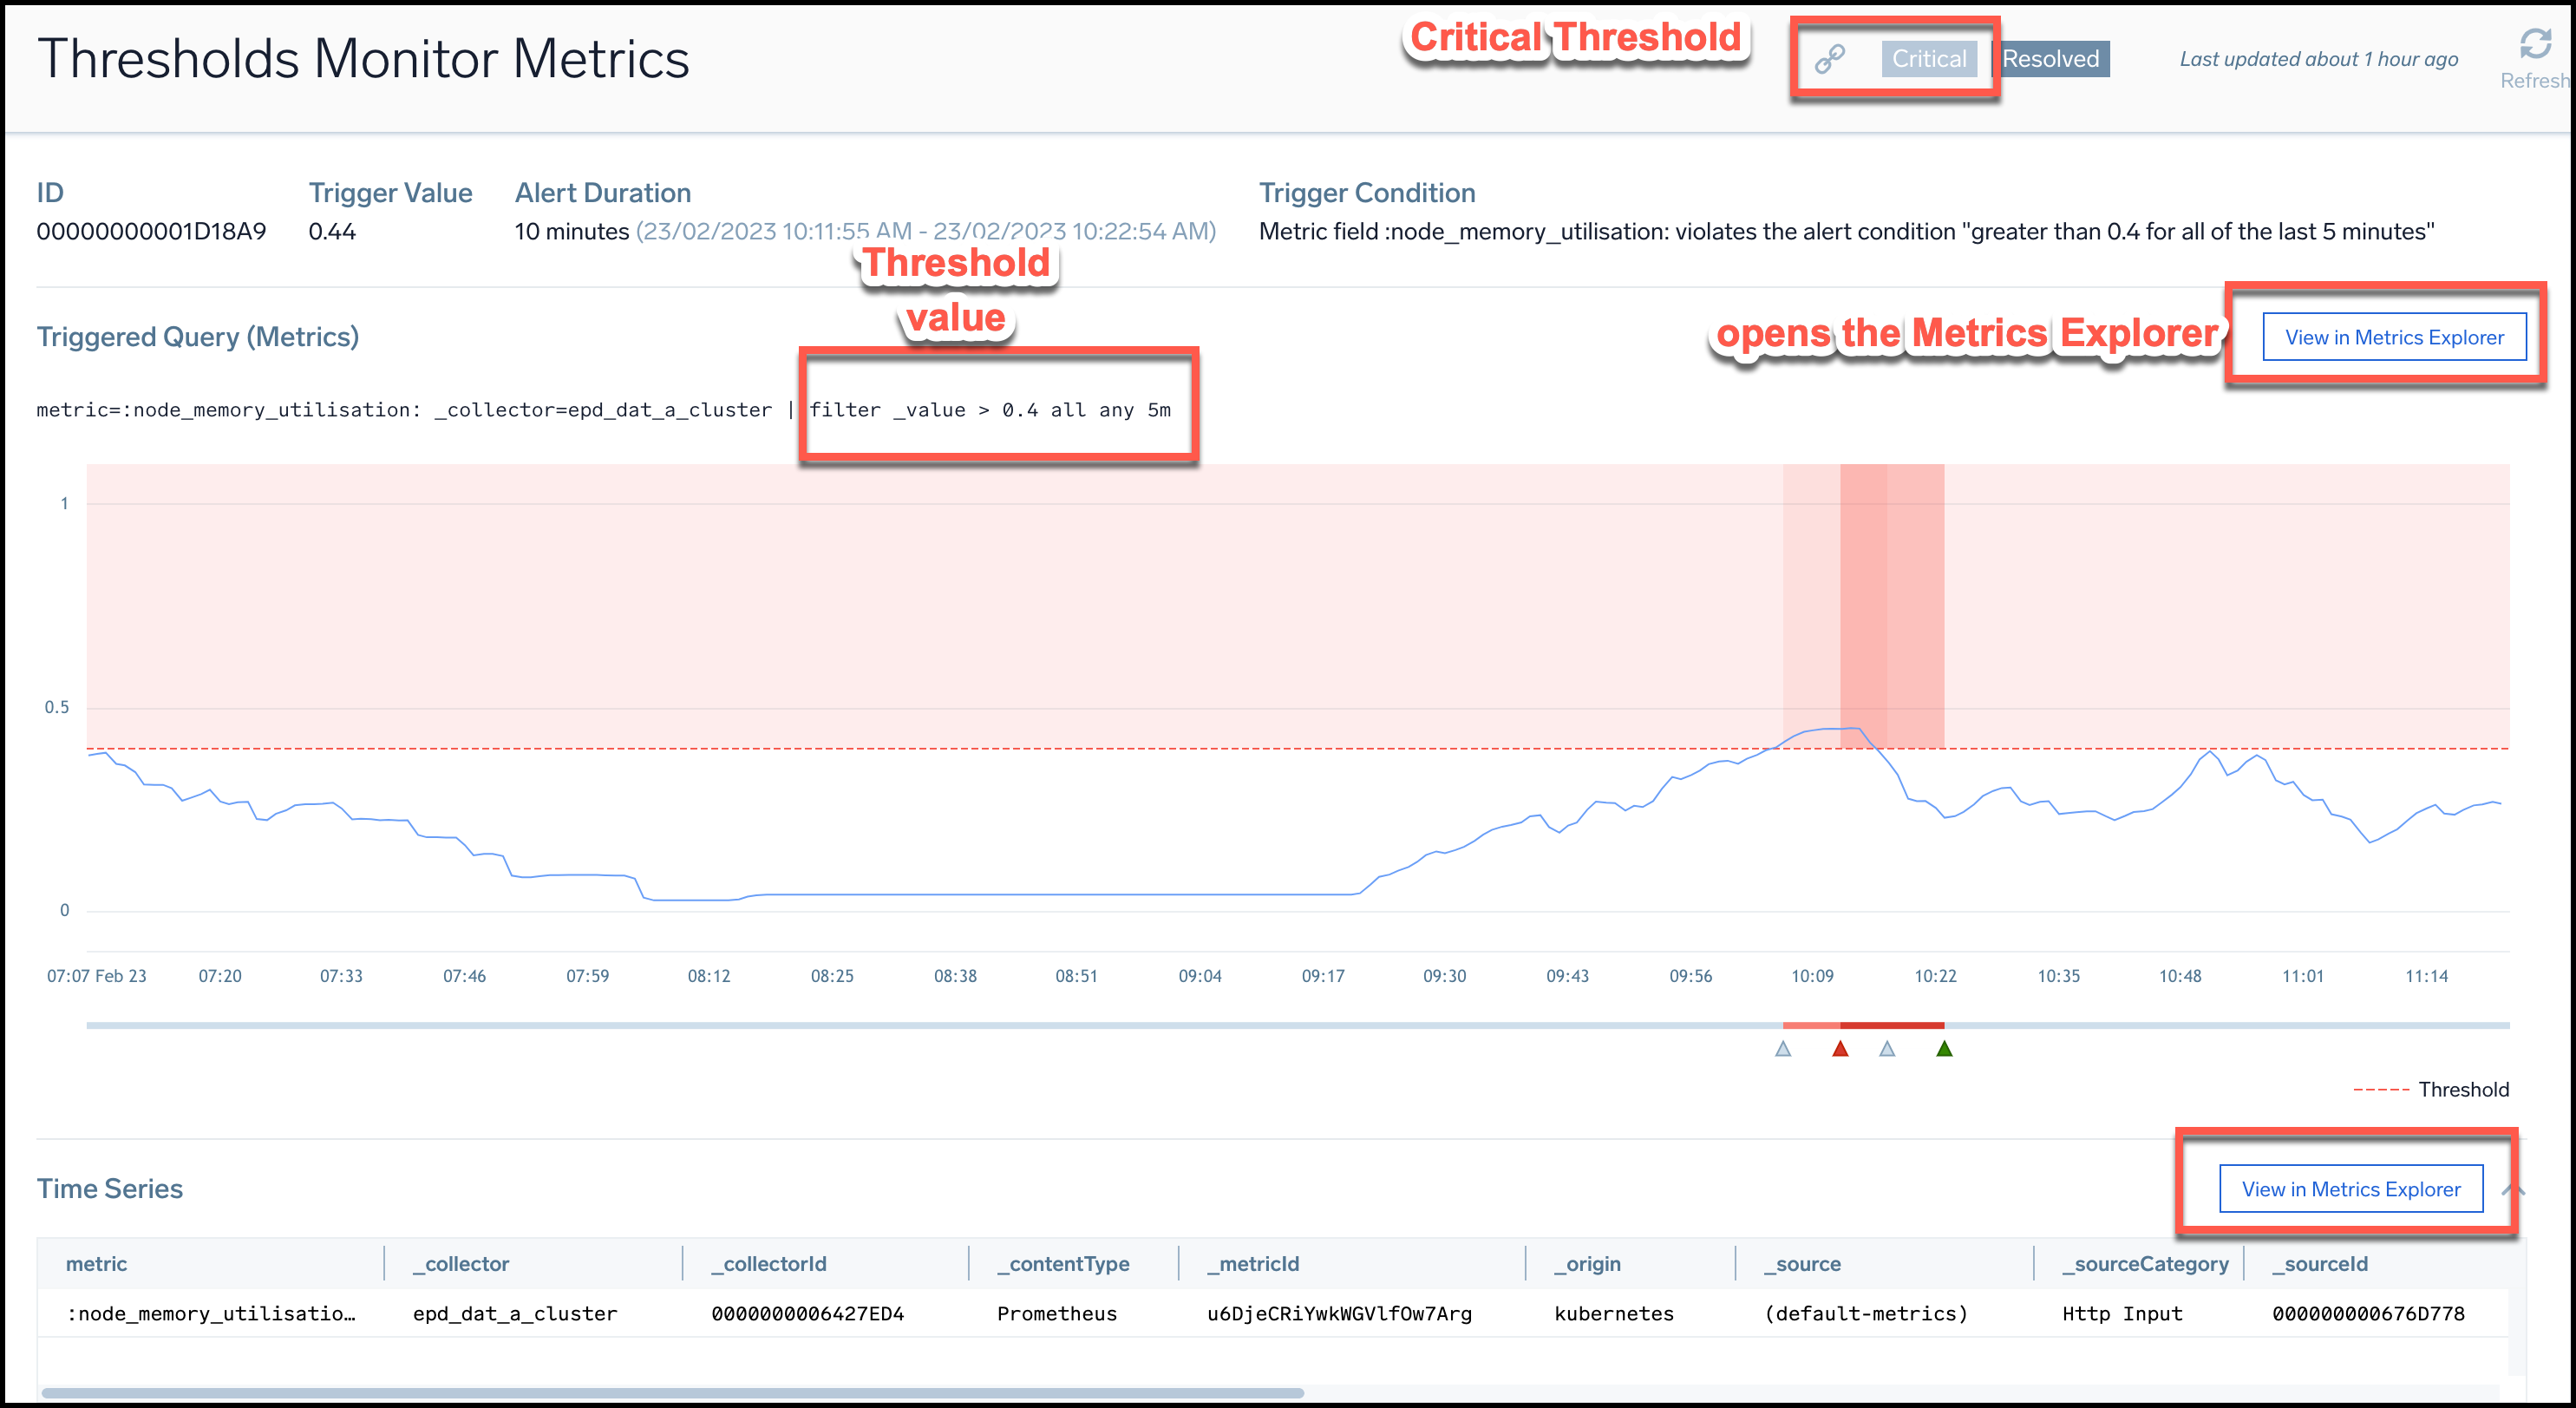
Threshold translating allows you to open the alert response page in the Metrics Explorer that helps you to easily view the threshold associated with an alert. This also helps you to understand how your monitor's thresholds are translating into metrics and compare the threshold values set in a monitor with the data displayed in the Metrics Explorer chart.
For example, when you open an alert response page in Metrics Explorer, you can see critical thresholds defined with some number. You can then see that this threshold is also applied and enabled in the Metrics Explorer view, with exactly the same number defined.
To view the alert response chart in Metrics Explorer, follow the steps below:
- Navigate to your Alert List and select the alert for which you want to view the corresponding metrics and threshold values.
- Click the View in Metrics Explorer button for that alert. You can click on either of the two buttons, and they both function the same way.
- The Metrics Explorer view will open with the graph of the metric associated with the alert.
- In the Threshold section of the Metrics Explorer, you can see the same threshold values for the monitor associated with the alert.
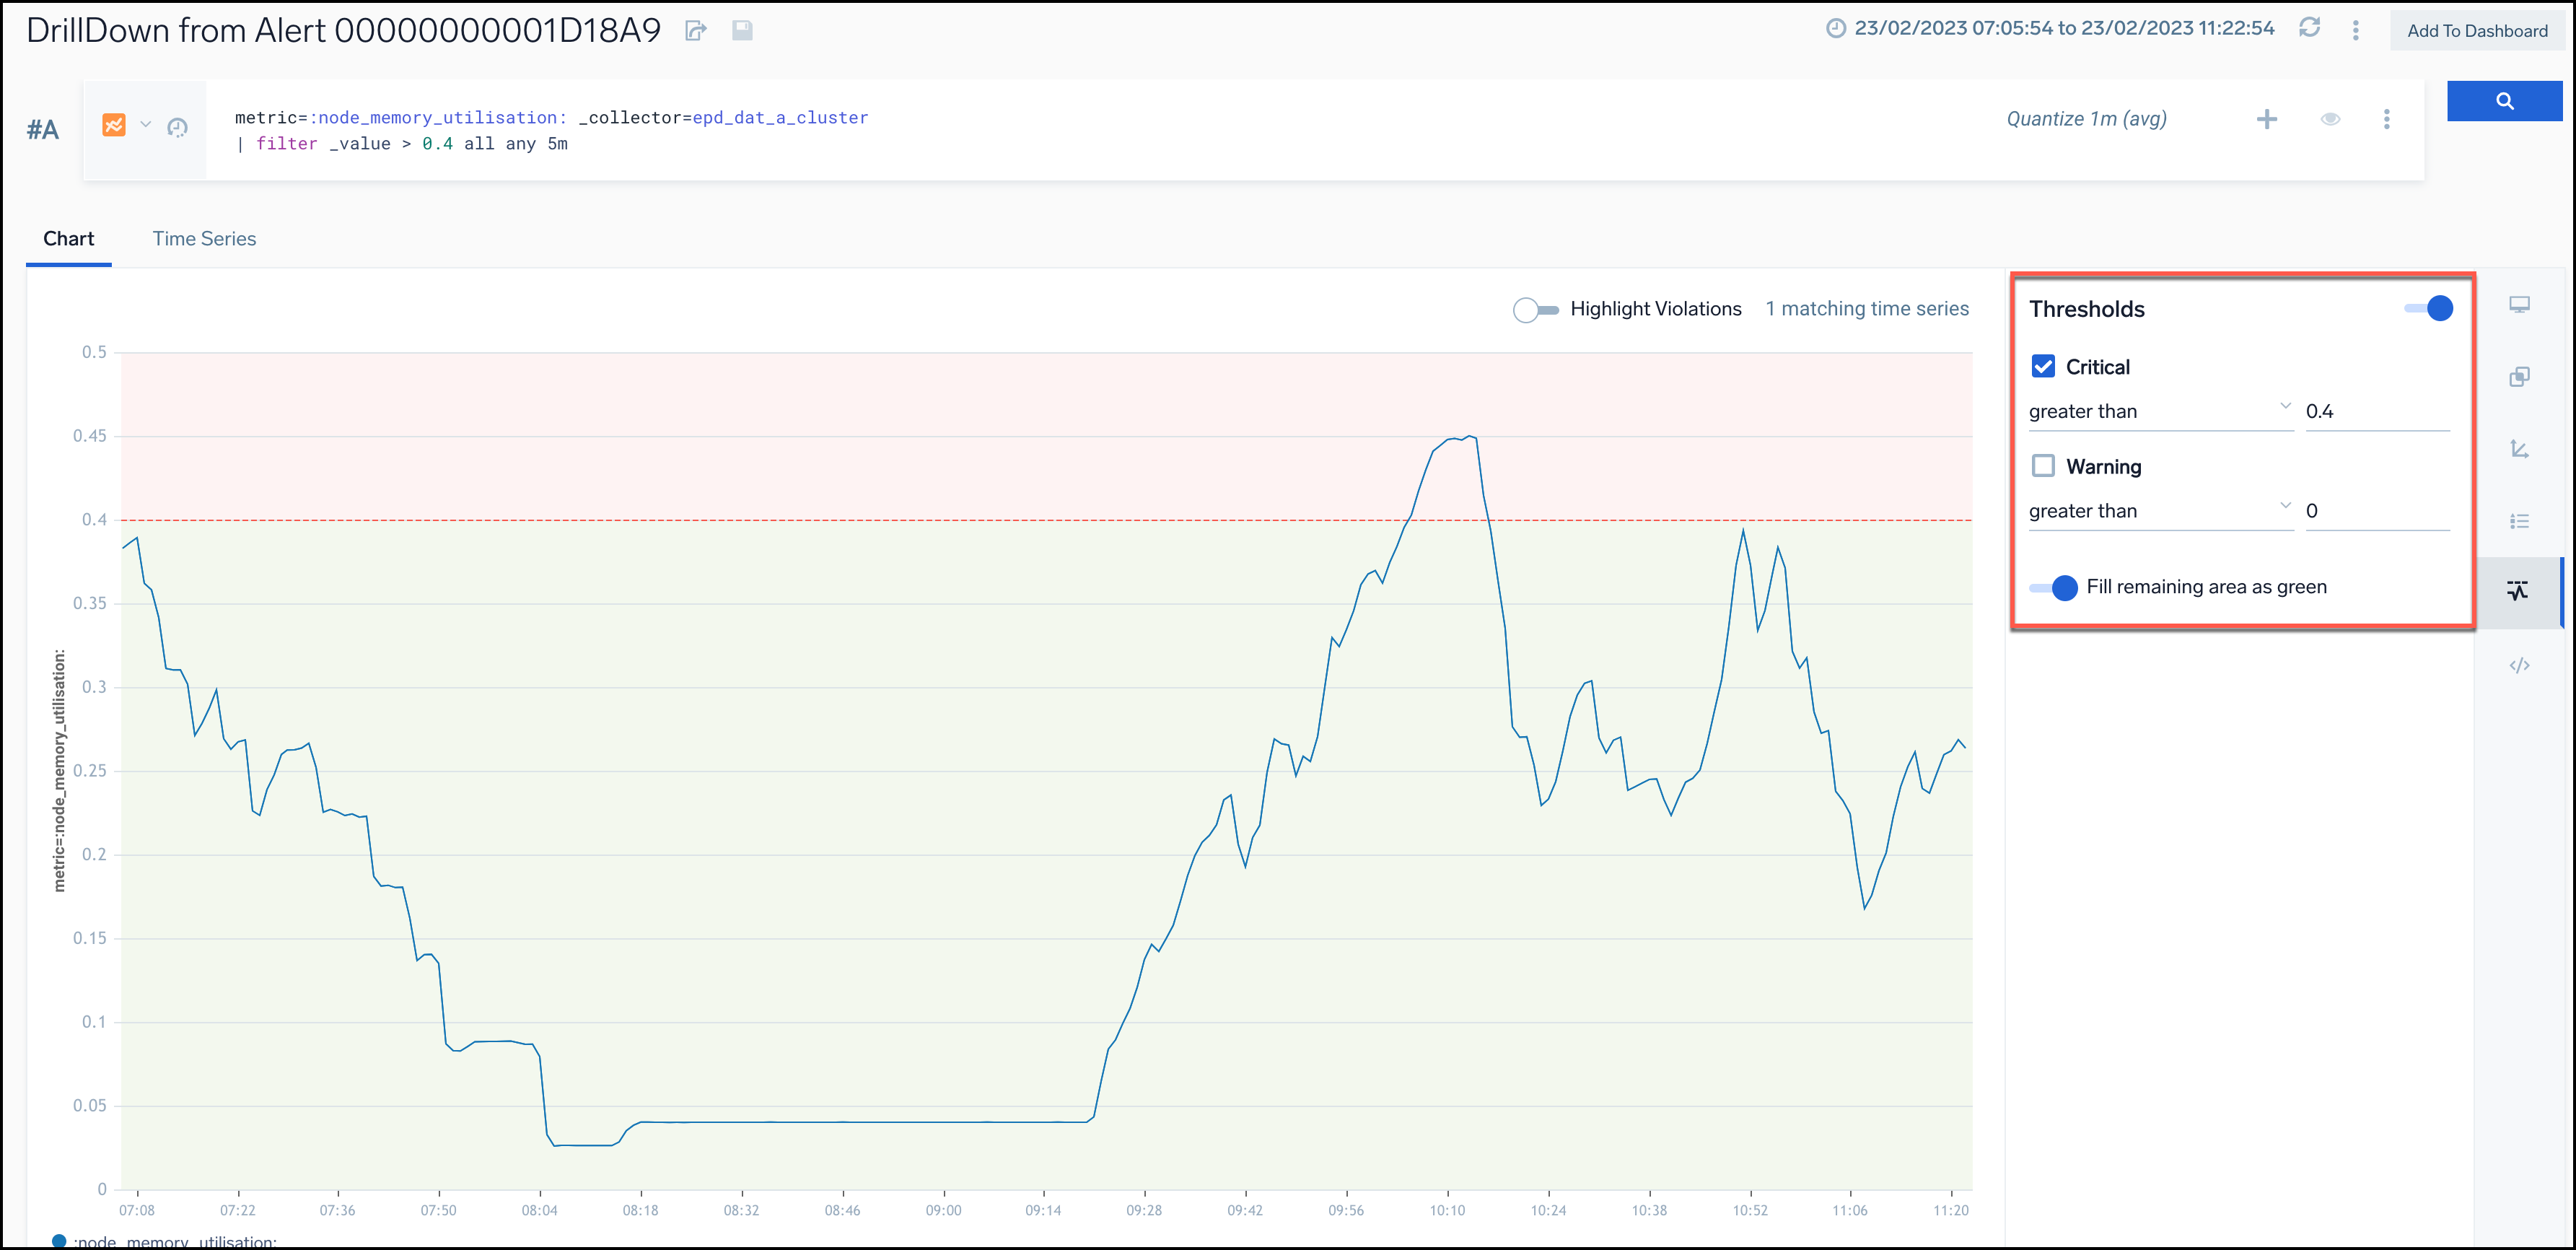
- The thresholds will be enabled and only the ones that are defined in the monitor will be displayed.
- If the alert has both critical and warning thresholds defined in the corresponding monitor, both thresholds will be displayed in the Metrics Explorer view.
- If the alert has only a critical threshold defined in the corresponding monitor, only the warning threshold will be displayed in the Metrics Explorer view.
- Use this feature to compare the threshold values set in a monitor with the data displayed in the Metrics Explorer graph and gain a better understanding of how your monitors are translating into metrics.
Note that the same threshold translating functionality supports to Create Monitors from the Metrics Explorer and Opening a Monitor in the Metrics Explorer.
Alert details
To view detailed information about an alert, go to your Alert List and click on any row. The upper section (above the context cards) provides an overview of the alert that was triggered to help get to the root cause of an issue quickly, such as:
- A chart visualizing the alerting KPI before and during the alert.
- A table displaying the raw data that triggered the alert.
- Related alerts that were firing around the same time.
- A history of previous occurrences of the alert.
- Key details such as the trigger time and the condition that caused the alert.
The following images and lists describe alert element on the page.
- A. Monitor name.
- B. Copies the link to the opened alert page.
- C. Shows the type of monitor trigger condition that triggered the alert (Critical, Warning, or Missing Data).
- D. Status of the alert (Active or Resolved).
- E. Refreshes the alert page.
- F. Opens the playbook associated with this monitor.
- Playbooks allow admins to codify tribal knowledge for an on-call so they know what exactly to do when they receive an alert:
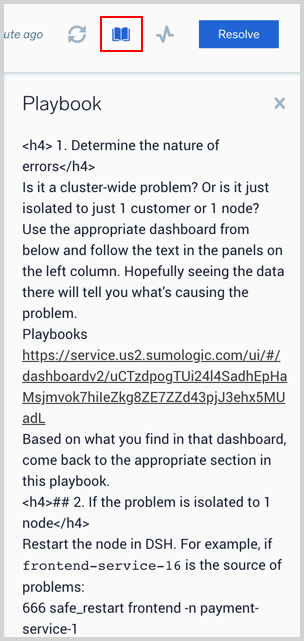
- Automated Playbooks run automatically when an alert is triggered:
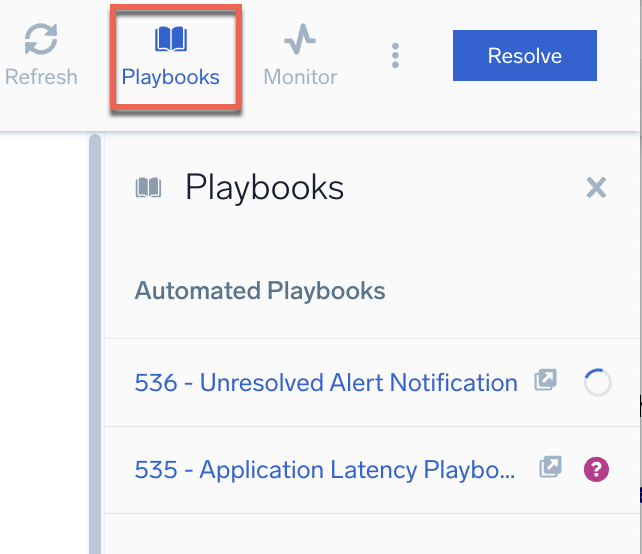
- Playbooks allow admins to codify tribal knowledge for an on-call so they know what exactly to do when they receive an alert:
- G. Opens the monitor that generated this alert.
- H. Resolves the alert. This will also resolve the monitor that generated the alert. The monitor will fire again when the alert condition is met.
note
Sumo Logic automatically resolves alerts when the monitor's recovery condition is met. This behavior cannot be modified or disabled. While you could configure a recovery condition that prevents Sumo Logic from resolving a monitor, this is not recommended, as it may suppress unrelated alerts from being triggered.
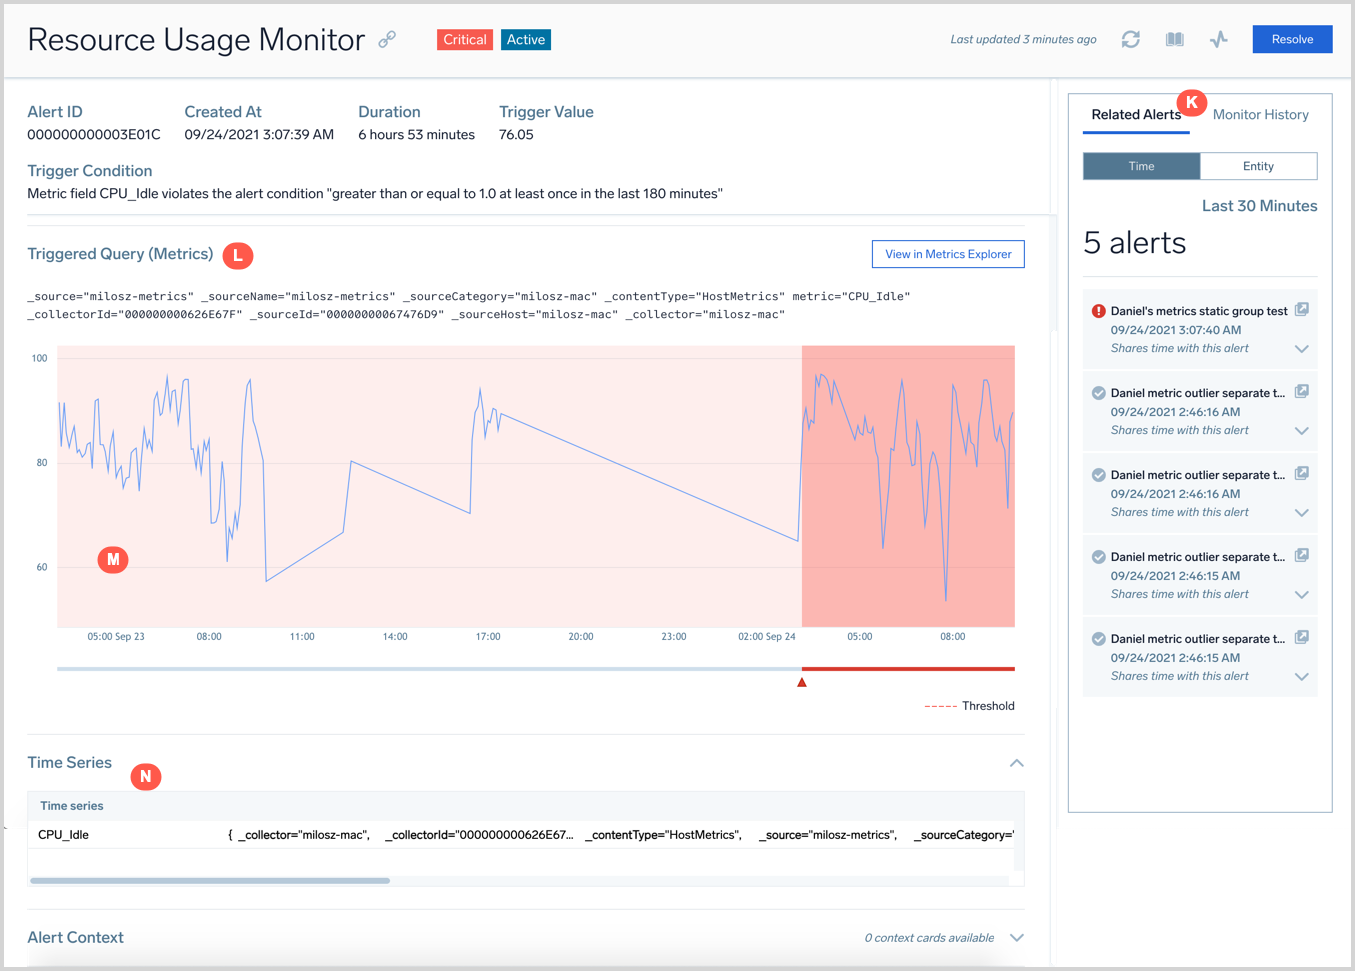
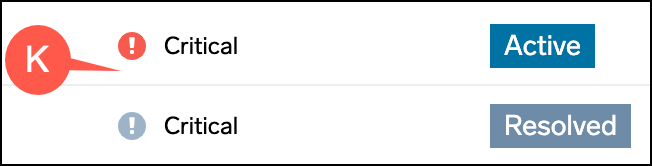
- K. The red exclamation mark indicates the alert is still active and a white exclamation in the gray circle indicates it's resolved.
- Related Alerts. A panel with related alerts and the monitor History. It shows other alerts in the system that were triggered around the same time as this alert. This information is helpful to know what issues are happening in the system and whether the current problem is an isolated issue or a more systemic one. There are two types of relations that a related alert can have.
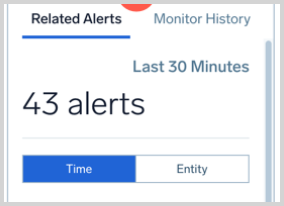
- Time. Shows all the alerts that were triggered 30 minutes before or after the given alert that doesn't have another association.
- Entity. Shows all the alerts that were triggered one hour before and after the given alert that happened on the same entity (node, pod, cluster, etc.). You can click the expand arrow
 to view the alert's trigger condition and the white arrow in the square
  to open the alert in its own alert page.
- Monitor History. Shows the past 30 days of similar alerts that were triggered by the monitor (that generated the current alert). Monitor History can be helpful to determine how frequently an alert has fired in the past and if the alert is flaky. You can then quickly correlate whether the current problem is similar to a past one by comparing the information shared for the alert.
- Related Alerts. A panel with related alerts and the monitor History. It shows other alerts in the system that were triggered around the same time as this alert. This information is helpful to know what issues are happening in the system and whether the current problem is an isolated issue or a more systemic one. There are two types of relations that a related alert can have.
- L. The query of the monitor.
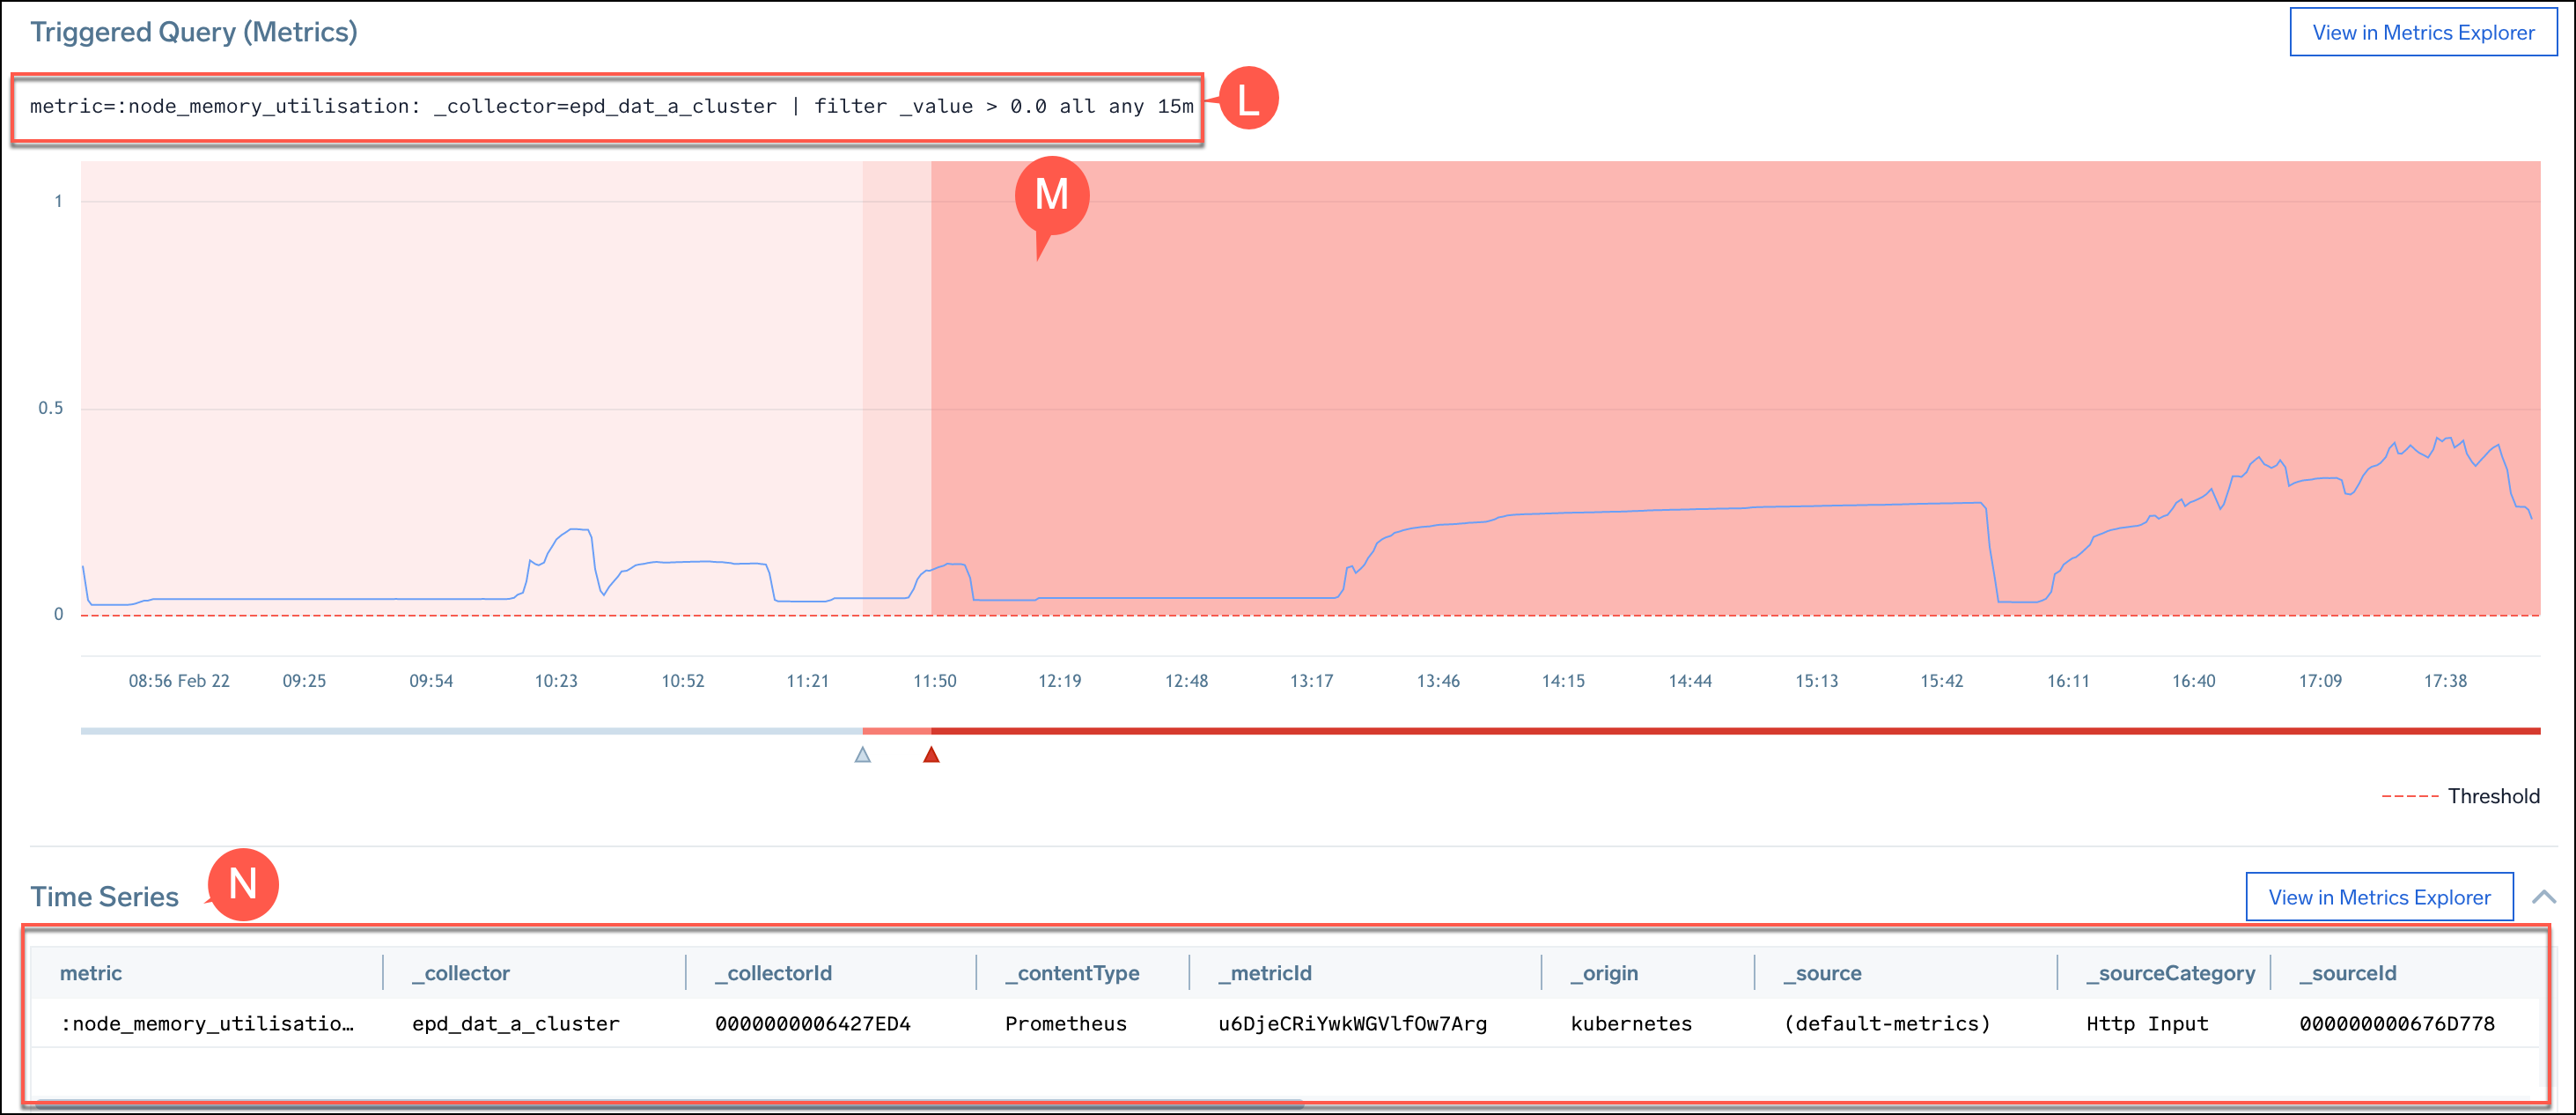
- M. A chart that visualizes the trend of the metric that was tracked as part of the alert condition of the monitor. The visualization tracks the before and during trends of the metric.
- N. A table with the raw data that triggered the alert.
- O. The Open in Copilot button lets you troubleshoot alerts directly in Copilot while preserving alert context, making investigations seamless. This enables faster root cause analysis by allowing you to jump into Copilot instantly and perform context-aware troubleshooting while maintaining alert details.

- The alert visualization, labeled M, is only shown for alerts less than 30 days old.
- Related Alerts and Monitor History show the top 250 alerts.
Alert Context cards
The lower section, Alert Context cards, displays system-curated information to help understand potential underlying symptoms that might be causing the issue. It provides additional insights automatically discovered by the system through data analysis. Using artificial intelligence and machine learning, the system tracks your logs and metrics, identifies patterns that may explain the issue, and presents them as context cards.
Depending on the type of data an alert is based on (metrics or logs) and the detection method (static or outlier), you'll see different context cards. You will see a progress spinner labeled Analyzing alert context at the bottom of the window when cards are still being loaded. It may take a minute for some cards to load.
Dimensional Explanations
Dimensional Explanations help you identify the most common dimensions found in the triggered query results, allowing for deeper insight into alert patterns.
When an alert is triggered, Sumo Logic analyzes the query results and highlights the most frequently occurring dimensions. These dimensions help you quickly determine patterns or root causes by comparing alert results to other data.
- Summary Description. Displays the most common dimensions found in the alert results compared to all other results.
- Dimensional breakdown. Shows dimensions that appear frequently in alert results, such as
eventname,resourceidentity.id,severitylevel,details.trackerid, andeventid. - Comparison view. A percentage bar visually represents how often these dimensions appear in alert results compared to other results.
- Drill-down analysis. Click on a dimension to explore the associated log details.
- Quick navigation. Use the View in Log Search button to open the results in Log Search for further investigation.
In the example below: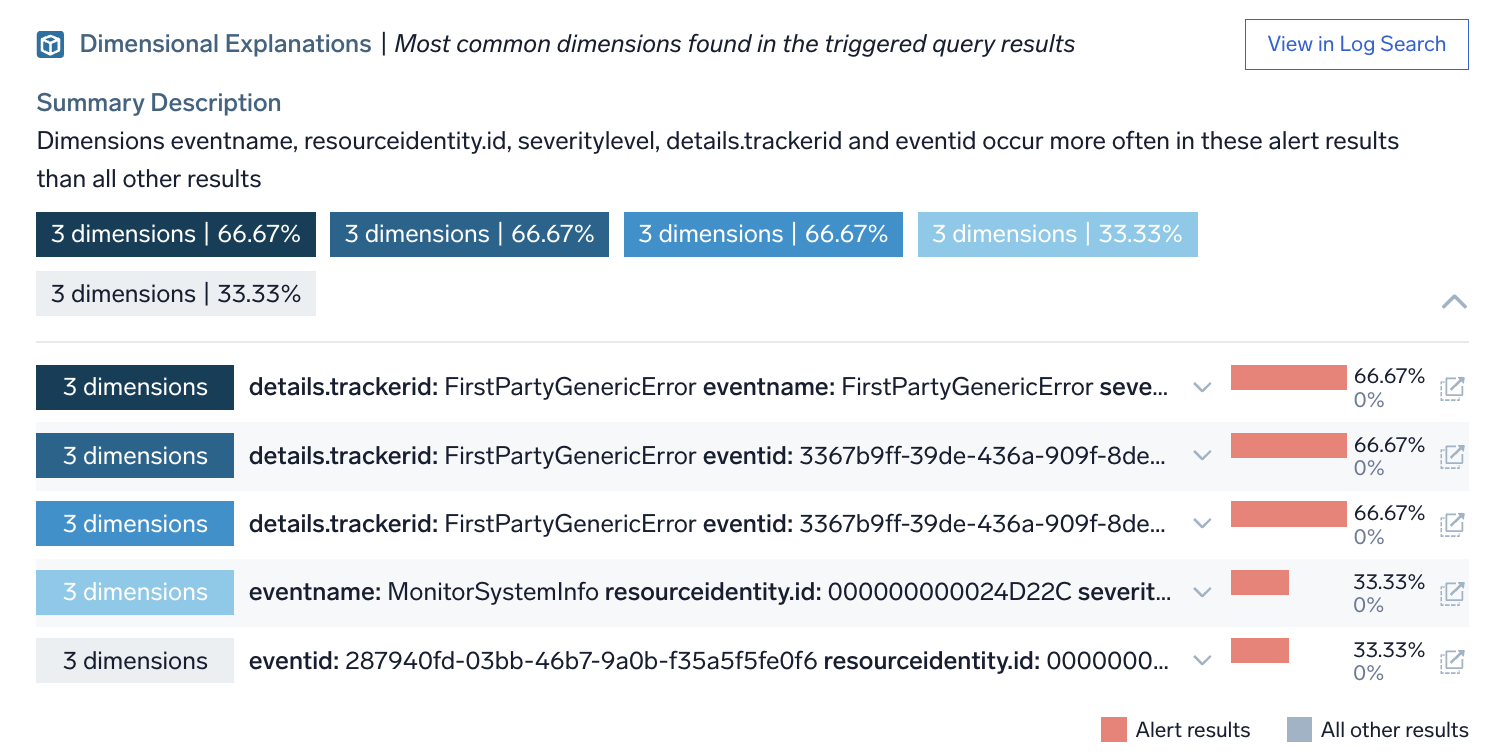
- The most common dimensions found in alert results include
details.trackerid,eventname, andseveritylevel, each appearing in 66.67% of alert results. - Other dimensions like
resourceidentity.idandeventidappear in 33.33% of alert results. - The color-coded bars indicate the proportion of alert results (red) versus all other results (blue).
By analyzing these dimensions, you can quickly identify recurring issues and improve troubleshooting efficiency.
Log Fluctuations
The Log Fluctuations context card, available for logs monitors, detects different signatures in your log messages using LogReduce such as errors, exceptions, timeouts, and successes. It compares log signatures trends with a normal baseline period and surfaces noteworthy changes in signatures.
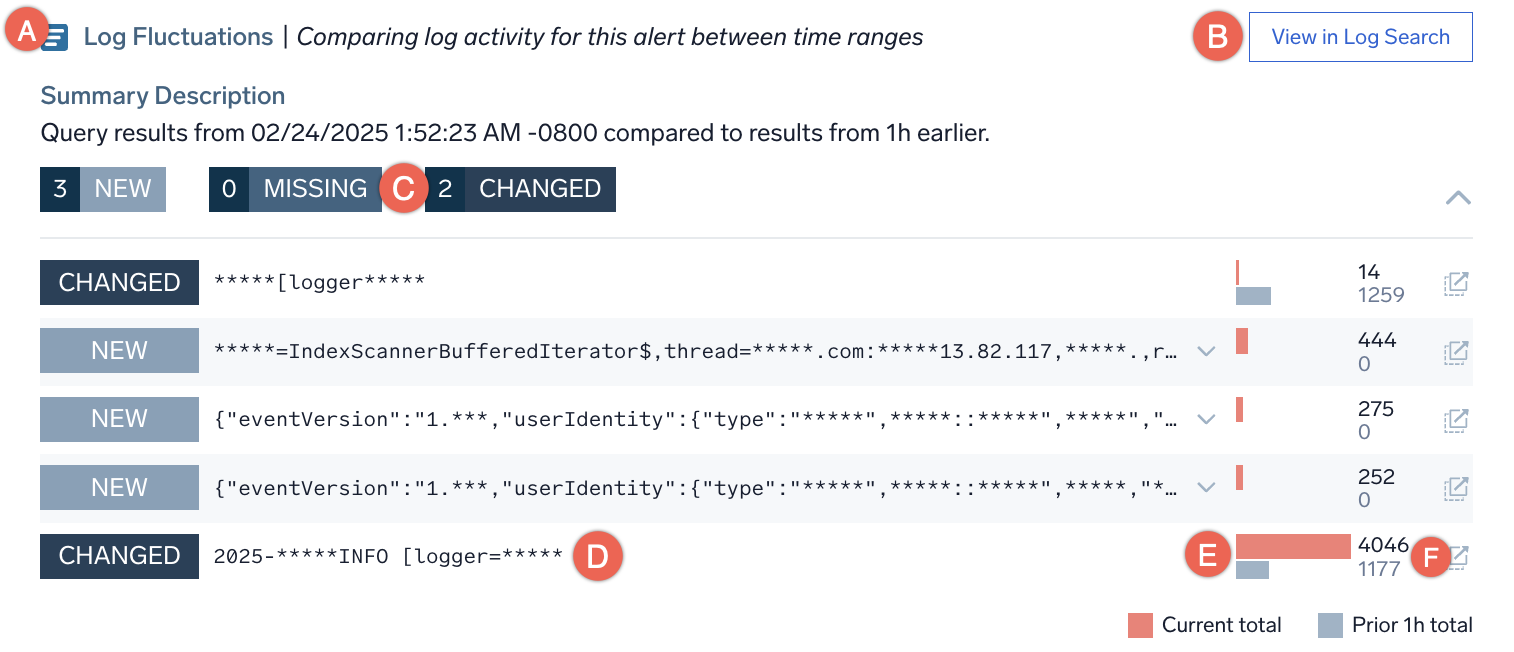
- A. The name and description of the card.
- B. Opens the log query that populated the card, in a Log Search.
- C. A summary of the discovered NEW, MISSING, and CHANGED signatures, and how many log messages belong to each type.
- NEW. Log signatures that were only seen after the alert was triggered but not one hour prior to the alert start time.
- MISSING. Log signatures that are not present after the alert was created but were present one hour prior to the alert start time, such as Transaction Succeeded or Success.
- CHANGED. Log signatures whose counts have changed after the alert when compared to one hour prior to the alert start time.
- D. The details about the identified log signature.
- E. A histogram showing how many log messages mapped to the given signature after the alert (red bar) and before (gray bar) the alert.
- F. Opens a Log Search pre-filtered to the log messages that mapped to the given signature.
Anomalies
This card detects time series anomalies for entities related to the alert.
Anomalies are grouped into golden signals. Anomalies are also presented on a timeline; the length of the anomaly represents its duration.
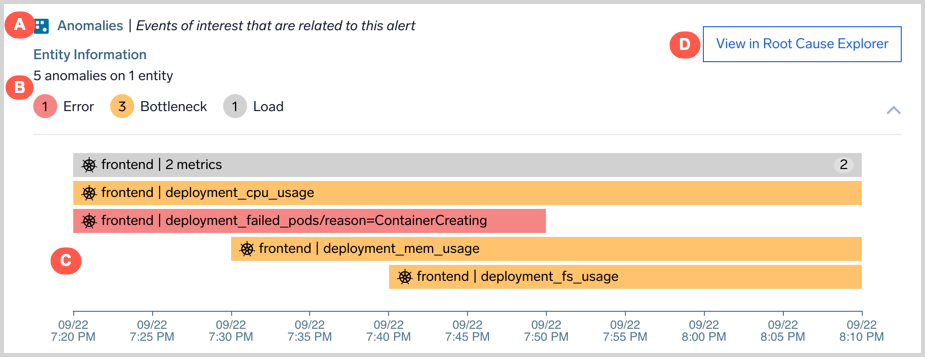
- A. Name and description of the context card.
- B. Count of anomalies belonging to each golden signal type.
- C. A timeline view of anomalies with their start time and duration, the domain (e.g. AWS, Kubernetes), and the entity on which it was detected. Anomalies may be grouped based on connections between entities and similarity of metrics. For example, anomalies on EC2 instances that are members of an AutoScaling group may be grouped together. The count shown in each anomaly refers to the number of grouped anomalies.
- D. A link to view the anomalies.
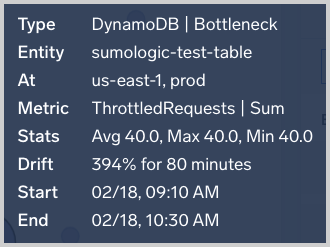
Only anomalies with a start time around 30 minutes before or after the alert was created show up in the card.
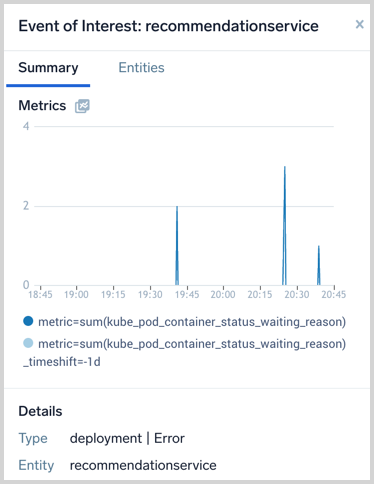
Hover over an EOI to view key information about the event.
Click on the EOI to open the Summary View and Entity Inspector.
Benchmark
Benchmarks refer to baselines computed from anonymized and aggregated telemetry data from Sumo Logic customers in domains such as AWS. If the telemetry values for your entity during an alert period are unusual compared to benchmarks, you may have an unusual configuration change or other backend issues.
For example, the card below shows that ServiceUnavailable error is happening 32 times more often in your AWS account compared with other Sumo Logic customer’s accounts. This AWS error pertains to AWS API calls that are failing at a higher rate than what is expected based on cross-customer baselines. This particular error implies an AWS incident affecting the particular AWS resource type and API.
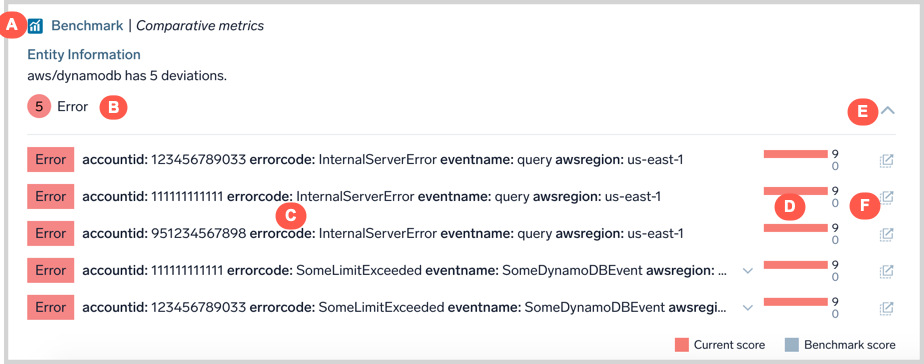
- A. Name and description of the context card.
- B. Count of unusual Benchmarks by golden signal type.
- C. Dimensional detail of the unusual telemetry value.
- D. Comparison of your telemetry value (red bar) against benchmarks computed from other customers (gray bar).
- E. Expand/collapse details panel.
- F. Opens a Log Search filtered to the Log messages that match the dimensional details of the telemetry value
Subscribe to monitors
From your Alerts List
There are three places from your Alerts List to subscribe to a monitor:
- Right-click on a row item > click Subscribe.
- Hover your mouse over a row, click the three-dot kebab menu > select Subscribe.
- Single-click on a row item > on the opened alert page, click the three-dot kebab menu > Subscribe to Monitor.
From your Monitors list
There are three places from your Monitors list to subscribe to a monitor:
- Right-click on a row item > click Subscribe.
- Hover your mouse over a row > click the three-dot kebab menu > click Subscribe.
- Single-click on a row item > in the side panel (Monitor Details), click More Actions > Subscribe.
From a folder
If you subscribe from a monitor folder, all nested monitors and folders within that folder become automatically subscribed.
For example, if you create a subscription on “Monitor A”, and then move it to subscribed “Folder B”, “Monitor A” will have two subscriptions because it’s directly subscribed and inherits subscription from its parent folder ("Folder B").
Click to see examples
Example 1
📁 Folder A ("No")
├── Monitor B ("No")
└── Monitor C ("No")
📁 Folder A ("Yes")
├──Monitor B ("Yes (inherited from folder)")
└──Monitor C ("Yes (inherited from folder)")
Example 2
📁 Folder A ("No")
├── Monitor B ("No")
├── Monitor C ("No")
└── 📁 Folder D ("No")
    └── Monitor E ("No")
📁 Folder A ("No")
├── Monitor B ("No")
├── Monitor C ("No")
└── 📁 Folder D ("Yes")
    └── Monitor E ("Yes (inherited from folder)")
Example 3
📁 Folder A ("No")
├── Monitor B ("No")
├── Monitor C ("No")
└──  📁 Folder D ("No")
    └── Monitor E ("Yes")
📁 Folder A ("No")
├── Monitor B ("No")
├── Monitor C ("No")
└── 📁 Folder D ("Yes")
    └── Monitor E ("Yes")
📁 Folder A ("No")
├── Monitor B ("No")
├── Monitor C ("No")
└── 📁 Folder D ("Yes")
    └── Monitor E ("Yes (inherited from folder)"
To cancel an inherited subscription, you'll need to remove the subscription from a parent folder or move the monitor or folder into another location outside the folder with direct subscription.
Notification preferences
Alert notification preferences give you granular control over specific monitor activity you want to follow. For more information, see Alert preferences.