Monitors Settings
The Monitors page allows you to view, create, manage, and organize your monitors.
Accessing monitors
- In the Classic UI, select Manage Data > Monitoring > Monitors.
- In the New UI, select Alerts > Monitors.
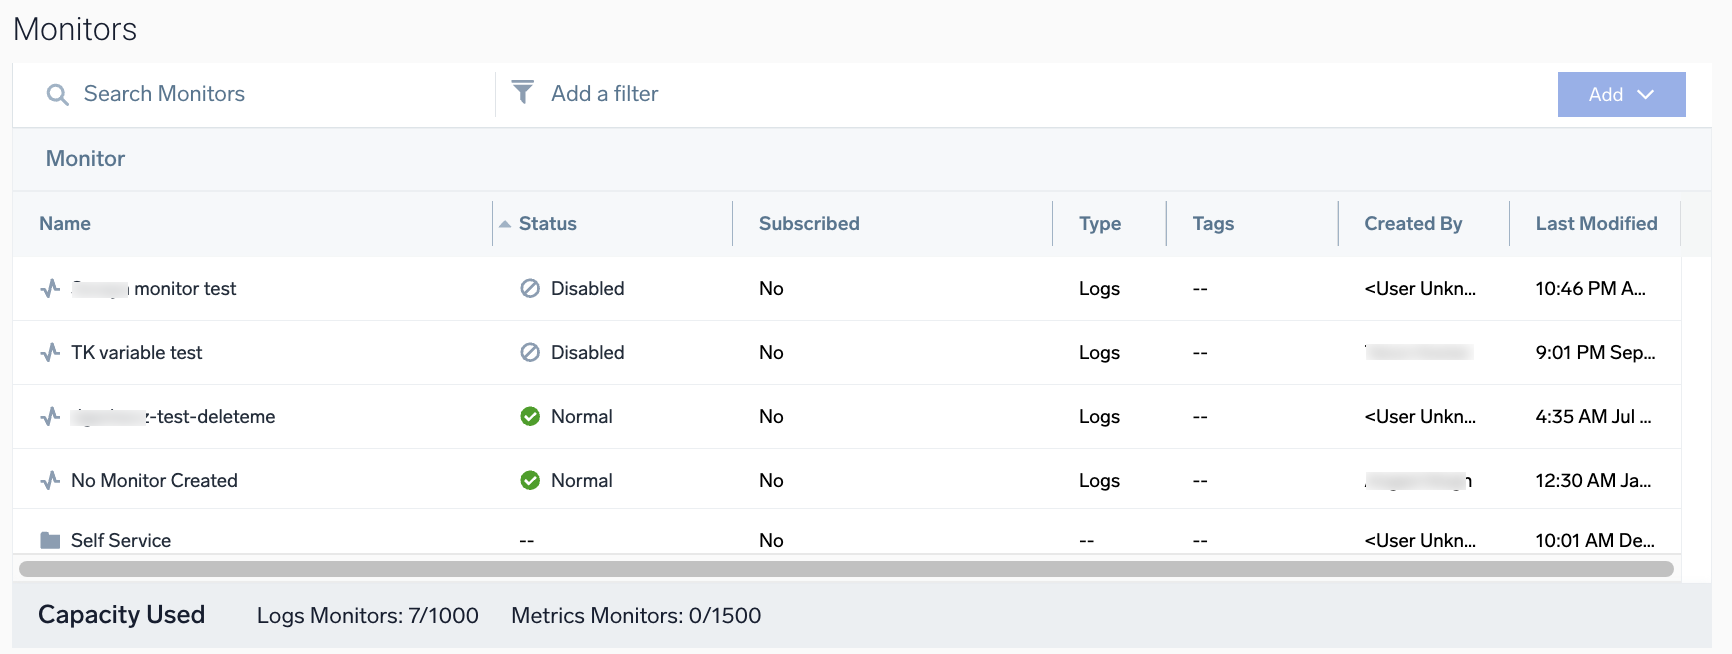
Here, you'll find columns displaying the following attributes:
- Name. Name of the monitor.
- Status. Shows the status of the monitor - Normal, Critical, Warning, or Missing Data. A monitor can be in multiple states at the same time. Normal indicates none of the trigger conditions are met and your data is actively being monitored.
- For Critical and Missing Data monitors, hover your cursor over its Status and click the open icon to view all alerts triggered by that monitor.

- For Critical and Missing Data monitors, hover your cursor over its Status and click the open icon to view all alerts triggered by that monitor.
- Subscribed. Indicates whether or not you're subscribed to receive alerts from a monitor.
- Type. Indicates whether the monitor type is either logs or metrics.
- Tags. Lists the tag(s) applied to a monitor.
- Created By. The user who created the monitor.
- Last Modified. The time the monitor was last updated, shown in the time zone designated in your user preferences.
- Capacity Used. The number of logs and metrics monitors in your account.
Search and filter monitors
At the top of the page, you can:
- Search Monitors. If you know a monitor's name or partial name, enter it in the search field to find it quickly.
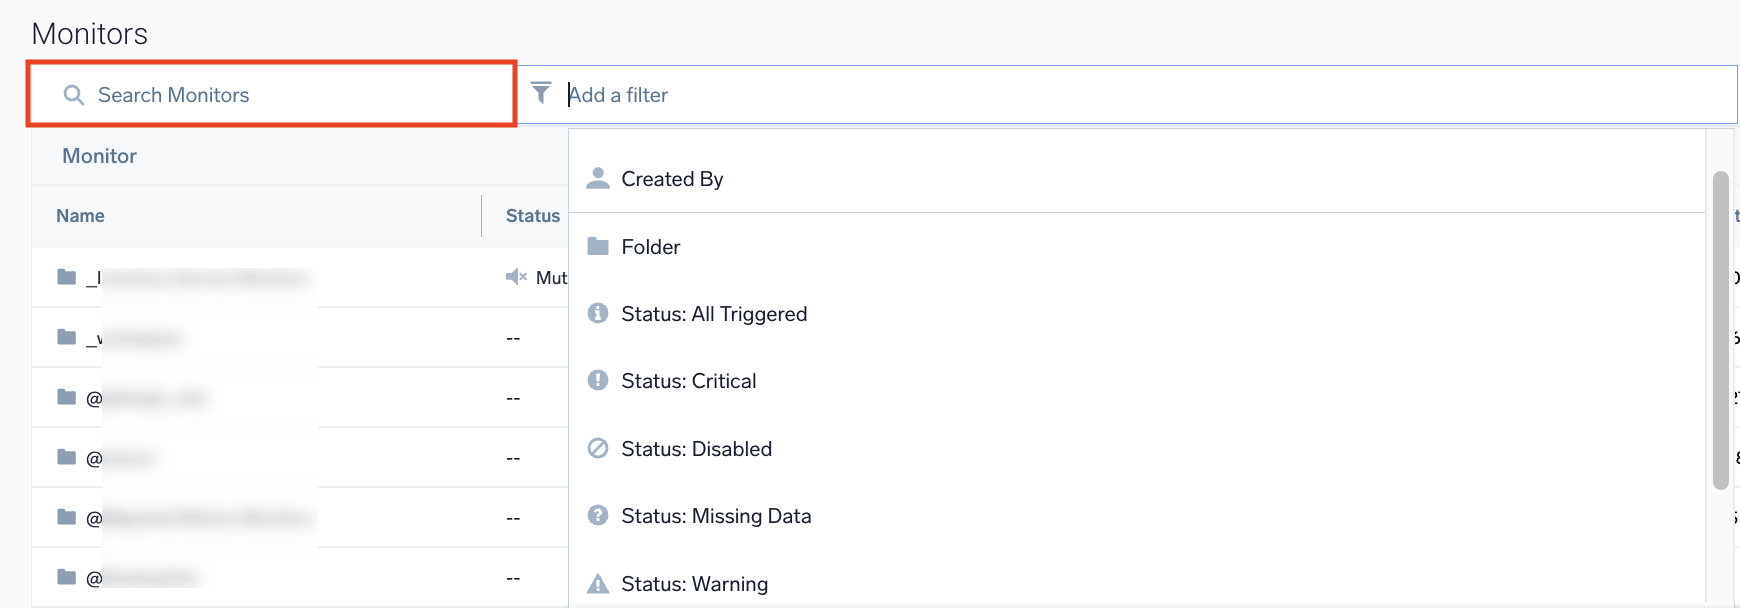
- Add a filter. Click inside this field to open a list of filters and refine your search by monitor attributes.
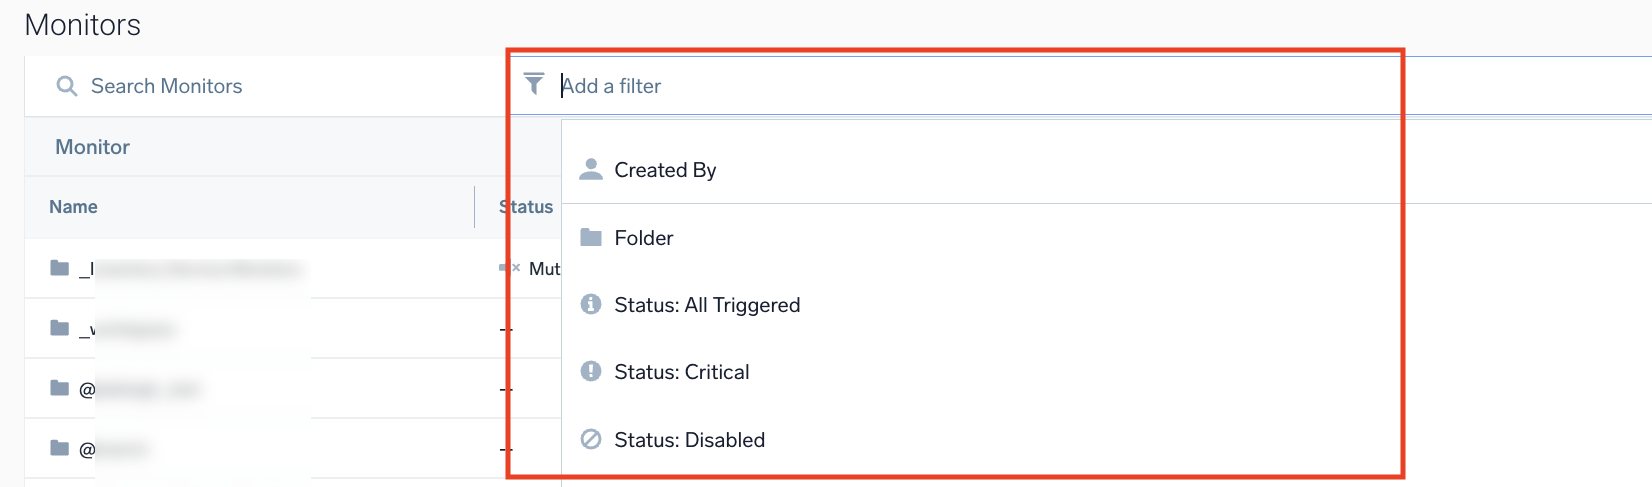
tipTo view all currently triggered monitors, click Status: All Triggered.
- Add > New Folder. Creates a folder to organize your monitors.
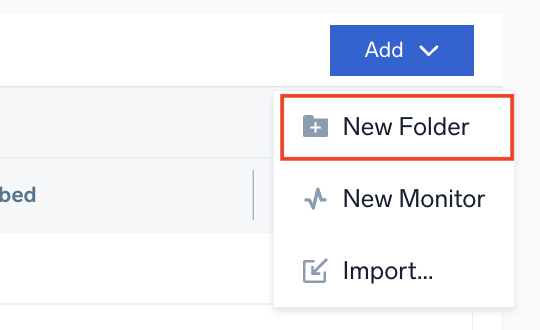
- Add > New Monitor. Creates a new monitor.
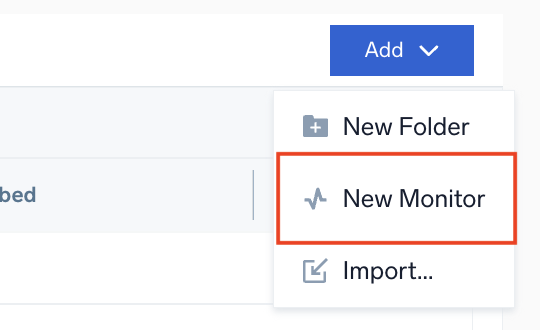
- Add > Import. Imports monitors using the exported JSON copied from the More Actions menu of the original monitor. This function allows you to transfer data immediately.
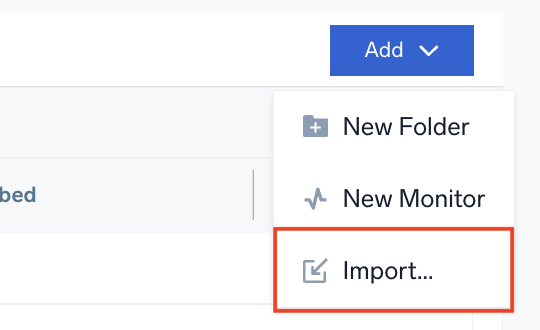
infoThe Sumo Logic JSON format may change without notice, and future compatibility with imported JSON is not guaranteed.
Monitor Details
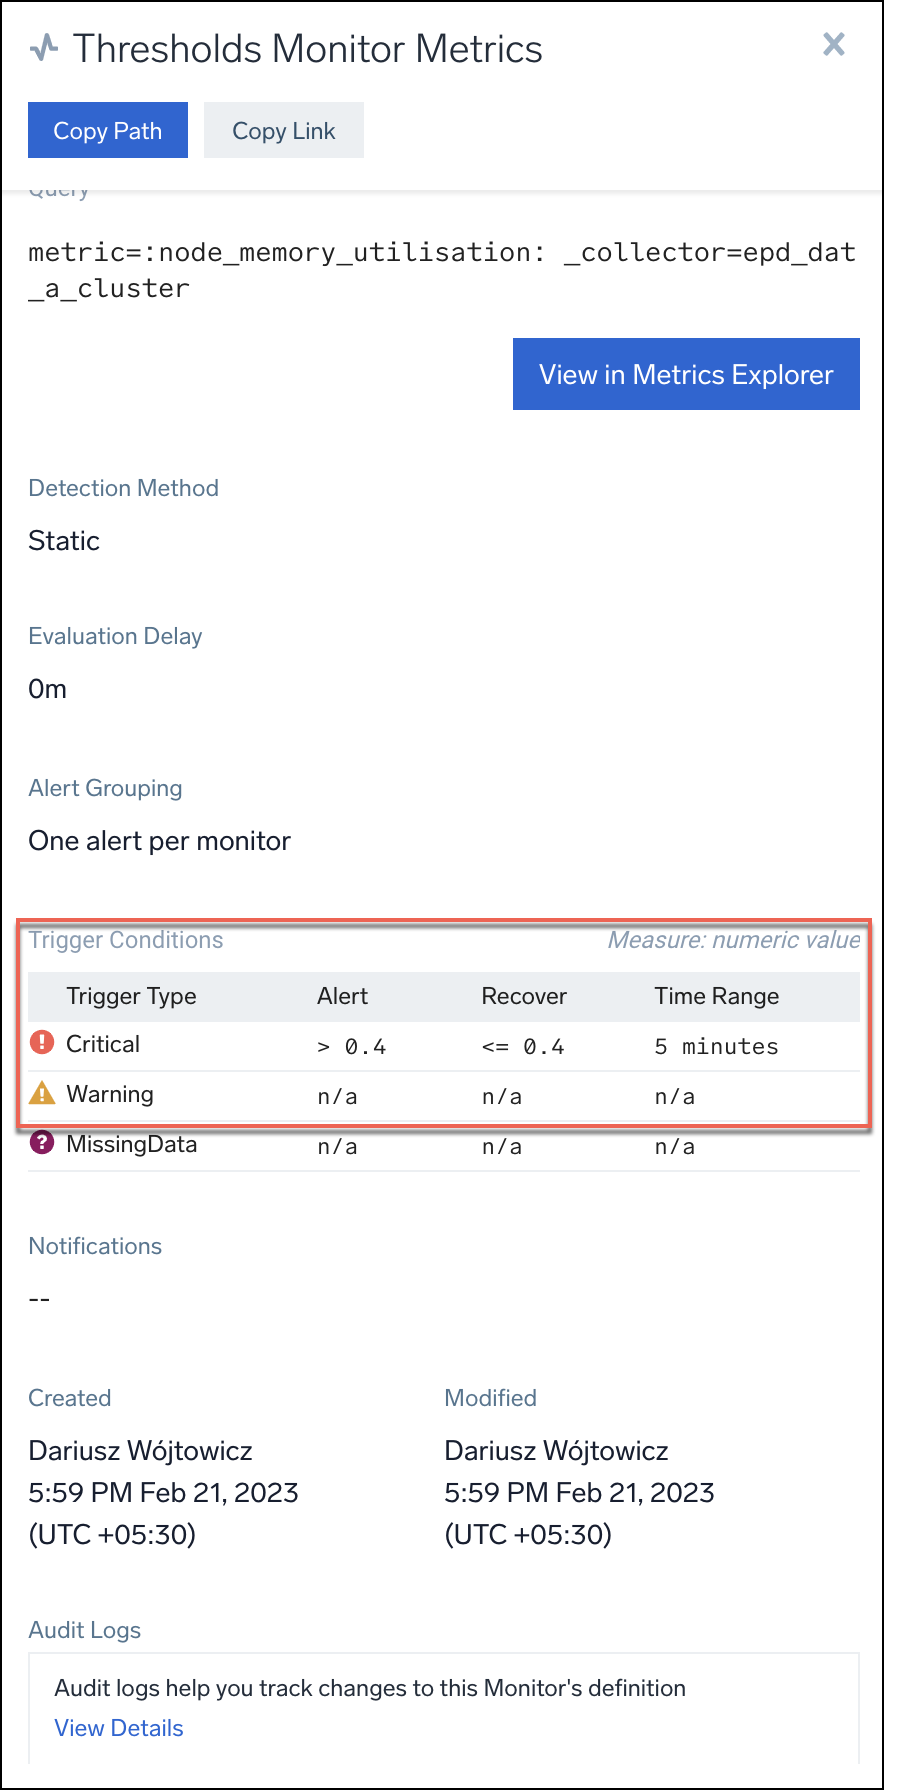
The Monitor Details tab provides additional information about a selected monitor, the description, Library location, query, muting schedules, notification preferences, alert grouping, trigger conditions, and more.
Click on any monitor in your Monitors table, and the Monitor Details tab will appear in the right-hand pane.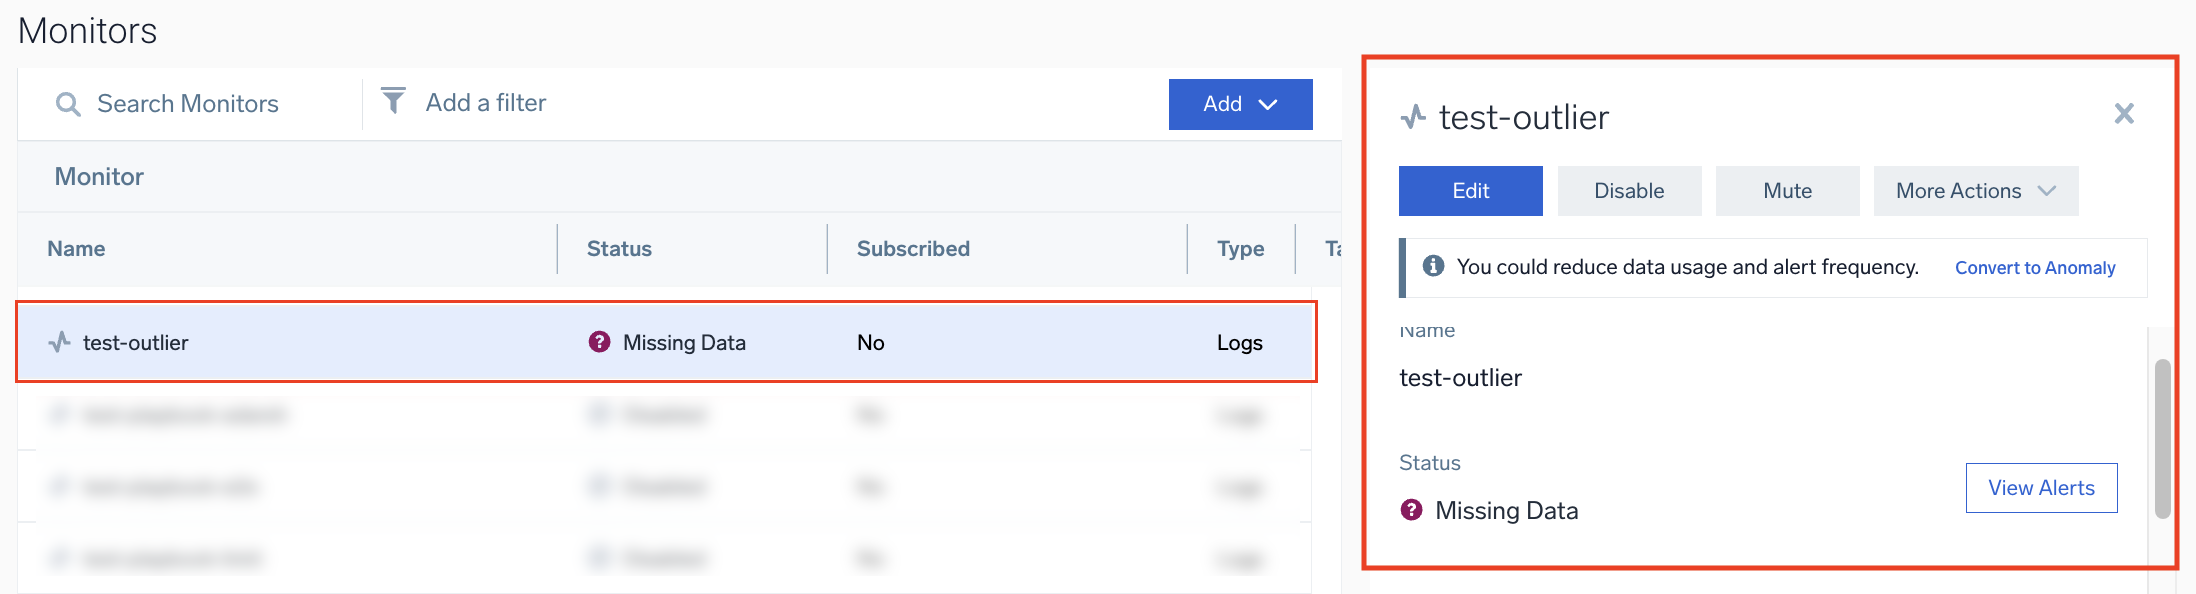
View in Log Search
For logs monitors, the View in Log Search button opens a new Log Search page with the monitor’s query preloaded in the search field. You can run the query to compare the search results against the threshold values set in your monitor.
View in Metrics Explorer
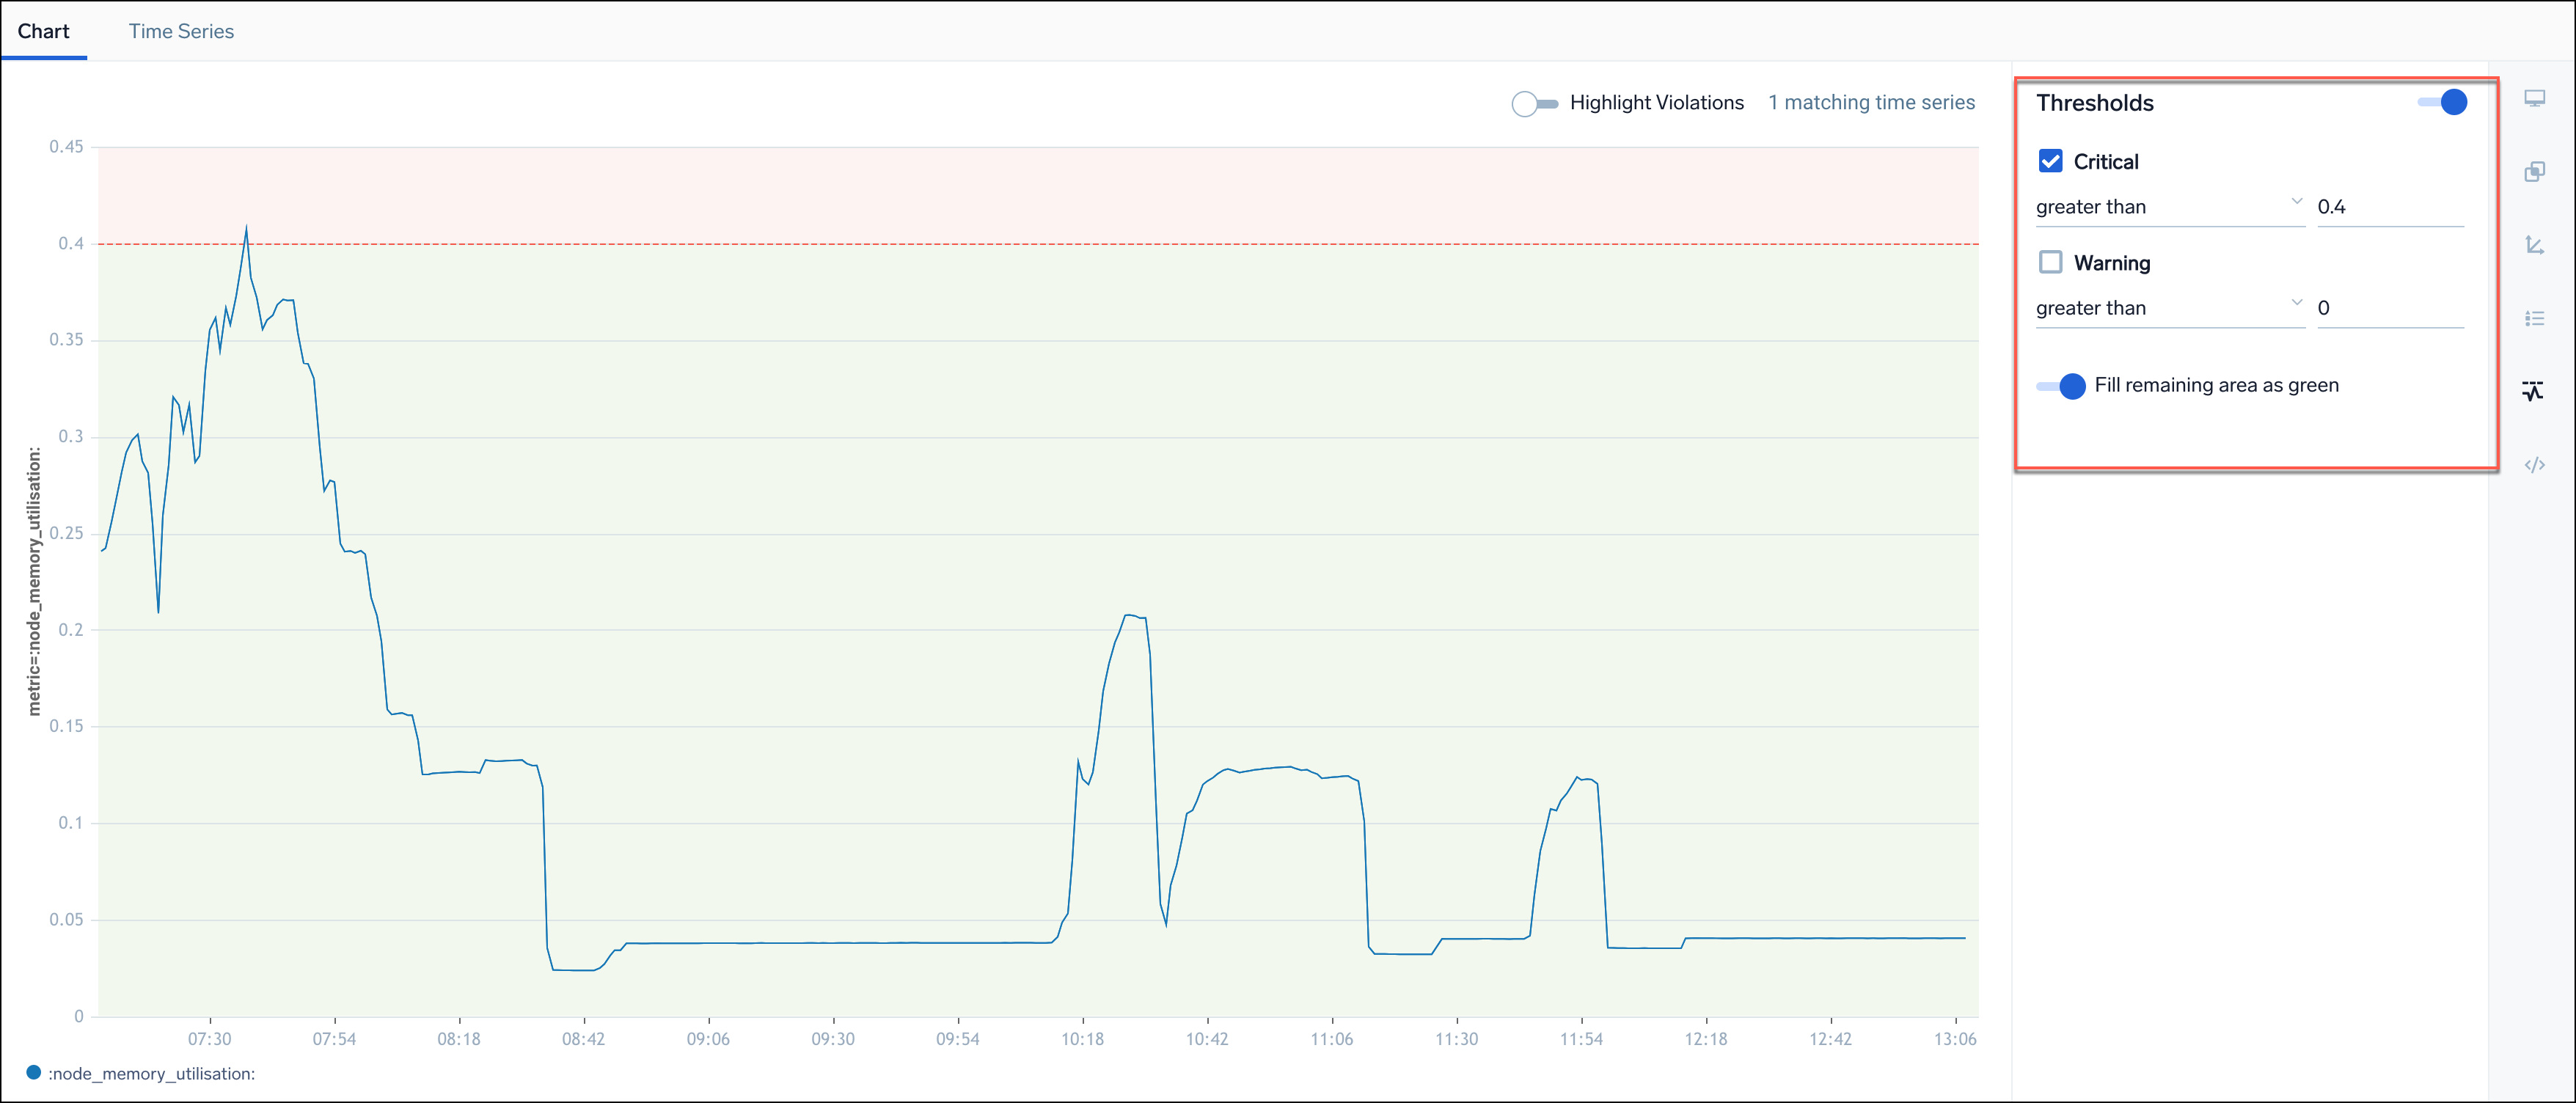
For metrics monitors, the View in Metrics Explorer button opens the Metrics Explorer with the monitor’s threshold values pre-applied. This allows you to compare the set thresholds against real-time data in the Metrics Explorer graph.
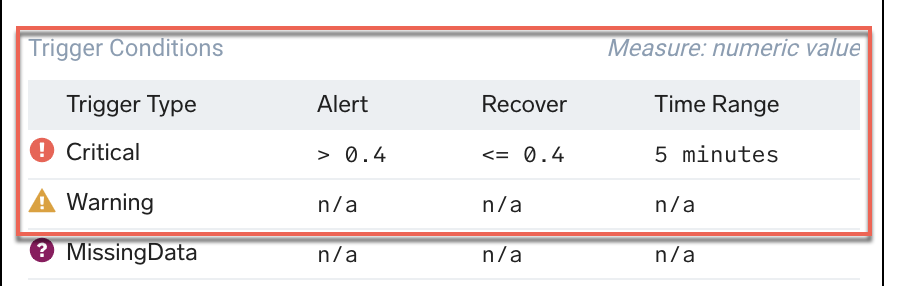
- Navigate to the Trigger Conditions section and note the thresholds values defined for Critical and Warning data conditions. All other parameters, such as the 15-minute window and the "at all times" option, will be set to default.
- Click View in Metrics Explorer. The Metrics Explorer page will display with the same threshold values applied to the panel and graph.
- On the Panel settings page, click threshold icon to view the defined threshold values for the monitor.

- To adjust the chart view, you may need to change the time range in the graph, as the default window is set to 15 minutes.
The same threshold translation functionality applies when creating a monitor from Metrics Explorer and when opening the Alert Response page in Metrics Explorer.
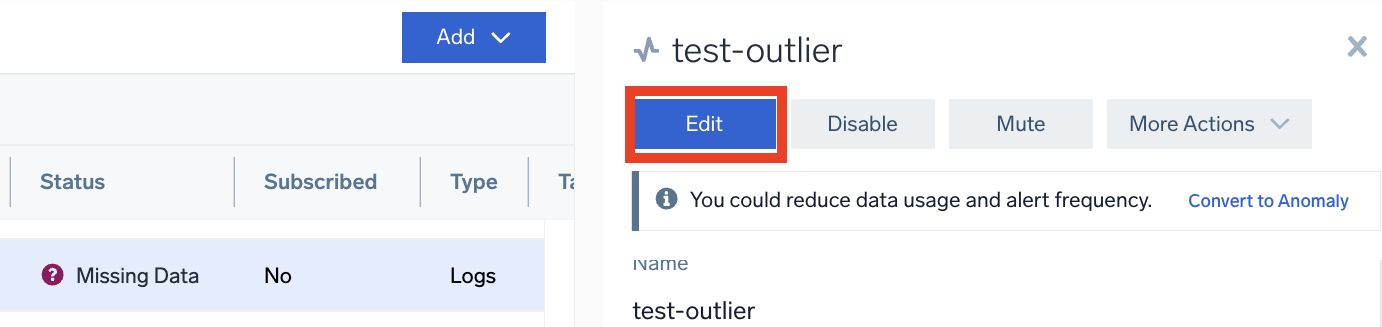
Edit a monitor
Click the Edit button to make changes to the selected monitor.
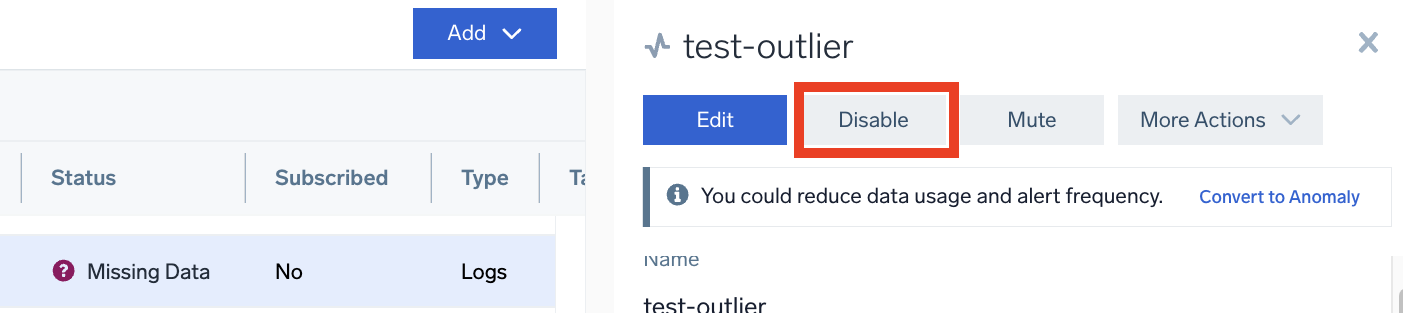
Disable a monitor
Click the Disable button put the monitor in a disabled state so it will not fire any notifications.
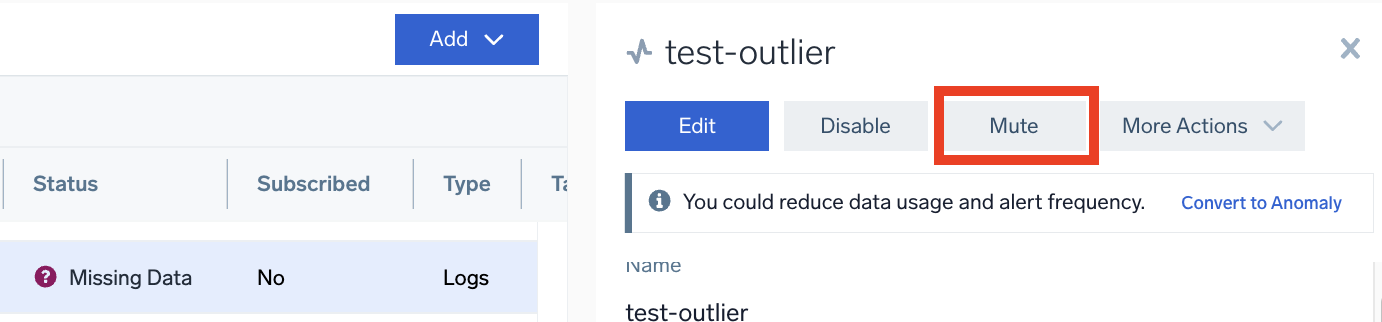
Mute a monitor
Click the Mute button mute the monitor. See also: Muting Schedules.
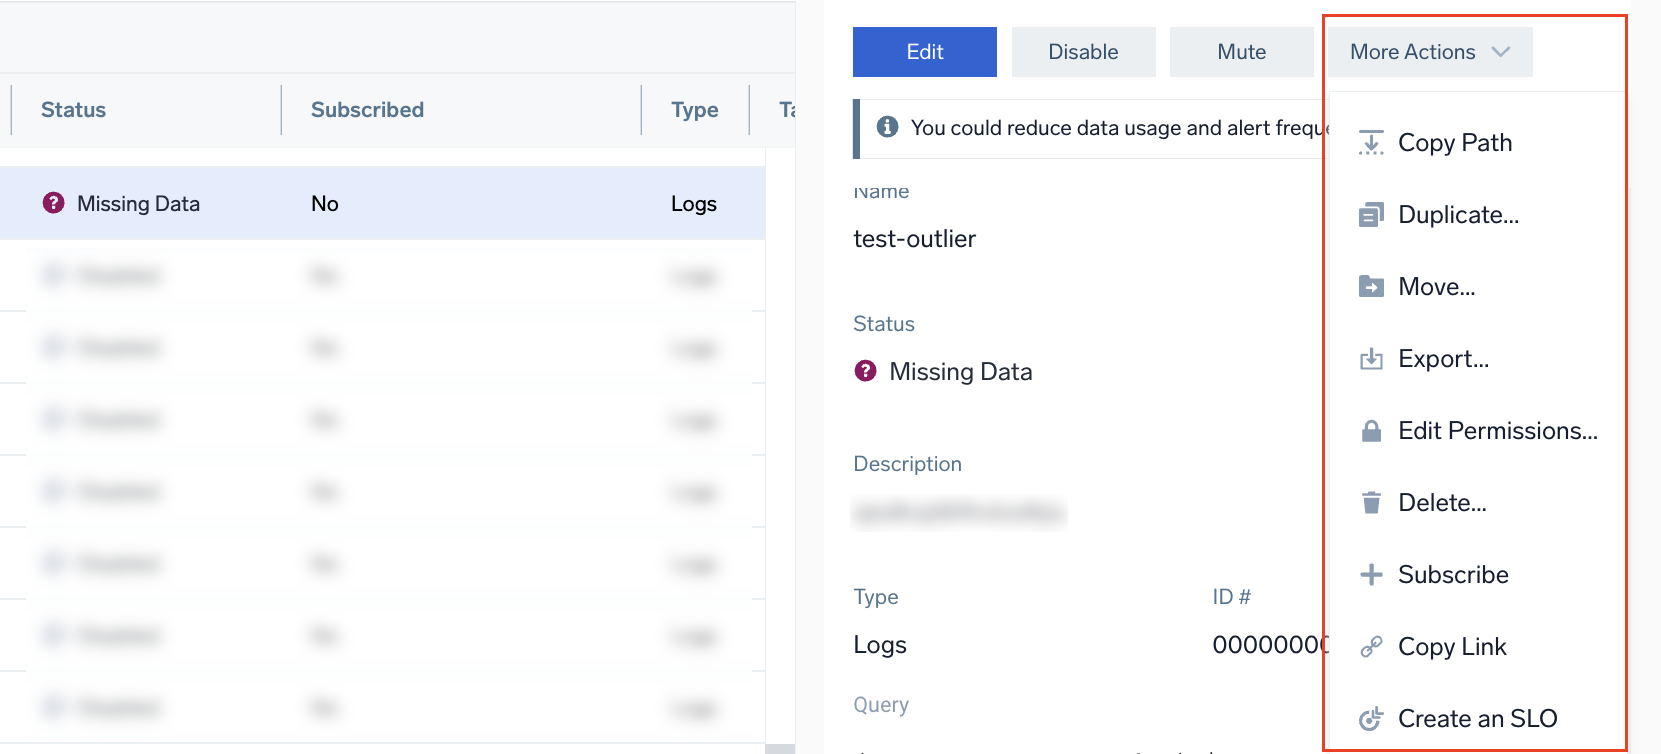
More Actions
Click the More Actions menu to view more options, including:
- Copy Path. Copies the path of the monitor to your computer clipboard.
- Duplicate. Copies the monitor and gives you creator permissions on the duplicated monitor.
- Move. Moves the monitor to a different path.
- Export. Provides JSON of the monitor, allowing you to transfer content within Sumo Logic by copying this JSON, then pasting it into the import dialog in the Library location you choose.
info
The Sumo Logic JSON format may change without notice, and future compatibility with imported JSON is not guaranteed.
- Copy Link. Copies a link to the monitor. Provide the link to any Sumo Logic user in your organization so they can view the monitor. While this option doesn't allow you to share the monitor in the same way you can share a dashboard, you can use this option to quickly allow others in your Sumo Logic organization to view the monitor details.
To quickly access this menu without opening the Details pane, just hover your mouse over a monitor, then click the three-dot kebab icon to view a menu with all of the options available in the Monitor Details tab.
Convert to Anomaly
Outlier-to-anomaly conversion is currently not supported for metrics monitors.
Outlier monitors are functionally similar to anomaly monitors, but they tend to generate more noise. From a data usage perspective, anomaly monitors are more cost-effective.
To reduce data usage and alert frequency, you can convert an existing outlier monitor to an anomaly-based monitor by clicking Convert to Anomaly. This action will open a monitor configuration window with the detection method preset to Anomaly, and you can adjust other settings as needed. You’ll then have the option to either disable the original outlier monitor or keep it active.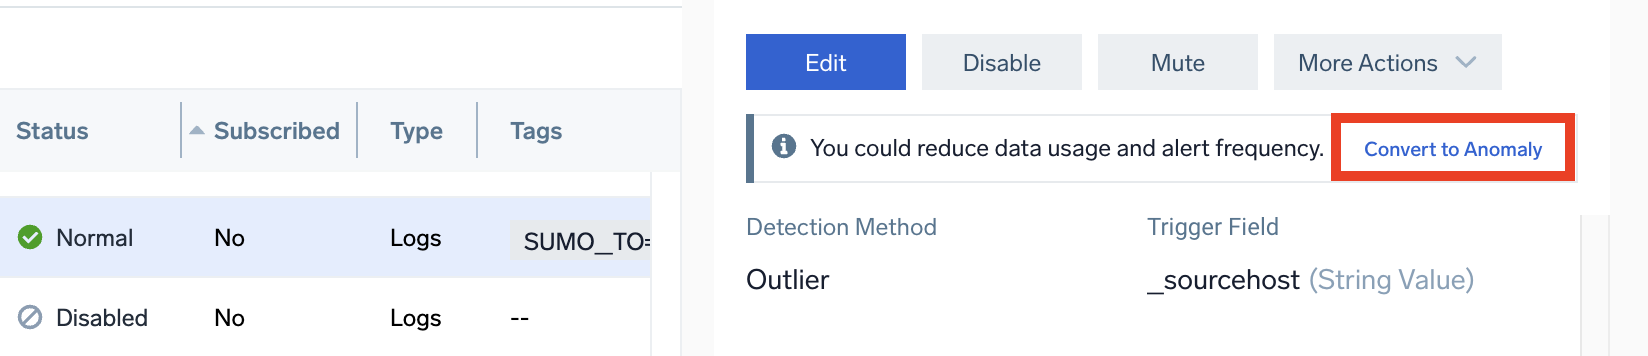
Alternatively, you can do this from the Scan Estimates pop-up.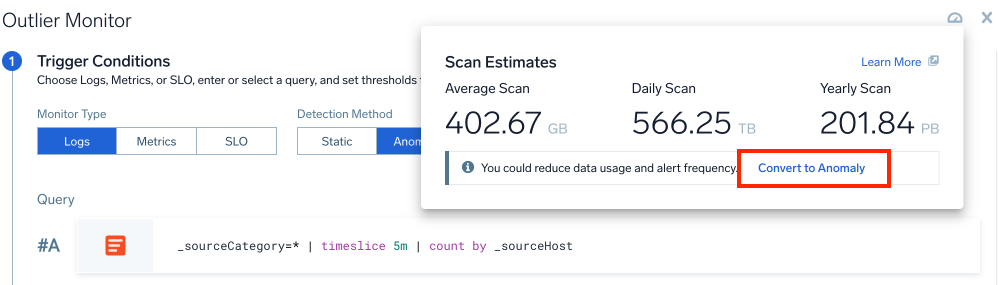
For more guidance on optimizing scan costs on Flex Pricing plans, see:
Monitor History
In the Monitor History tab, you can view a monitor's history of triggered and resolved alerts.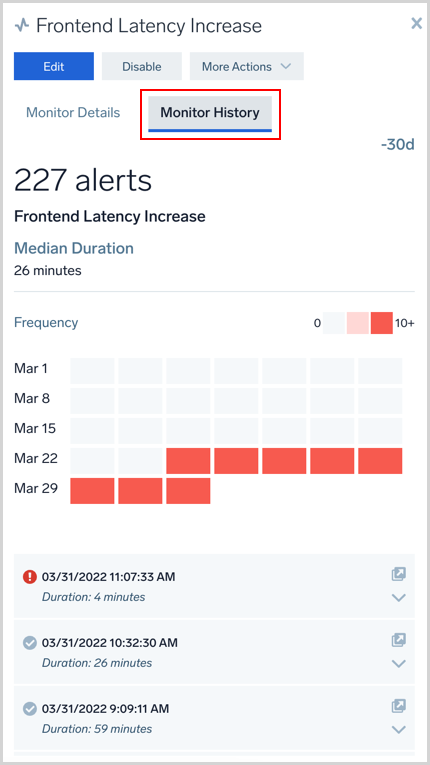
Monitor-based SLO
To learn about the Monitor-based SLO tab, see Create an SLO from the Monitors list page.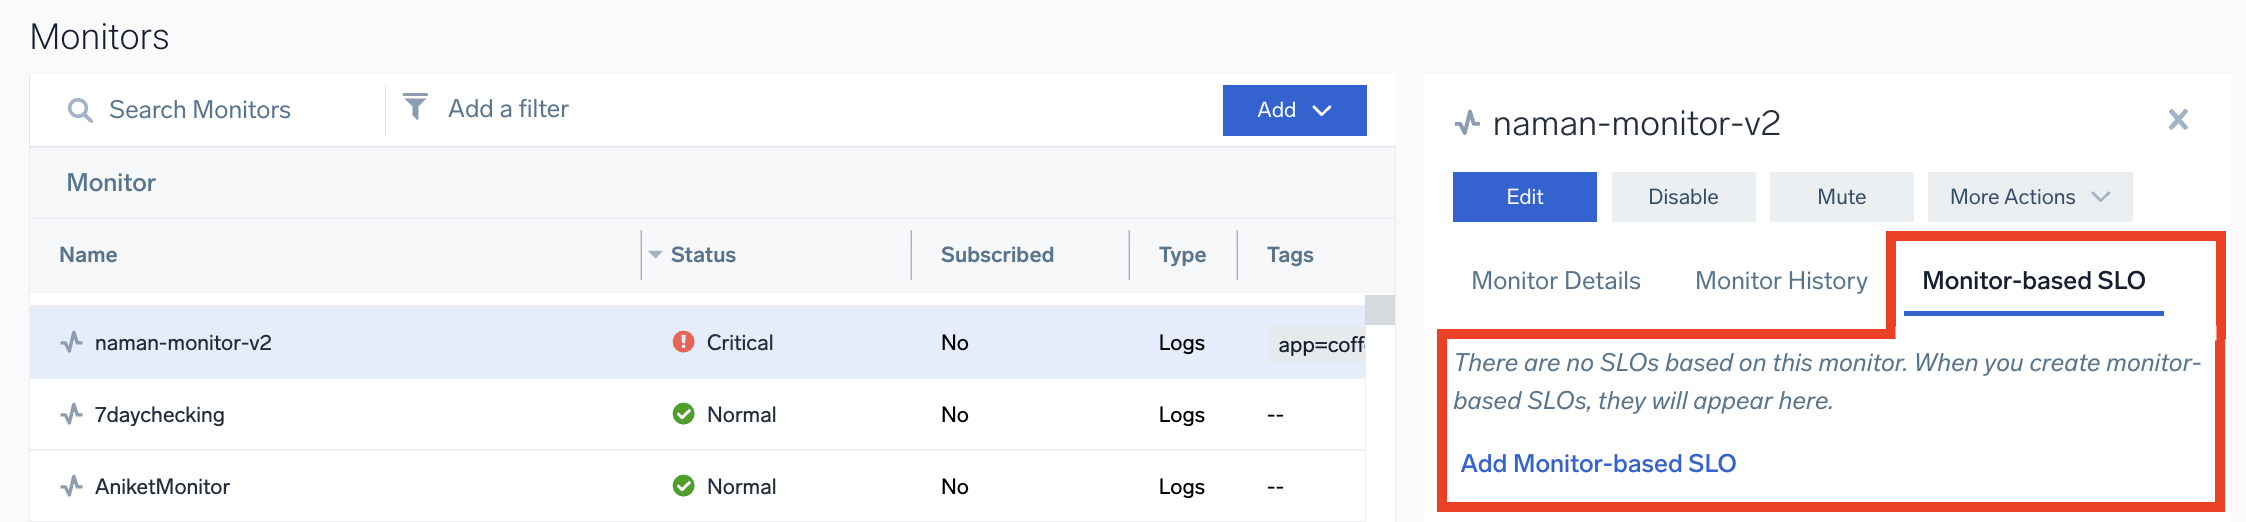
Tags
Tags allow you to categorize, search, filter, and correlate your monitors and alerts more effectively. They are key/value pairs that add metadata beyond the basic name and description of your monitors and alerts. Example tag: team=alerting, where the key is team and the value is alerting.
Creating tags
You can create and use tags at different stages:
Adding tags while creating a monitor
When setting up a new monitor, follow the steps in the Monitor Details section to add tags in the key=value format.
Adding tags to existing monitors
You can also add tags to monitors that are already created.
- Classic UI. In the main Sumo Logic menu, select Manage Data > Monitoring > Monitors. New UI. Go to Alerts > Monitors from the main menu, or use the Go To... menu at the top of the screen to navigate to Monitors.
- Select a monitor from the list and double-click on it.
- In the side panel, click Edit.
- Under the Monitor details step, create a tag using the
key=valueformat, following these syntax rules:- Tag keys cannot start with the prefixes
sumo.or_ - Tag keys can only contain letters, numbers, and/or the symbols
_,.,/,+,-,@ - Tag values can only contain letters, white spaces, numbers, and/or the symbols
_,.,/,=,+,-,@ - A maximum of 50 tags can be associated with each monitor.
- Tag keys cannot start with the prefixes
- Click Save.
Using tags in alerts
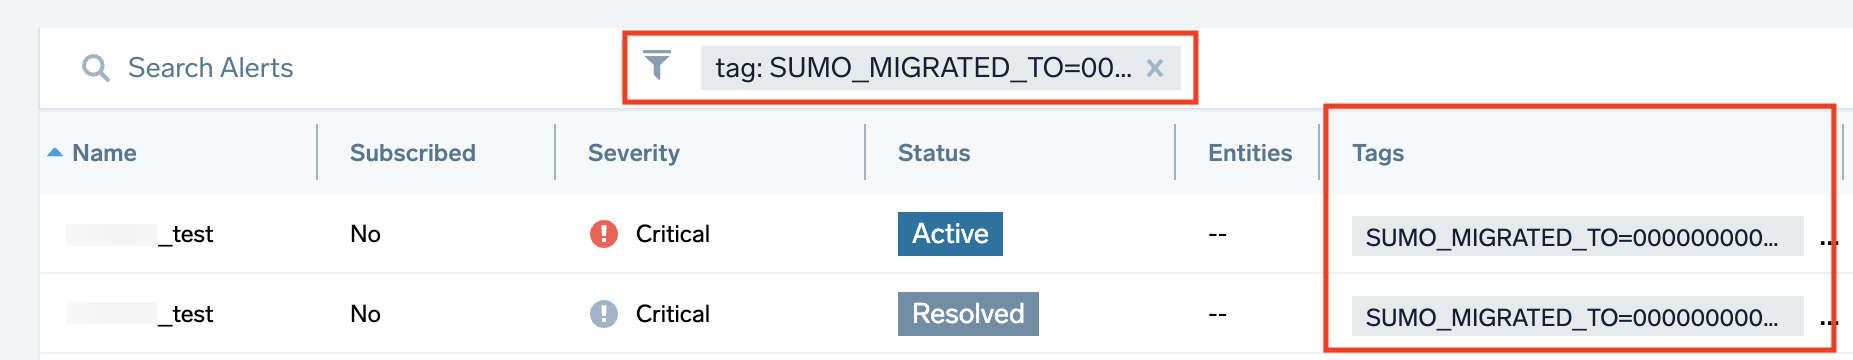
After you’ve created tags for a monitor, these tags will be applied to future alerts generated by the monitor. You can view and use tags in different places:
- Alert List. Classic UI. Navigate to the Alerts section by clicking the notification bell icon at the top of your Sumo Logic dashboard. New UI. Select Alerts > Alert List or click the Go To... menu at the top of the screen and select Alert List. You'll see a Tags column, and you can filter by tags at the top.
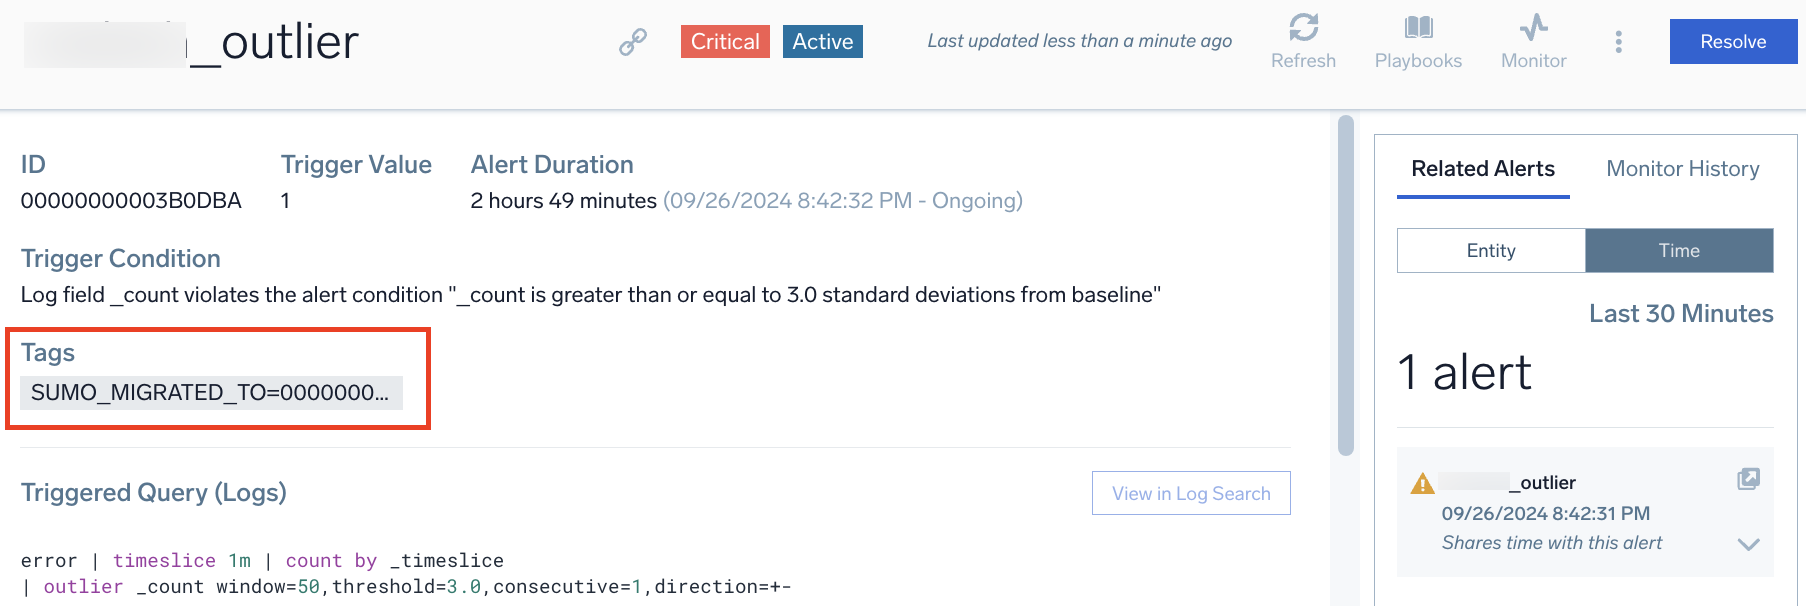
- Alert Response. Click on any alert in your Alerts List page to see more details, including tags in the Tags section.
Monitor folder permissions
This section describes permissions for monitor folders. This feature is not enabled by default in all accounts. To request access, contact Support.
Access to folders that contain monitors is controlled by permissions. If you have the Manage Monitors role capability, you can grant one or more roles permissions to folders that you have created. If you have the Admin Monitors capability you can manage permission to all folders on the Monitors page. The permissions you can set are:
- Read. View-only access to monitors in the folder.
- Update. Ability to edit monitors in the folder.
- Create. Ability to create new monitors in the folder.
- Delete. Ability to delete monitors from the folder.
- Manage. Ability to move folders and to grant other roles permissions to the folder. If you grant this permission, the permissions listed above will be granted as well.
To set permissions for a monitors folder:
- Classic UI. In the main Sumo Logic menu, select Manage Data > Monitoring > Monitors.
New UI. In the main Sumo Logic menu, select Alerts > Monitors. You can also click the Go To... menu at the top of the screen and select Monitors. - Right-click on the folder whose permissions you want to set, and click Edit Permissions. This option is present only if you have been granted Manage permission for the folder.
- On the edit popup, note that the user who created the folder, and roles with the Admin Monitors capability, automatically have all permissions to the folder.
- You can make the following edits:
- You can use the checkboxes to change the permissions currently assigned to a role that was explicitly added to the folder. (You can’t change the permissions to the Administrator and Monitors Admin role.)
- You can click Add Role to add a role to the folder. You’ll be prompted with the "Your Entire Organization" option, and a list of roles. Select "Your Entire Organization" or one or more more roles, and checkmark the permissions you want to grant. If you grant access to a specific role in addition to "Your Entire Organization" users of that role will be granted the least restrictive access defined by the two permission sets.
- You can remove a role that was explicitly added to the folder. To do so, mouse over the role in the edit popup, and click the X that appears.
The permissions you set for a folder are inherited by that folder’s subfolders. When a user views permissions for such subfolders, the inherited permissions will be grayed out. It is not possible to deselect inherited permissions, but you can add additional permissions. Inherited permissions can only be removed by removing them from the higher level folder where they were assigned.