Automated Playbooks in Monitors
This article describes how to configure automated playbooks in monitors. An automated playbook is a playbook in the Automation Service, and is a predefined set of actions and conditional statements that run in an automated workflow to respond to an event. For example, suppose that a monitor detects suspicious behavior that could indicate a security problem. When the monitor sends the alert, it could also run an automated playbook to respond to the event.
To add an automated playbook to a monitor, see Add an automated playbook to a monitor below.
To create a monitor that detects and automatically responds to suspicious behavior (anomalies), see Create an anomaly monitor that runs an automated playbook below.
Prerequisites
Automated playbooks are managed by the Automation Service. To use automated playbooks with monitors, you must perform tasks to enable the Automation Service. See Prerequisites for the Automation Service.
Access automated playbooks for monitors
When working with monitors, use the following ways to access playbooks in the Automation Service.
When creating a monitor
- Create a monitor.
- Go to the Playbook section.
- Click Manage Playbooks.
Playbooks are displayed in the Automation Service.
For more information, see Add an automated playbook to a monitor below.
When viewing an alert
- Go to your Alert List and click on any alert to open its details page.
- Click the Playbook button. The attached playbooks, if assigned during Monitor configuration, are displayed along with their execution status.
- Click the name of an attached playbook.
The playbook is opened in the Automation Service.
For more information, see View automated playbooks for an alert below.
From the main navigation menu
- Classic UI. In the main Sumo Logic menu, select Automation.
New UI. In the main Sumo Logic menu, select Automation > Playbooks. You can also click the Go To... menu at the top of the screen and select Playbooks. - The Automation Service screen opens on the Playbook tab.
For more information, see About the Automation Service.
Add an automated playbook to a monitor
- Open the New Monitor window.
- Perform Step 1, Step 2, and Step 3 in the New Monitor window.
- In Step 4: Playbook, click the field under Automated Playbooks to select a playbook in the Automation Service to run when an alert is fired.
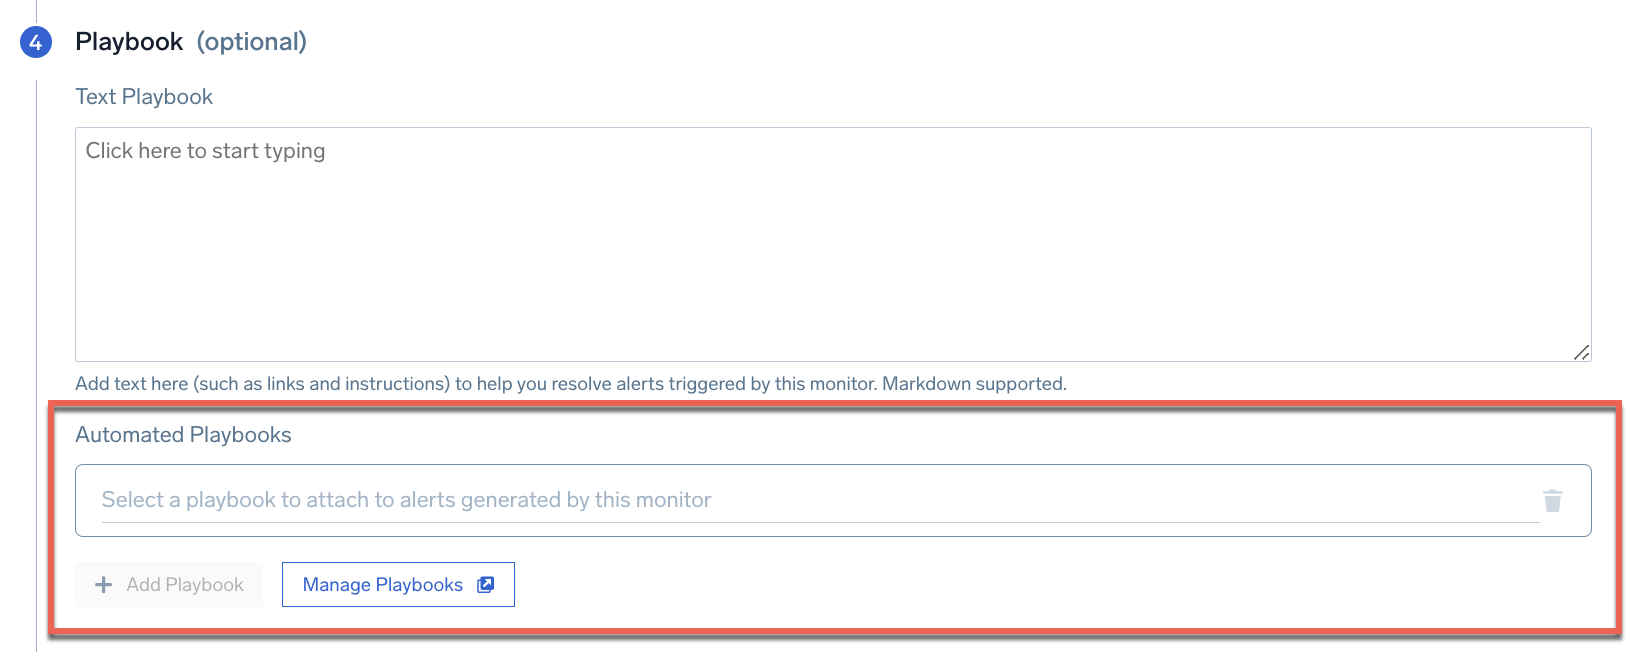
- (Optional) Click Manage Playbooks to see playbooks in the Automation Service. From here you can view the playbook you selected above and look at its details in the Automation Service to determine if it is the one you want to run when the alert is triggered. You can also edit the playbook, or if you want, create a new playbook in the Automation Service to use in the monitor.
After you add playbooks to the monitor, when the monitor triggers an alert, the selected playbooks run automatically.
View automated playbooks for an alert
Once a monitor triggers an alert with one or more attached playbooks, you can view the playbooks for the alert.
-
Go to your Alert List and click on any alert to open its details page.
-
Click the Playbook button. The attached playbooks are displayed.
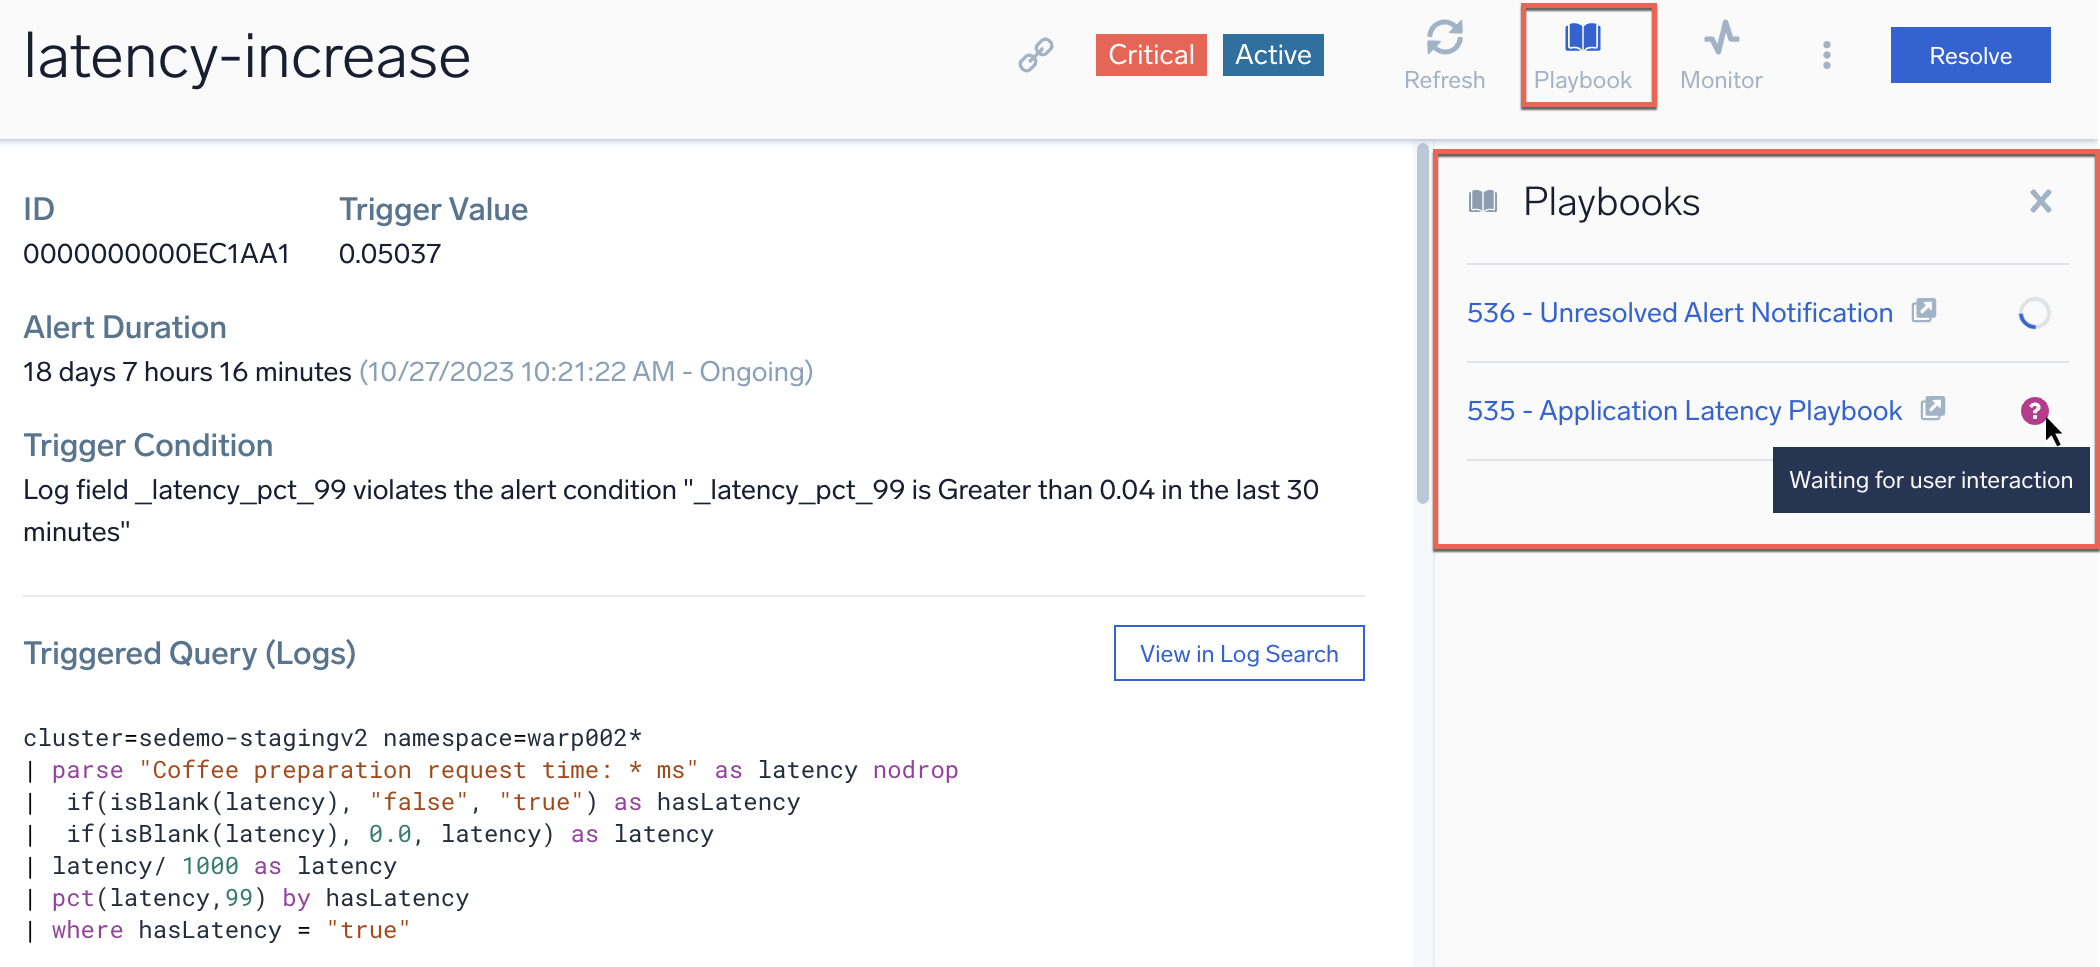
-
Hover your mouse over the icon to the right of the playbook name to view the status of the playbooks:
Icon Description 
Running 
Waiting for user interaction 
Completed 
Completed with errors -
Click the playbook name to open the playbook in the Automation Service.
The playbook shows the status of each action in the playbook that ran for the alert. For example, Success displays at the bottom of actions that have successfully completed, Failed for actions that did not complete, or Waiting Owner for actions that need user interaction.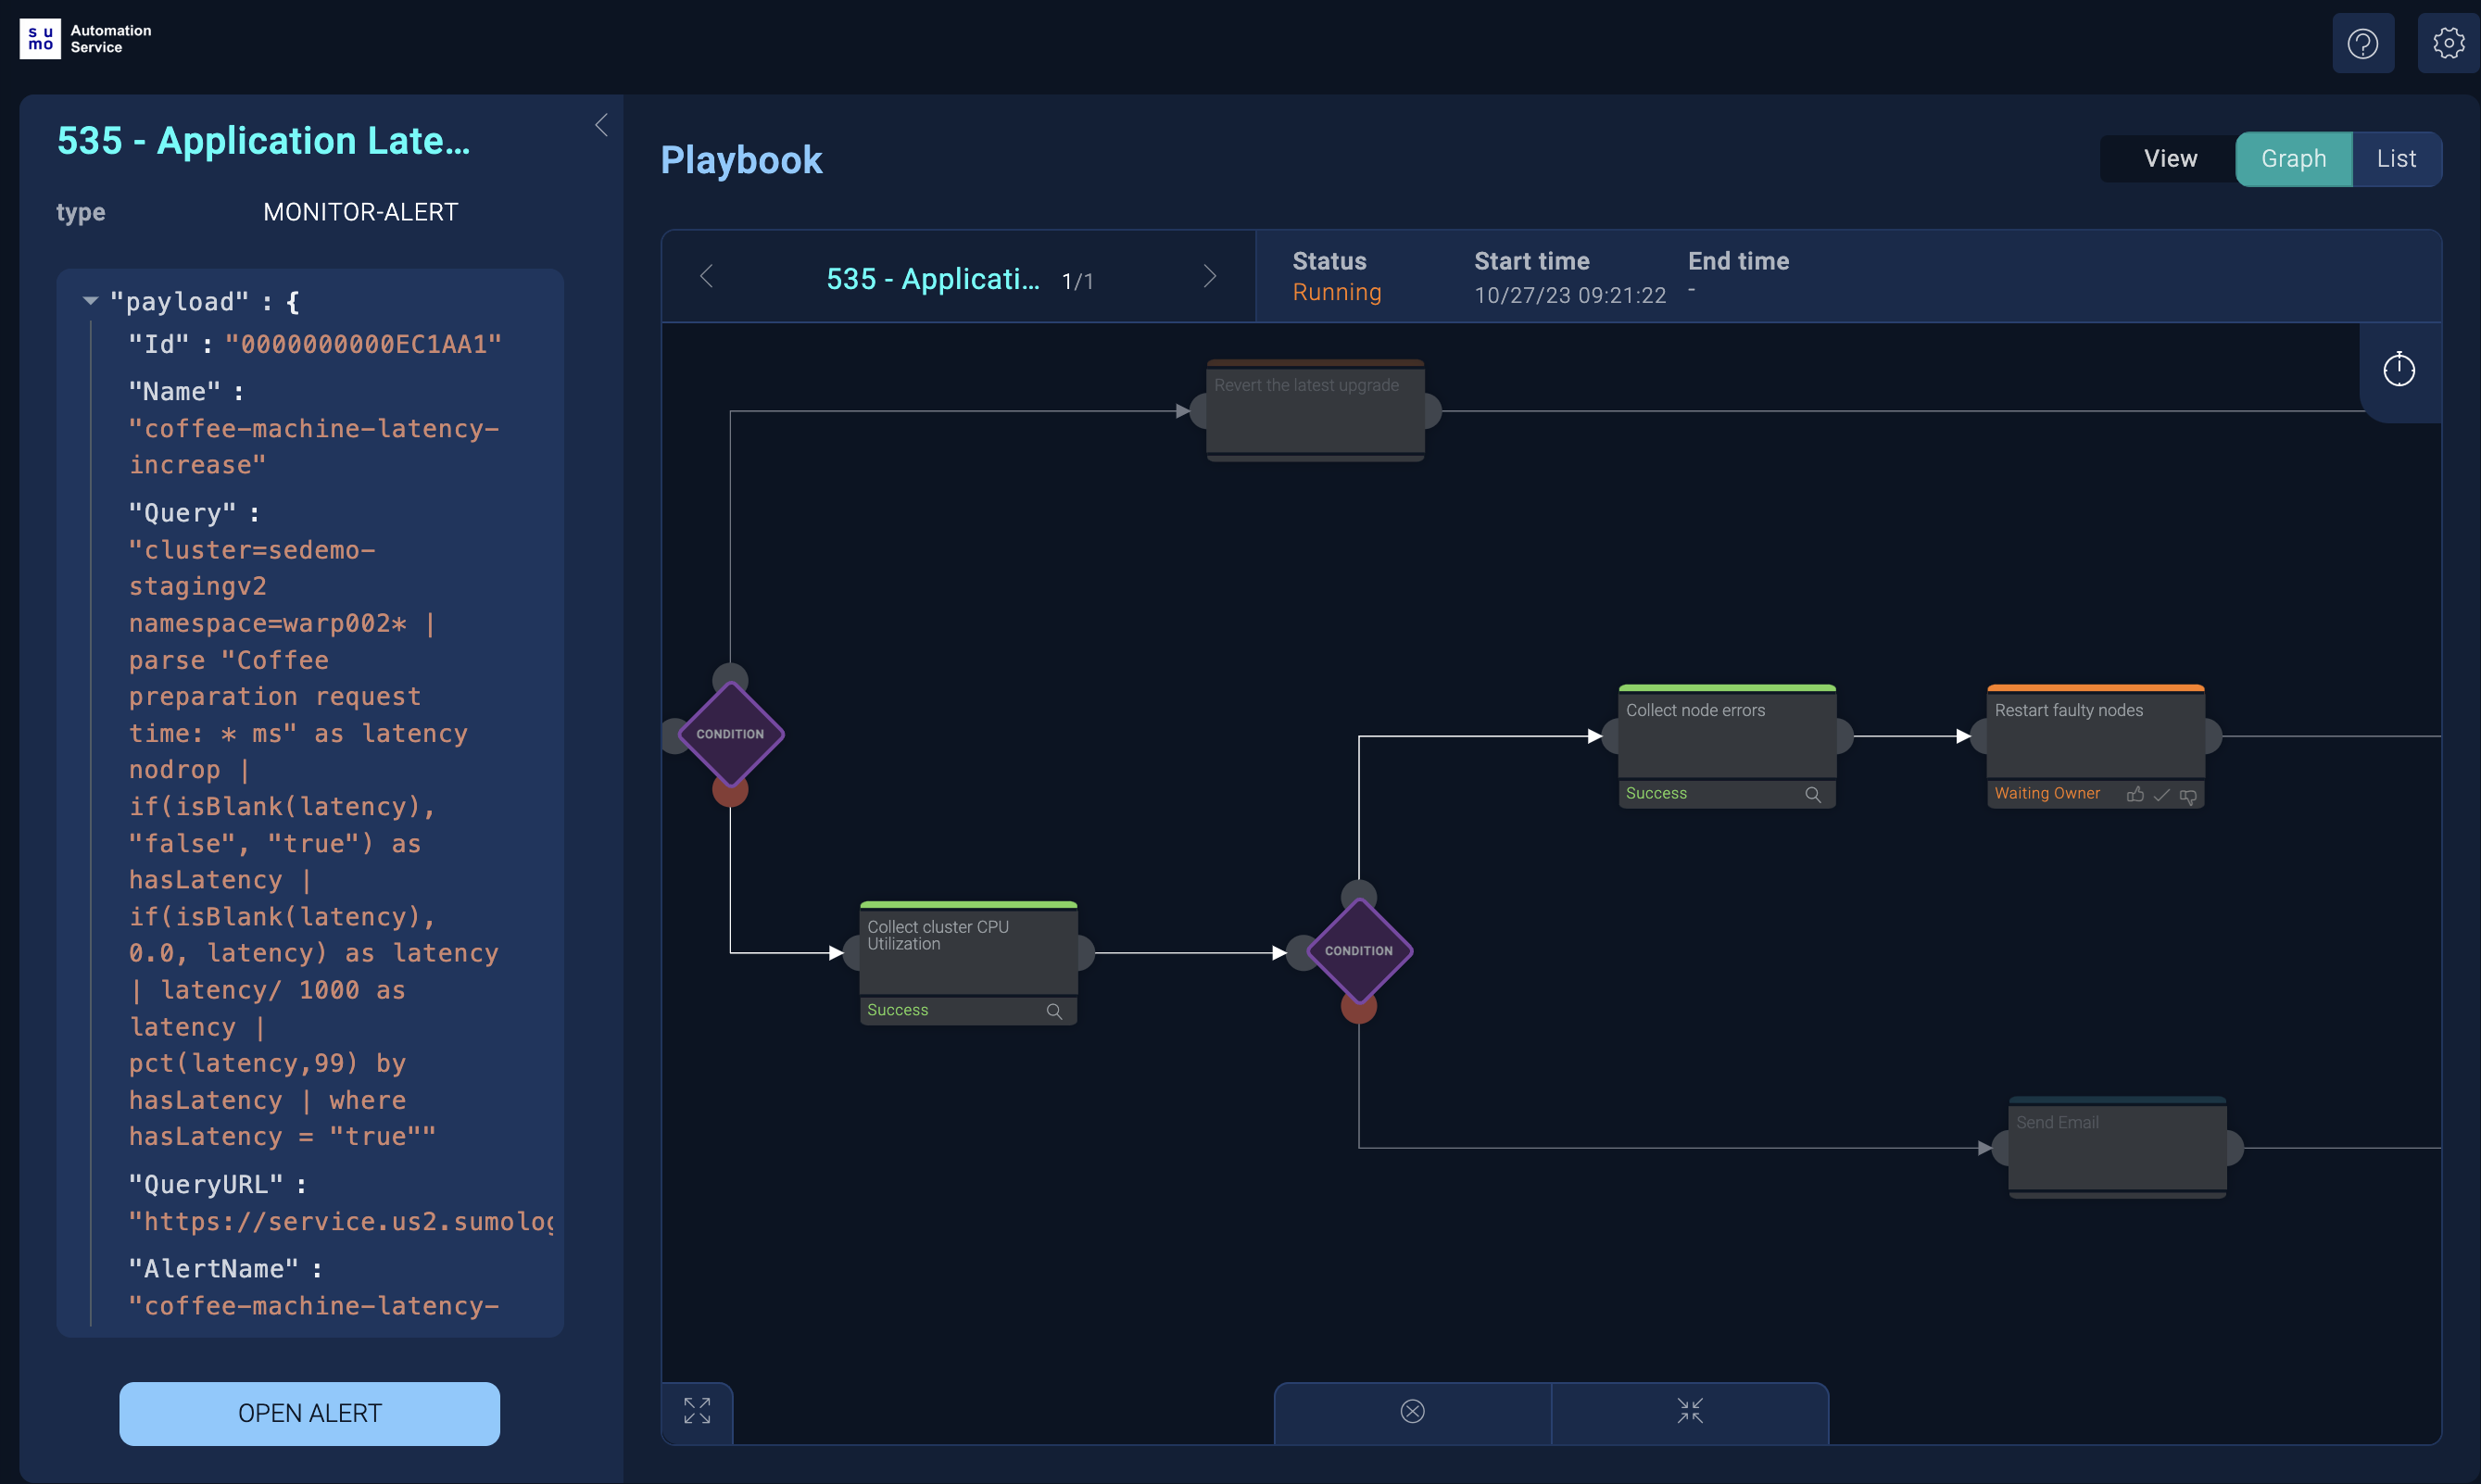
-
Click an action to view more about its status. Status information opens in a box to the left.
In the following example of an action whose status is Waiting Owner, an Action Task appears in the box that describes user interaction required to complete the task.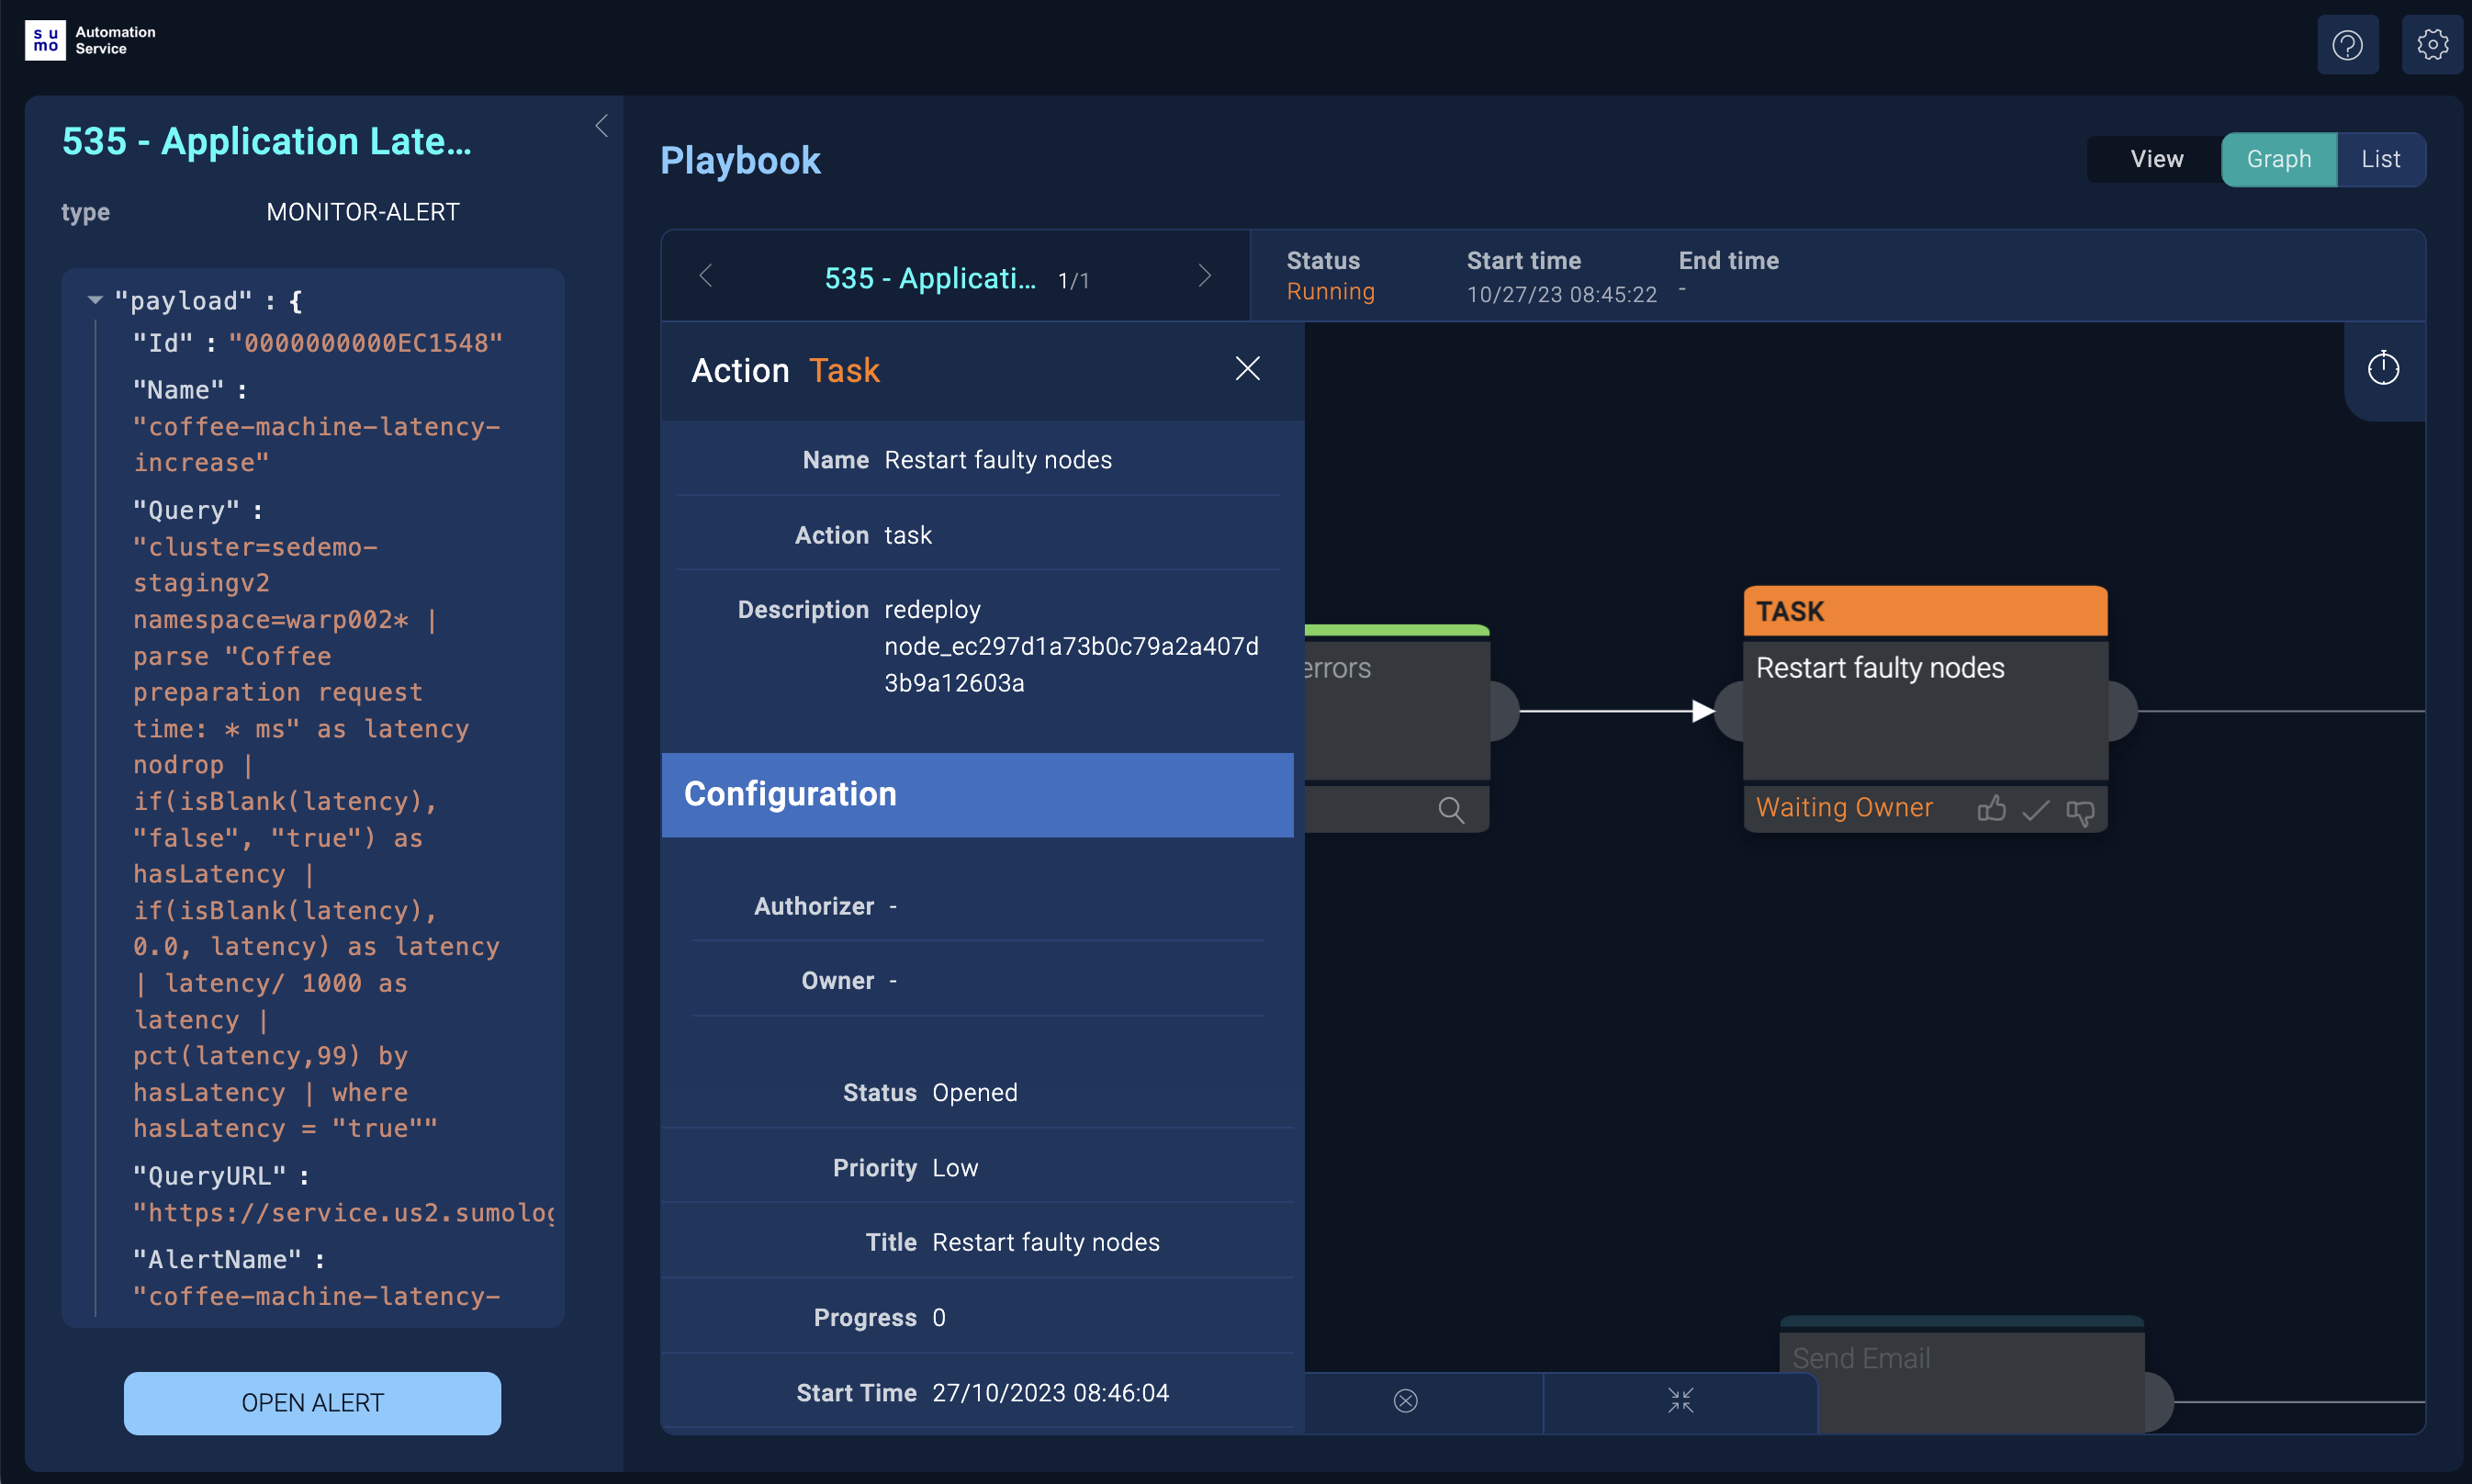
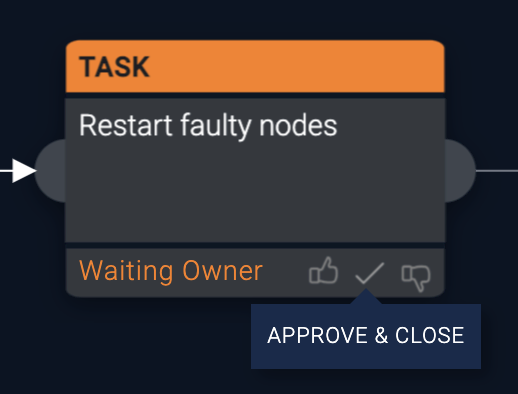
-
If you have an action marked as Waiting Owner, perform the steps needed to complete the Action Task. When done, click the appropriate button at the bottom of the Waiting Owner action box (Approve, Approve & Close, or Reject). The action completes, and the subsequent remaining actions in the playbook run.
-
Address any other actions in the playbook that need attention. For example, click and open any failed actions to see why they failed and to determine what you need to do to get them to complete successfully.
Create an anomaly monitor that runs an automated playbook
You can create a monitor that triggers an alert that in turn runs an automated playbook in response to unusual behavior (an anomaly).
An anomaly monitor is triggered when unusual conditions are detected. Anomaly monitors leverage a machine learning model to detect anomalies and identify unusual patterns of activity. The output of the machine learning model are baselines for normal behavior, in the form of lower and upper thresholds, so that deviations from baselines signal unusual activity and trigger alerts.
Weekly seasonality detection is turned off by default to optimize performance. Contact Sumo Logic Customer Support to activate it for specific monitors. (Weekly seasonality detection is the optimization of baseline calculations to account for the variations of data flow that can occur in a work week.)
Watch this micro lesson to learn about anomaly monitors.
To create an anomaly monitor that runs an automated playbook in response to an alert:
- Open the New Monitor window.
- Go to Step 1: Trigger Conditions in the New Monitor window.
- Select the Logs monitor type.
- Select Anomaly under Detection Method.
(Note that Outlier monitors are under Anomaly because they use anomaly detection on in-query data.)
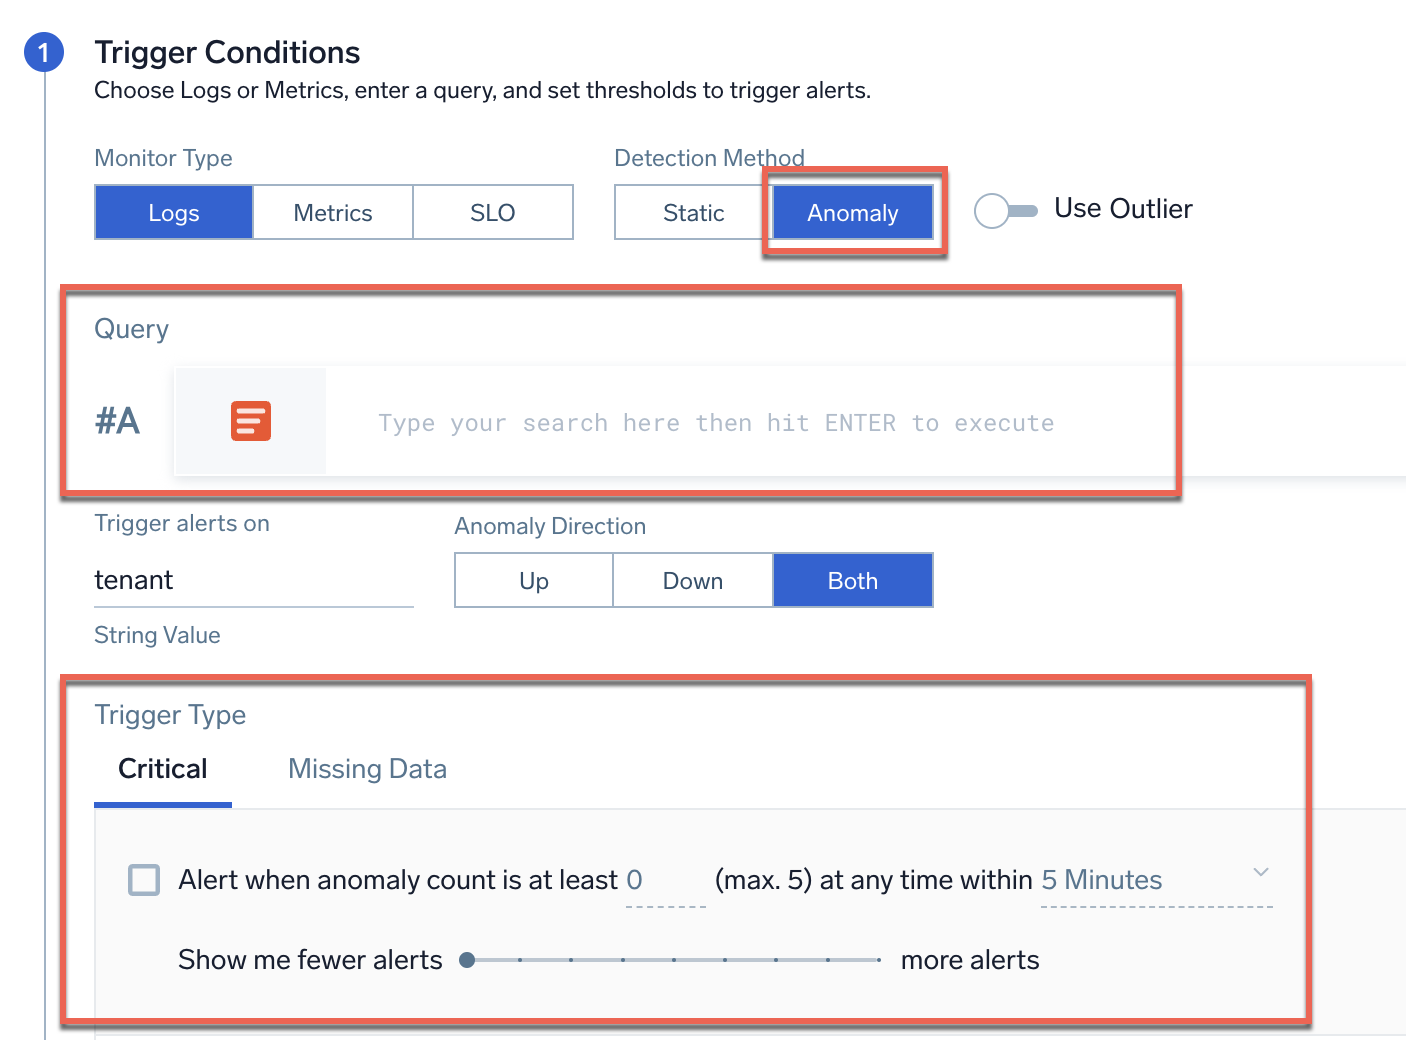
- In Query, provide a query for the logs to be monitored for anomalous behavior.
- In the Critical tab under Trigger Type, select the parameters for the alert trigger:
- Alert when anomaly count is at least ___ (max. 5) at any time within ___. Enter the minimum number of anomalies to detect during the detection window before triggering an alert, and the duration of time to watch for anomalies (from 5 minutes to 24 hours). Ensure that the time period window is 5-10 times longer than the timeslice used in the log query. This setting helps you add context to anomaly detection. For example, if you know a particular signal is noisy, you may want to wait for a number of anomalous data points in the detection window before triggering an alert. If the time period is set to 5 minutes, and the minimum anomaly count is set to 1, then an alert is triggered if 1 anomaly appears within a 5-minute time period.
- Show me fewer alerts --- more alerts. Tune the number of anomalous data points detected per day compared to the predicted baseline for the detection window. Select more alerts if you do not want to miss out on most anomalies.
- Perform Step 2: Advanced Settings and Step 3: Notifications in the New Monitor window.
- In Step 4: Playbook, click the field under Automated Playbooks to select one or more playbooks that run when the monitor triggers an alert.
- Perform Step 5: Monitor Details.
- Click Save to save the monitor with the attached playbooks.
When the monitor detects anomalous activity, it triggers an alert that runs the selected playbooks automatically. In this way, the system can respond autonomously to suspicious behavior exposed in logs.
Configure automated playbooks for monitors
Automated playbooks for monitors are created and maintained in the Automation Service. This section provides tips to configure the automated playbooks.
View automated playbooks
To view playbooks in the Automation Service, access playbooks and click the Playbook tab in the Automation Service.
Although you can attach any playbook to a monitor, playbooks of type Alert are specifically designed for use with alerts, since they transmit the alert context to the playbook and can drive actions there. When you open a playbook, the type displays next to the name.
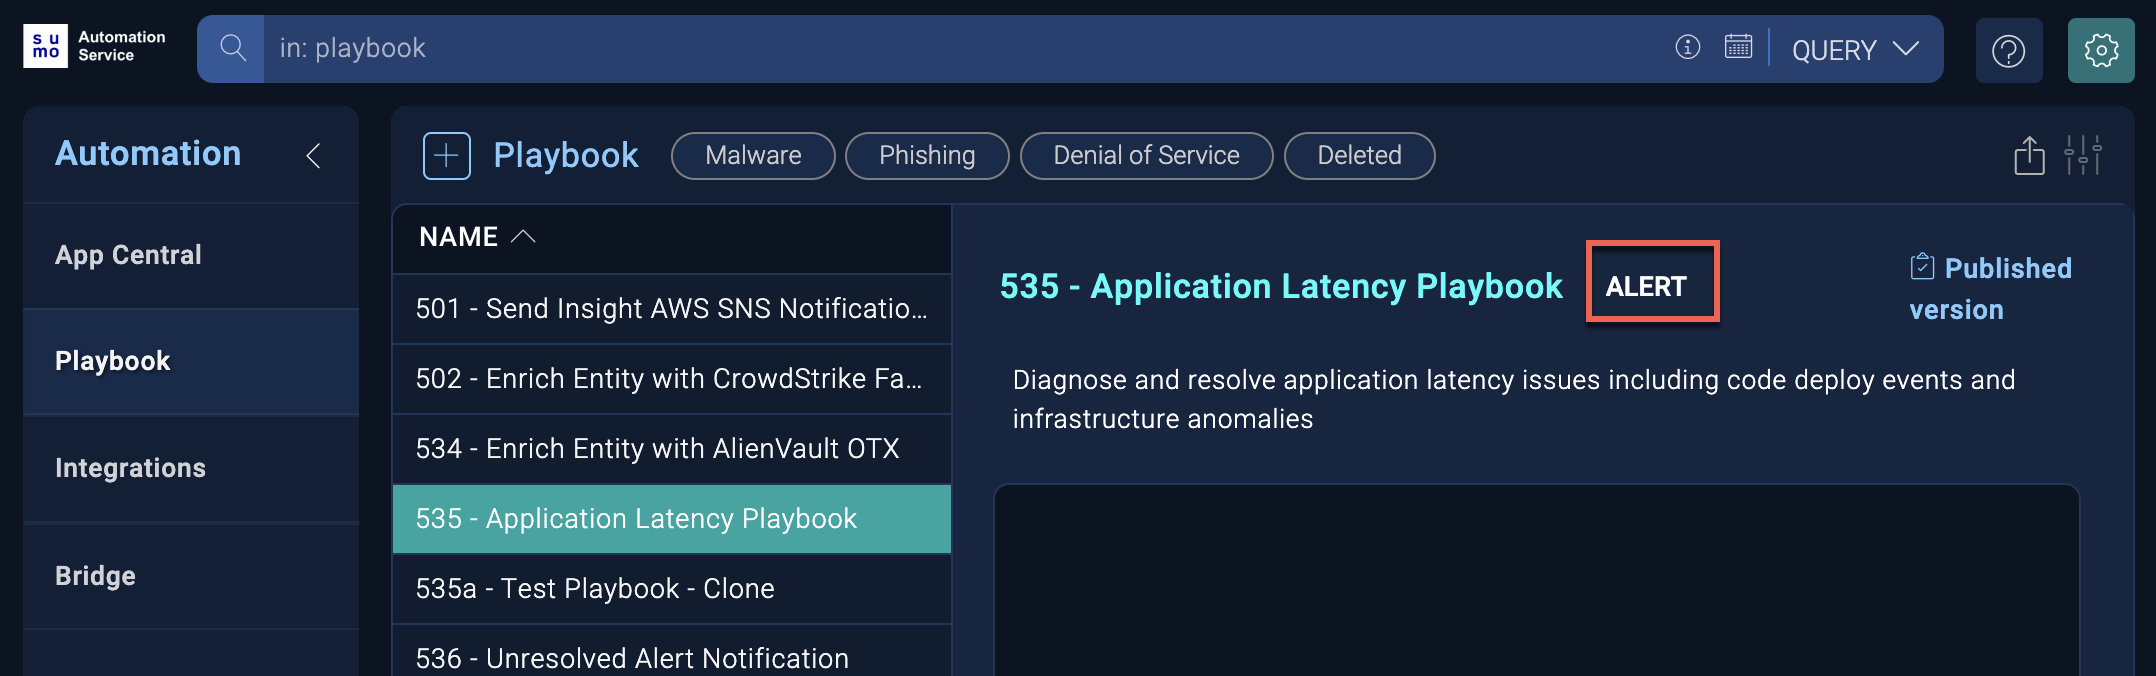
Sample playbooks to attach to monitors include:
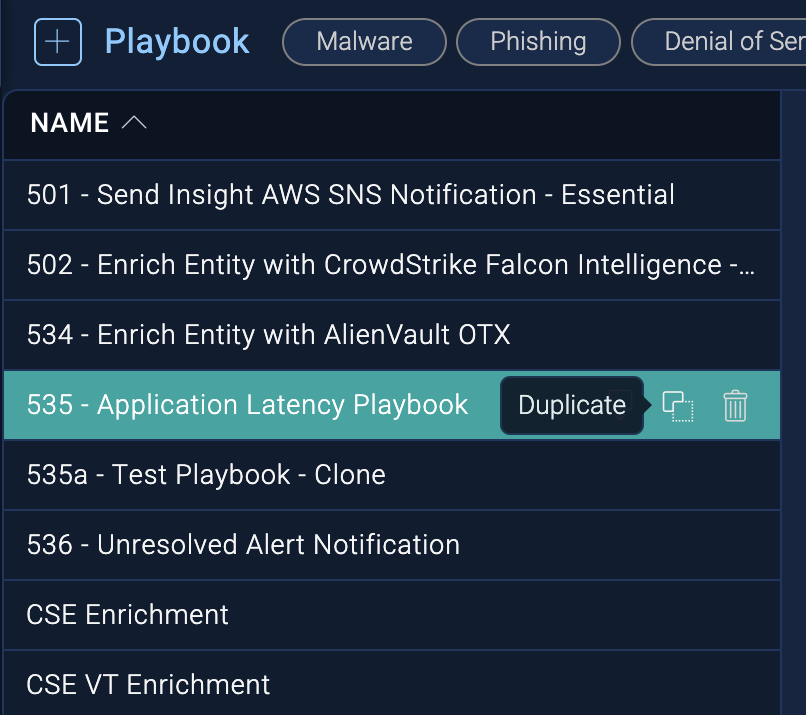
- 535 - Application Latency Playbook. Diagnose and resolve application latency issues, including code deploy events and infrastructure anomalies.
- 536 - Unresolved Alert Notification. Periodically monitor status of a Sumo Logic alert and notify a Slack channel about unresolved alerts.
Create playbooks for monitors
To create a playbook so you can add it to a monitor, see Create a new playbook. As a best practice, whenever you want to create a new playbook, select an existing playbook to serve as the template for the new playbook and click the Duplicate button to copy it.
Install an integration for monitors
Integrations are connectors to applications from industry-leading network and security vendors. Integrations provide the actions run in playbooks.
To use an integration's actions in a playbook, install the integration from App Central. To use an existing integration as the basis for a new integration, duplicate the integration.
Some integrations that have useful actions for monitors include:
- Sumo Logic Log Analytics. Integration with Sumo Logic platform for logs, metrics, and monitors. Actions include:
- Resolve Alert. Resolve the alert.
- Search Metrics. Query metrics from Sumo Logic.
- Search Output Mapping. Parse the output of a Search Sumo Logic action.
- Search Sumo Logic. Query logs data from Sumo Logic.
- Sumo Logic Notifications. Integration with the Sumo Logic platform for monitors and Slack notifications. Actions include:
- Assess Alert Status. Periodically monitor status of a Sumo Logic alert and notify a Slack user if the alert is unresolved.
Pass custom fields from a monitor to playbooks
Results from an alert query are passed to a playbook through the alert payload. The variables from the payload can be used as inputs for different nodes in the playbook after they are defined as parameters in the start node.
You must use alert grouping in the monitor configuration to pass fields from the query to the playbook.
Configure parameters from an alert
- Click Edit on the Start Node.
- Select Alert from the dropdown.
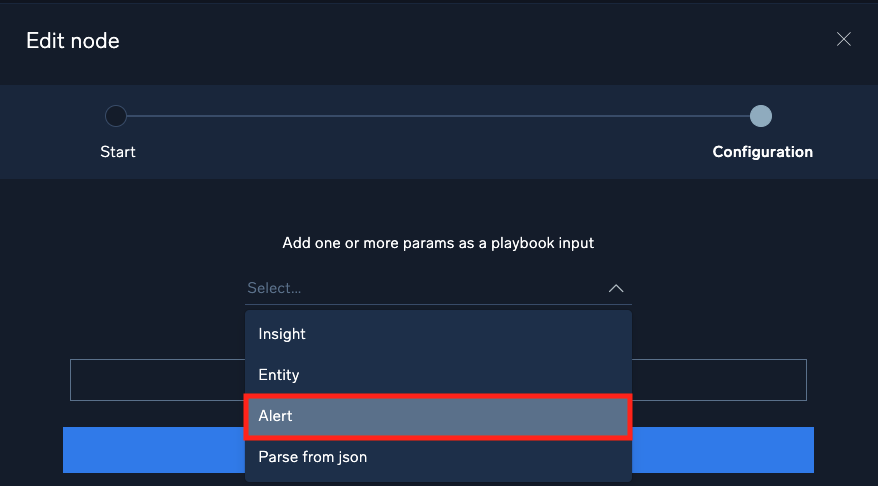
- The parameters from the default alert payload variables will be defined, along with some placeholders for custom fields that may be passed from the alert query. To reference a field passed from the alert query, use
customPlaceholderMap[].FIELDNAME.
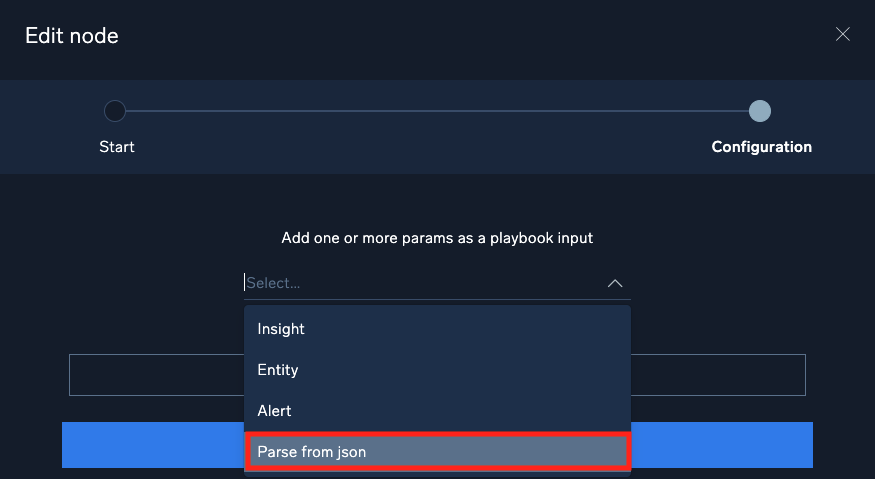
Configure parameters from a JSON payload
- Click Edit on the Start Node.
- Select Parse from Json from the dropdown.
- Copy the payload from a previously triggered automation. You can view the playbook payload of a previously triggered alert by following the steps here.
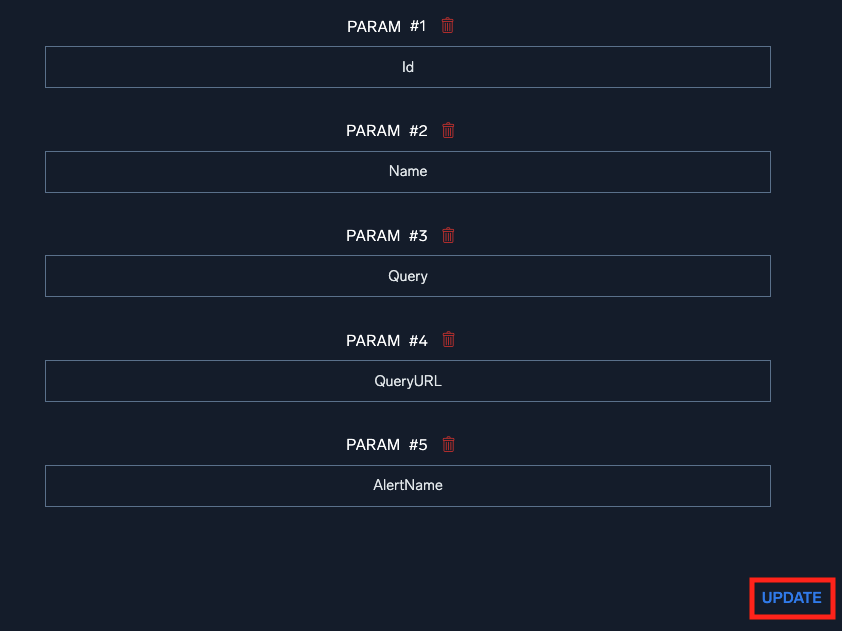
- Paste the payload into the Enter Json payload text box and click Parse. The fields from the payload will be auto parsed to parameters.
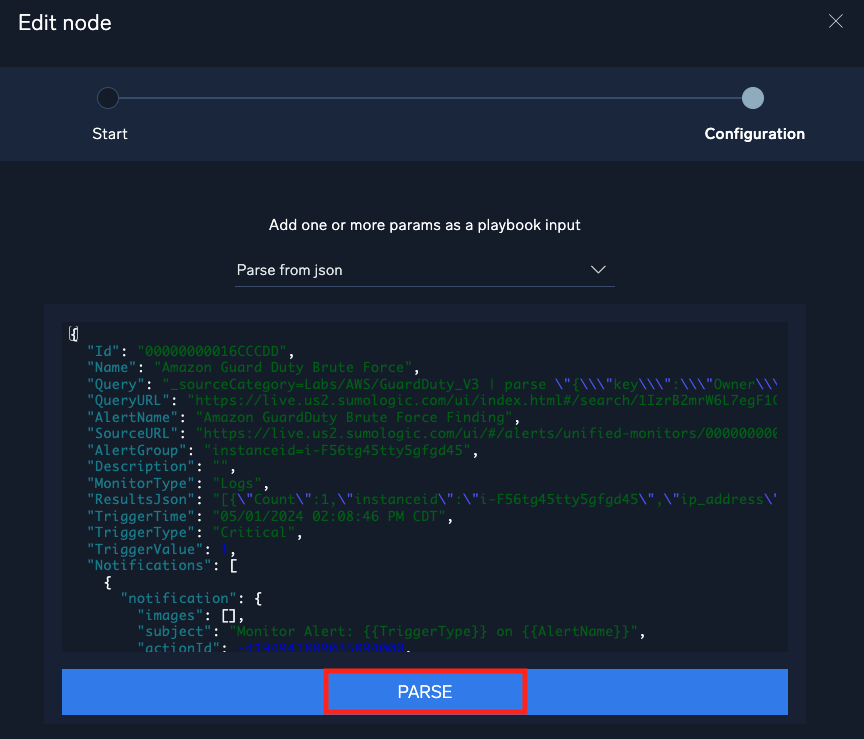
- Add or remove parameters based on the playbook requirements and click Update.