Set Up Webhook Connections
To create a webhook connection, you need the View Connections and Manage Connections role capabilities. Contact your org administrator for assistance.
A webhook is an HTTP callback, which is an HTTP POST that occurs when something happens. Webhook connections allow you to send Sumo Logic alerts to third-party applications that accept incoming webhooks.
For example, once you set up a webhook connection in Sumo Logic and create a scheduled search, you can send an alert from that scheduled search as a post to a Slack channel, or integrate with third-party systems. In addition to an alert, you can include a link directly to a search and even a few search results (depending on the third party tool you're connecting to). There is no limit to the number of webhooks you can send from Sumo Logic, but your third party might impose restrictions. In addition, the payload of a webhook may be restricted by Sumo or the third party.
Along with a fully customizable webhook connection, you can quickly create webhooks for:
- AWS Lambda
- Azure Functions
- Datadog
- Jira
- Microsoft Teams
- New Relic
- Opsgenie
- PagerDuty
- ServiceNow
- Slack
Most services with a REST API should allow you to create a connection using the generic webhook.
If a scheduled search fails or times out, no data will be sent via webhook. In this case, you won’t see any notifications in the app you’ve configured to receive data.
Set up a webhook connection
The first step in integrating webhooks with Sumo Logic is to configure one or more connections, which are HTTP endpoints that tell Sumo Logic where to send data. You can set up any number of connections, depending on your organization's needs.
To set up a webhook connection:
- Classic UI. In the main Sumo Logic menu, select Manage Data > Monitoring > Connections.
New UI. In the top menu select Configuration, and then under Monitoring select Connections. You can also click the Go To... menu at the top of the screen and select Connections. - On the Connections page click the + button on the top right of the table.
- Click Webhook.
- In the Create Connection dialog, enter the Name of the connection.
- (Optional) Enter a Description for the connection.
- Enter the URL for the endpoint. This is generated from the remote system’s API.
info
HTTPS URLs can use any port without restriction, while HTTP URLs are limited to only port 80.
- (Optional) If the third-party system requires an Authorization Header, enter it here. For more information, see Example Authorization Header below.
- (Optional) Custom Headers, enter up to five comma separated key-value pairs.
- (Optional) Under Alert Payload, which allows you to customize how the alert notification will look, enter a JSON object in the format required by the target endpoint. For details on variables that can be used as parameters within your JSON object, see webhook payload variables, below.
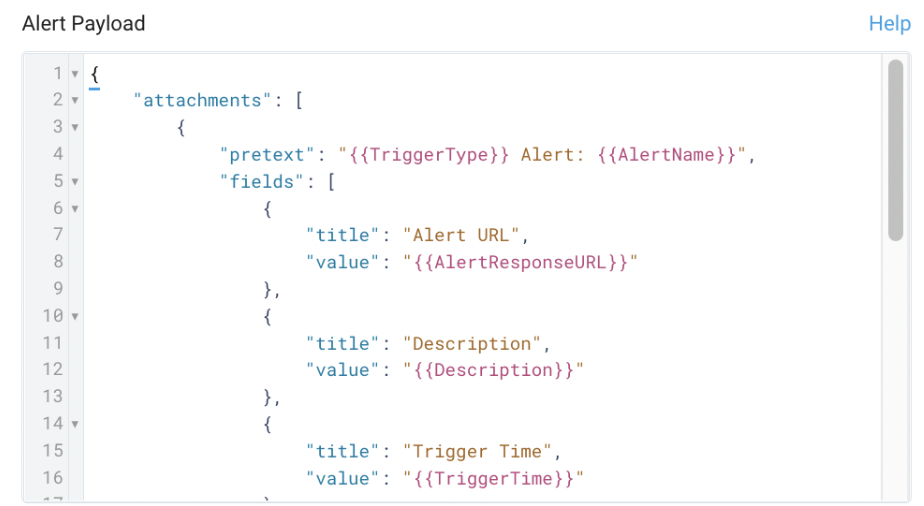 You can test your customized alert payload by clicking Test Alert Payload, which will fire a sample webhook call to the given endpoint.note
Variables are escaped according to the JSON standard, meaning that they can be used in application JSON.
- (Optional) Under Recovery Payload, which allows you to customize how the recovery notification will look, enter a JSON object in the format required by the target webhook URL.
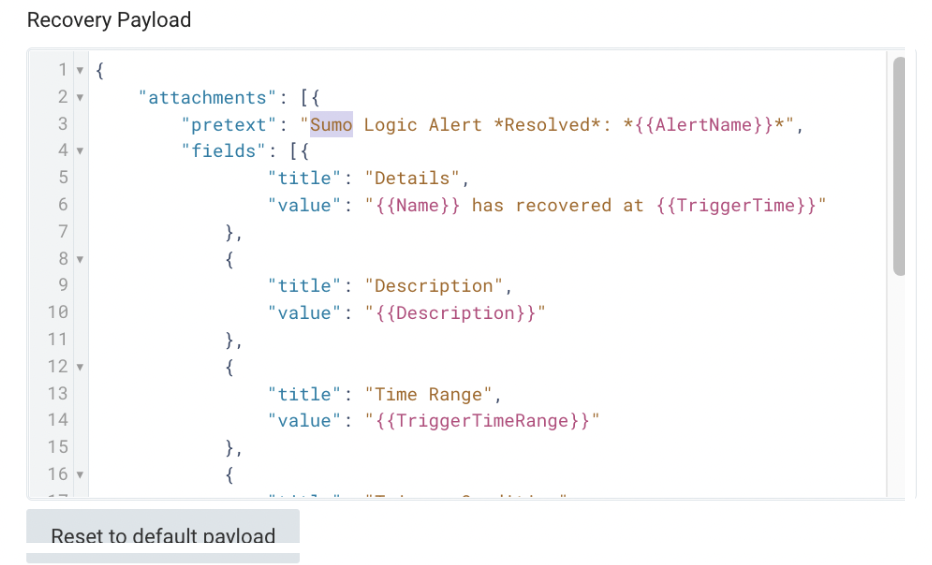
Example: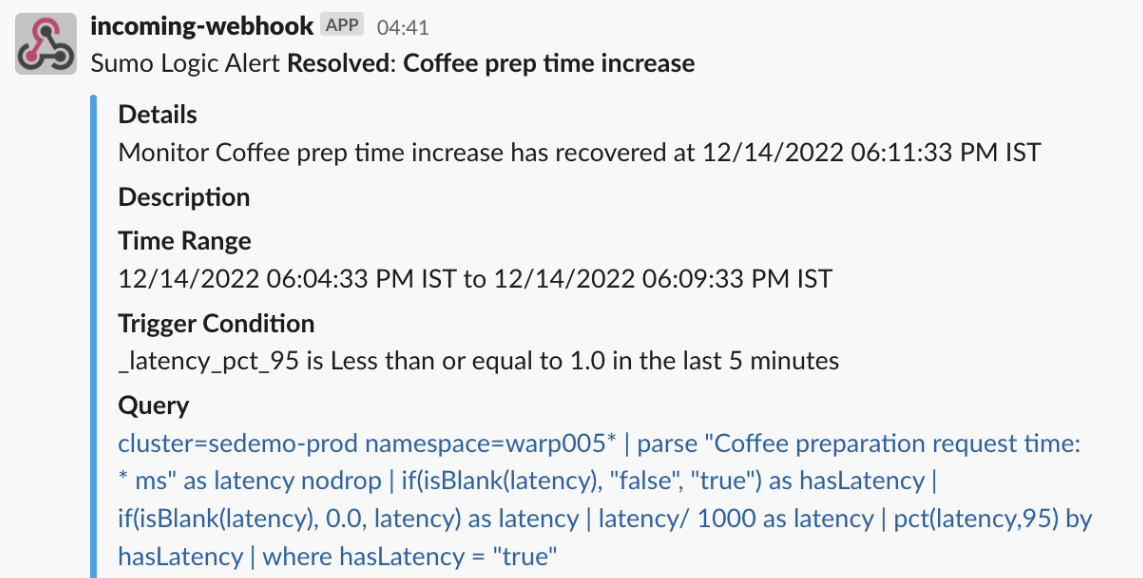
Clicking Test Alert + Recovery Payload will test your recovery alert payload by firing a sample webhook call to the given endpoint. - Click Save.
- When you're ready, create a scheduled search to send alerts to this connection.
Configure Webhook payload variables
Variables are used as parameters in the JSON payload object of your alert notifications. These variables are used to dynamically populate specific values from the alert configuration in the notification payload. It includes things like the TriggerType that gives the current monitor status in the notification. When a notification is sent variables are replaced with values from the alert. For example, if you specified {{Name}} in your JSON payload, it would be replaced with the actual name of the alert in the delivered payload.
Variables must be enclosed by double curly brackets.
Common variables for alerts
You can use variables to customize your notification payload from Monitors and Scheduled Searches. The table below shows a list of variables along with information on which area of the product these are supported. We have also provided a brief description of each of the variables.
All variables are case-insensitive.
| Variable | Description | Monitors | Scheduled Searches |
|---|---|---|---|
{{Name}} | The name of the alert. In the delivered payload, this variable is replaced with the Name you assigned to the alert when you created it. | ||
{{Description}} | The description of the alert. | ||
{{MonitorType}} | The type of alert, either Logs or Metrics. | ||
{{Query}} | The query used to run the alert. | ||
{{QueryURL}} | The URL to the logs or metrics query within Sumo Logic. | ||
{{ResultsJson}} | JSON object containing the query results that triggered the alert. A maximum of 200 aggregate results or 10 raw messages for this field can be sent via webhook. | Not available with Email notifications | |
{{ResultsJson.fieldName}} | The value of the specified field name. For example, this payload specification:{{ResultsJson.client_ip}} had {{ResultsJson.errors}} errorsResults in a subject line like this: 70.69.152.165 had 391 errorsA maximum of 200 aggregate results or 10 raw messages for this field can be sent via webhook. A field name must match (case-insensitive) the field from your search and must be alphanumeric characters, underscores, and spaces. If you have a field name that has an unsupported character use the as operator to rename it. You can return a specific result by providing an array index value in bracket notation. Such as, {{ResultsJson.fieldName}}[0] to return the first result.Reserved Fields The following are reserved field names. They are generated by Sumo Logic during collection or search operations.
| ||
{{NumQueryResults}} | The number of results the query returned. Results can be raw messages, time-series, or aggregates. An aggregate query returns the number of aggregate results; displayed in the Aggregates tab of the Search page. A non-aggregate query returns the number of raw results; displayed in the Messages tab of the Search page. | ||
{{Id}} | The unique identifier of the monitor or search that triggered the alert. For example, 00000000000468D5. | ||
{{DetectionMethod}} | This is the type of Detection Method used to detect alerts. Values are based on static or outlier triggers and data type, either logs or metrics. The value will be either LogsStaticCondition, MetricsStaticCondition, LogsOutlierCondition, MetricsOutlierCondition, LogsMissingDataCondition, MetricsMissingDataCondition, or StaticCondition (deprecated). | ||
{{TriggerType}} | The status of the alert or recovery. Alert will have either Normal, Critical, Warning, or Missing Data. Recovery will have either ResolvedCritical, ResolvedWarning, or ResolvedMissingData. | ||
{{TriggerTimeRange}} | The time range of the query that triggered the alert. For example:07/13/2021 03:21:32 PM UTC to 07/13/2021 03:36:32 PM UTC | ||
{{TriggerTime}} | The time the monitor was triggered. For example:07/13/2021 03:38:30 PM UTC. | ||
{{TriggerCondition}} | The condition that triggered the alert. For example:Greater than or equal to 1.0 in the last 15 minutes | ||
{{TriggerValue}} | The value that triggered the alert. | ||
{{TriggerTimeStart}} | The start time of the time range that triggered the monitor in Unix format. For example, 1626189692042. | ||
{{TriggerTimeEnd}} | The end time of the time range that triggered the monitor in Unix format. For example, 1626190592042. | ||
{{SourceURL}} | The URL to the configuration or status page of the monitor in Sumo Logic. | ||
{{AlertResponseUrl}} | When your Monitor is triggered it will generate a URL and provide it as the value of this variable where you can use it to open Alert Response. |
Legacy variables
This section provides the old variables available for alert notifications from Metrics Monitors and Scheduled Searches. The following table shows where the old variables are supported.
We recommend using the new common variables instead of these legacy variables, which will be deprecated.
| Variable | Description | Metrics Monitors | Scheduled Searches |
|---|---|---|---|
{{SearchName}} | |||
{{SearchDescription}} | Description of the saved search or Monitor. In the delivered payload, this variable is replaced with the Name you assigned to the search or Monitor when you created it. | ||
{{SearchQuery}} | The query used to run the saved search. In the delivered payload, this variable is replaced by your saved search query or metric query. | ||
{{SearchQueryUrl}} | The URL to the search or metrics query. In the delivered payload, this is a URL that you can click to run the saved logs or metric query. | ||
{{TimeRange}} | The time range that triggered the alert. | ||
{{FireTime}} | The start time of the log search or metric query that triggered the notification. | ||
{{AggregateResultsJson}} | JSON object containing search aggregation results. A maximum of 200 aggregate results can be sent via webhook. | Not available with Email notifications | |
{{RawResultsJson}} | JSON object containing raw messages. A maximum of 10 raw messages can be sent via webhook. | Not available with Email notifications | |
{{NumRawResults}} | Number of results returned by the search. | ||
{{Results.fieldname}} | The value returned from the search result for the specified field. For example, this payload specification:{{Results.client_ip}} had {{Results.errors}} errorsResults in a subject line like this: 70.69.152.165 had 391 errorsA maximum of 200 aggregate results or 10 raw messages for this field can be sent via webhook. A field name must match (case-insensitive) the field from your search and must be alphanumeric characters, underscores, and spaces. If you have a field name that has an unsupported character use the as operator to rename it. | ||
{{AlertThreshold}} | The condition that triggered the alert (for example, above 90 at least once in the last 5 minutes) | ||
{{AlertSource}} | The metric and sourceHost that triggered the alert, including associated tags for that metric. | ||
{{AlertSource.fieldname}} | The value returned from the AlertSource object for the specified field name. | ||
{{AlertID}} | The ID of the triggered alert. | ||
The ID of the triggered alert. | Current status of the time series that triggered (for example, Critical or Warning). | ||
{{AlertCondition}} | The condition that triggered the alert. |
Example payloads
Slack payload
{
     "attachments": [
         {
             "pretext": "Sumo Logic Alert for: *{{Name}}* by user USERNAME",
             "fields": [
                 {
                     "title": "Description",
                     "value": "{{Description}} {{TriggerTimeStart}}"
                 },
                 {
                     "title": "Query",
                     "value": "<{{QueryURL}}|{{Query}}>"
                 },
                 {
                     "title": "Time Range",
                     "value": "{{TriggerTimeRange}}"
                 }
             ],
             "mrkdwn_in": ["text", "pretext"],
             "color": "#29A1E6"
         }
     ]
}
PagerDuty payload
{
    "service_key": "xxxxx",
    "event_type": "trigger",
    "description": "Monitor Alert on {{Name}}",
    "client": "Sumo Logic",
    "details": {
        "name": "{{Name}}",
        "query": "<{{QueryURL}} | {{Query}}>",
        "time": "{{TriggerTimeRange}} -- {{TriggerTime}} --"
    }
}
Email message
Monitor Alert: {{TriggerTimeRange}} on {{Name}}
Flat JSON
This example payload is flat JSON.
{
    "text": "{{Name}} ran over {{TimeRange}} at {{FireTime}}",
    "results": "{{ResultsJson}}",
     "num": "{{NumQueryResults}}"
}
Hierarchical JSON
This example payload is hierarchical JSON.
{ "event_type": "trigger",
    "description": "{{Description}}",
    "client": "Sumo Logic",
    "client_url": "{{SearchQueryUrl}}",
    "details": {
        "name: {{Name}}, time: {{TimeRange}}--{{FireTime}}, num: {{NumQueryResults}}, results: {{ResultsJson}}"
    }
}
Example payload fields
All variables must be enclosed in quotes to be interpreted as valid JSON.
You can validate your JSON at sites like jsonlint.com.
For the following example message:
{
   "thread": "conciergePartitioner-1",
   "user_id": "",
   "user_name": "",
   "web_session": "",
   "Message": "2015-10-27 10:31:15,853 -0700 INFO Partitioned 0 tokens, 2 targets into 773 assignments"
}
the following is the payload configuration. Notice that RawResultsJson is enclosed in quotes.
{
   "channel": "ops",
   "text": "{{ResultsJson}}"
}
The following valid JSON is sent in the payload of the POST request.
{"channel": "ops", "text": "{\"thread\":\"conciergePartitioner-1\",\"user_id\":\"\",\"user_name\":\"\",\"web_session\":\"\",\"Message\":\"2015-10-27 10:31:15,853 -0700 INFO Partitioned 0 tokens, 2 targets into 773 assignments\"}
Example authorization header
Use HTTP Basic Authentication, this is a standard used across the world wide web, Sumo Logic doesn't require anything different or special. The username and password are concatenated, base64-encoded, and passed in the Authorization HTTP header. The Authorization field is constructed as follows:
- Combine the username and password with a single colon.
- Encode using the RFC2045-MIME variant of Base64. You can use any encoder, including the base64 search operator to do this.
- The authorization method and a space, such as "Basic " is then put before the encoded string.
For example, if the user agent uses Aladdin as the username and OpenSesame as the password then the field could be formed with a
simple bash command as follows:
echo -n "Aladdin:OpenSesame" | base64
The -n ensures that an extra new line is not encoded.
yielding a string 'QWxhZGRpbjpPcGVuU2VzYW1l' that is used like this:
Authorization: Basic QWxhZGRpbjpPcGVuU2VzYW1l
So in the Authentication Header field, you would enter:
Basic QWxhZGRpbjpPcGVuU2VzYW1l
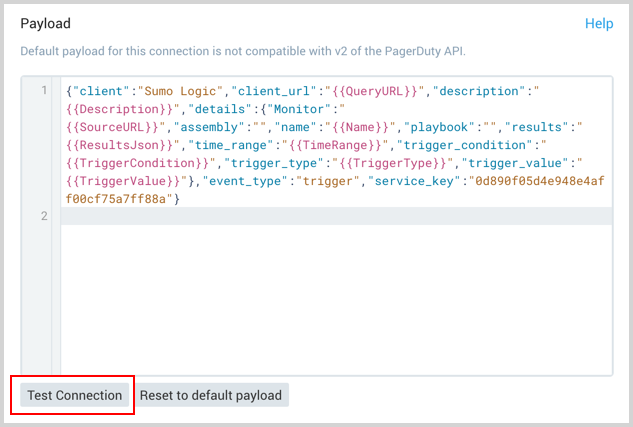
Test a connection
After configuring the connection, click the Test Connection button at the bottom left of the Payload area. If the connection is made, you will see a 200 OK response message.
This test does not use the same static IP addresses that send notifications, it uses different temporary IP addresses.
If the connection is successful, you'll see a message appearing in the third-party tool. This won't contain any information from the scheduled search, it will just have the text in the payload.
Troubleshooting Webhook payload
If the integration is not working as expected, there shall be a payload issue. You shall need to troubleshoot the generated payload. Here are some HTTP debugging tools that shall help you capture the generated payload and troubleshoot.
- Beeceptor. Helps troubleshoot HTTP payload and configuration issues when working with webhooks and HTTP POST requests. You can inspect the JSON payload in real-time, enabling you to gain insights into the data being sent and received.
- Request Inspector. Helps you in capturing HTTP requests and responding with
200 OK. You can review the raw payload and find discrepancies between actual and expected.
Editing and deleting connections
If a connection is changed, all scheduled searches that link to the connection are changed moving forward. No changes are made to previous searches.
If a connection is deleted, the searches sent to those connections are not deleted. To delete these searches, use the Library.