Real User Monitoring Metrics
RUM metrics are automatically generated for you from browser traces. They provide insight into your website's overall user experience as well as front-end services, operating systems, geographical locations, and top-loaded page groups and user cohorts categorized by their browsers.
Metrics are collected for user actions representing document loads, which means actual retrieval and execution of web documents in the browser as well as XHR calls and route changes. Measurements include W3C navigation timings, XHR delays, Core Web Vitals KPIs, longtask events (delays) and others.
For ad hoc queries, you can find these metrics in Metrics Explorer by querying for:
_contenttype=rummetricfromtrace
Document load metrics
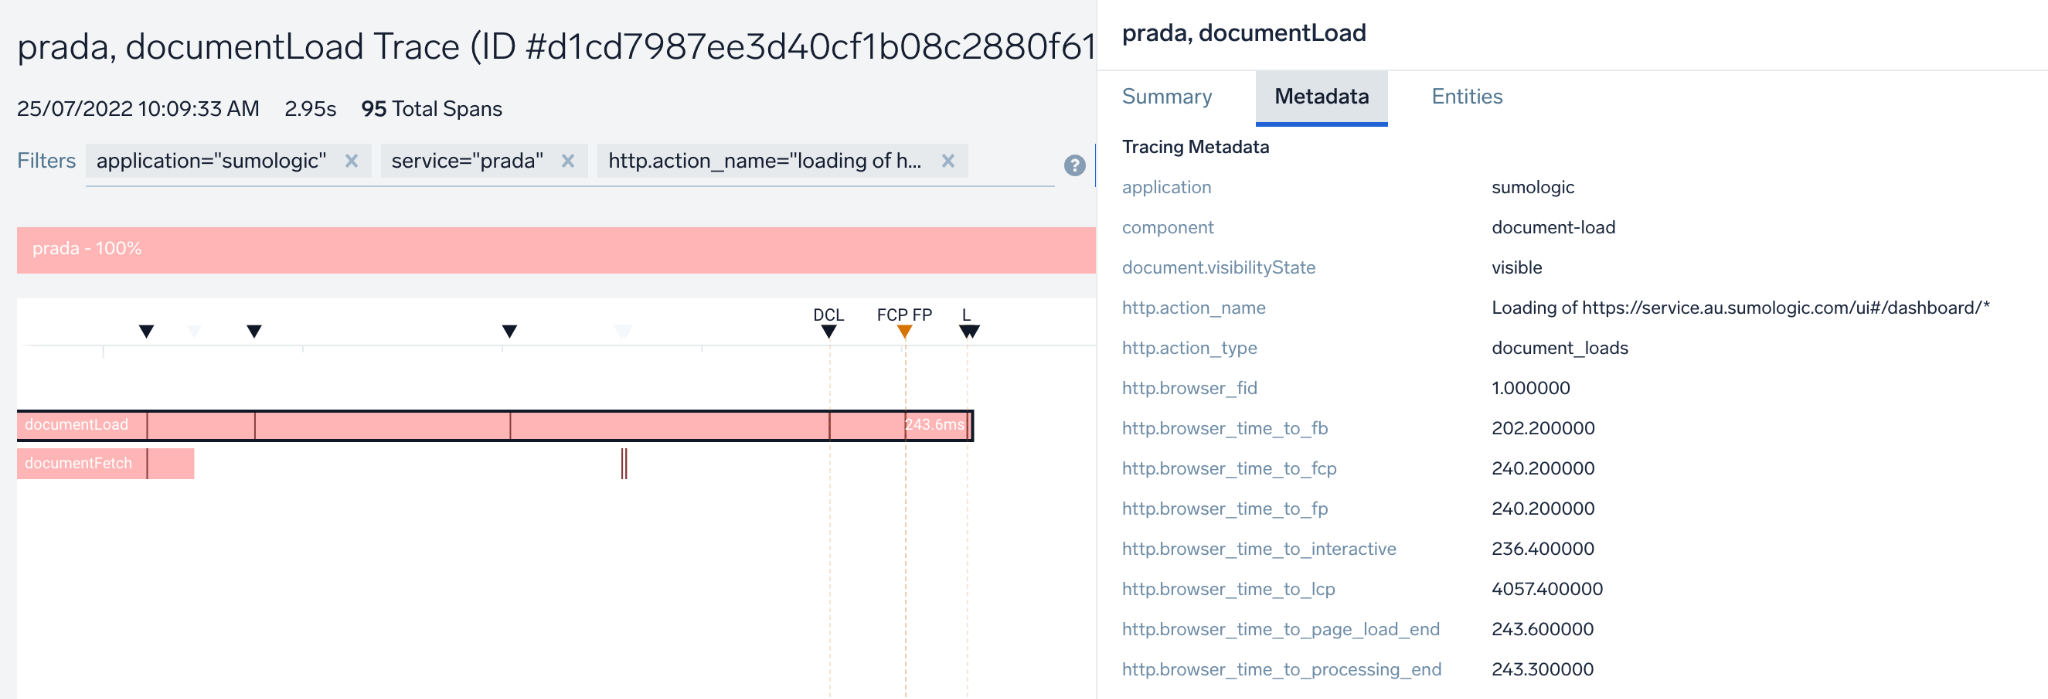
The following document load metrics are collected from JavaScript. These are available in each trace in the documentLoad and documentFetch spans as span events in the details panel and also used in the Real User Monitoring app to populate the Website Performance and UI Paint Timings panels.
These metrics, presented in the form of areas on the Website Performance panels on RUM dashboards, can help you understand the sequence of events (pictured below) from user clicks to a fully loaded document.
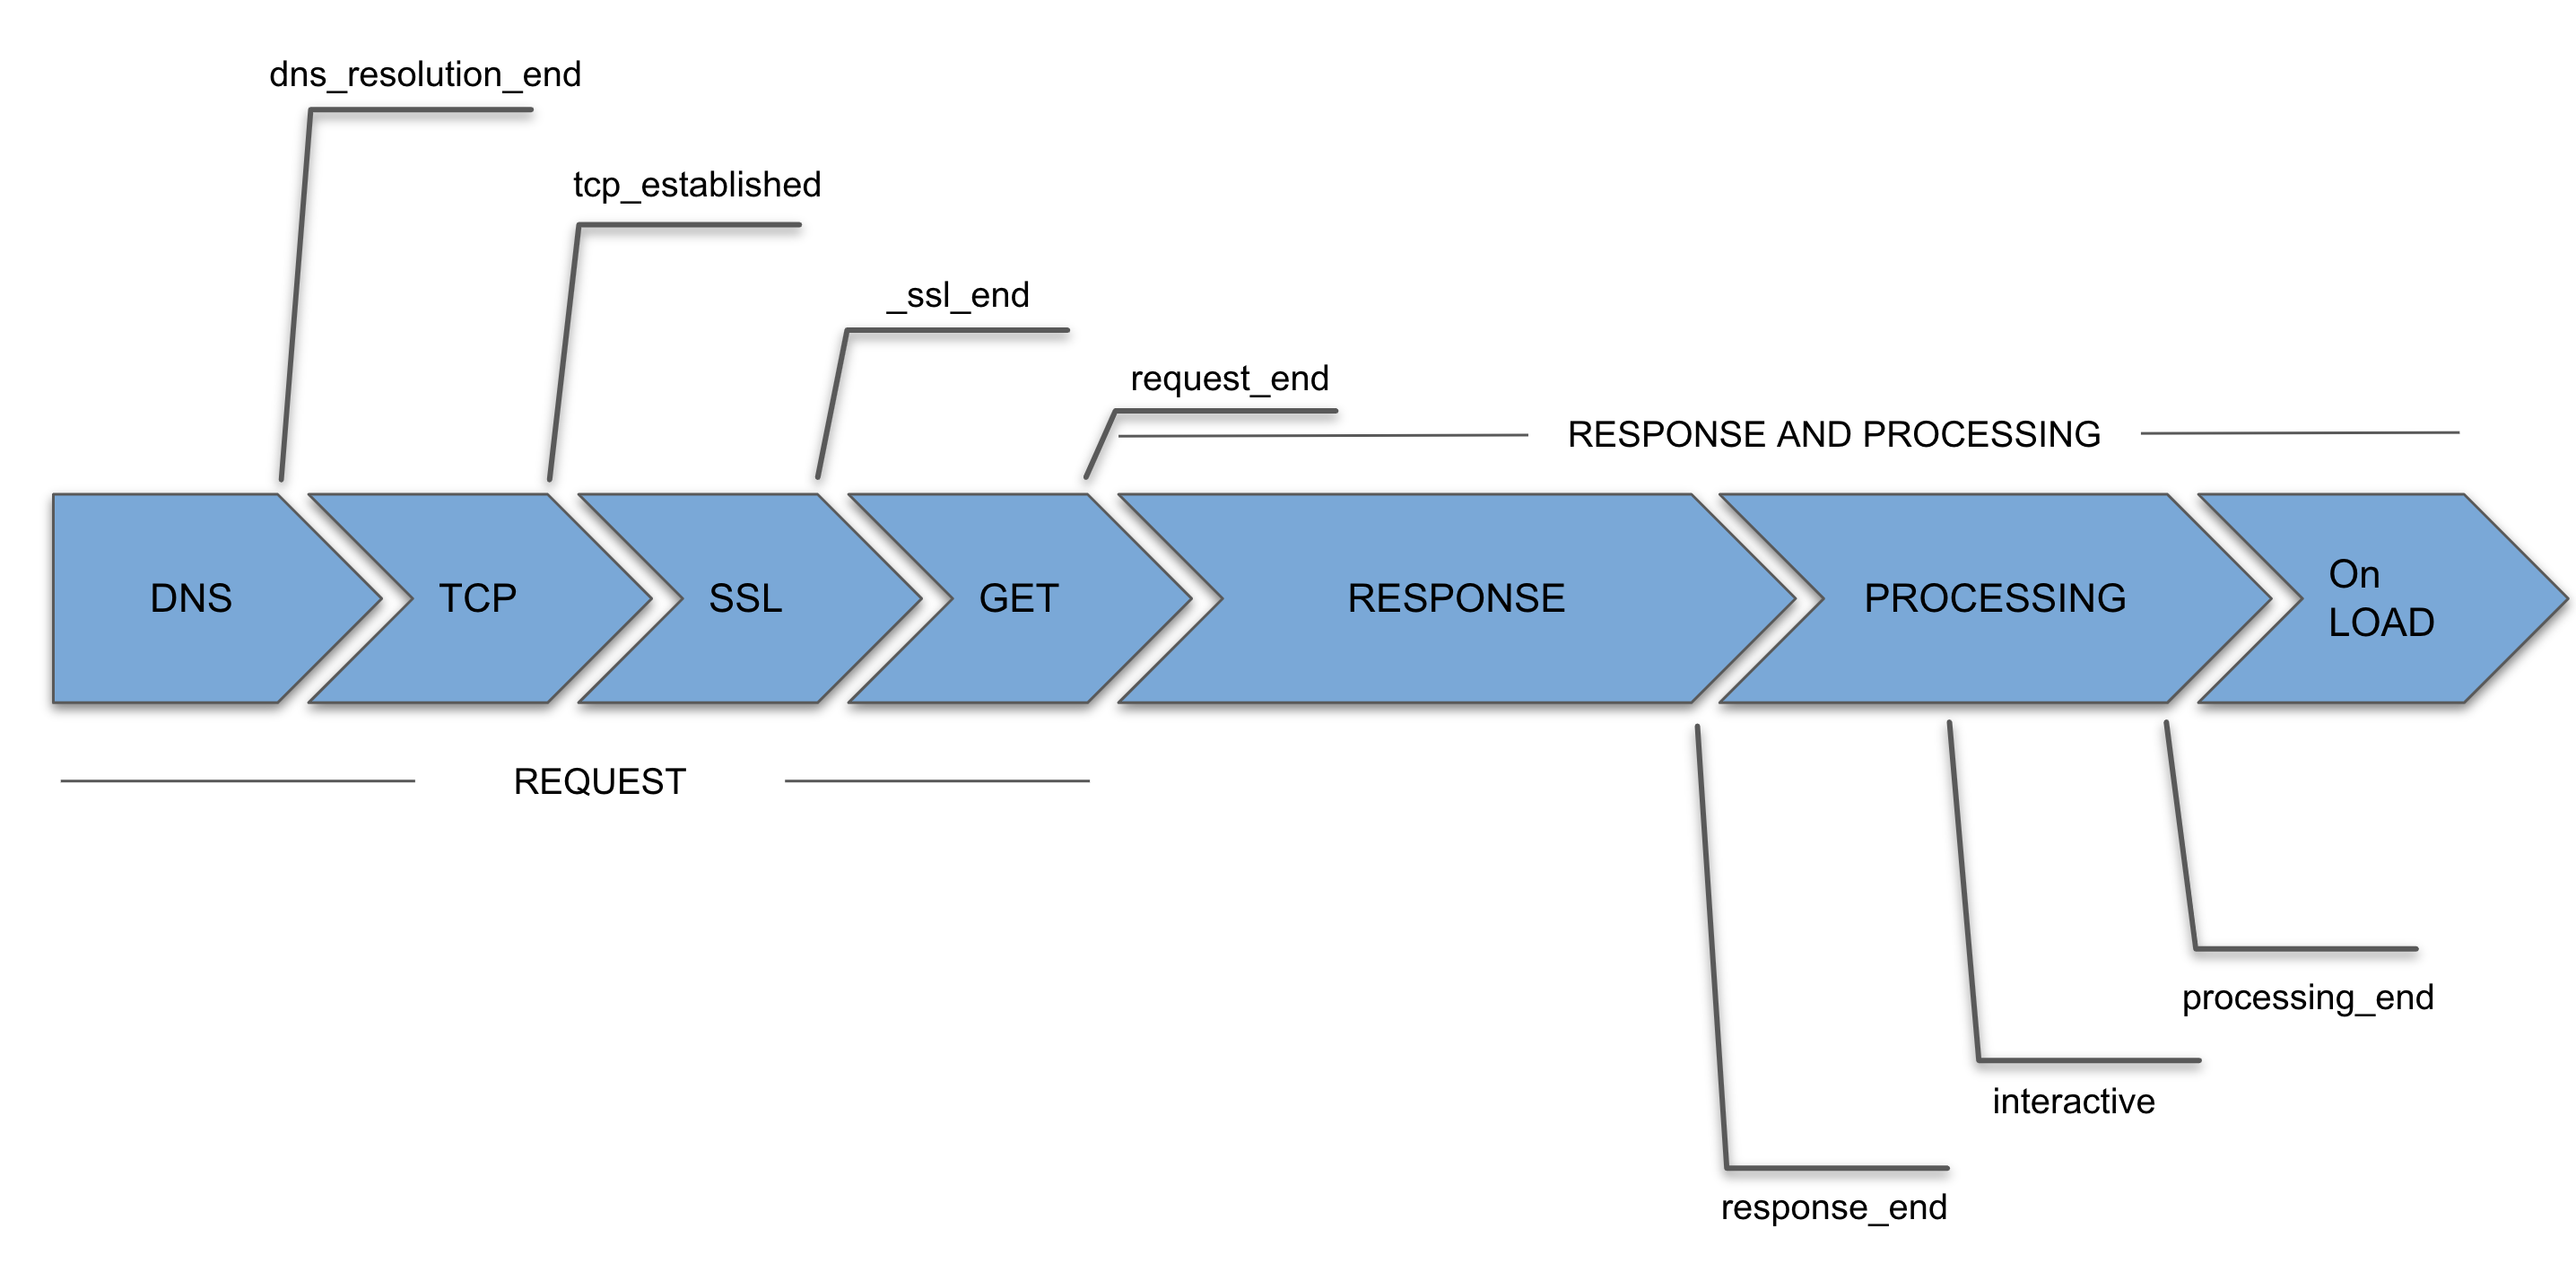
Timing metrics are not calculated if the visibility state of the document is "hidden" at any point during the load.
See W3C navigation timing for details on how an interface for web applications defines its access timing information concerning navigation and other elements.
browser_time_to_dns_resolution_end
Calculation. domainLookupEnd - span start time (fetch start).
browser_time_to_ssl_end
Calculation. if secureConnectionStart > 0: connectionEnd - span start time (fetch start) else NaN.
browser_time_to_tcp_established
Calculation. if secureConnectionStart > 0: secureConnectionStart - span start time (fetch start) else connectionEnd - span start time (fetch start).
browser_time_to_request_end
Calculation. responseStart - span start time (fetch start).
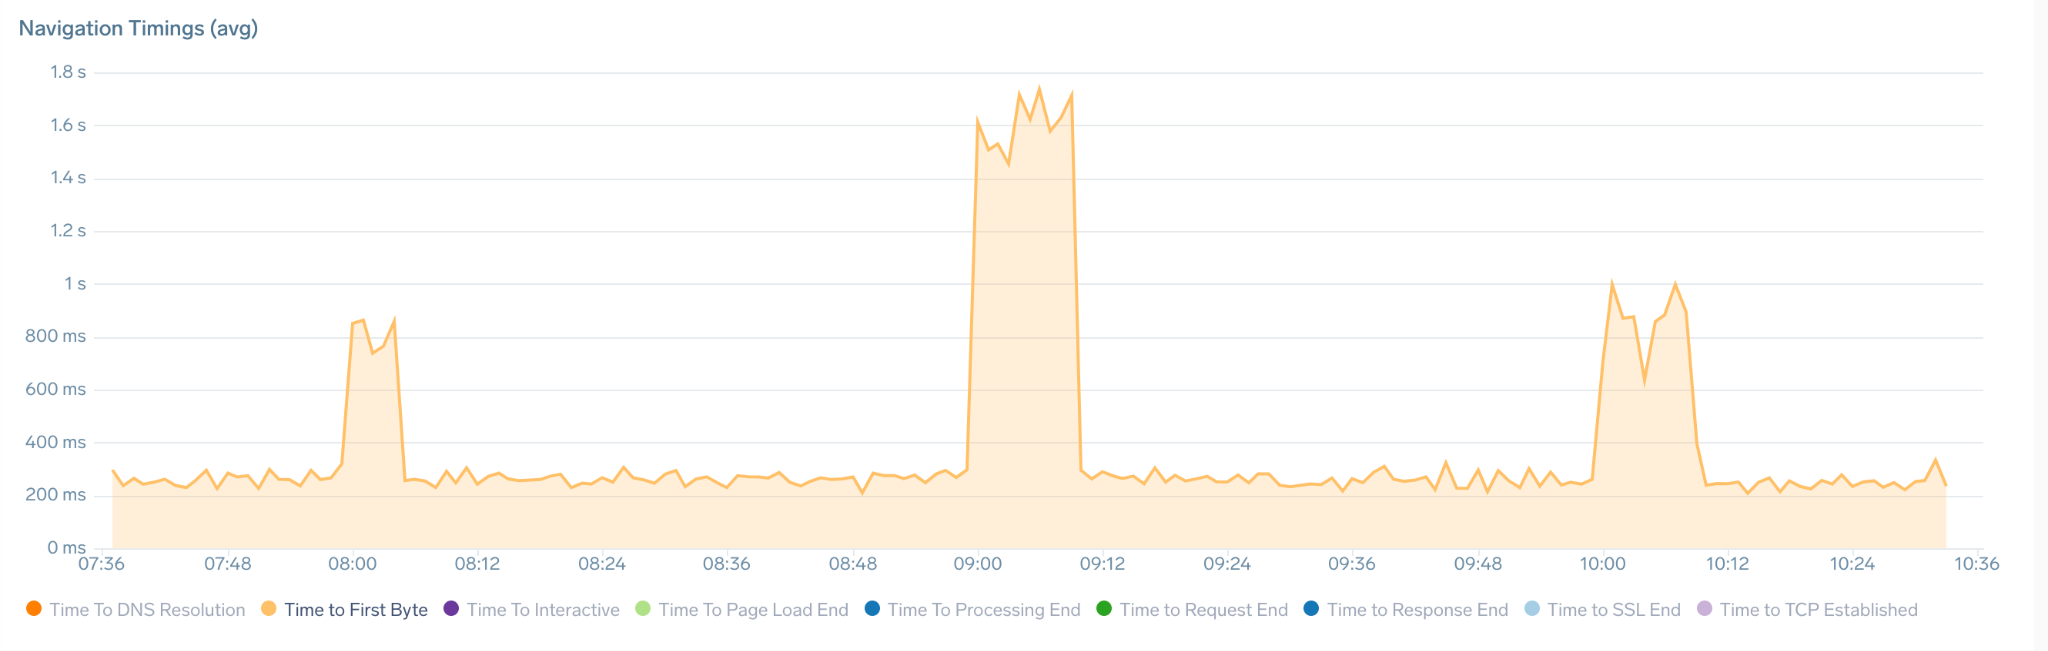
browser_time_to_fb
Calculation. responseEnd - span start time (fetch start).
This metric, Time to first byte, measures the delay between start of the page load and moment when the first byte of the response appears. It helps identify when a web server is too slow to respond to requests. You'll find this metric on the Navigation Timings chart.
browser_time_to_response_end
Calculation. domInteractive - span start time (fetch start).
browser_time_to_interactive
Calculation. domComplete - span start time (fetch start).
browser_time_to_processing_end
Calculation. loadEventEnd - span start time (fetch start).
Rendering events metrics
These metrics, which populate in the UI Paint Timings panel on RUM dashboards, explain rendering events inside the user's browser.
browser_time_to_fp
Calculation. firstPaint - span start time (fetch start).
First Paint measures the time from page fetch start (span start time) to the moment when the browser renders the first pixels to the screen, rendering anything that is visually different from what was on the screen prior to navigation. It answers the question, "Is it happening?"
browser_time_to_fcp
Calculation. firstContentfulPaint - span start time (fetch start).
First Contentful Paint measures the time from page fetch start (span start time) to the moment when any part of the page's content is rendered on the screen. For this metric, "content" refers to text, images (including background images), <svg> elements, or non-white <canvas> elements.
browser_time_to_lcp
Calculation. largestContentfulPaint - span start time (fetch start).
Largest Contentful Paint measures the time from page fetch start (span start time) to the moment when the largest image or text block visible within the viewport is rendered.
These are only loosely related to navigation timings and in many cases, some of them may appear long after the page is fully loaded in the browser, which indicates rendering slowdowns.
Core Web Vitals metrics
Core Web Vitals (CWV) is an initiative by Google that defines web page KPIs. Each CWV represents a distinct facet of the user experience that's measurable in the field and reflects the real-world experience of a critical user-centric outcome.
CWV focuses on three aspects of the user experience: document loading, interactivity, and visual stability. This includes the following metrics (and their respective thresholds): browser_time_fid, browser_time_to_lcp, and browser_cls.
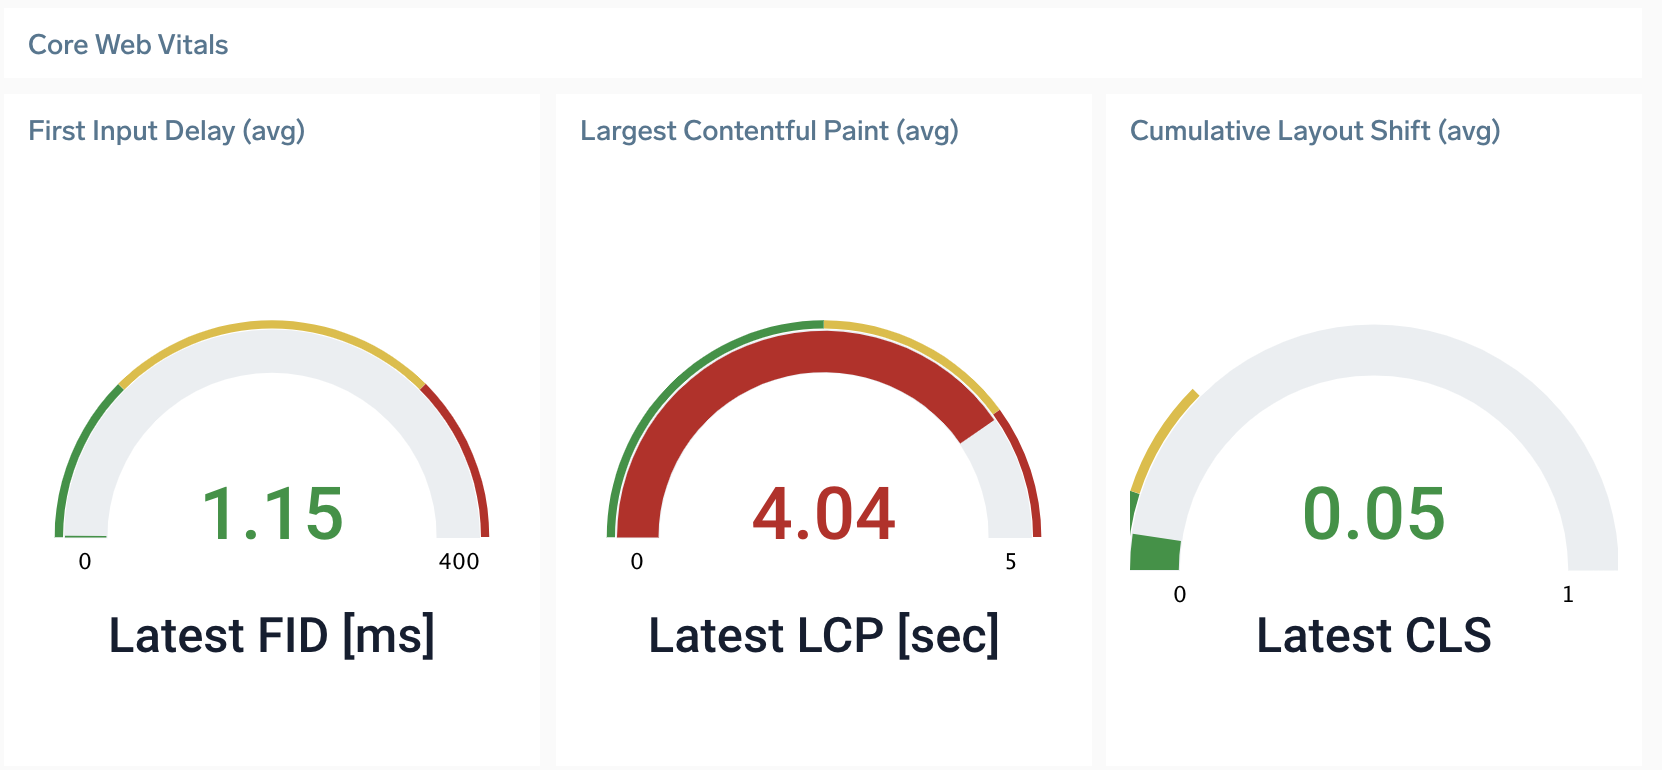
These CWV KPIs are captured and displayed on Overview dashboards for Document Load action types. Detailed metrics are available in span metadata for every transaction trace.
browser_time_fid
Calculation. From CVW First Input Delay API.
First Input Delay (FID) measures interactivity. To provide a good user experience, pages should have a FID of 100 milliseconds or less.
browser_time_to_lcp
Calculation. largestContentfulPaint - span start time (fetch start).
Largest Contentful Paint (LCP) measures loading performance. To provide a good user experience, LCP should occur within 2.5 seconds of when the page first starts loading.
browser_cls
Calculation. From CVW Cumulative Layout Shift API.
Cumulative Layout Shift (CLS) measures visual stability. To provide a good user experience, pages should maintain a CLS of 0.1 or less.
XHR monitoring metrics
Currently, XHR metrics extraction in RUM is only supported for applications that use the fetch API to perform XHR calls. If your application uses XMLHttpRequest, metrics may not be collected at this time. A fix to support XMLHttpRequest-based calls is in progress and expected to roll out in mid 2025. We will update this page when that support becomes available.
An XMLHttpRequest (XHR) is a way for browsers to communicate with a backend server without reloading the page. For example, a page may use XHR to update a price ticker automatically or after clicking an "Update Price" button.
XHR is commonly used in single-page applications (SPAs), which load once and then handle all interactions without refreshing the page. These apps often generate multiple XHR requests—typically HTTP POST or GET calls—based on user actions.
Sumo Logic provides monitoring coverage for XHR interactions, including the following performance timings:
browser_time_to_first_xhr
Time from the UI interaction until the first HTTP POST appears.
browser_time_to_last_xhr
Time from the UI interaction until the last HTTP POST ends.
browser_time_to_xhr_processing_end
Time from the UI interaction until all browser-side processing of all XHR requests is completed.
browser_time_in_xhr_calls
The total time when the transaction was “busy” executing XHR communication.
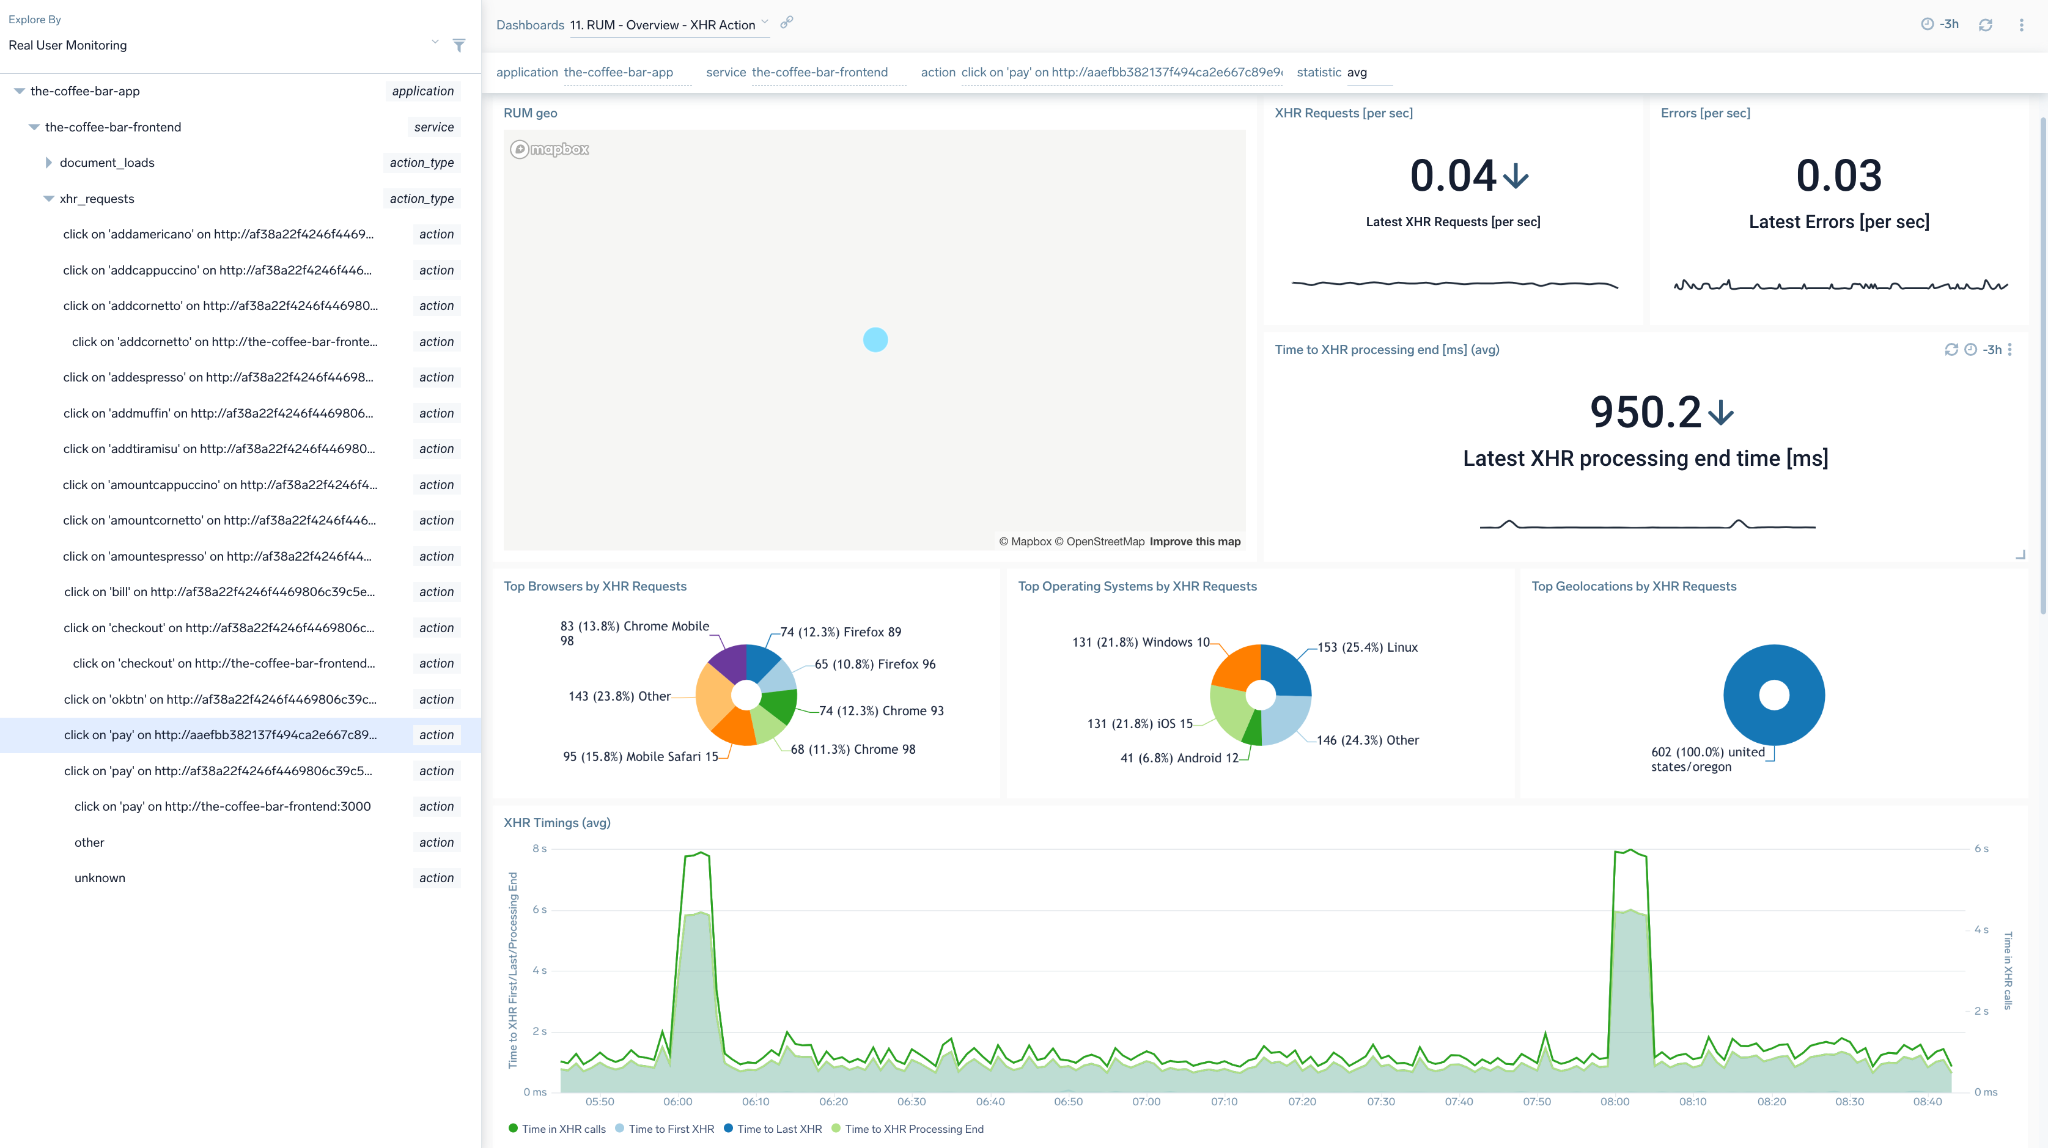
In addition to these metrics, the system also measures how many XHR requests have been generated and identifies the user action that triggered the XHRs by blending the UI interaction (e.g., “click on Pay”) with the page name (e.g., http://www.acme.com/checkout). This results in an action name like "Click on Pay on http://www.acme.com/checkout". Any erroneous HTTP responses to XHR POST calls are counted as XHR errors.
We also measure any erroneous HTTP responses to XHR POST calls, counting them as XHR errors, and provide drill-down capabilities via EI to specific traces that explain the full process of loading and executing each transaction.
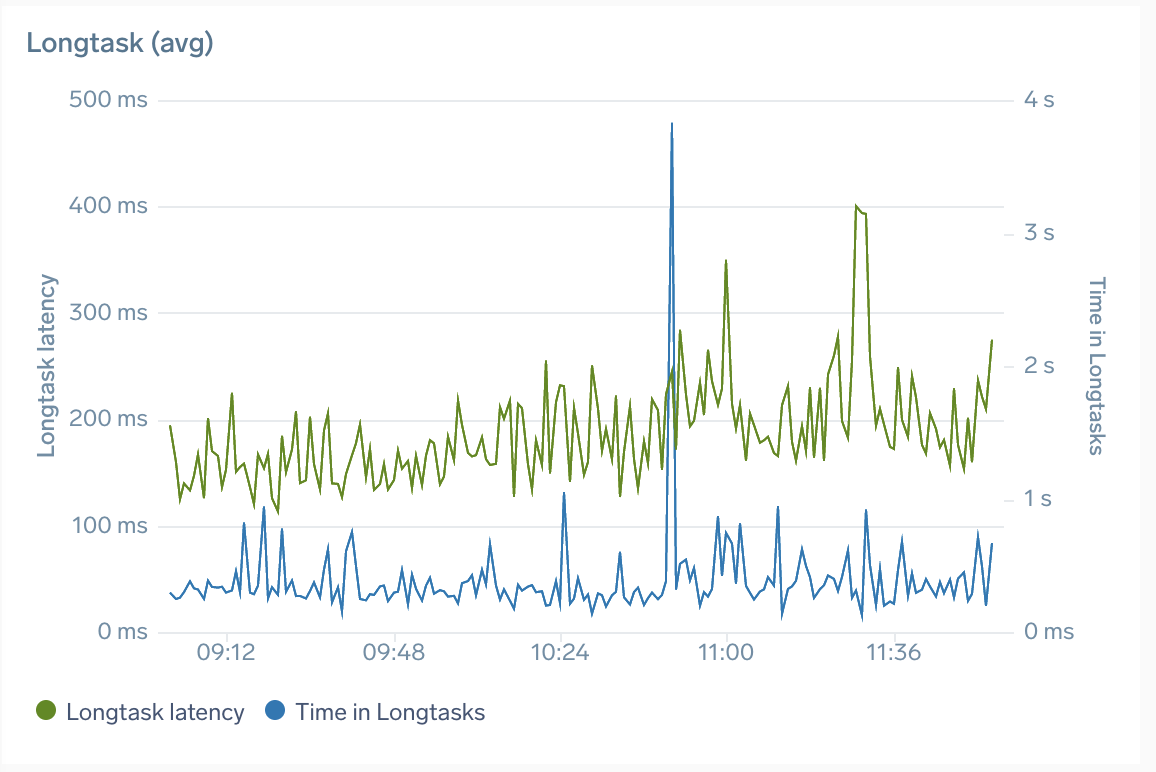
Longtask delay metrics
This section describes how to trace and measure Longtask delays, which is when the main browser UI thread becomes locked for extended periods (greater than 50 milliseconds) and blocks other critical tasks (including user input) from being executed.
This impacts the user's experience. They can perceive this as a "frozen browser”, even if the communication with the backend has long been completed. RUM automatically captures such events and:
- Displays them as individual spans marking how long the browser was frozen
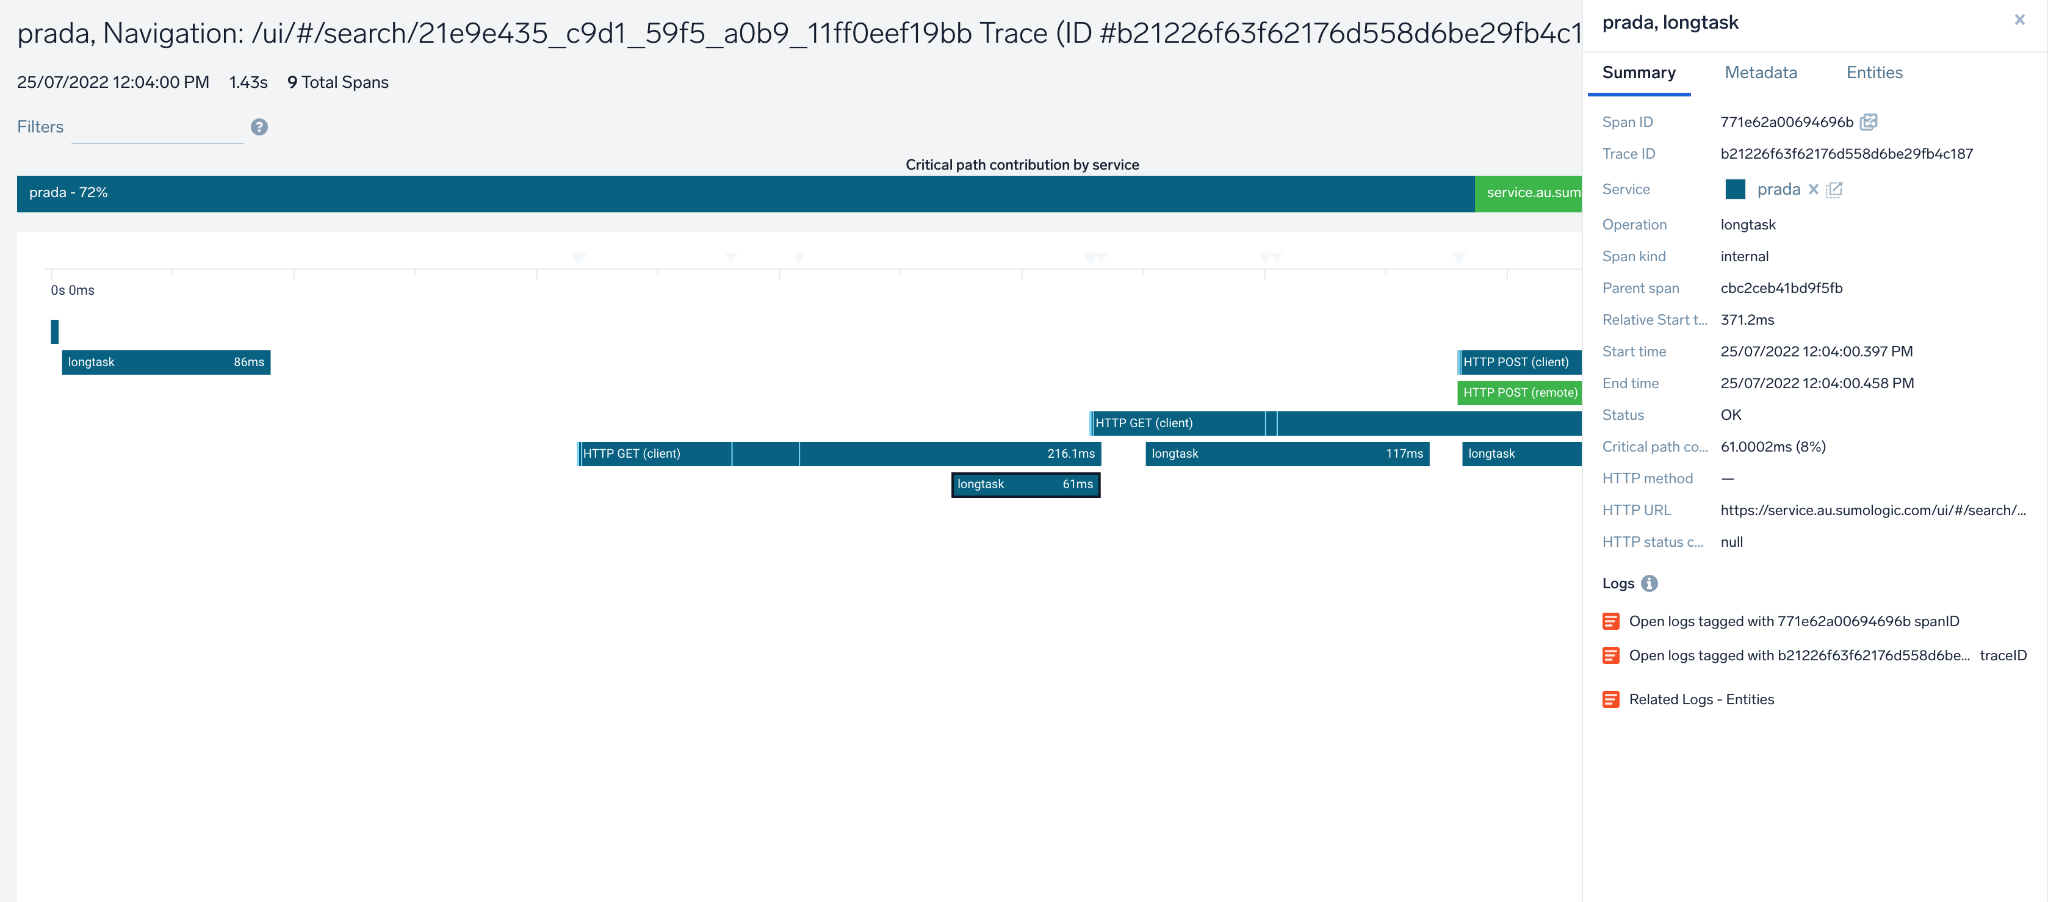
- Aggregates the above data into two metrics:
- Longtask delay: average duration of longtask span
- Time in longtasks: total time spent in longtasks per user action/trace