View and Investigate Traces
You can visualize your Traces data through filtered trace lists and icicle charts. These visualizations will help you find and troubleshoot faulty transactions easily.
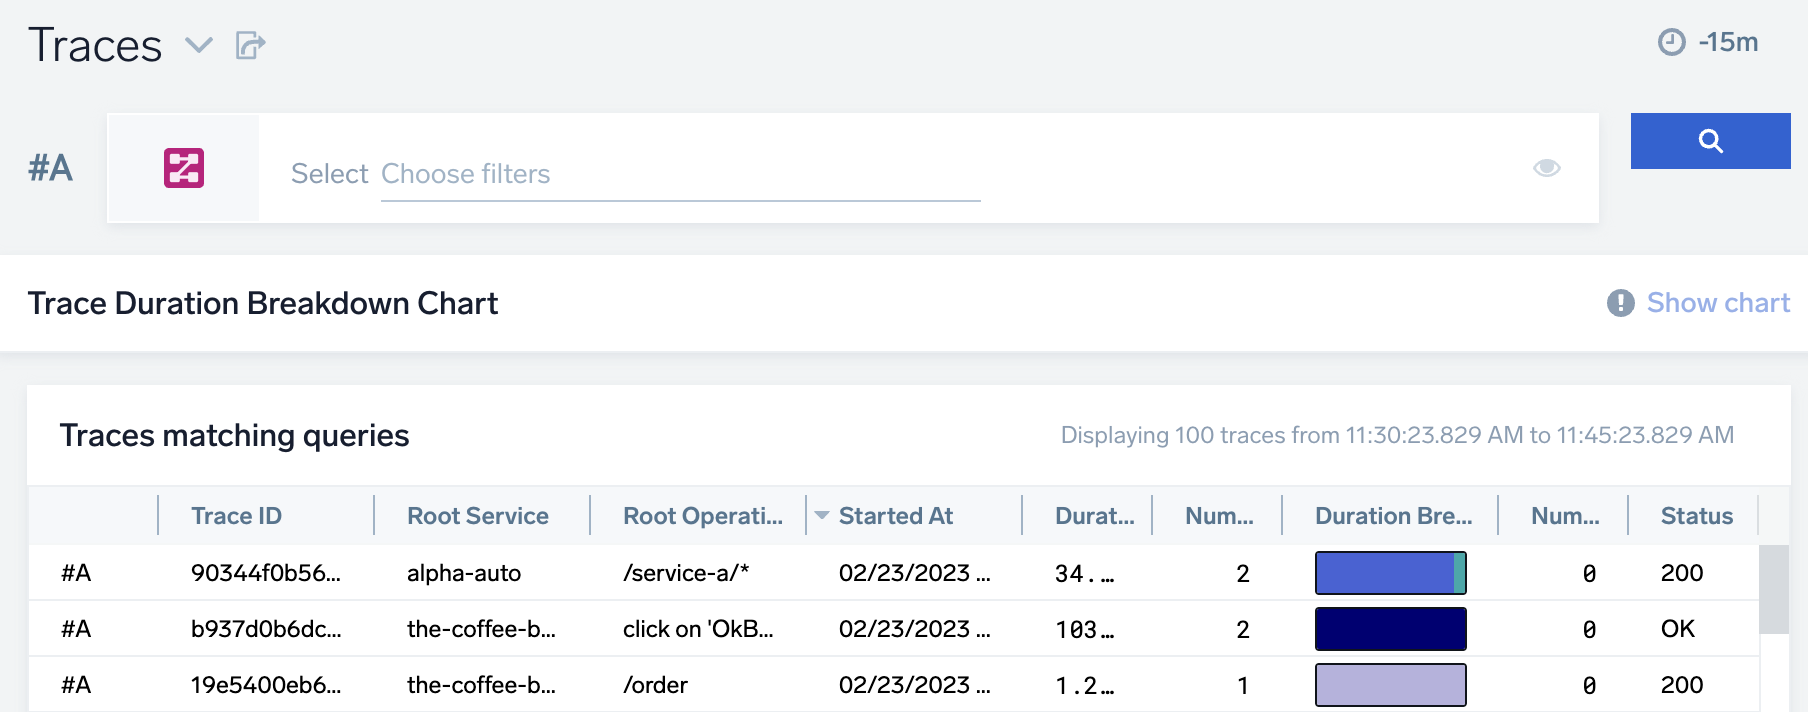
Traces page
Classic UI. To access Traces, go to the Home screen and select Traces.
New UI. In the main Sumo Logic menu, select Observability, and then under Application Monitoring, select Transaction Traces. You can also click the Go To... menu at the top of the screen and select Transaction Traces.
Here, you can run a Trace query, view your Trace Duration Breakdown Chart, and explore your Traces matching queries table.
Trace queries
Just above the Traces table, you'll see an input field for you to write a Trace query. Trace queries allows you to search for traces representing transaction flows through your system, using the following filters:
- Root Service. name of the service that started the trace
- Any Service. name of a service that took part in the trace
- Duration. time in milliseconds of the trace
- Number of spans.
- Number of errors.
As well as any other metadata standard or custom we may find in spans. All metadata in all spans are automatically indexed and searchable up to following limits:
- up to 64MB of all metadata per each trace
- up to 10000 unique tag names per retention period per org
- up to 1024 unique tag names per trace
- tags with names longer than 64 chars are not indexed
- tags with values over 4096 chars are not indexed
spanidandparentspanidare not indexed in Traces search, but searchable through span analytics
Write a Trace query
To write a Trace query, click on the Choose filters input line. You can select the desired filter type and value from the dropdown menu or manually type them. Multiple filters are allowed in a query row, AND is implicit.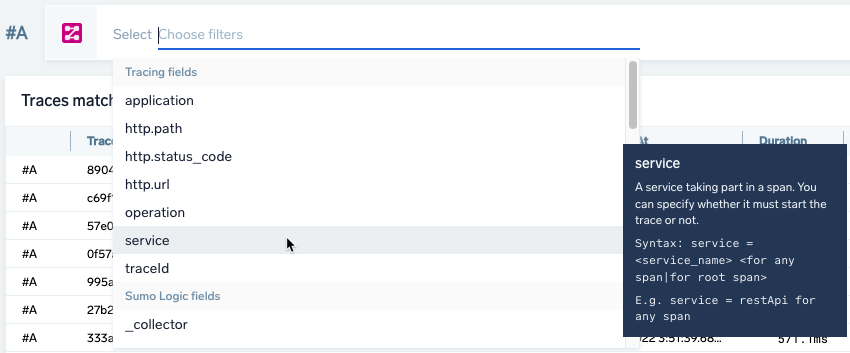
You can add more queries by clicking the + icon on the right of the query row.
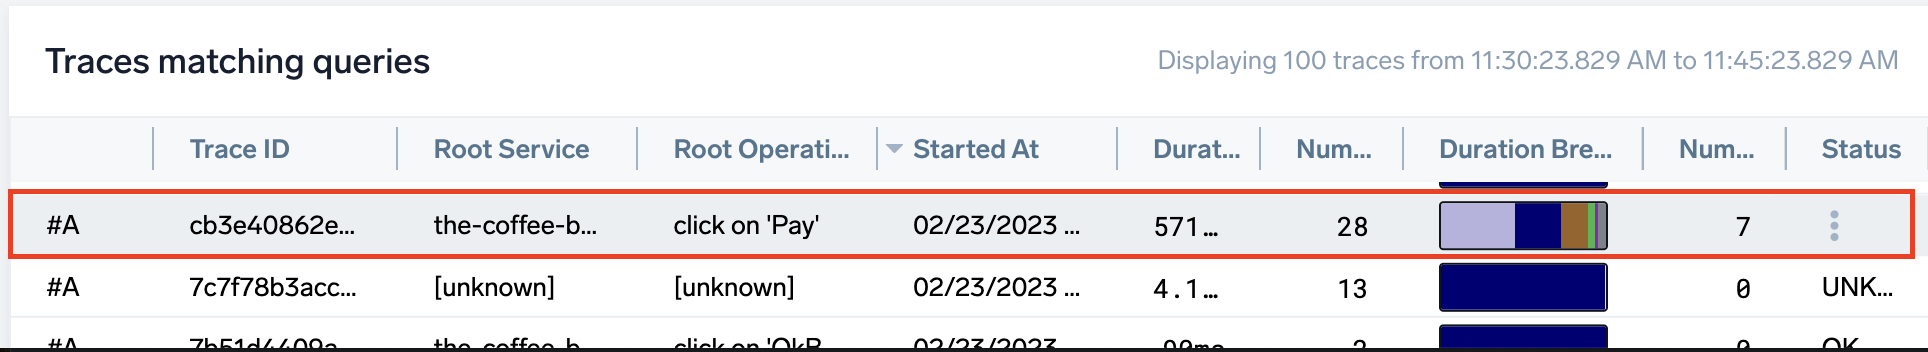
Each query is labeled with a letter. In the following screenshot, the first query on the top row is labeled #A and the second query is labeled #B.
Visibility
Use the eye icon to toggle the visibility of results from a query. When hidden, the traces returned from the query in the row are not displayed in your results.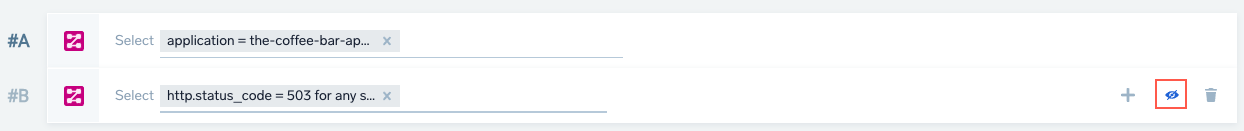
Set Time Range
Results are returned for the time range selected. The traces available (retention) in Trace query is 15 days. See Time Range Expressions for details on defining a time range.
Queries above 7 days may be slower to load.
Refresh results
The results are not automatically updated. If you want to refresh traces, click the refresh button on the top right corner of the page.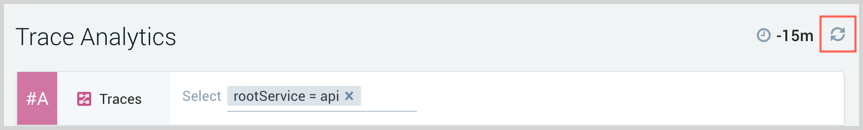
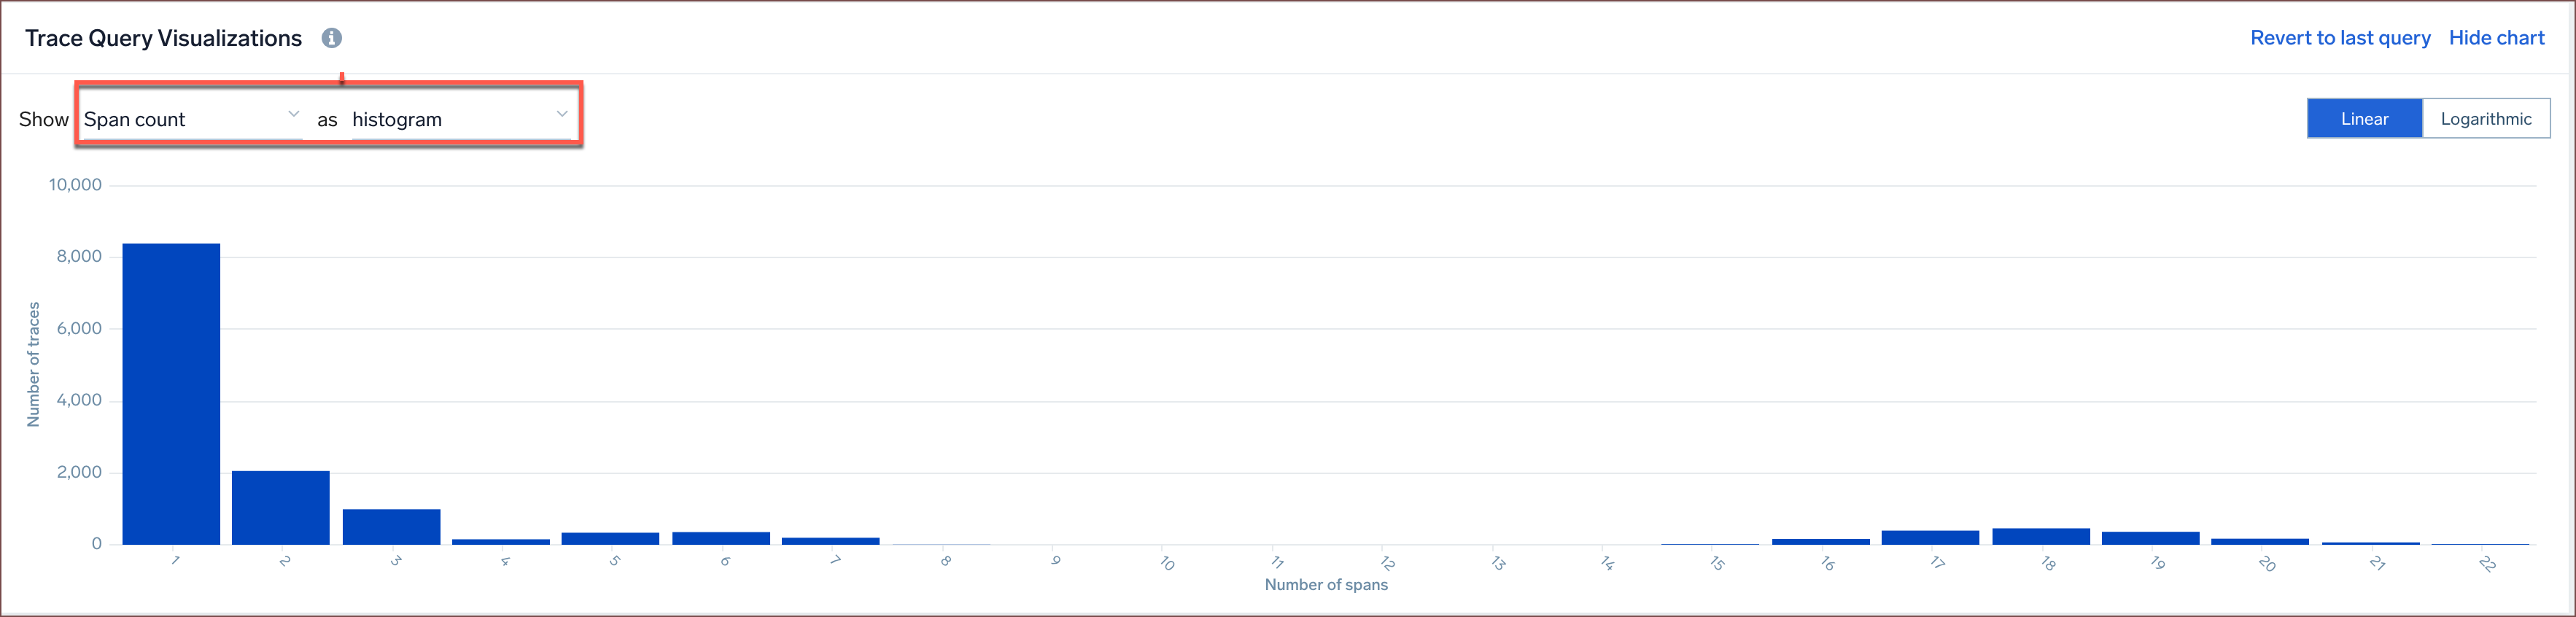
Trace Query Visualizations
Trace Query Visualizations allow you to visualize the breakdown of where time was spent in traces for various services in your application, the complexity of your traces as well as errors. By aggregating traces, you can gain insights into anomalies and unexpected behaviors, leading to faster Time-to-Resolution (TTR) and a higher Return on Investment (ROI). There are three types of metrics that Trace Query Visualizations offer:
- Trace duration
- Error count
- Span count
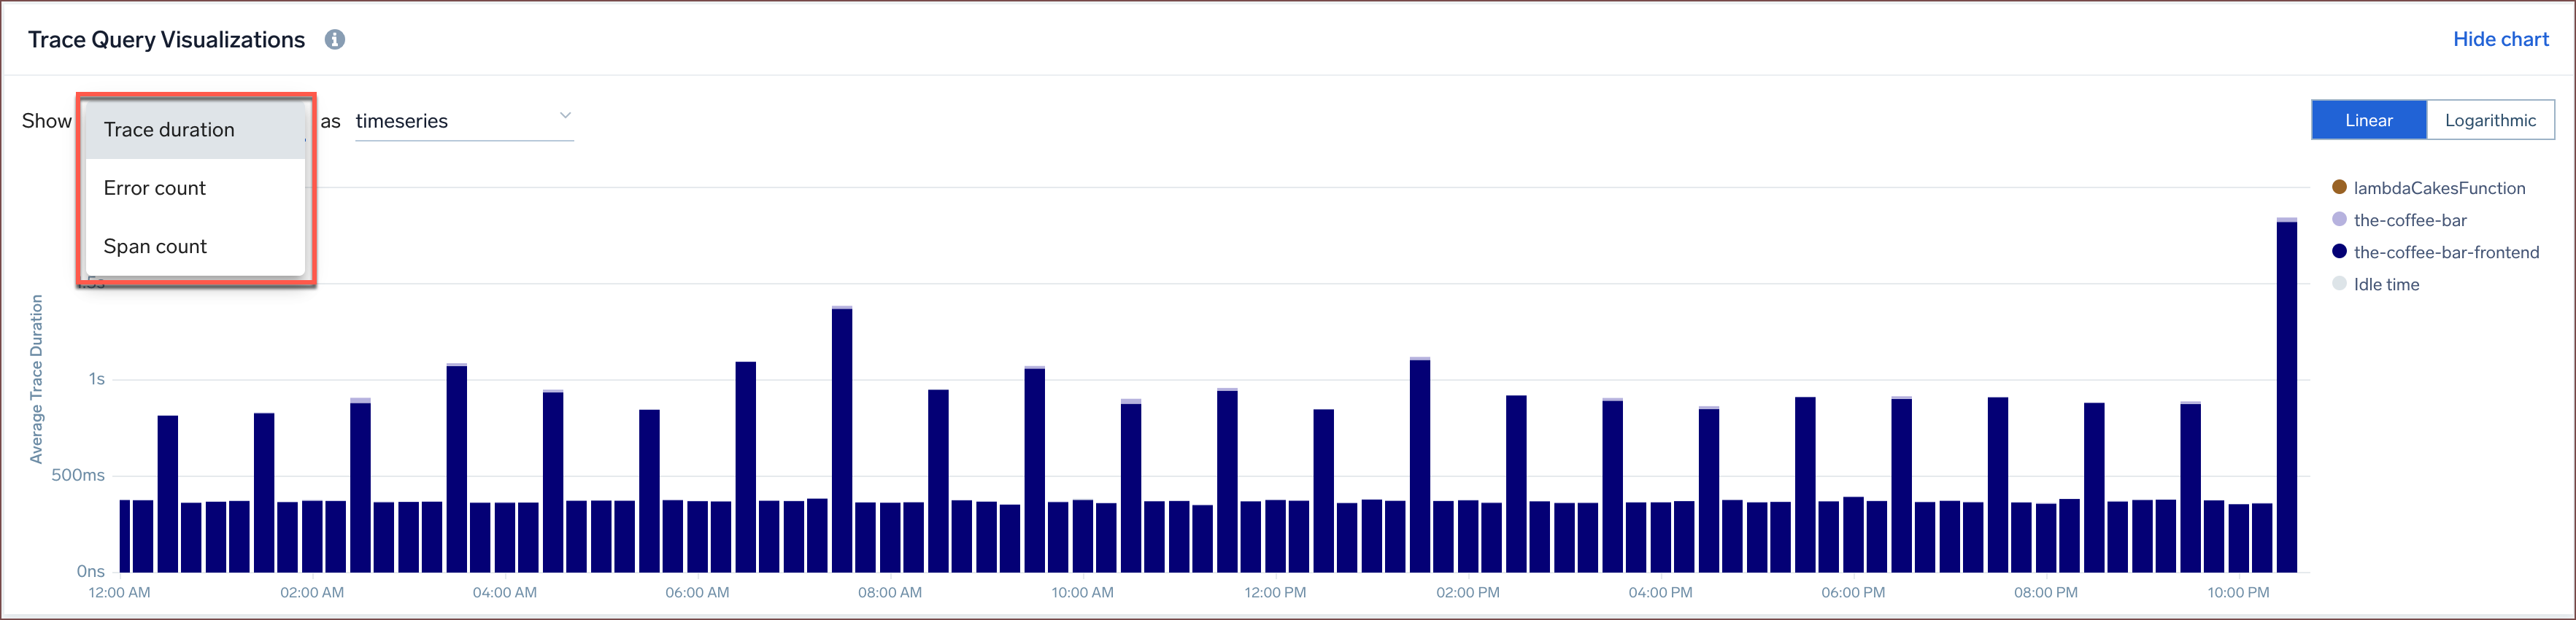
These metrics can be viewed as either a timeseries chart or a histogram chart.
- Timeseries. It shows the average trace duration for each time bucket.
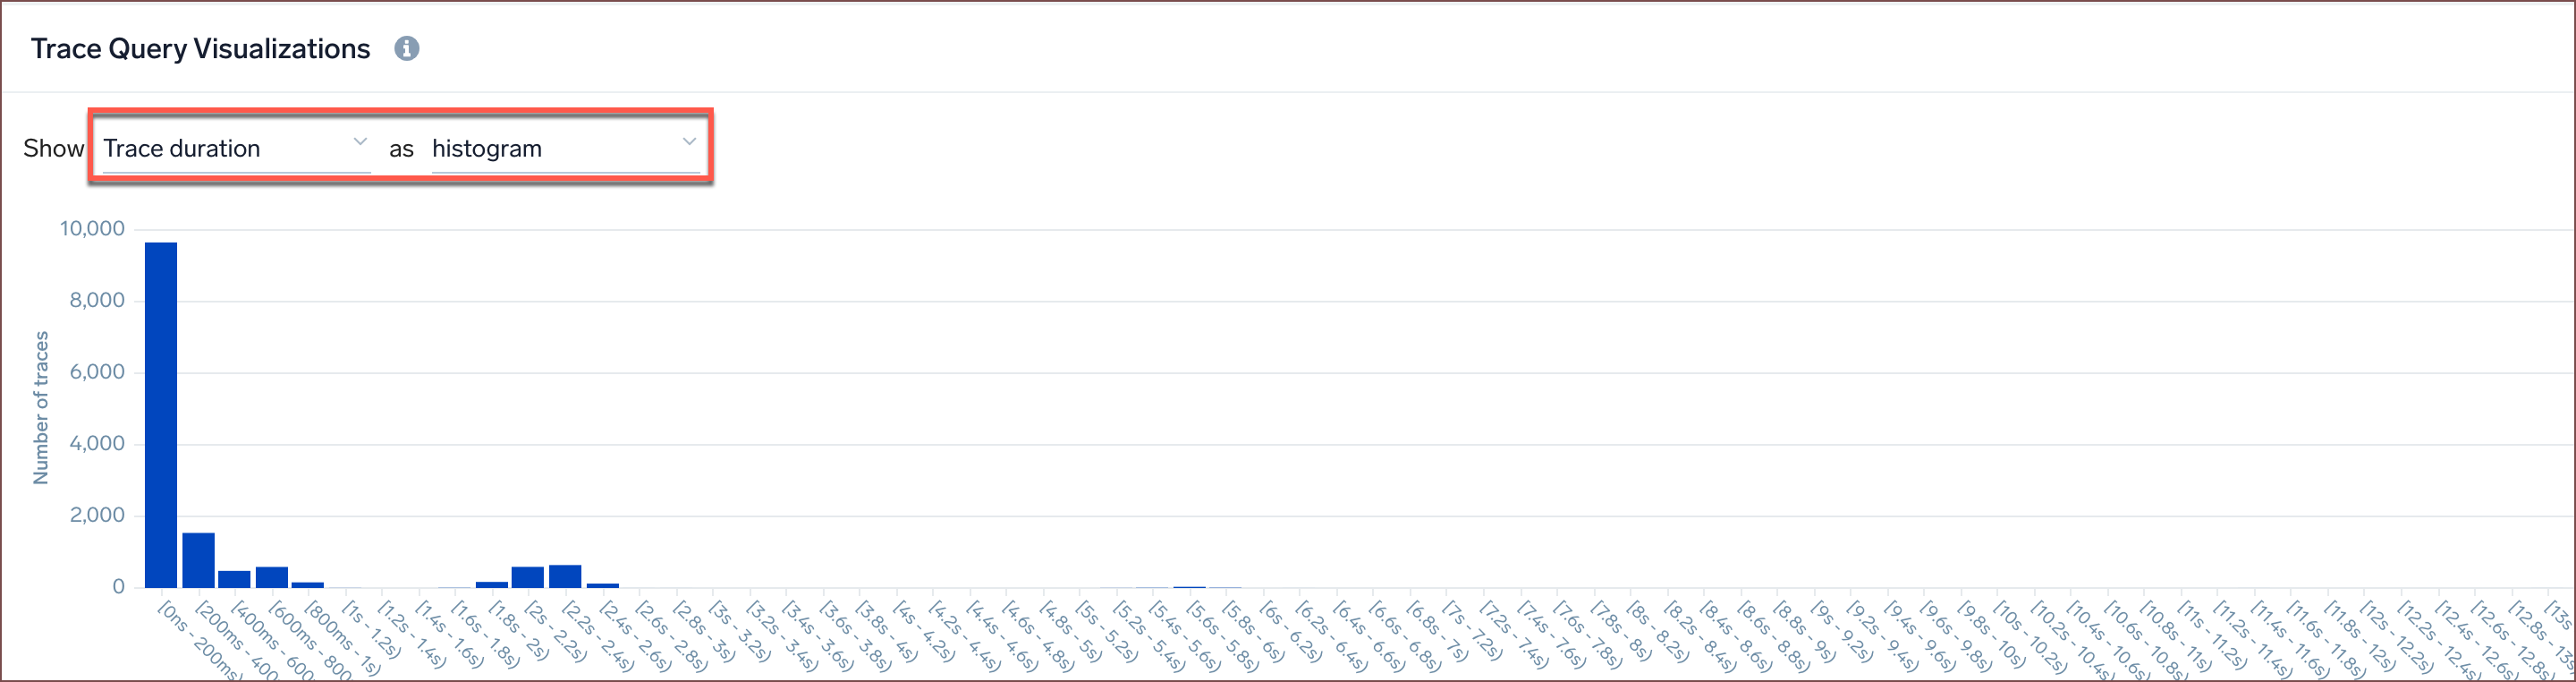
- Histogram. It shows the distribution of traces (their count) in different buckets such as duration, number of spans, or errors.
For both charts, you can switch between linear and logarithmic scales to better visualize the data. Note that logarithmic charts will not show any visible bars for buckets with only one trace.
Understanding each chart type in detail
- Trace duration.
- Timeseries. It allows you to quickly identify services that are causing spikes or slowdowns in trace duration. It helps you understand the average trace duration for every time bucket, as well as the amount of time each service contributed to the end-to-end duration.
- The height of the bar represents the average trace duration for each time bucket.
- Each segment represents a Critical Path Contribution of each service from each trace. Services not present in certain traces do not contribute to the value.
- Histogram. It helps you understand the distribution of trace durations. For example, you can notice groups of durations responsible for longer traces during slowdown periods.
- Timeseries. It allows you to quickly identify services that are causing spikes or slowdowns in trace duration. It helps you understand the average trace duration for every time bucket, as well as the amount of time each service contributed to the end-to-end duration.
Similarly, you can choose timeseries chart type from the dropdown and view the chart.
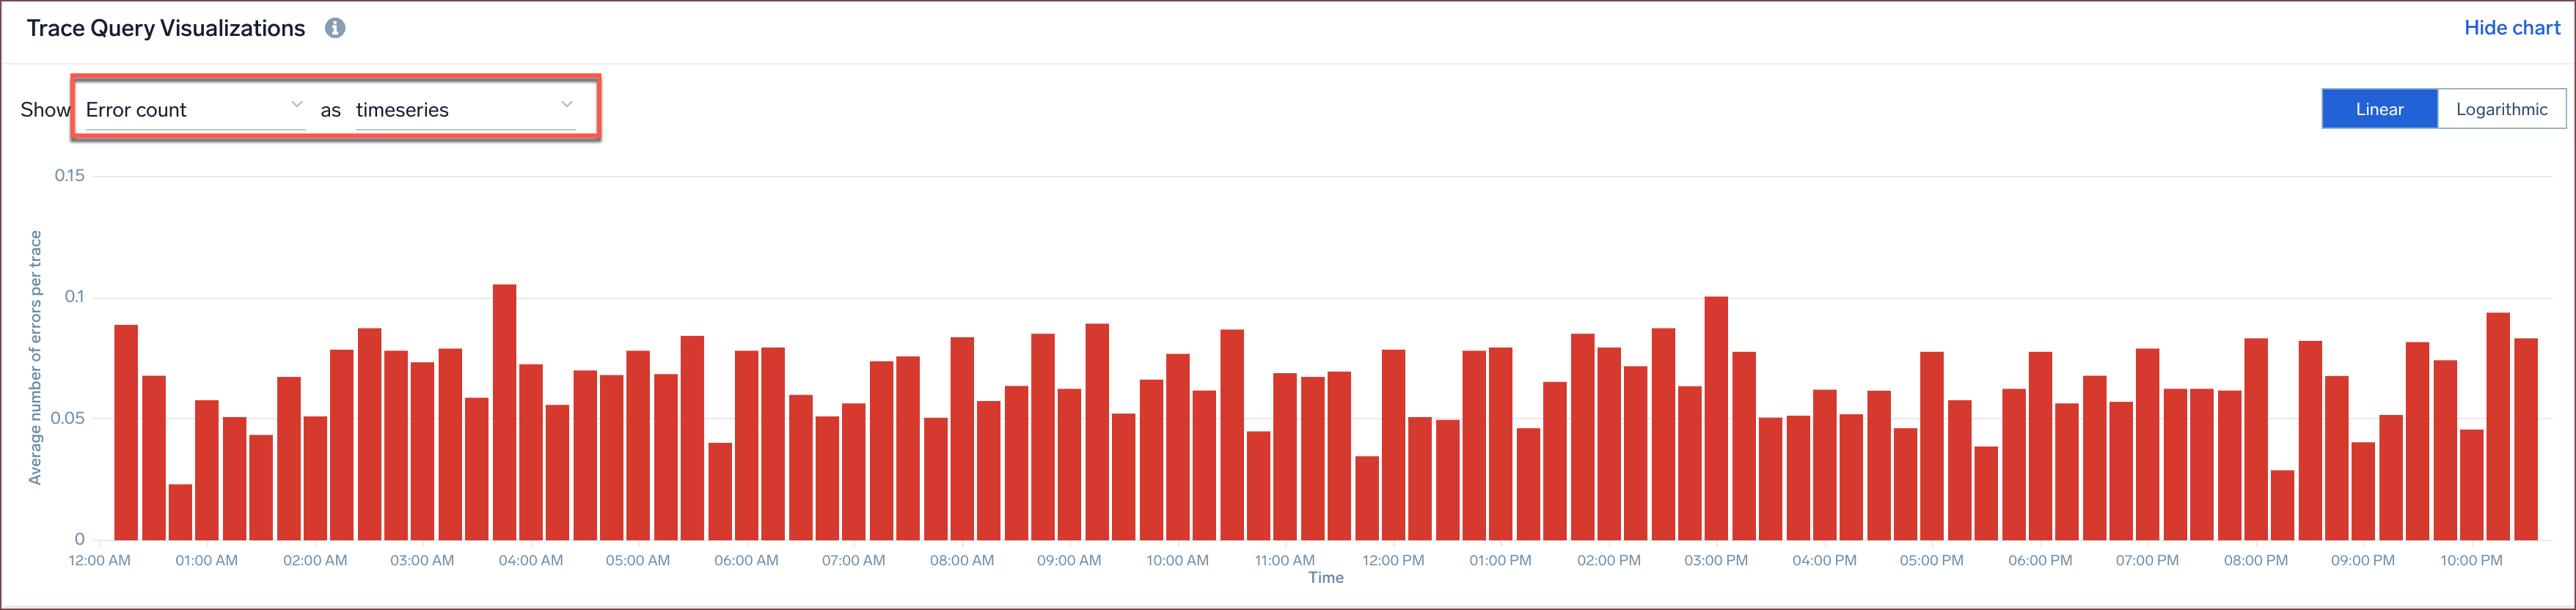
- Error count.
- Timeseries. It helps you visualise the average number of errors per trace for selected time range.
- Histogram. It provides insight into how many traces were found with a certain number of errors. For example, if a backend fails in a specific way, it can always generate a similar number of errors for traces from that period.
Similarly, you can choose histogram chart type from the dropdown and view the chart.
-
Span count.
- Timeseries. It helps you visualize how many spans you have per trace for the selected timerange.
- Histogram. It gives you information about how many traces have a certain number of spans. If a certain type of transaction is expected to produce a similar number of spans every time it runs, spotting an anomaly here can help uncover broken transactions or incomplete traces.
Similarly, you can choose timeseries chart type from the dropdown and view the chart.
These charts provide valuable insights into various aspects of your tracing data performance. It helps you quickly identify any unusual spikes or distribution anomalies that may indicate an issue in the system.
You can point and drag on a chart or click on any column to further narrow down your results. Clicking on a column in timeseries drills down to its timestamp and service (if present). Clicking on a column in a histogram chart narrows down the selection of traces matching the values of clicked column.
The results are displayed in the trace list. To go back to the previous selection, use the Revert to the last query link in the top right corner of the panel.
To get the best results from this chart, it is recommended to filter data to represent similar traces of the same transaction, such as login. Running this chart for different transaction types will not provide the insights users need. Similarly, running the chart for all data without any filters is disabled.
Multiple query rows are not supported currently. Charts show data for first active (visible) row only.
Using the Trace Query Visualization Charts
To view the Trace Query Visualization charts:
- Navigate to the Traces (Query) screen and type in a query.
- Click the Show Chart tab. The default chart shown will be Trace duration as a timeseries chart.
- From the dropdown menu, select the chart type you want to view: Trace duration, Error count, or Span count.
- You can view each chart type as a timeseries or histogram chart by selecting the corresponding option from the dropdown menu.
Dashboard Panel support
You can add Trace Duration Breakdown Chart as a dashboard panel to a new or existing dashboard. From a new dashboard:
- Classic UI. Go to the Home screen and select Dashboard.
New UI. In the main Sumo Logic menu, select Dashboards > New Dashboard. You can also click the Go To... menu at the top of the screen and select New Dashboard. - Click the Traces panel type.
- Add the required trace query filters representing similar traces of the same transaction.
- Under Visual Settings > Chart type, select Trace Query Visualizations.
Traces Matching Queries table
In the Traces matching queries table, Traces are displayed in the following columns:
| Column name | Example value | Description |
|---|---|---|
| Trace ID | ffaf2f69ee8ad0c1 | The unique identifier of the trace. |
| Root Service | api | The service that started the trace. |
| Started At | 07/27/2020 09:01:04.533 | When the trace started. |
| Duration | 12.582 ms | The amount of time the trace spans. |
| Number of spans | 35 | A trace consists of spans. This number tells you how many spans are in the trace. |
| Duration Breakdown | Each color indicates a service. The colors assigned to services are always the same on your account. You can change the color in the span summary tab after clicking on the individual span in trace view. Hover over to view a percentage breakdown of how long each span covers in the trace. 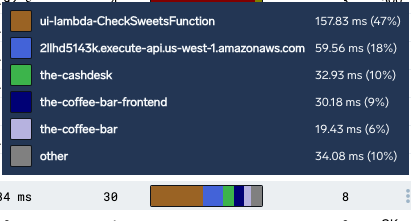 | |
| Number of errors | 0 | The number of errors in the trace. |
| Status | 200 | The HTTP status code of the trace. A menu is available in this column when hovering on a row. The menu has an option to Show similar traces. |
Changes to your View are preserved when switching between other tabs.
Next, open Trace View by clicking on any row.
Trace View
Trace View shows the time flow of a single trace by its spans, and displays the relationships between the spans across your transaction.
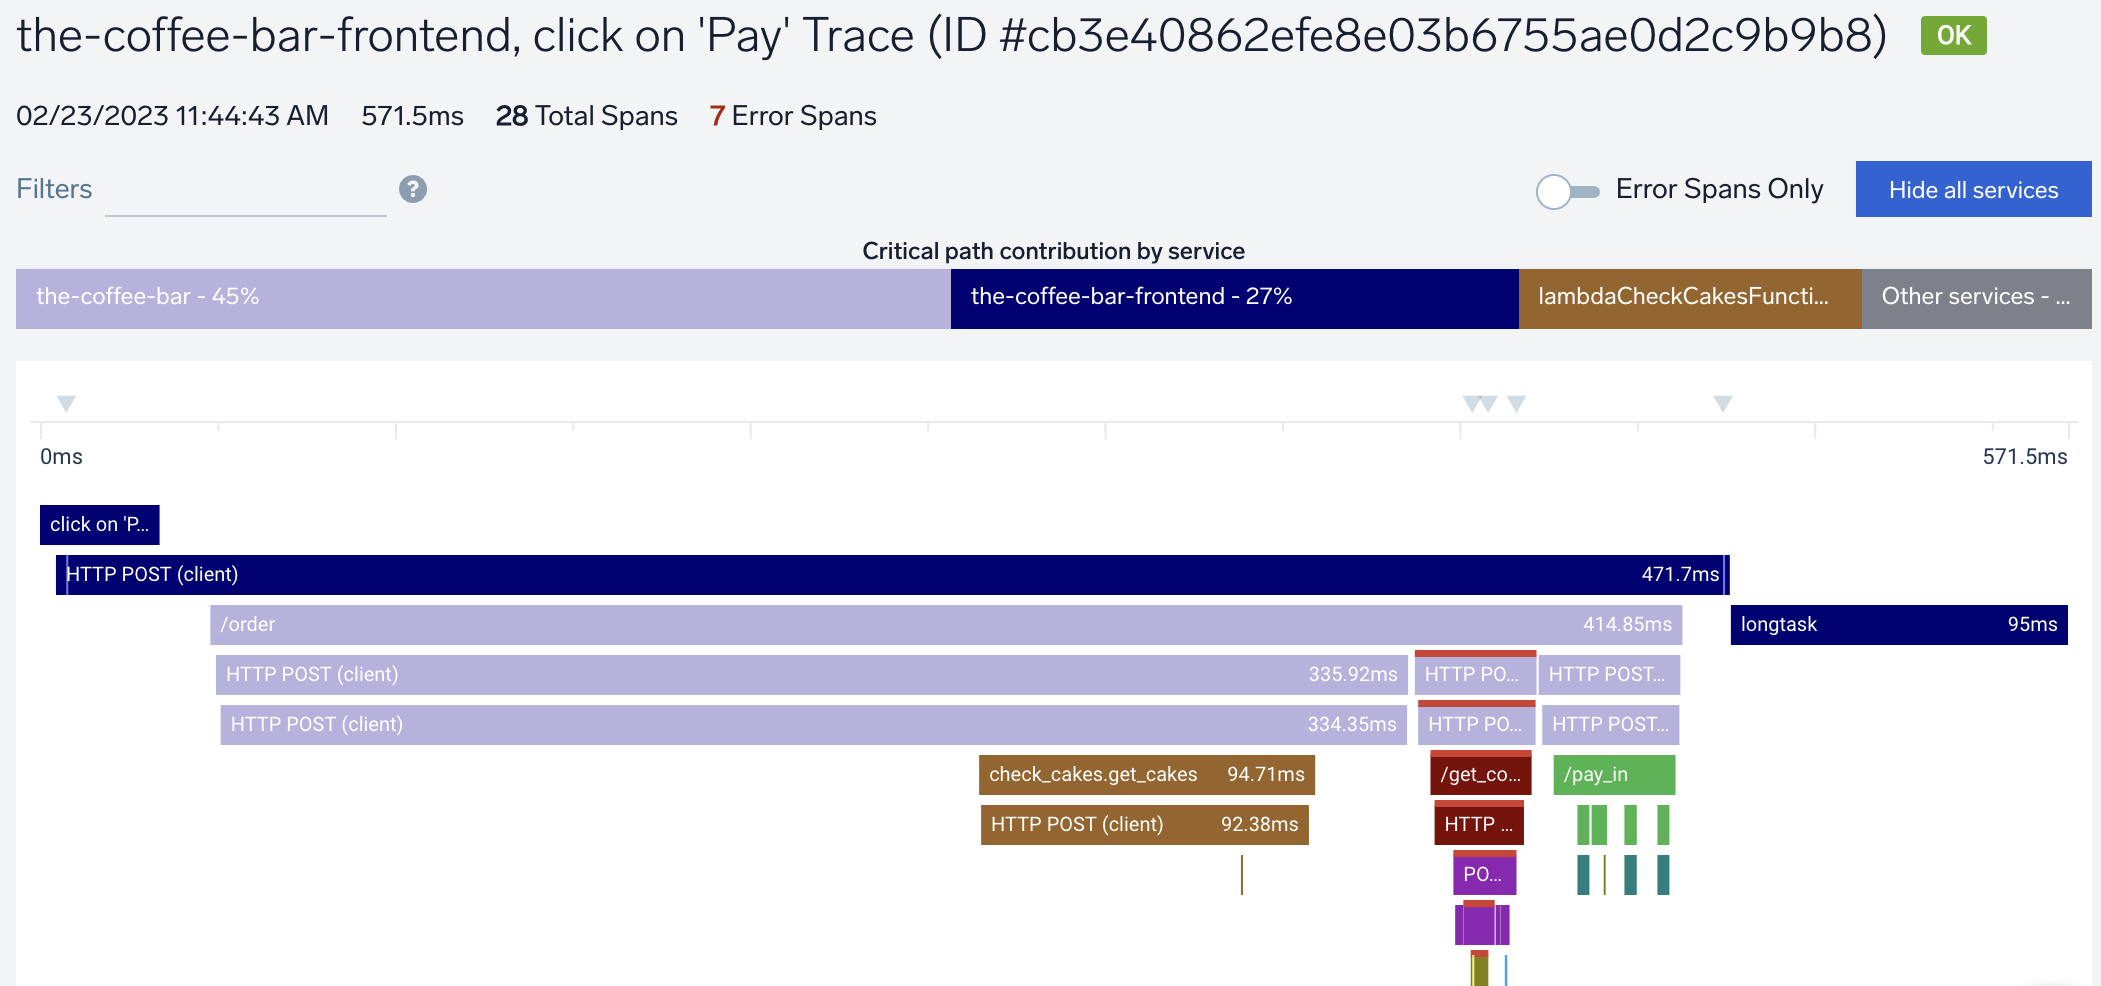
With log drilldowns and infrastructure metrics, Trace View helps you:
- Investigate the lifetime of your transactions
- Understand calls dependencies
- Troubleshoot long duration and errors
- Visualize all of your different services, each represented in a different color
Navigation tips:
- Zoom in and out on spans using your mouse to drag and pan, or use the buttons in the bottom left, where you can also reset the view.

- Use the Filters bar to filter by values of metadata tags in spans.
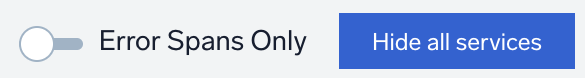
- Use the Error Spans Only toggle to hide or show error spans and the Hide all services button to hide services.
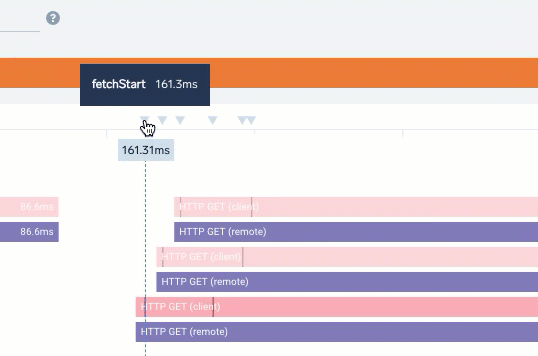
- Hover over a span segment to view the parent span information and relationship, including the service, operation, relative start in milliseconds, and duration in milliseconds.
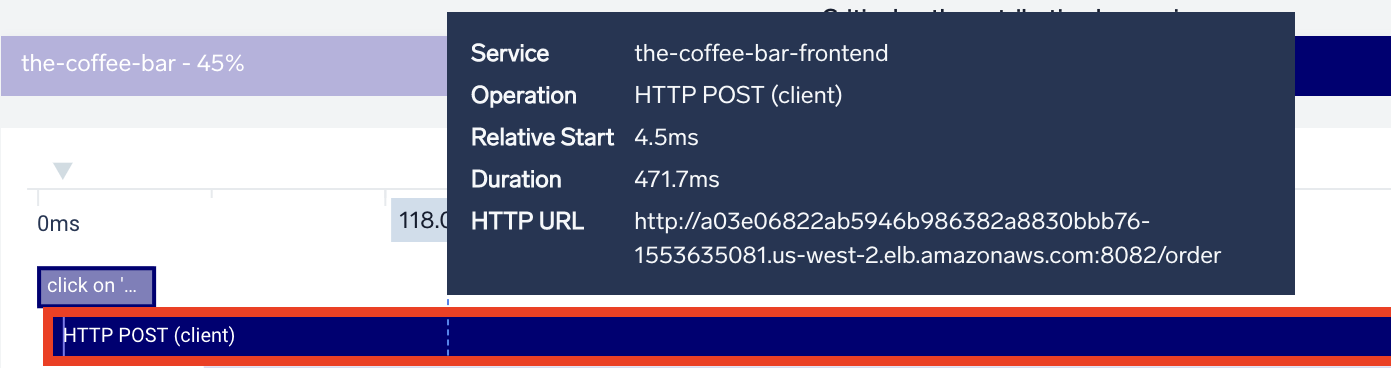
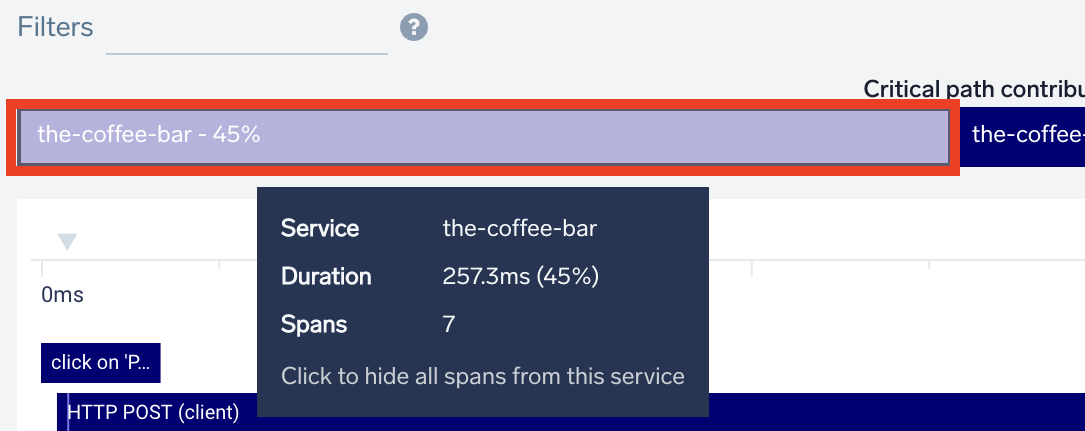
- Hide services that are of less interest by clicking on a segment underneath the Critical path contribution by service label. This section displays the sequence of service span segments that contribute to the total trace execution time. Each colored segment summarizes all span fragments from a single service, where there was no child span activity.

Click on a span segment to open the details side panel, which contains the following tabs.
Summary
The details of the span are provided. contains general information about the span and you can drilldown to logs by span or trace IDs (if present in logs).
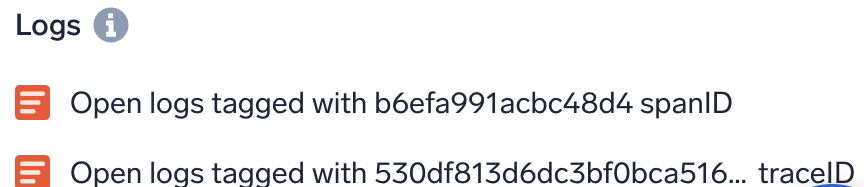
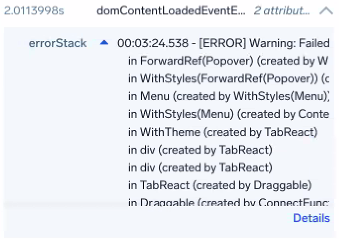
Logs
To drill down further into your data, the Logs section has links to run searches against related log data. Top links for span IDs and trace IDs work if you have span and trace IDs injected into logs. Lower section links are available and work automatically if you've installed the Sumo Logic Kubernetes Collection.
If no logs are produced for this spanID, results may come back empty. Learn how to add spanID to logs.
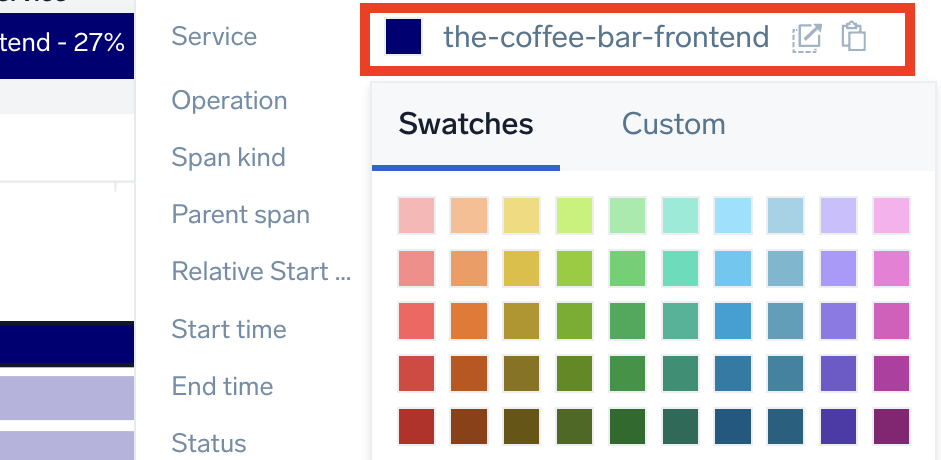
Service color
You can change the color of a Service by clicking the colored box and selecting a defined swatch or custom color.
Metadata
Lists all of the related service entities involved in the span, including a complete set of span's tags. You can click on the clipboard icon to copy the value to your computer's clipboard.
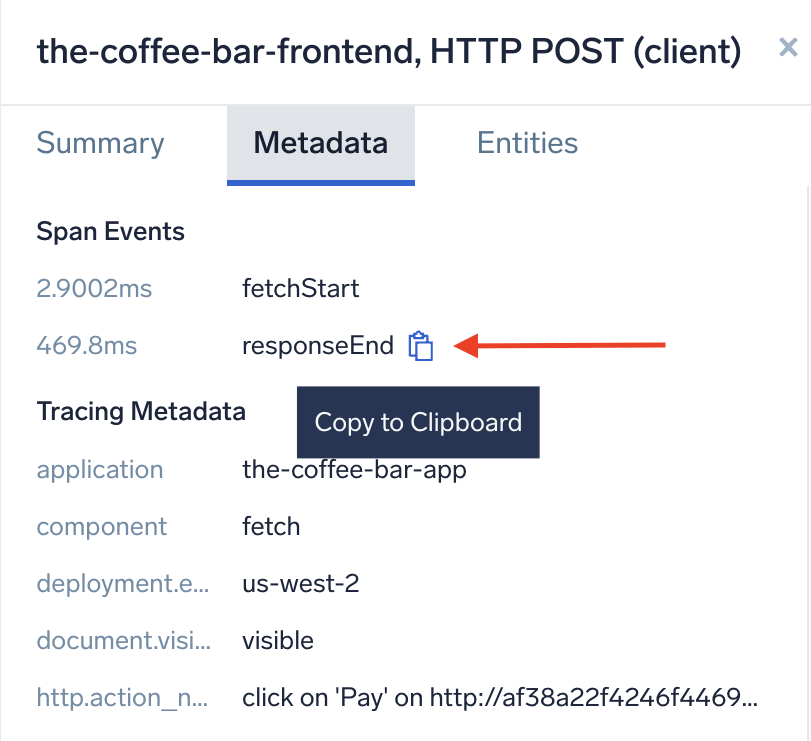
The Metadata includes a Span Event section.
Span Events
Span Events describe and contextualize the work being done under a span by tracing and displaying that data in Trace Views. Events are optional time-stamped strings, which are made up of timestamp, name, and (optional) key-value pair attributes.
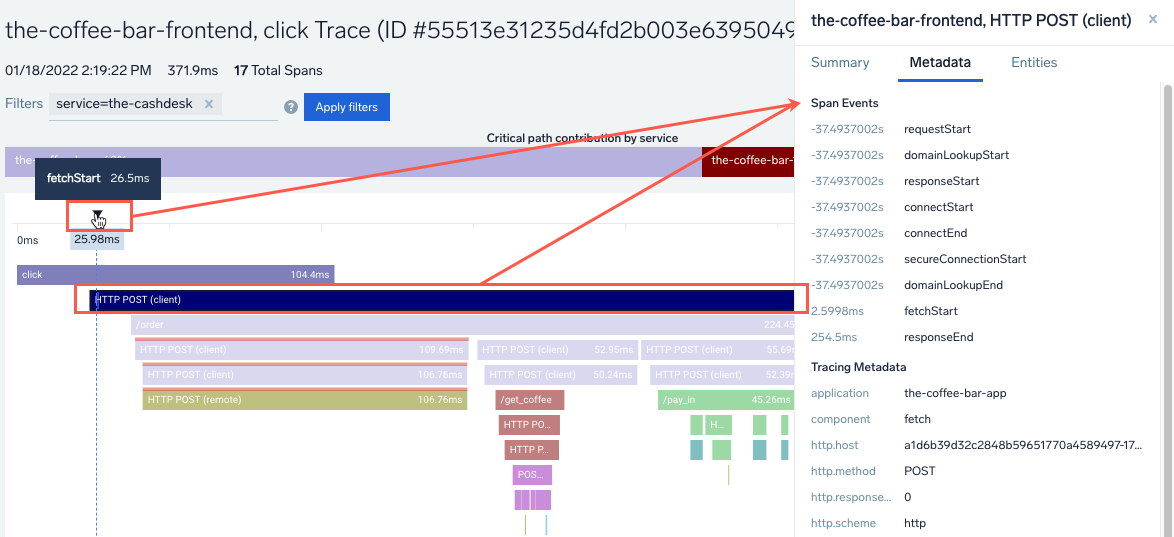
You can also get to the Metadata tab > Span Events section by selecting a span event marker ![]() in the timeline or a span with an event.
in the timeline or a span with an event.
Span Event data includes:
- Name for the event.
- Timestamp when it occurred.
- A metric or measurement.
- Additional attributes (short or long), displayed in multiple formats
- Captured errors with codes and additional details if available.
All details and attributes display in the Metadata tab with pop-up Details for additional event messages and attribute details. For example, during OpenTelemetry Java or Python auto-instrumentation, any exceptions may be traced and attach the exception details automatically onto the relevant span as a Span Event.
Each event tracks a marker in the span timeline showing the start, end, and amount of passed time in a span. For many events that occur in spans, zoom in to expand and review event markers helping them to space out if overlapping or close together. As you hover and select events, associated spans highlight and provide a view of the event in all spans affected.
If additional information is available that may be too large for the tab view area, such as a metric attributes and error message, the Details link displays. Click to review this information.
You can also manually create Span Events, such as this example from Ruby.
Span Links
Tracing focuses on the parent-child relationship between spans, which are described by a span ID, a parent span ID, and a Trace ID. You can establish more casual relationships between Traces using Span Links.
Span Links, listed under the Metadata tab, give spans context. Links can point to spans inside a trace or across different traces. For example, with links you can represent batch operations, where a span is initiated by multiple initiating spans, each representing one item being processed in the batch. The links give you the relationship between the originating and the following trace. You can copy the span ID by selecting the Clipboard icon next to the span link.
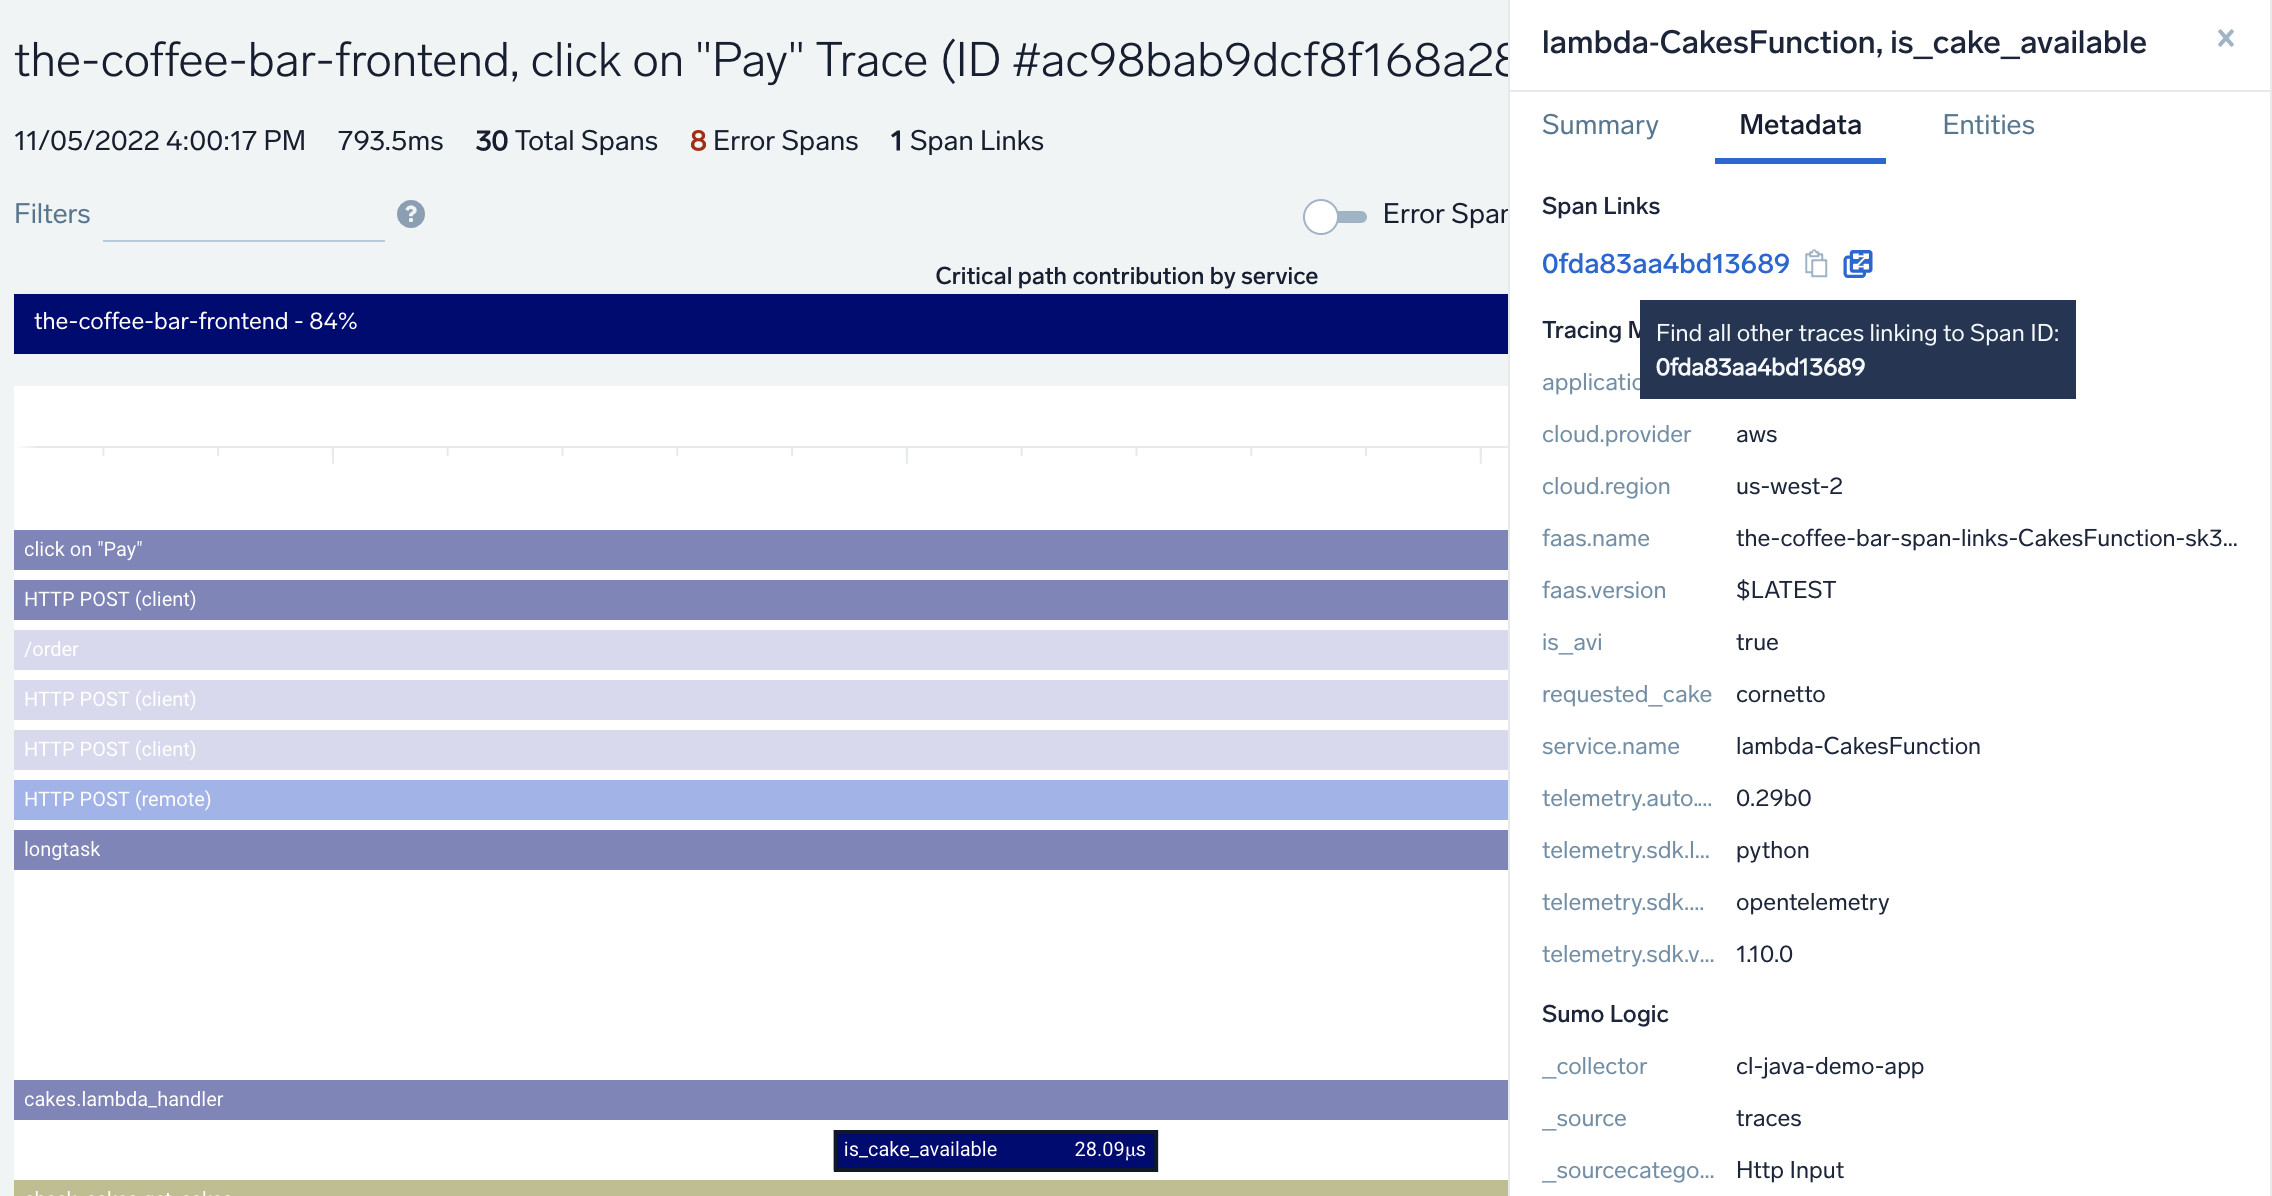
Span Links are added by tracing instrumentation at the client side and are automatically shown when detected in data. For details on configuring Span Links, see the OpenTelemetry specification.
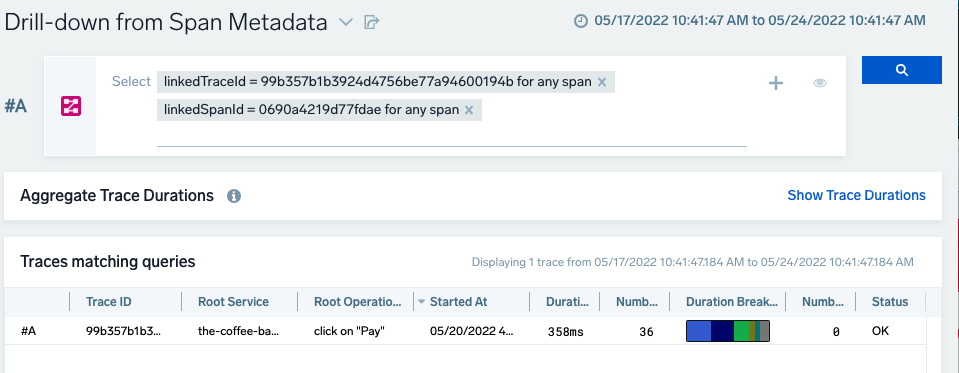
You can select the Traces icon to view all other traces that link to this span ID, and it will take you to the Trace View with the linkedSpanId as a filter criteria.
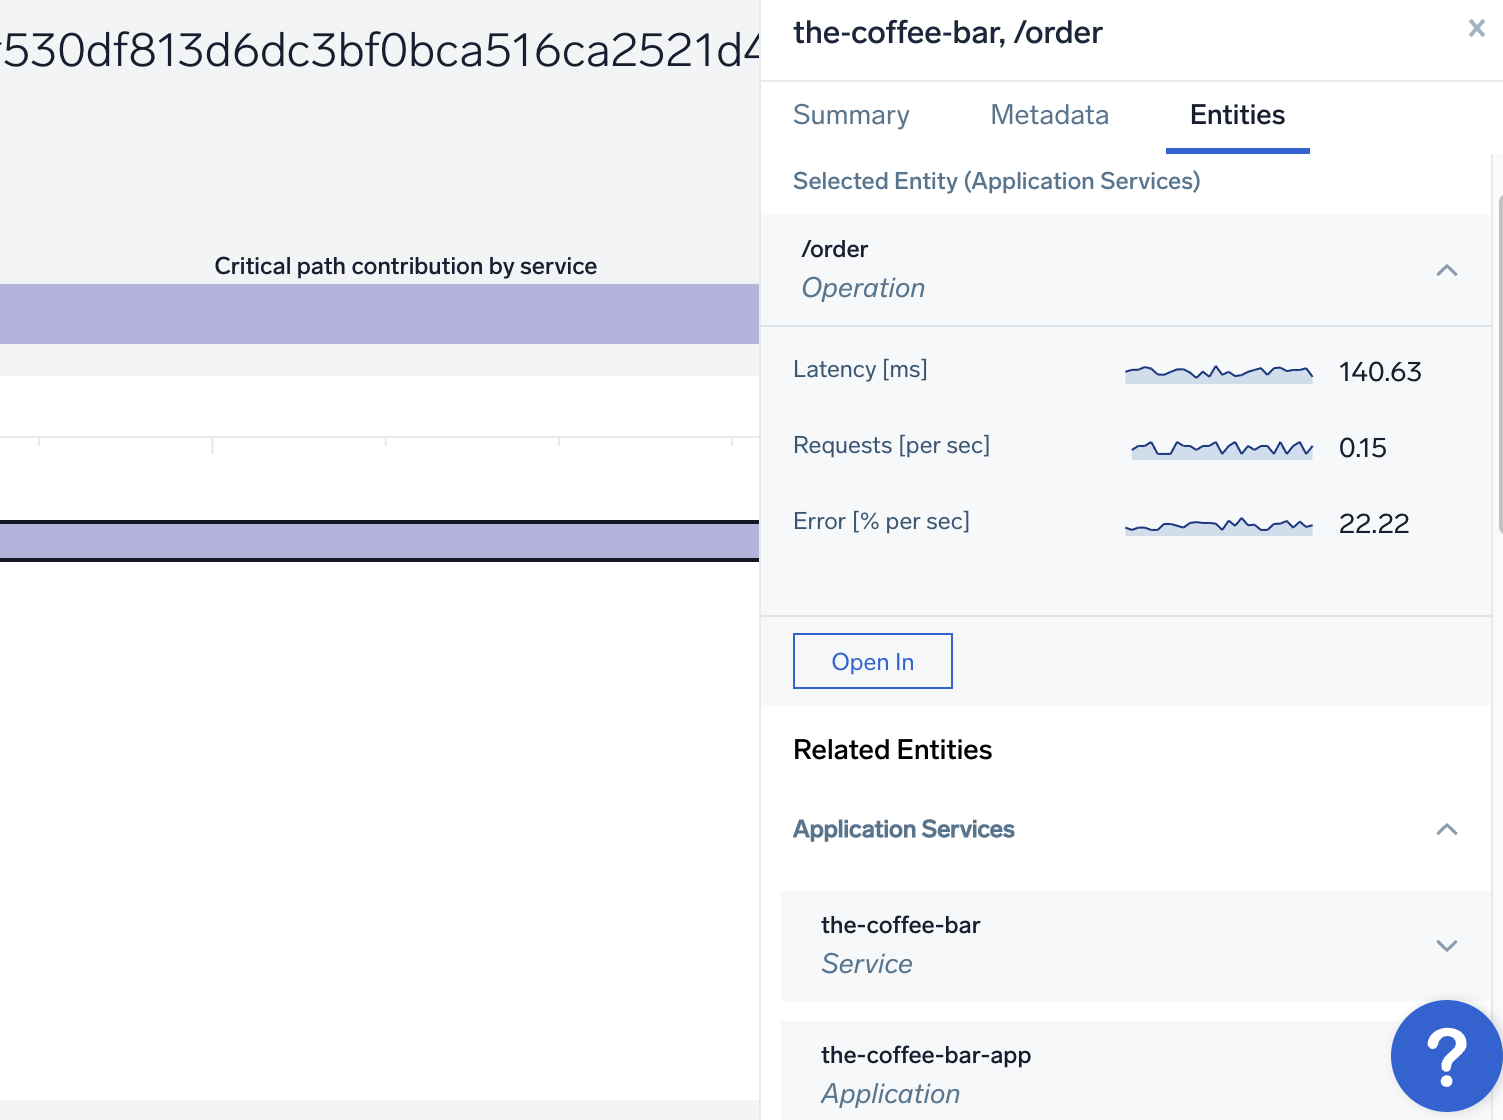
Entities
The Entities tab provides an overview of a span's supporting infrastructure health with the ability to contextually drill down to logs and metrics. Only entity types from a curated list are identified. The AWS, Kubernetes, Traces, and Host domains are supported.
Time selector
Use the time selector to set if data is related to the Now moment of time or the moment of time around the data point you clicked on. 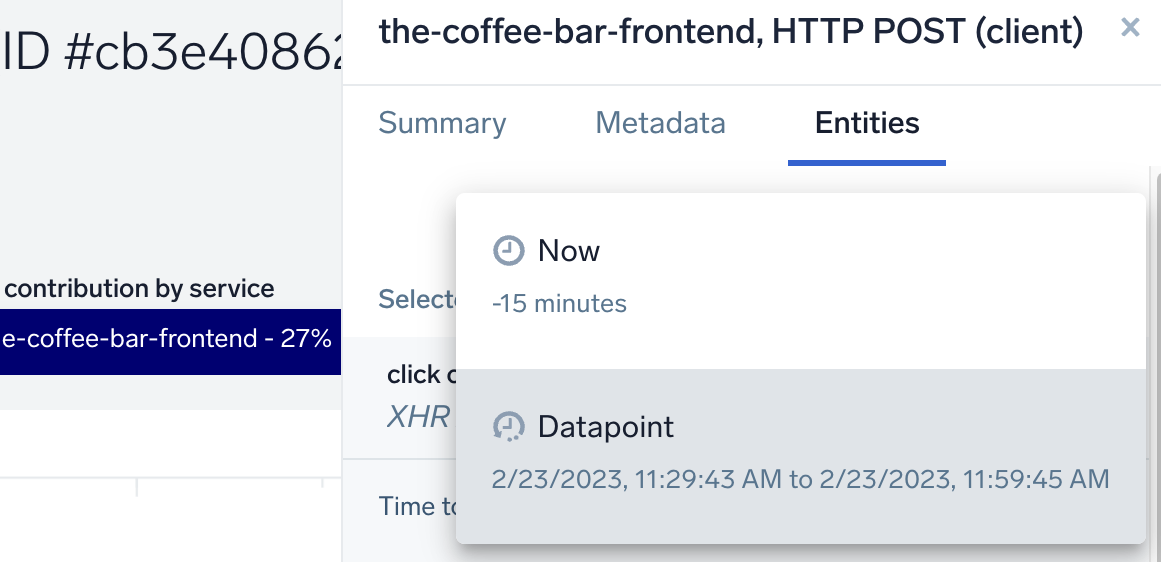
If the Datapoint is the same as Now, the selector will not allow you to select Now.
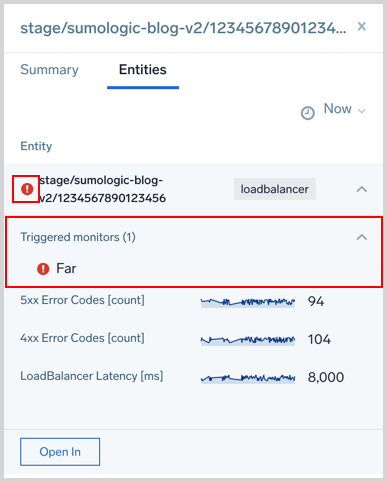
Triggered monitors
Alerts are only visible when the Time Selector is set to Now.
Monitors track your Metrics or Logs data in real time and send notifications when noteworthy changes happen in your production applications. The Entities tab shows any Monitors with a Critical, Warning, or Missing Data status that are tracking logs or metrics on the Entity.
Next to the Entity, you will see any of the following icons indicating the type of Monitor alert that has triggered. Click the Triggered monitors row to view the related Monitors. You can click on them to view the Monitor on the Monitors page.
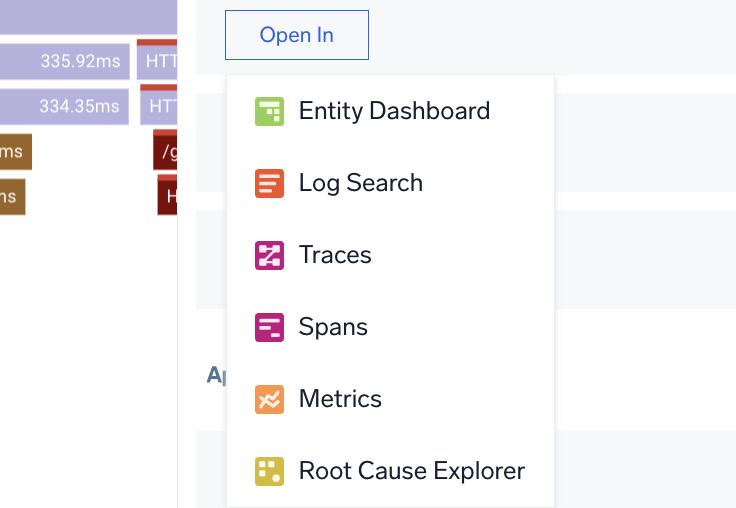
Troubleshoot links
This tab also displays troubleshooting links for related Entities and Environments. To investigate, click the Open In button, then select an icon to launch another feature against the entity or environment. An icon is not available if it is not a valid launch.