MITRE ATT&CK Threat Coverage Explorer
The MITRE ATT&CK Threat Coverage Explorer shows the MITRE ATT&CK adversary tactics, techniques, and procedures (TTP) from the Enterprise Matrix that are covered by rules in your system. Not only can you filter on specific techniques to see how well you are covered for each, but you can filter on vendors and products that provide your data sources so you can see the coverage they give you. Adding or removing products from the list allows you to evaluate the effectiveness of your data sources.
Coverage data is updated on the page once a day. To determine your coverage, the MITRE ATT&CK Threat Coverage Explorer collects data from rules that have fired in the last 180 days.
- To view the MITRE ATT&CK Threat Coverage Explorer, you must be assigned the View Rules role capability.
- To run APIs to get information on coverage, see MITRE ATT&CK coverage APIs.
Watch this micro lesson to learn about the MITRE ATT&CK Threat Coverage Explorer.
User interface
Classic UI. To open the MITRE ATT&CK Threat Coverage Explorer, in the top menu select Content > MITRE ATT&CK Coverage.
New UI. To open the MITRE ATT&CK Threat Coverage Explorer, in the main Sumo Logic menu select Cloud SIEM > MITRE ATT&CK Coverage. You can also click the Go To... menu at the top of the screen and select MITRE ATT&CK Coverage.
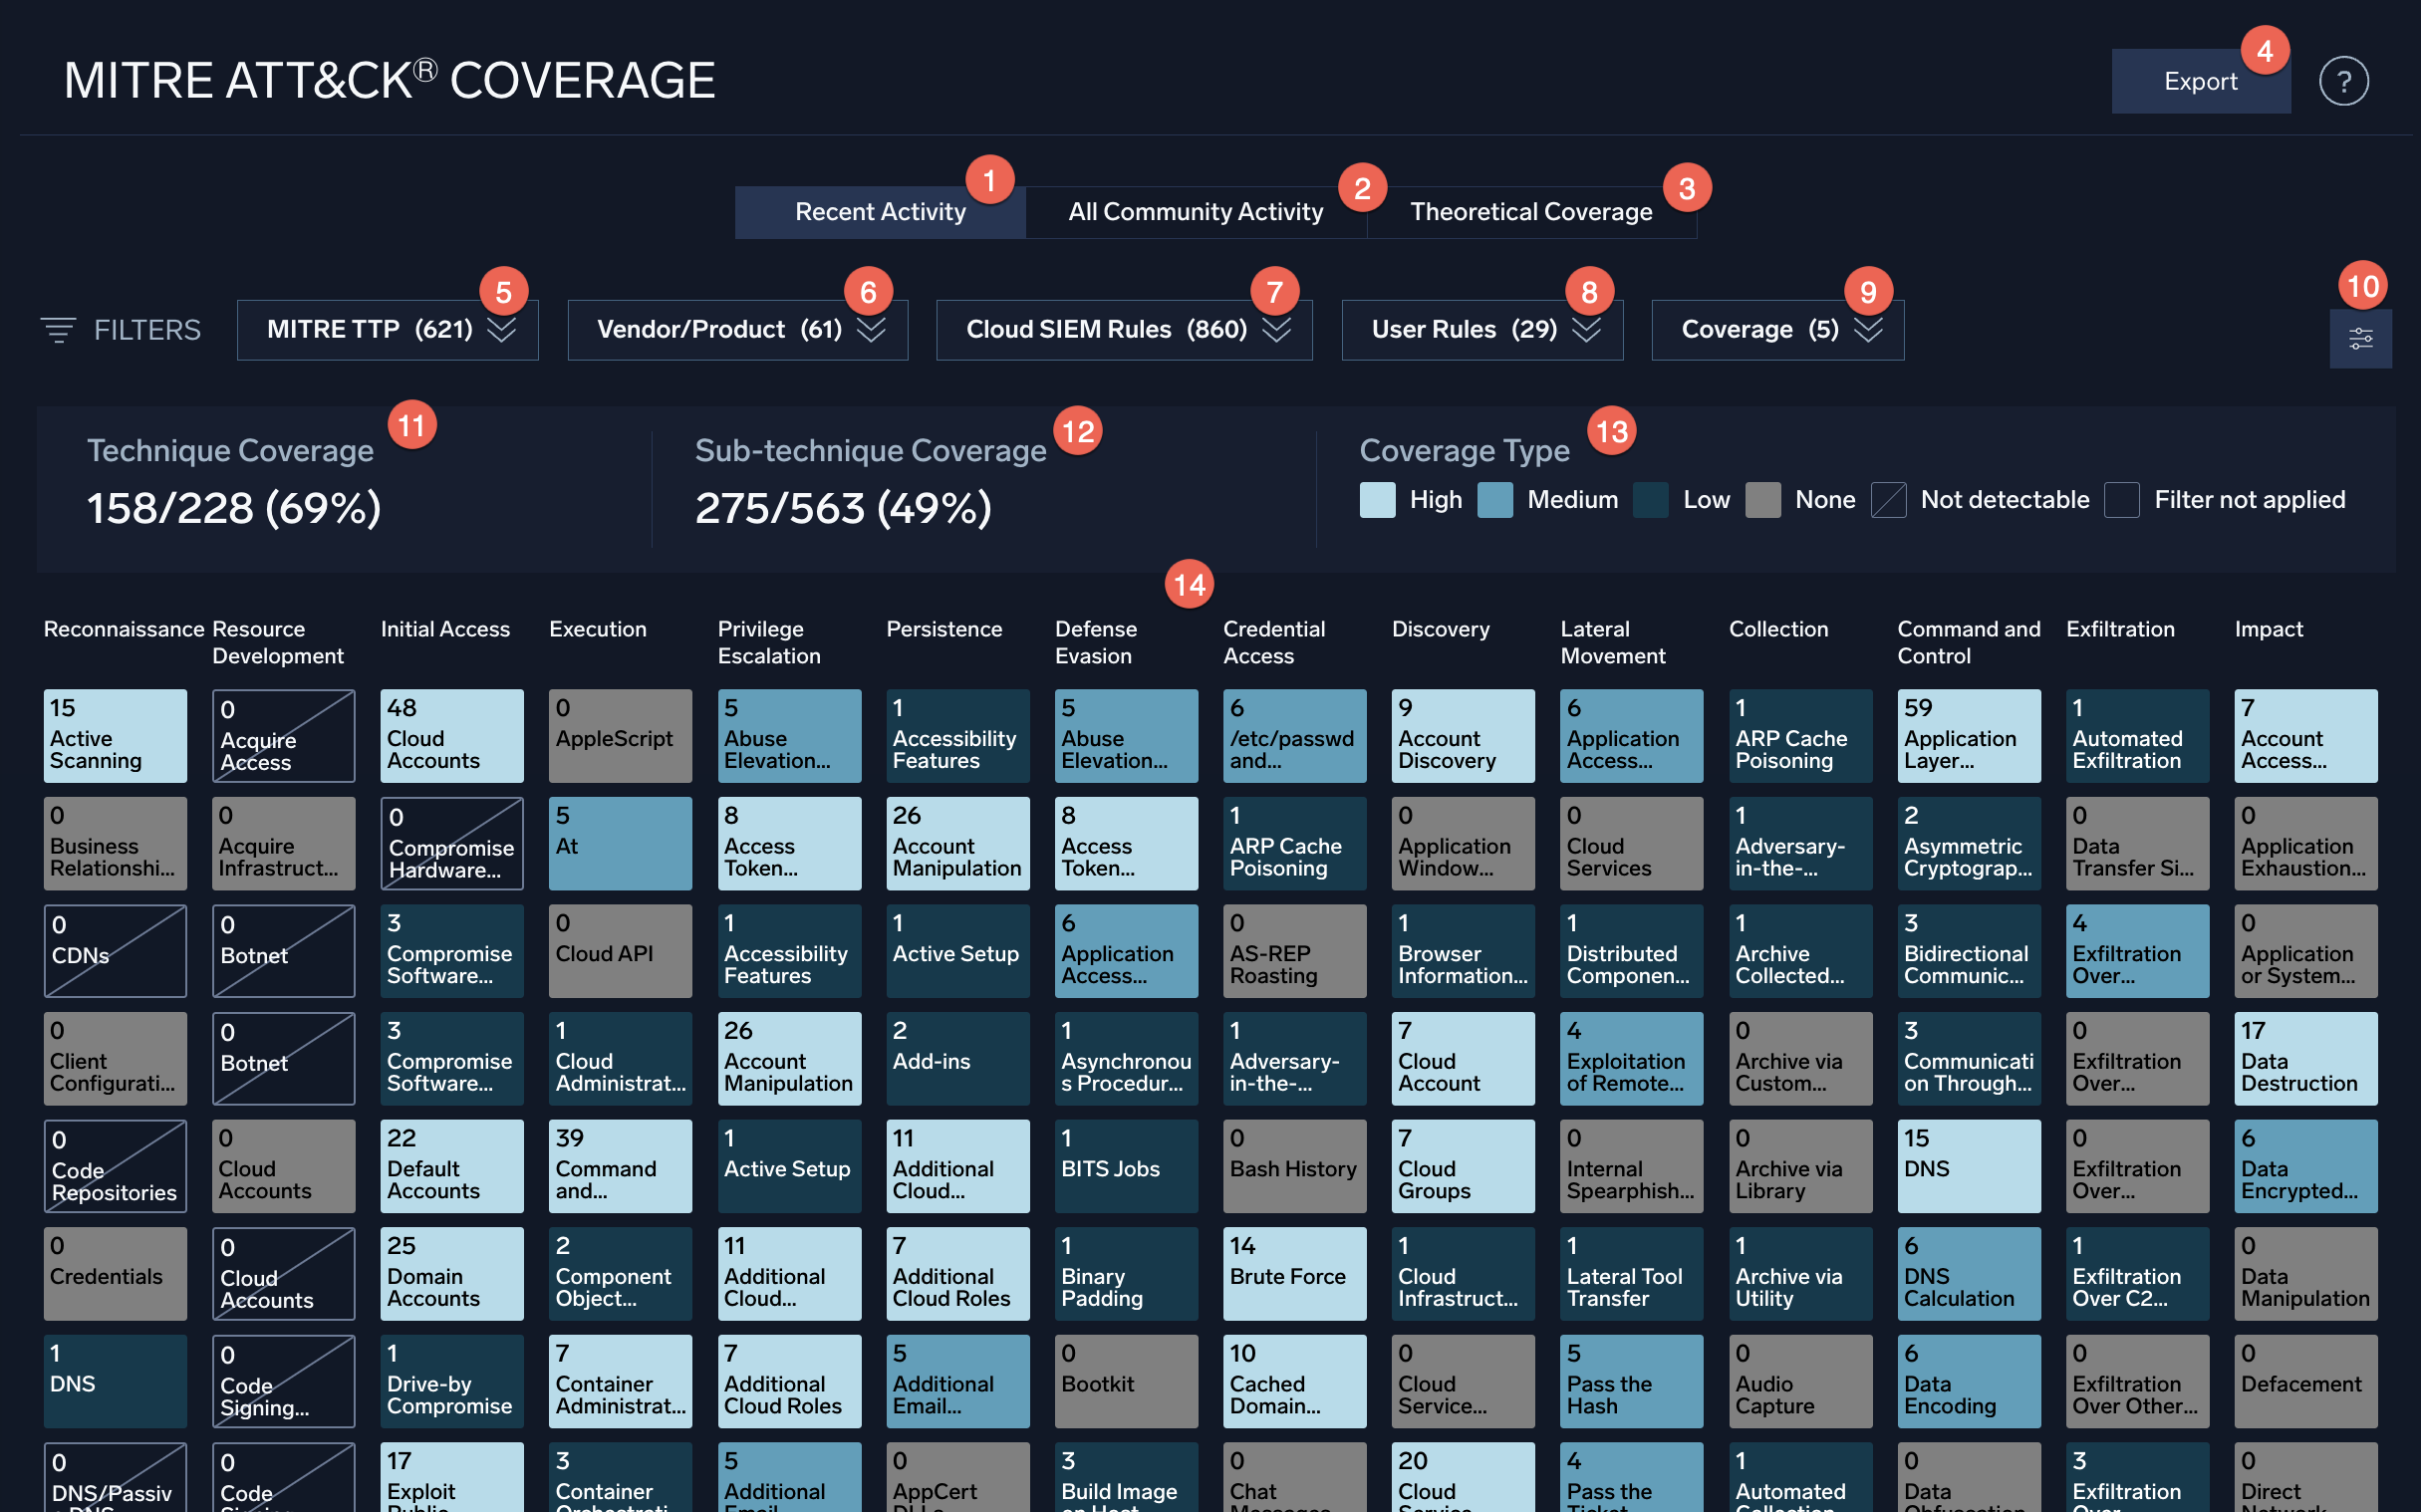
- Recent Activity. Shows coverage for your organization based on signals received over the last 180 days. Coverage data is updated on the page once a day.
- All Community Activity. Shows coverage for all customers that use the same Cloud SIEM sources as you based on all signals received by all instances over the last 180 days. (Customer data is anonymized.) Comparing this coverage to Recent Activity can help you determine what other potential techniques are covered by your data sources, but not evidenced yet in your environment.
- Theoretical Coverage. Shows coverage for your organization if all data ingest worked perfectly and all enabled rules generated at least one signal. This view can help you determine what custom rules would be most valuable to implement. If this is selected, the Vendor/Product filter is disabled.
- Export. Export the filtered coverage to a JSON file. The file is in the format used by MITRE, and can be used with other exported files of MITRE data to aggregate and analyze MITRE ATT&CK coverage data. The file includes a score from 0 to 3 for each technique. The higher the score, the better coverage you have: 0=None (10 or fewer rules), 1=Low (11-13 rules), 2=Medium (14-16 rules), 3=High (17 or more rules).
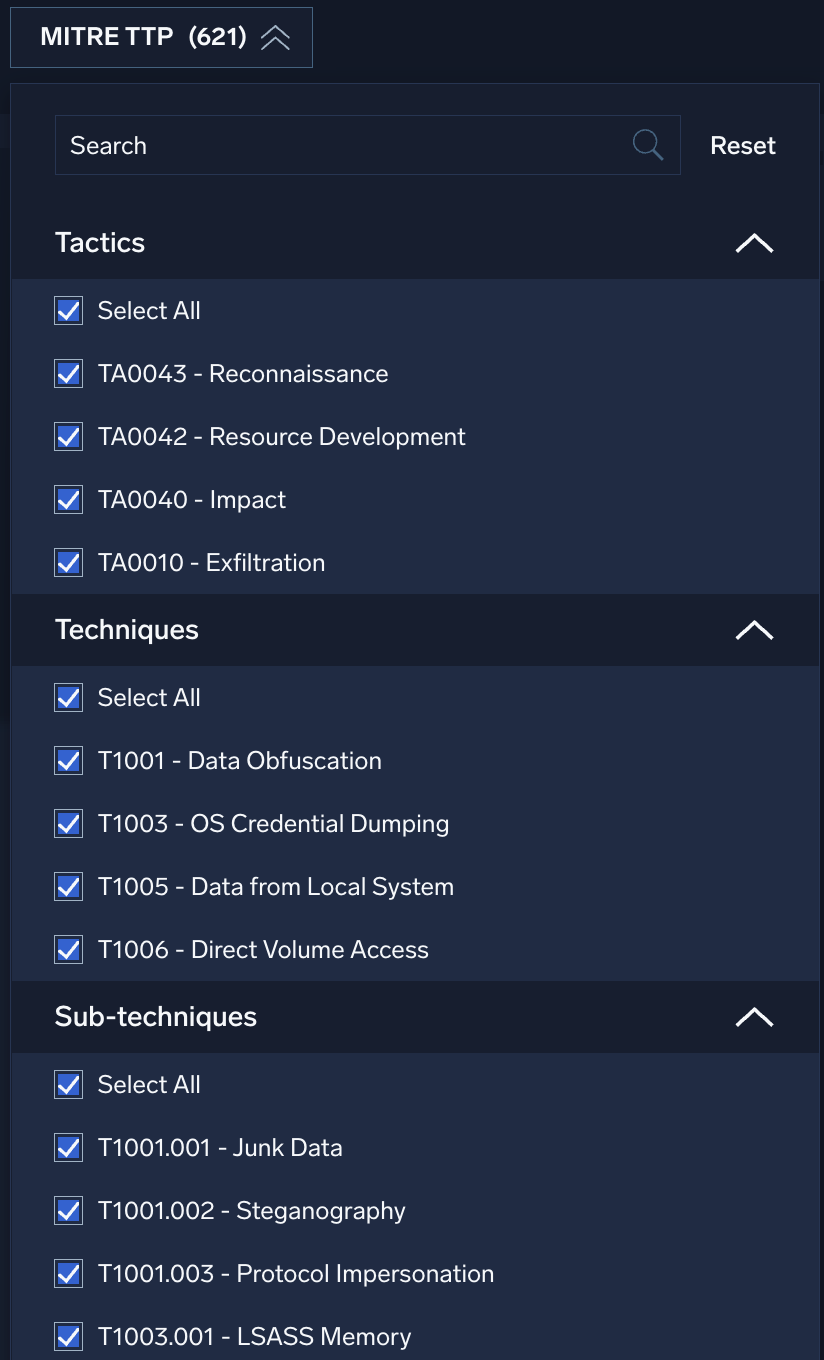
- MITRE TTP. Click to filter on MITRE tactics, techniques, and sub-techniques.
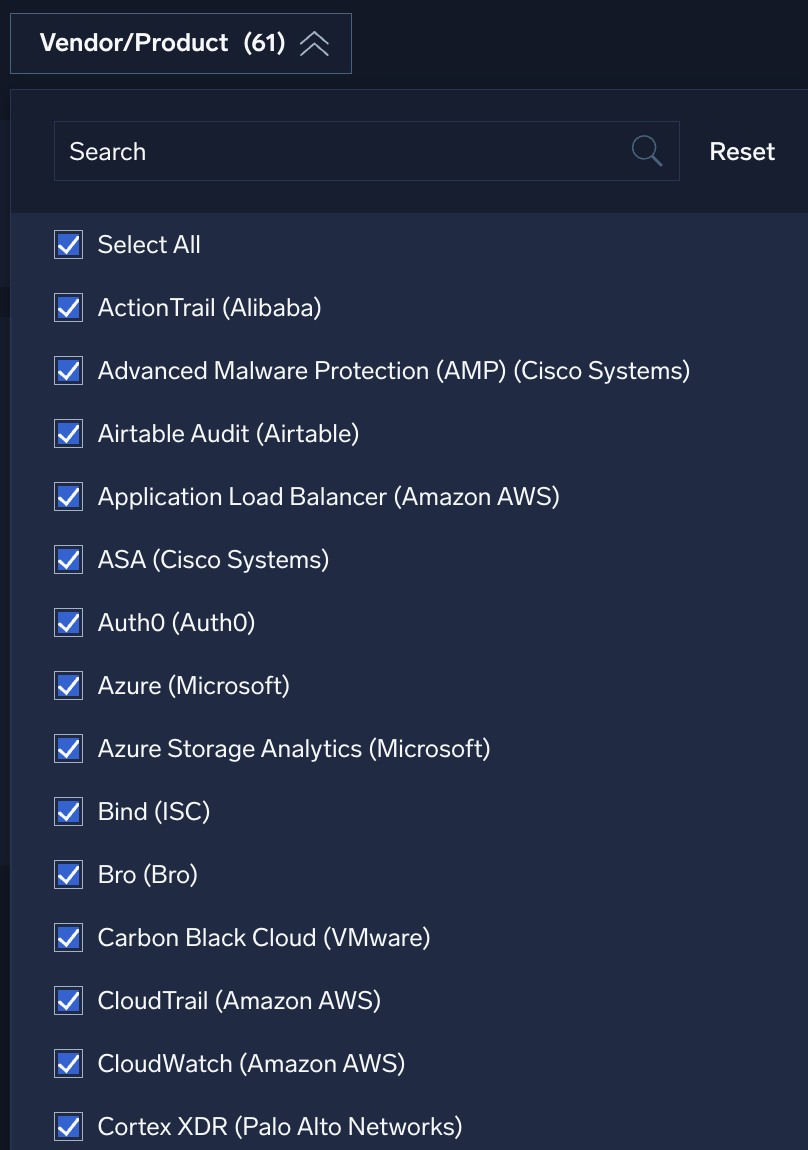
- Vendor/Product. Click to filter on vendors and products that provide data sources. Select particular vendors to help you evaluate their coverage.
- Cloud SIEM Rules. Click to filter on standard Cloud SIEM rules.
- User Rules. Click to filter on rules created by your organization.
- Coverage. Click to filter on coverage provided (high to none).
- Visual Settings. Determine how tiles look on the page.
- Technique Coverage. The number of techniques covered. Note that it is impossible to get 100% coverage, because some techniques are undetectable by their very nature.
- Sub-Technique Coverage. The number of sub-techniques covered.
- Coverage Type. Key to the colors indicating coverage:
- High (7 or more rules)
- Medium (4-6 rules)
- Low (1-3 rules)
- None (no rules)
- Not detectable (by a SIEM)
- Filter not applied
- Matrix. The techniques from the MITRE Enterprise matrix. When you click a square, a panel appears with details showing your coverage for that technique.
Benefits
- Use Theoretical Coverage to understand the content that Cloud SIEM includes out-of-the-box, and compare this with other SIEM solutions.
- Track Theoretical Coverage over time to see the coverage levels increase as Sumo Logic deploys new content and you write new rules.
- Use Theoretical Coverage to prioritize which custom rules to write, and use Recent Activity to support this as well as your rule tuning efforts.
- Compare Recent Activity to Theoretical Coverage to see if rules that provide coverage are actually creating signals in your environment. If they are not creating signals, you'll need to investigate why not.
- Use the data in Recent Activity to help justify the value of Cloud SIEM. Anywhere a cell is lit up, Cloud SIEM has detected potential malicious activity that matches that technique. In addition, by deselecting and selecting Vendor/Product log sources, you can see the contribution (and therefore the value) of any particular log source to that coverage.
- Use the data in Community Activity to better understand the contribution (and therefore the value) of any particular log source, even those they are not currently ingesting into Cloud SIEM. This could help justify additional data ingest into Cloud SIEM, or justify a better balance of data sources to get optimal coverage.
- Export the data in these views in the standard MITRE JSON format, and combine it with the data exported by other security tools in your environment, to get the total coverage of all of the tools in your environment.
Technique details
When you click a square in the matrix, details about coverage for that MITRE technique display in a panel. The description displayed is pulled directly from the MITRE Enterprise matrix. The panel includes an assessment of your coverage (None, Low, Medium, and High). A coverage of None does not mean you have no coverage; it only means you might not have enough rules to adequately cover the technique.
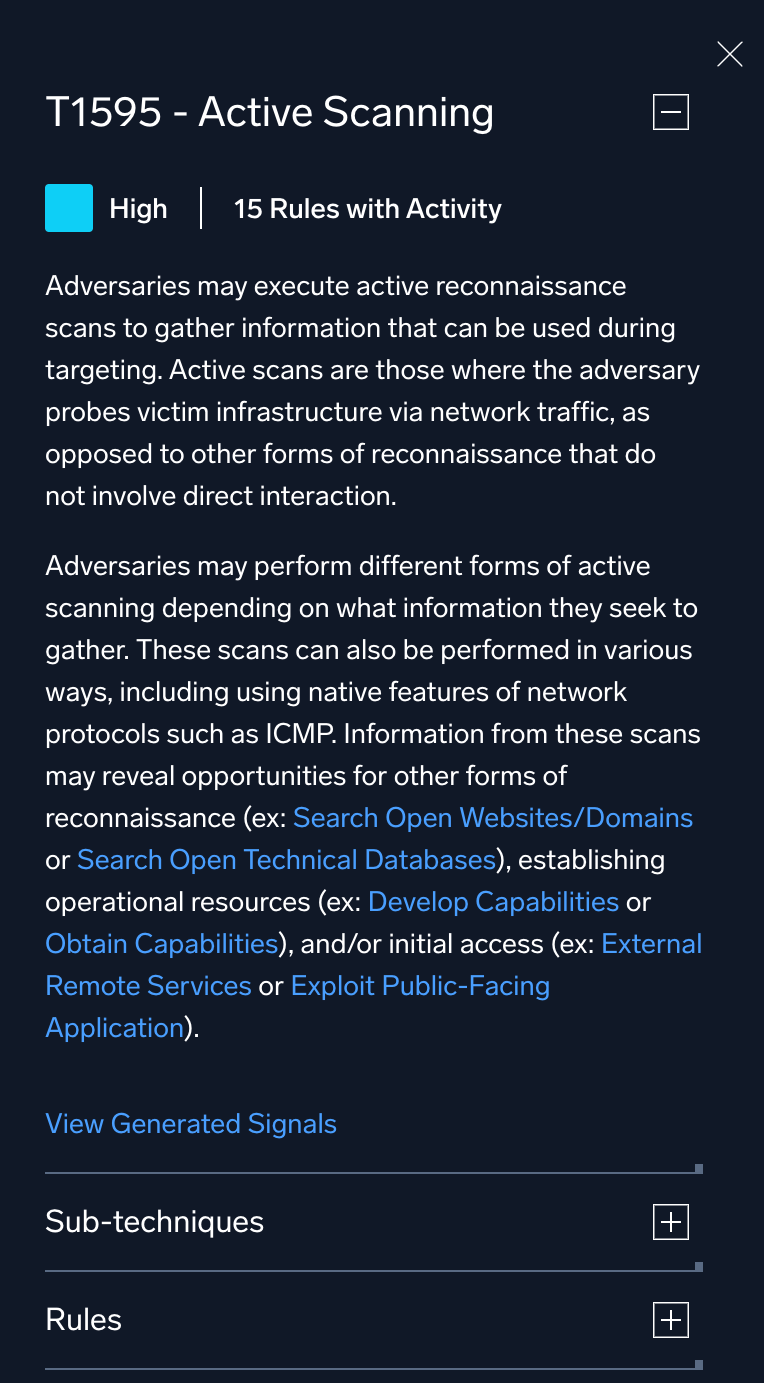
Select the following for details:
- View Generated Signals. See the current signals in Cloud SIEM that have been tagged with that MITRE technique.
- Sub-Techniques. See the sub-techniques for that technique.
- Rules. See a list of all the rules that contribute to coverage for the technique. Click a rule in the list to open the rule.
Visual Settings
Click this button ![]() to launch the Visual Settings dialog.
to launch the Visual Settings dialog.
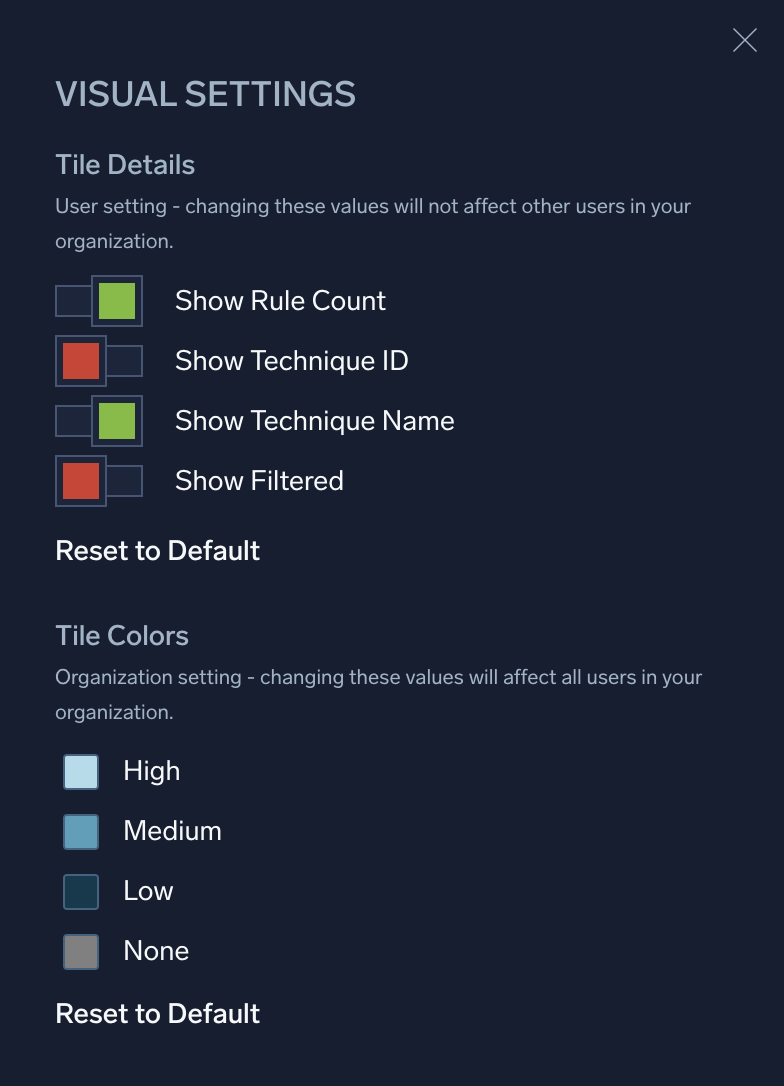
Use the following to configure visual settings:
- Tile Details
- Show Rule Count. Show the number of rules covering the technique.
- Show Technique ID. Show the ID of the technique in the tile.
- Show Technique Name. Show the name of the technique in the tile.
- Show Filtered. Show only techniques that are filtered.
- Tile Colors. Click the colored box to the left of High, Medium, Low, or None to select a new color to apply.
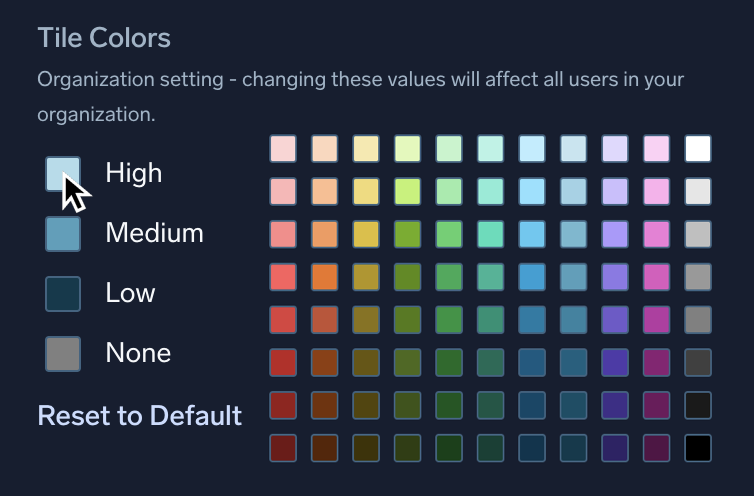
- Reset to Default. Reset visuals to the default settings.
Filters

Select filters to narrow your search:
MITRE TTP
Use the MITRE TTP filter to search for specific MITRE tactics, techniques, and sub-techniques. Used in combination with the Product/Vendor filter, you can see exactly which data sources provide coverage for specific TTPs.
Vendor/Product
Use the Vendor/Product filter to search for data sources in your environment to see how well they provide coverage. Filtering on specific products and vendors helps you determine which provide the best coverage. Add or remove items from the list to see how different combinations provide coverage for the specific techniques you are most concerned about.
This filter is only enabled if you first select Recent Activity or All Community Activity.
Custom rules and vendors/products
Vendors and products appear in the Vendor/Product filter when rules with MITRE tags generate signals from logs provided by those vendors and products.
If you have custom rules that refer to vendors and products, those vendors and products will not appear in the Vendor/Product filter unless they are already added to log mapping.
To add a new vendor and product to log mapping:
- Follow the directions in Create a Structured Log Mapping.
- In the screen where you you create a new mapping, navigate to the If Input Matches area.
- In the When a log from vendor field, type the vendor name as it appears in messages generated by the product and click the Create "
<vendor name>" button that appears beneath the field.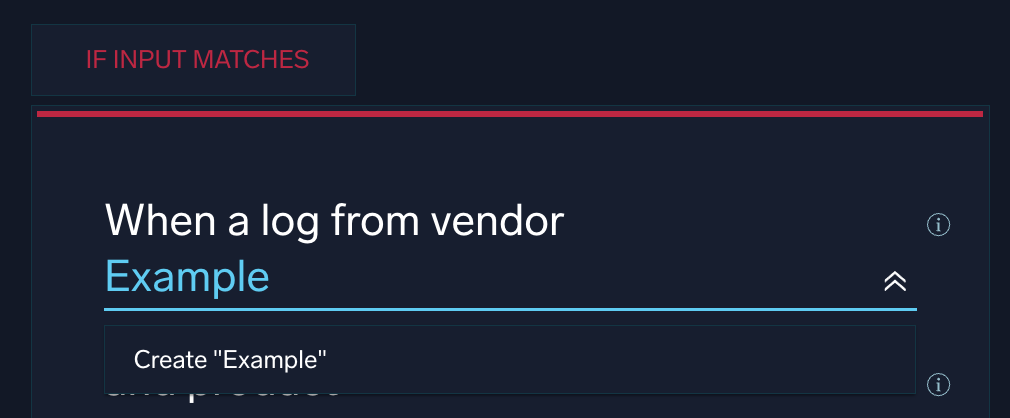
- In the and product field, type the product name as it appears in messages generated by the product and click the Create "
<product name>" button that appears beneath the field.
Once the vendor and product appear in the log mapping list, custom rules can refer to them, and the system can successfully generate signals from the logs. Then the vendor and product will display in the Vendor/Product filter.
Cloud SIEM rules
Use the Cloud SIEM Rules filter to filter on standard Cloud SIEM rules. For details about standard Cloud SIEM rules, see our Cloud SIEM Content Catalog.
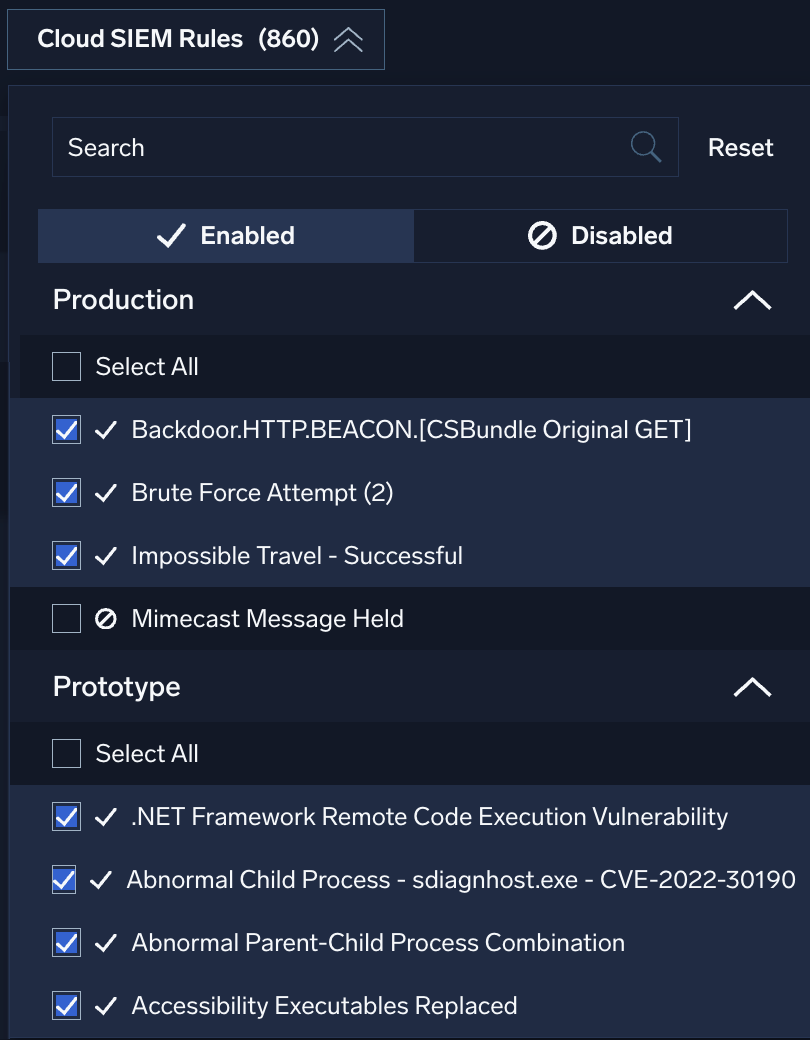
Use the following settings to filter Cloud SIEM rules:
- Search. Search for rules by name.
- Enabled / Disabled. Every rule has a toggle that lets you enable or disable it:


Use this filter to see only those rules that are enabled, disabled, or both. - Production. See rules actively used in production.
- Prototype. See rules that are saved as prototype.
User rules
Use the User Rules filter to filter on rules created by your organization.
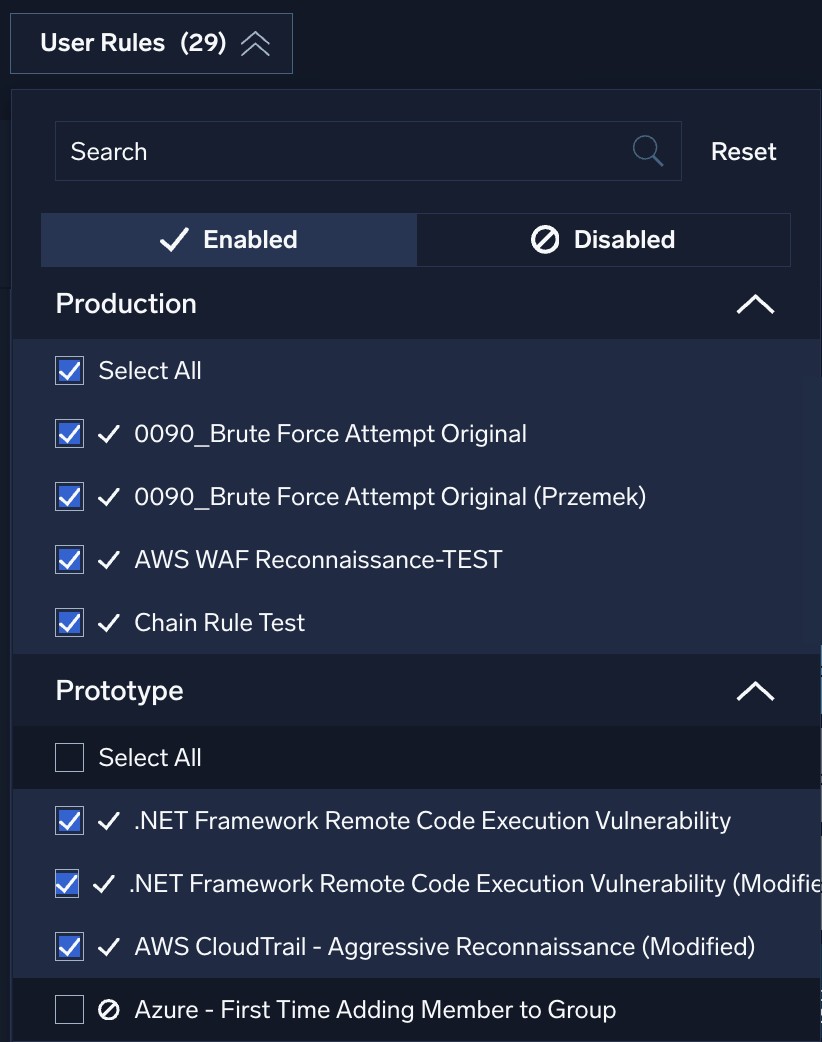
Use the following settings to filter user rules:
- Search. Search for rules by name.
- Enabled / Disabled. Every rule has a toggle that lets you enable or disable it:


Use this filter to see only those rules that are enabled, disabled, or both. - Production. See rules actively used in production.
- Prototype. See rules that are saved as prototype.
Coverage
Click the Coverage filter to view coverage provided.
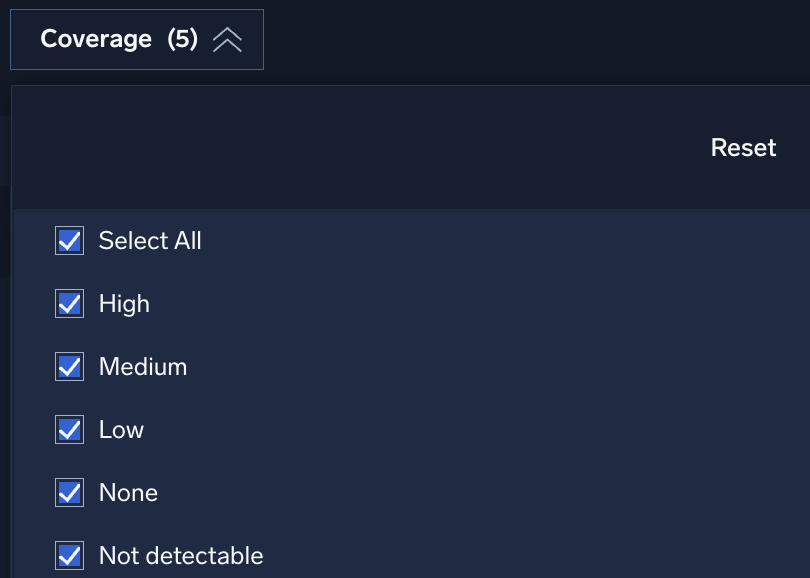
Select the values to filter:
- High. 7 or more rules
- Medium. 4-6 rules
- Low. 1-3 rules
- None. No rules
- Not detectable. Not detectable by a SIEM
Audit logging for MITRE ATT&CK coverage
MITRE ATT&CK coverage events are recorded in the System Event Index. To query for MITRE ATT&CK events, run this query:
_index=sumologic_system_events _sourceCategory=cseMitreAttackCoverage
For more information about how to query for audit log events, see Cloud SIEM Audit Logging
MITRE ATT&CK coverage APIs
You can use the following Cloud SIEM APIs to obtain information about your MITRE ATT&CK coverage:
- MitreTaggedRules. Get a list of Mitre ATT&CK tagged rules.
- MitreAttackCoverageExportJson. Get a JSON representation of the Mitre ATT&CK coverage.
To find the Cloud SIEM API documentation for your endpoint, see Cloud SIEM APIs.
Additional resources
- Blog: Enhance your cloud security with MITRE ATT&CK and Sumo Logic Cloud SIEM
- Glossary: MITRE ATT&CK - definition & overview
- Demo: MITRE ATT&CK Coverage Explorer
- Cloud SIEM Content Catalog: Vendors