About the Insight UI
This topic describes the Cloud SIEM UI for working with insights.
Insights list page
Classic UI. To open the insights page, click Insights at the top of the screen.
New UI. To open the insights page, in the main Sumo Logic menu select Cloud SIEM > Insights. You can also click Go To... at the top of the screen and select Insights.
By default, the Insights page presents all insights whose status is not “Closed”, in descending order by event time in a list view. If you’d like to see insights organized by their status, click the Show Board icon near the top right corner of the page. For information about the board view, see Board view.
Cloud SIEM displays insights and the signals attached to them in the Cloud SIEM UI through the end of the data retention period defined in your account agreement.
List view
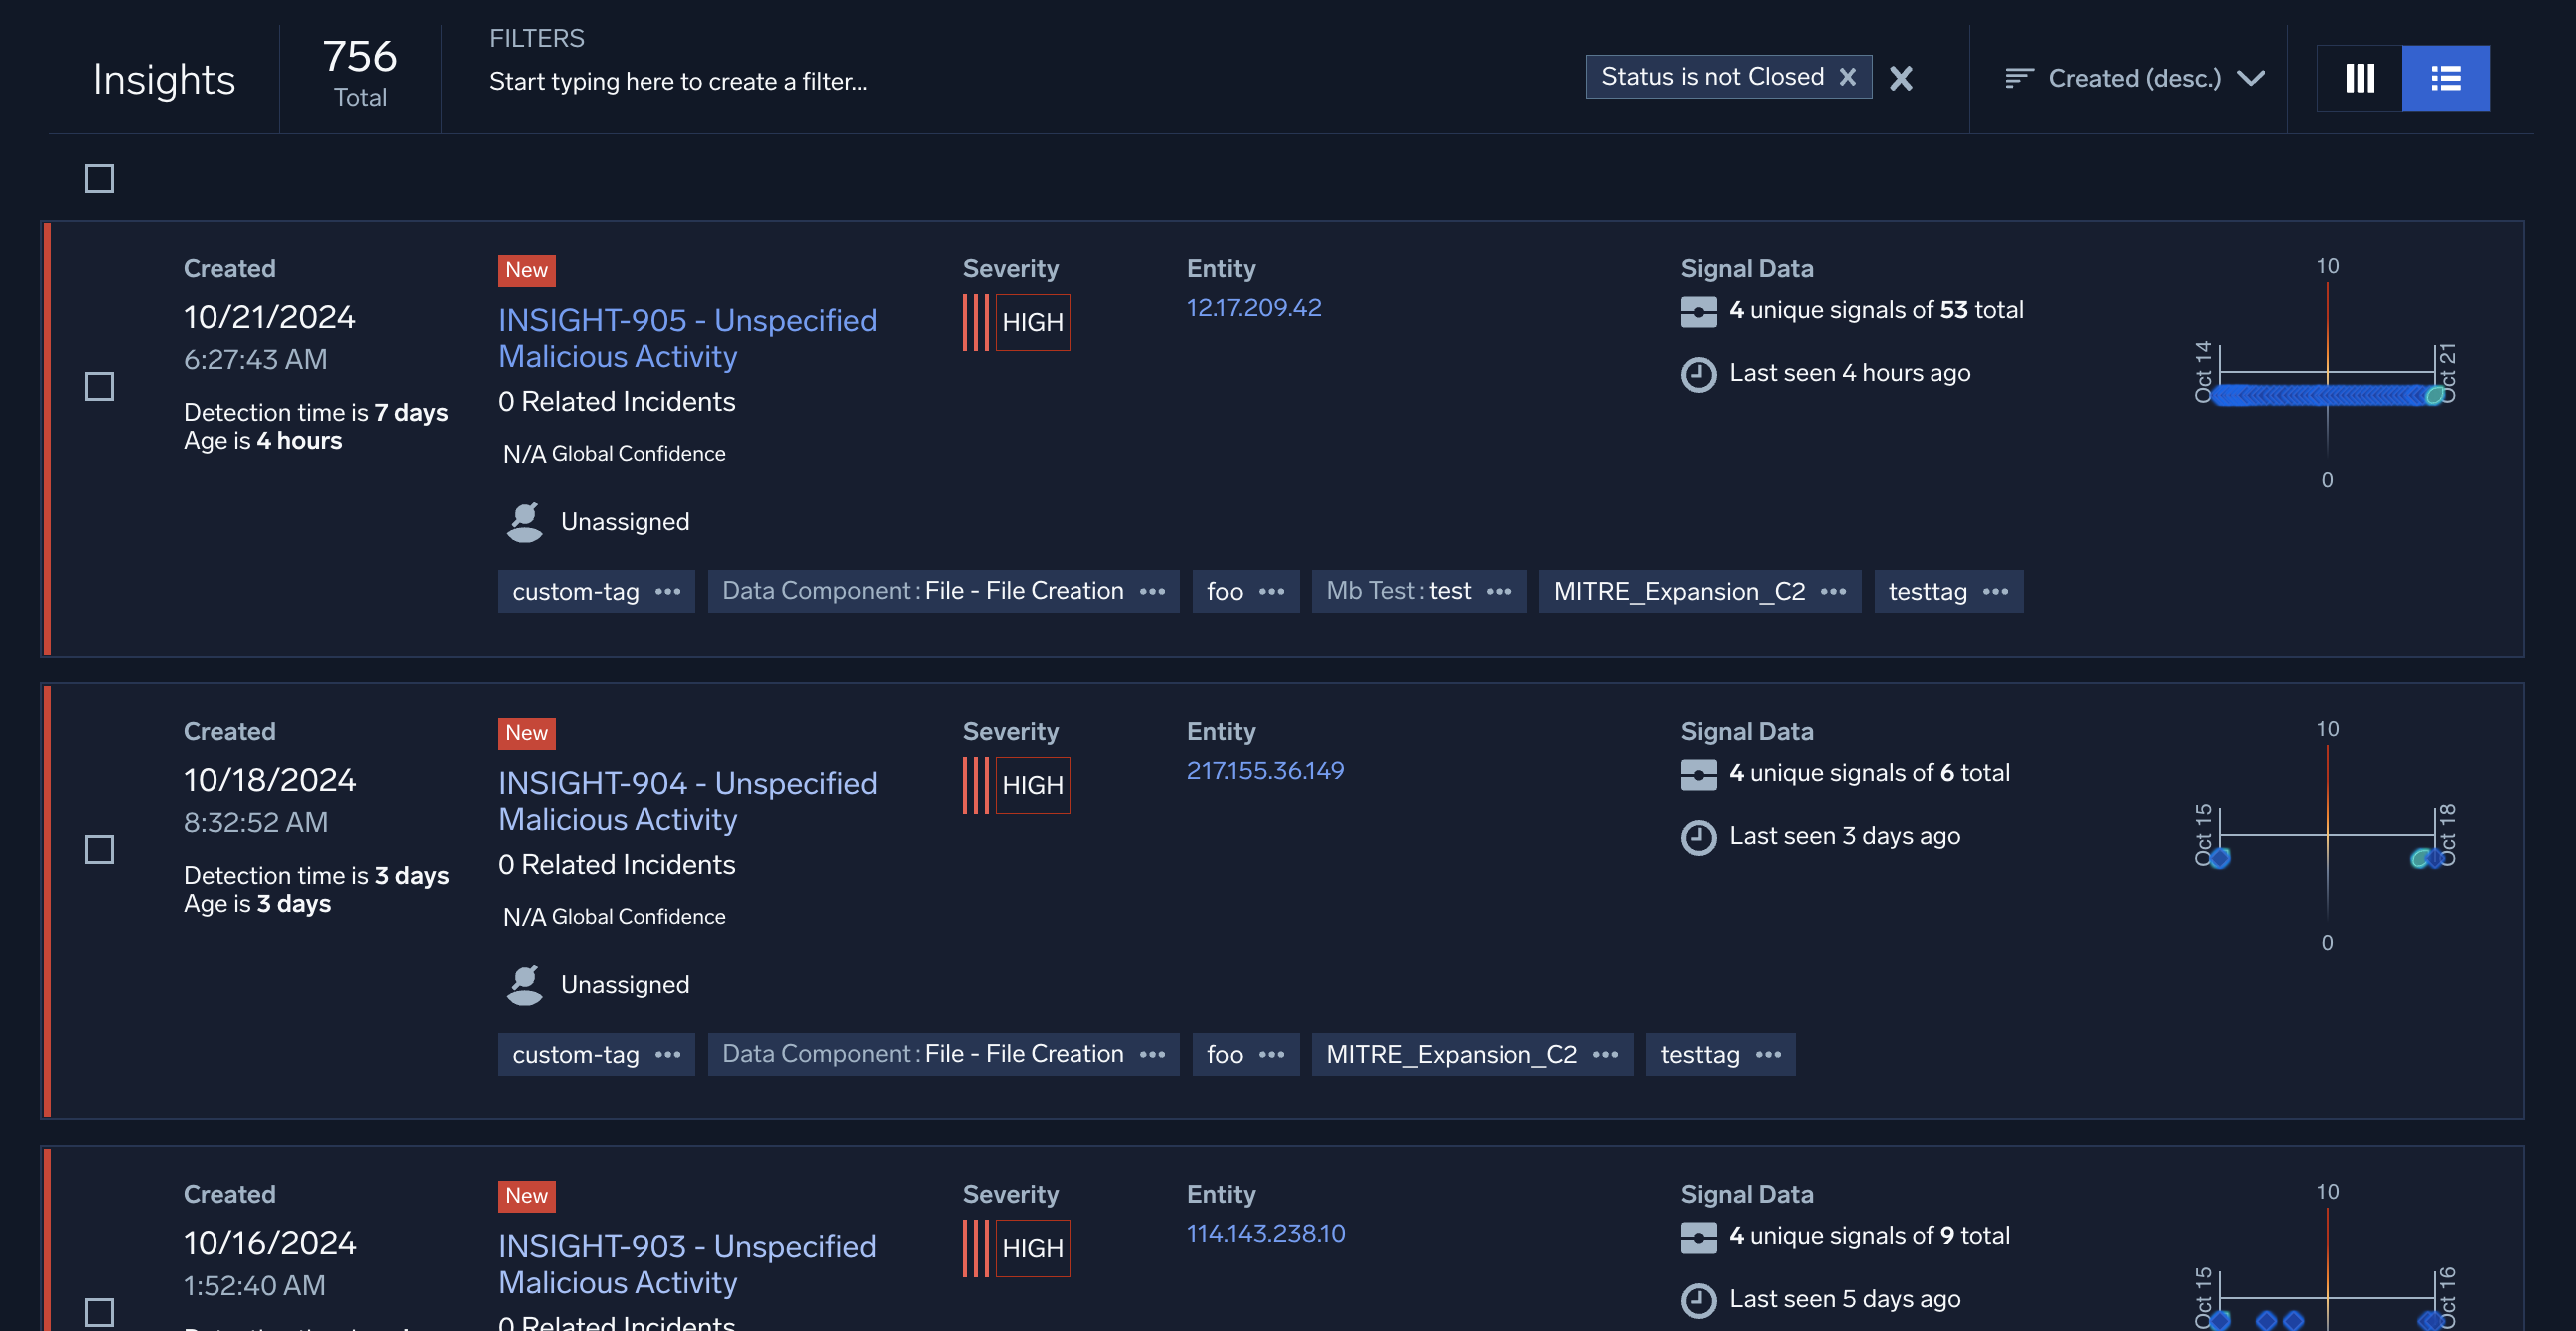
This screenshot shows the Insights page in list view.
Here’s one row from the List view. The numbered definitions below correspond to the labels in the screenshot.
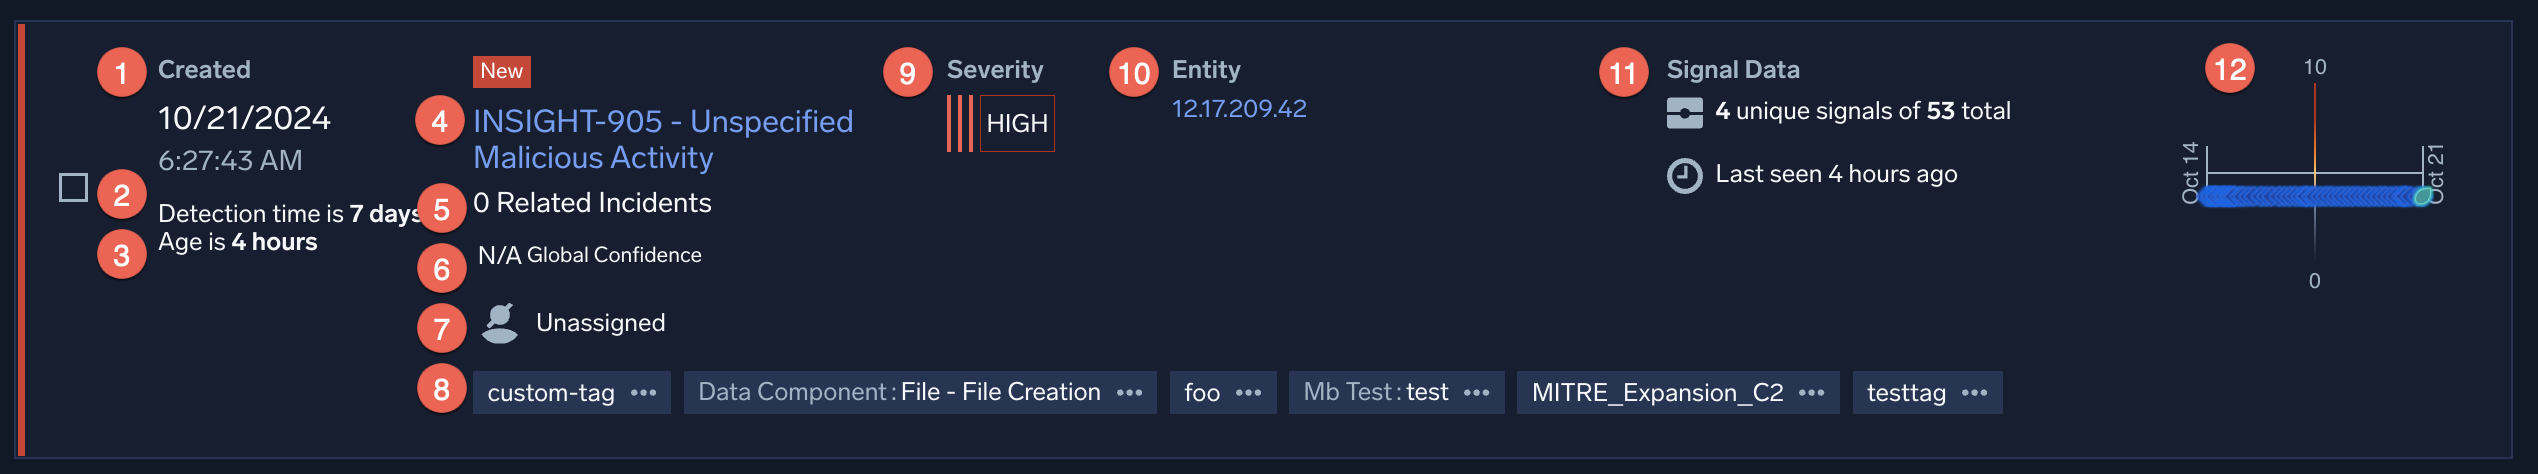
- Creation date and time. When the insight was created.
- Detection time. The time between when the first event happened (when the first record in the insight occurred) and when the insight was generated. (This differs from "dwell time", which is the time between when the first record and the last record occurred in an insight.)
- Age. The elapsed time since the insight was created.
- Insight name. The insight name, made up of the insight ID, and the MITRE stage or stages associated with the signals in the insight.
- Related incidents. Incidents that share common entities and other characteristics.
- Global Confidence. If sufficient data is available, a Global Confidence score for the insight is shown.
- Assignee. The analyst assigned to the Incident.
- The MITRE ATT&CK tactics and techniques exhibited by the insight.
- Severity. The severity of the insight. The value is a function of the configured entity activity score threshold for insight generation. For more information, see About insight severity.
- Entity. The entity associated with the insight.
- Signal Data. This area has three bits of information:
- The count of signals that caused the insight to be created.
- The total count of signals on the insight entity during the detection window.
- How long it's been since the last signal fired associated with the insight fired.
- The visualization plots the insight's signals over time (x-axis) by severity (y-axis).
Board view
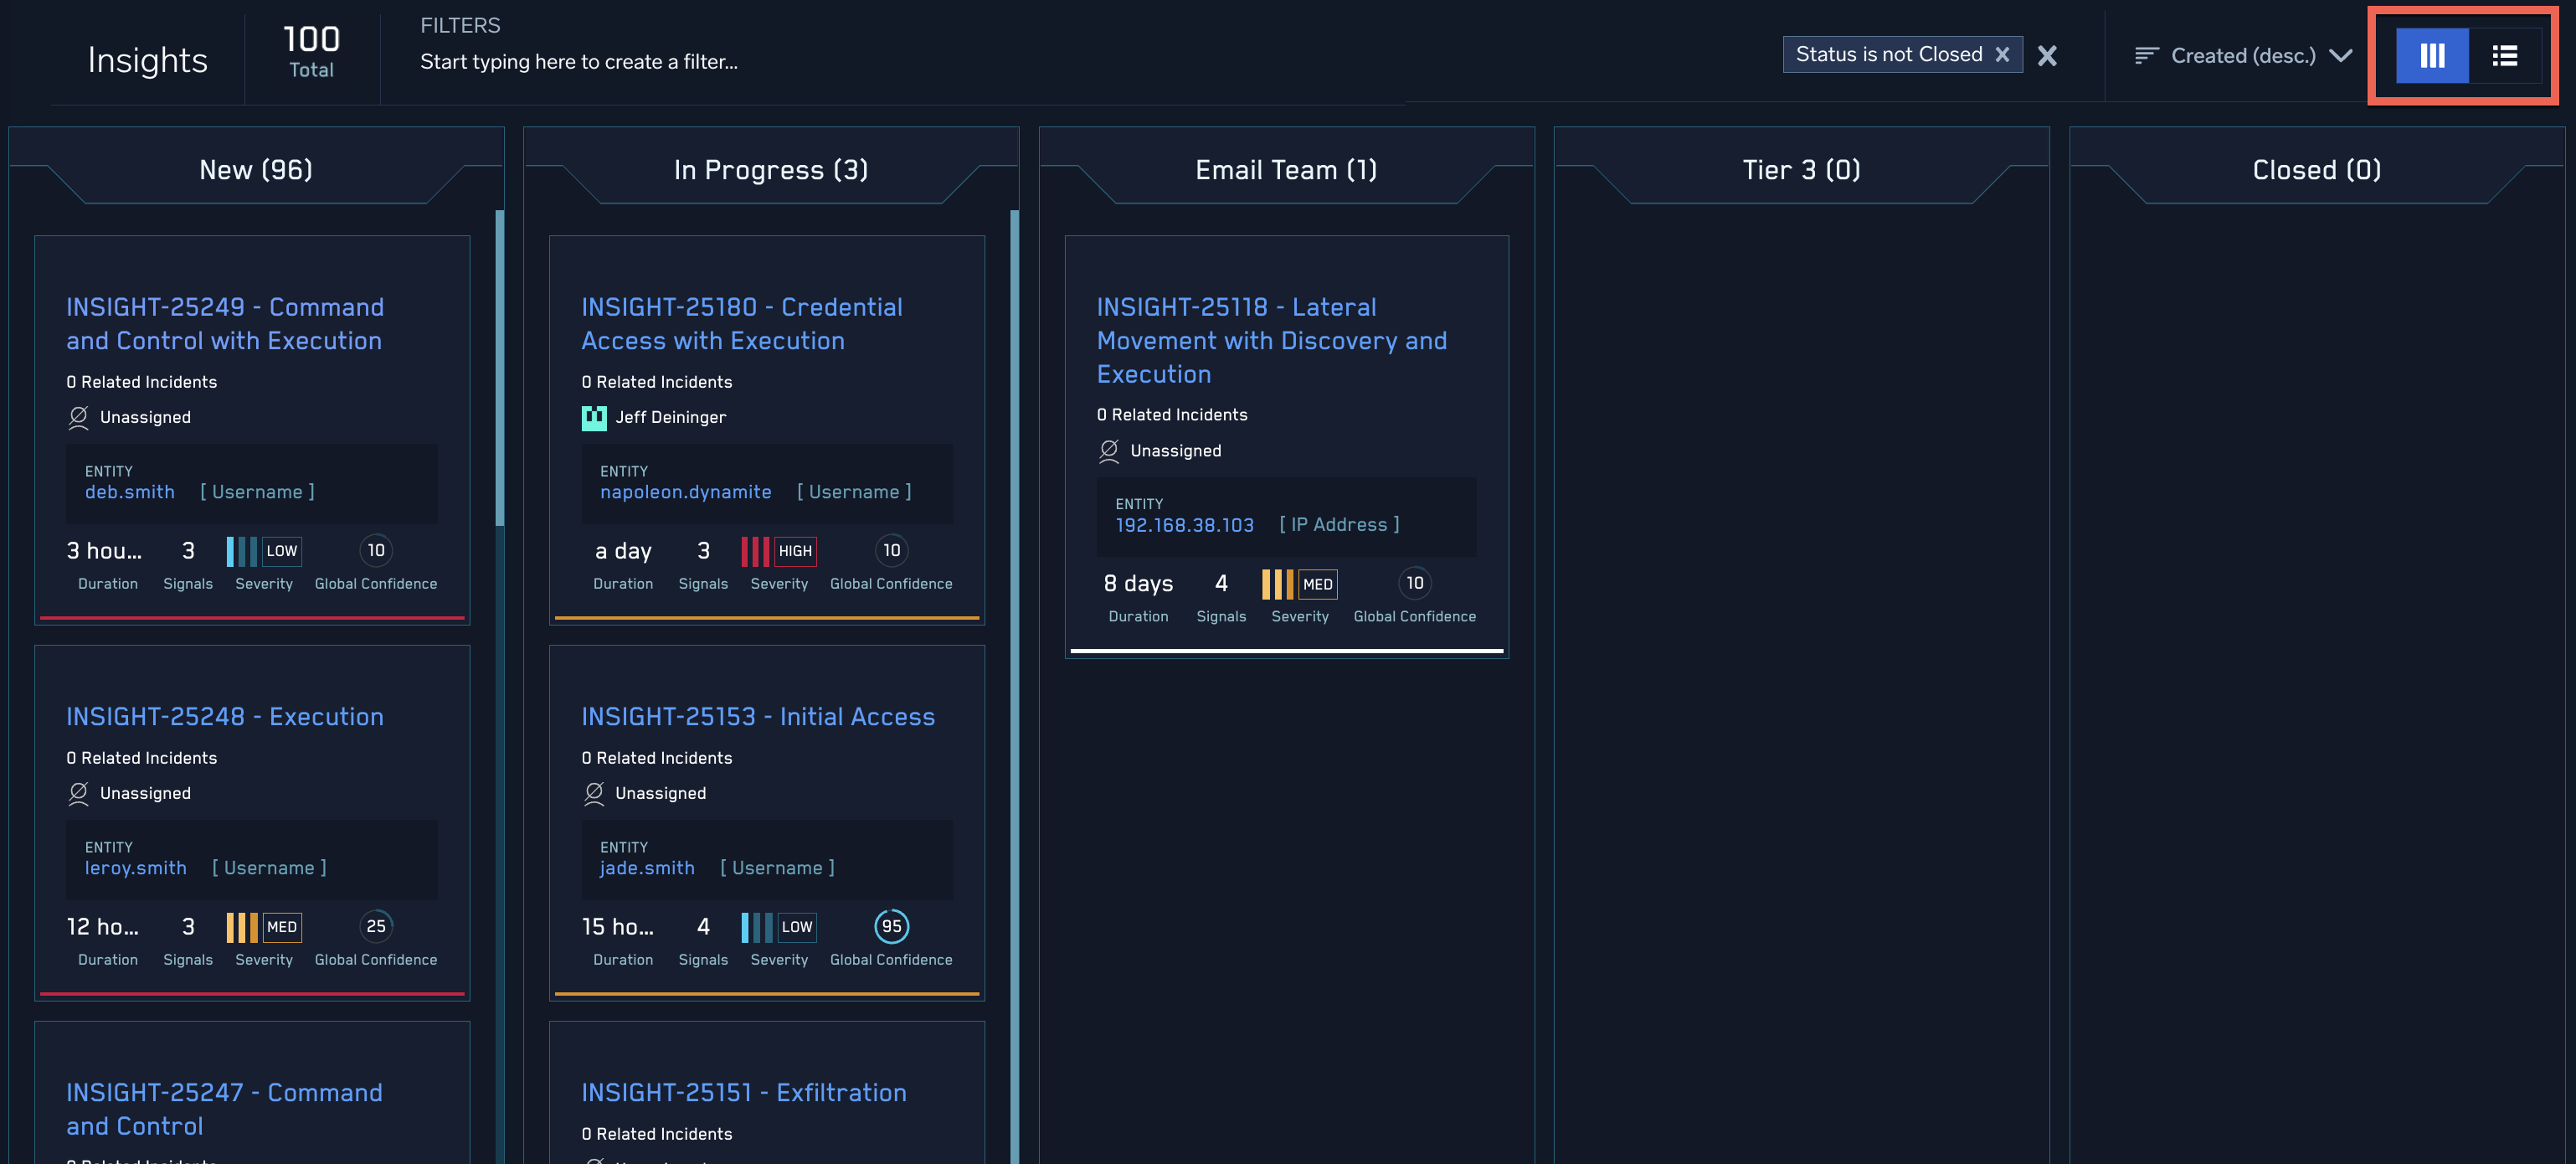
This screenshot shows the insights page with the signals organized as a board. Each of the columns corresponds to an insight status value. (One of the status values shown is a custom insight status).
The information displayed in the board view is similar to the information in the list view.
You can switch back to the list view by clicking the Show List icon, near the top right corner of the Cloud SIEM UI.
Filtering insights
You can use the Filters area near the top of the page to narrow down the insights that appear on the insights page. You can filter by:
- Assignee
- Custom resolution
- Created
- Entity
- Event Time
- Name
- Resolution
- Rule ID
- Severity
- Status
- Tags
View insights in child organizations
If you manage a parent organization with child organizations that also use Cloud SIEM, you can see a list of all insights across multiple child organizations. This is useful if your company is a large enterprise with many organizations or is a Managed Security Service Provider (MSSP), and you'd like to see all insights across all areas in a single page.
This multi-insights list page (also known as a "federated" page) shows insights just as in a normal insights list page. However, when you click an insight on the page, it opens the insight's details in the child organization's UI. You can also use the board view on the multi-insights page to move insights to different statuses.
To be able to see insights in child organizations, add child organizations that use Cloud SIEM. Then when the parent organization user goes to their Cloud SIEM insights list page, all the child organizations' insights appear in the list.
Insight details page
From the HUD screen, list view, or board view, click an insight's name to see its details.
Insight details pane
The left pane of the insight details page displays detailed information about the selected insight. Some of the information that appears is the same as what’s in the row for an insight on the Insights page, and is described in List view, above. The additional information that appears in the details pane is defined below.
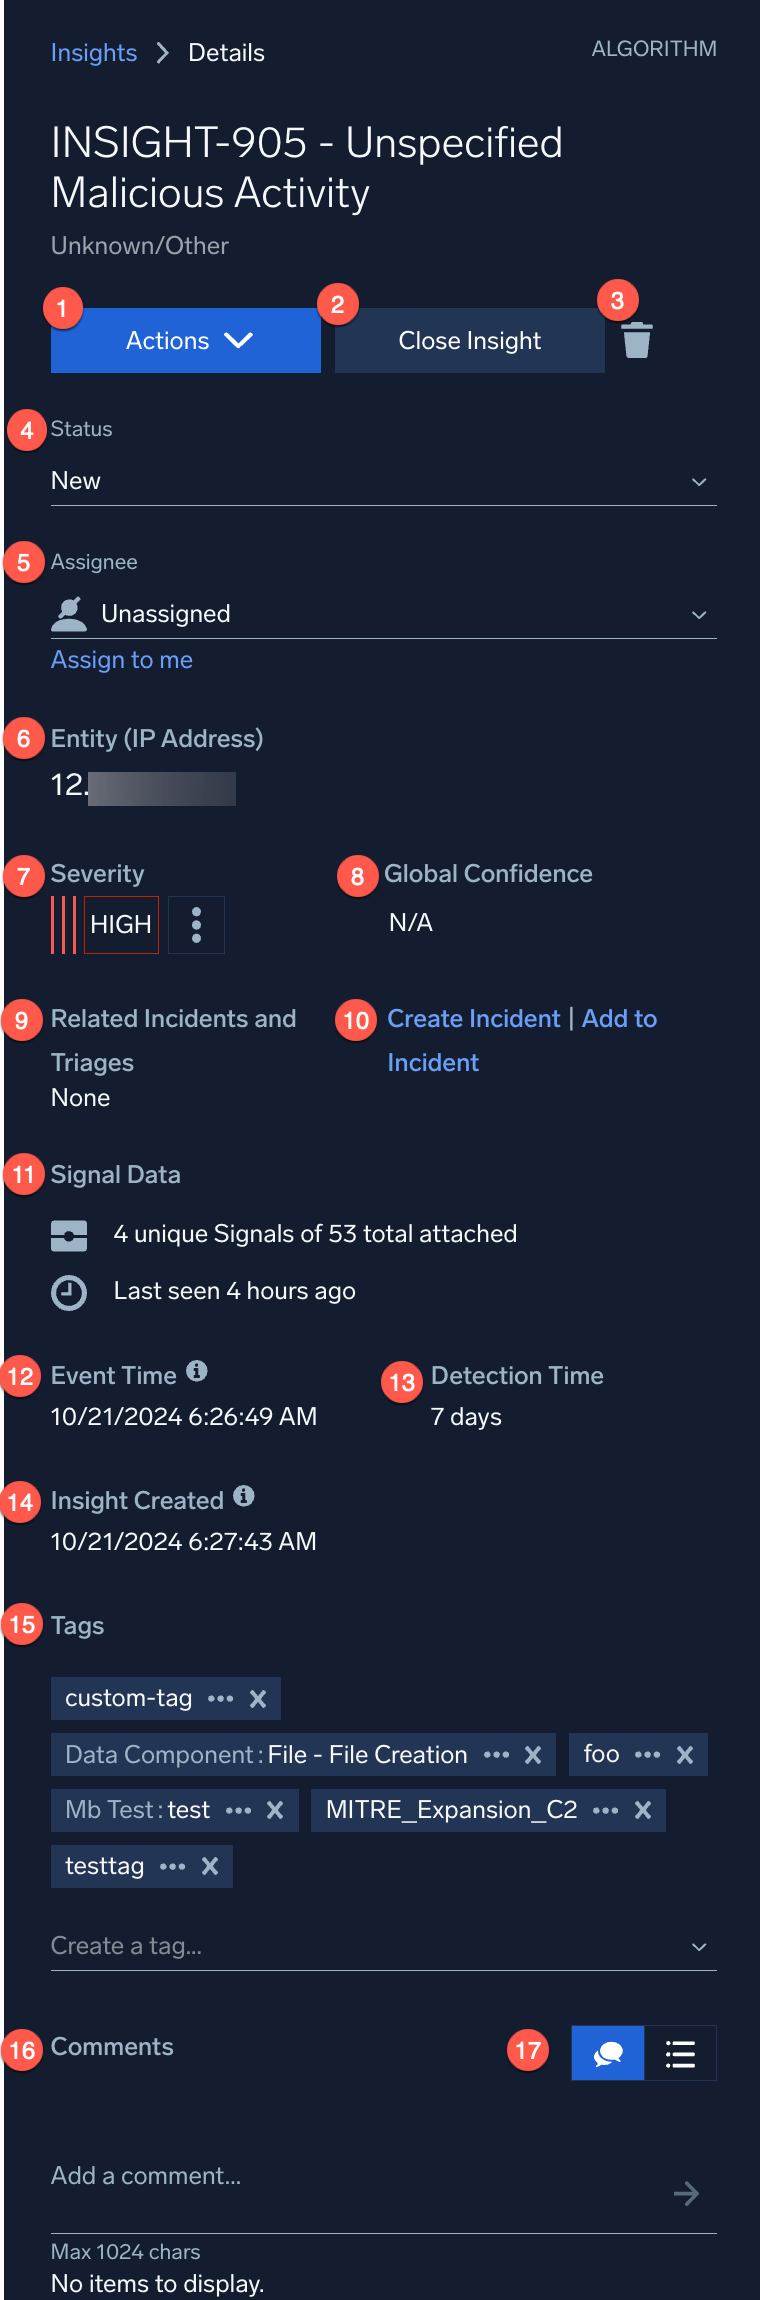
- Actions. The insight actions defined in your environment.
- Close Insight. Use this option to close an insight. When you click this option, you’re prompted to select an insight resolution.
- Delete Icon. Use this option to delete an insight. You’ll be prompted to confirm your choice.
- Status. Current status of the insight.
- Assignee and Assign to me. Shows the current assignee and allows you to assign yourself the insight.
- Entity. The entity the insight fired on.
- Severity. Severity of the insight. Mouse over it to see an icon you can click to change the insight severity.
- Global Confidence. The Global Confidence score for the insight, if available.
- Related Incidents and Triages. Incidents and triages that are related to this insight.
- Create Incident | Add to Incident. Create an incident for the insight, or add the insight to an existing incident.
- Signal Data. The number of signals in the insight.
- Event Time. The event time for the of the last signal in the insight.
- Detection Time. The time between when the first event happened (when the first record in the insight occurred) and when the insight was generated. (This differs from "dwell time", which is the time between when the first record and the last record occurred in an insight.)
- Insight Created. When the insight was created.
- Tags and Create a tag. Displays any tags that have already been assigned to the insight, and a field for adding a tag.
- Comments. Displays any comments that have been made on the insight, and a field for adding a comment.
- Show Comments/History. The controls allow you to switch between viewing the insight's comments and history.
Signal visualization area
At the top of the insight details page, you’ll see a signal timeline that visualizes the insight’s attached signals, which are the signals that caused the insight to be created, and any signals that have been manually added to the insight.
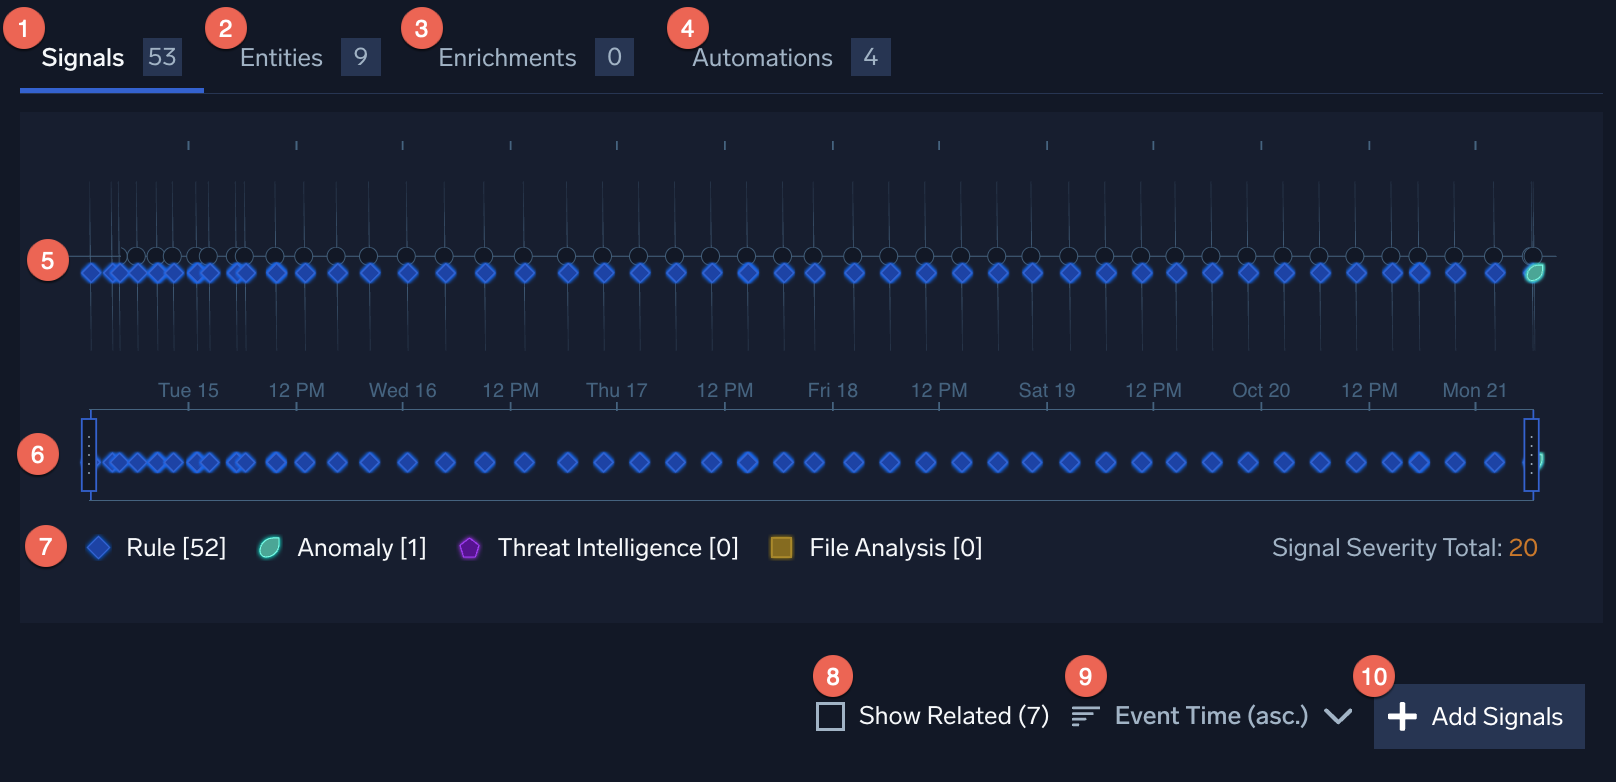
- Signals. The signals link allows you to switch back to the signals view from the Enrichments view, described below.
- Entities. Click to view entities on the signal.
- Enrichments. Click this tab to view any enrichments that have been added to the insight, including the output of the insight Enrichment Server.
- Automations. Click to view automations on the insight.
- Signal timeline. The timeline shows how spread apart each signal in the insight is. You can use the timeline to visualize how long these events are spread over and how often the signals fire.
- Timeline controls. The arrows on the far left and right sides allow you to toggle between each signal to show the details on each. You can also click a specific signal on the timeline to jump to those details.
- Legend. Key to the symbols used to represent the signals:
- Rule. Signals that were triggered by other rules.
- Anomaly. Signals that were triggered by User and Entity Behavior Analytics (UEBA) rules.
- Threat intelligence. Signals that were fired by Threat Intel rules.
- File Analysis. Signals that were triggered by Yara file analysis rules.
- Show Related. Click this link to show related signals in addition to attached signals. If you click the Show Related checkbox, the page updates and also displays any related signals or related insights.
- A related signal is a signal that isn’t part of the current insight (it’s not attached), but fired on the same entity as the current insight’s attached signals within 7 days of the current insight’s attached signals.
- A related insight is an insight that a related signal is attached to.
- Sort options. You can sort the signals list by Content Type, Event Time, Created Time, Name, or Severity. Note that you can further sort by ascending or descending value.
- Add Signals. Click this option if you want to add a signal to the insight. You’ll be prompted with a list of signals that have the same entity as the current insight (if there are any), and are not already attached to another insight. A signal that you add to an insight manually is considered an attached signal.
Signal list area
Below the signal timeline, you’ll see a list of signals. By default, only attached signals are displayed.
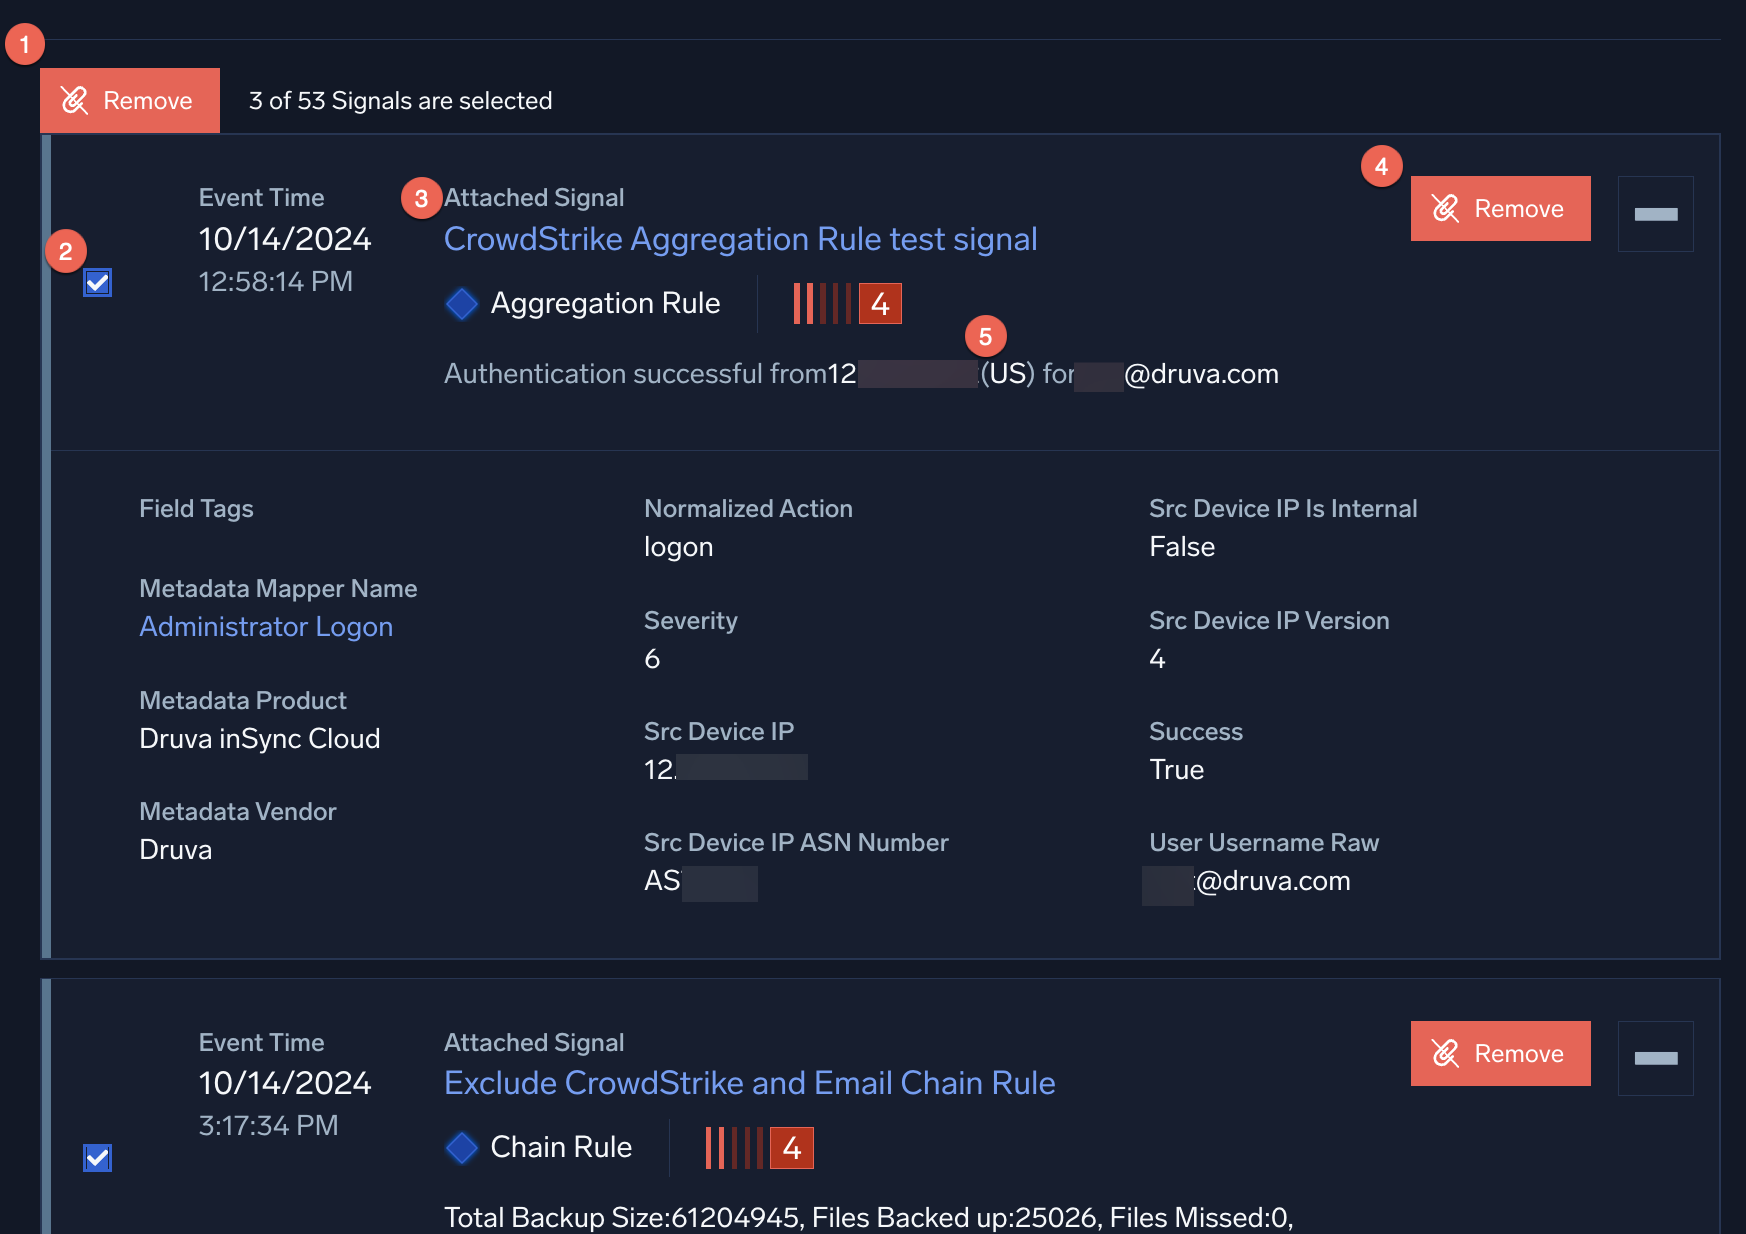
- Remove button. Removes multiple signals selected with the checkbox. You cannot select all signals for removal. If you do, the Remove button is disabled and this message appears when you hover over it with your mouse: Bulk removal of signals is disabled as a minimum of 1 signal must be attached to the insight. Deselect 1 or more signals to enable bulk removal.
- Checkbox. Click to select multiple signals for removal.
- Signal name. Click to view signal details.
- Remove button. Removes an individual signal.
- Entity. The entity associated with the signal. Click to search for the entity, or perform an action on the entity.
Entities tab
The Entities tab displays a list of one or more related entities. This view helps a security analyst more quickly investigate the insight to better understand the scope of a security issue that the insight reveals. Many times, the most interesting entity (perhaps the malicious actor) in an insight is one of these related entities.
An insight is focused on a primary entity. For example, the username or IP address that's found in each of the insight's signals. Related entities expand the analyst’s view to include additional entities that could be relevant to the insight because they are either listed in the records that belong to signals in that insight or Cloud SIEM has determined that they are the same entity as one included in the insight. For example, Cloud SIEM has determined that an IP address may have been associated with a specific hostname at the time the relevant signal was generated.
The Entities tab includes two views, the list view and the graph view. Both views start with the same list of Related entities. However, the graph view can show additional entity relationships extending "outside" of the insight.
About the Entities tab list view
The screenshot below shows the Entities tab list view for an insight.
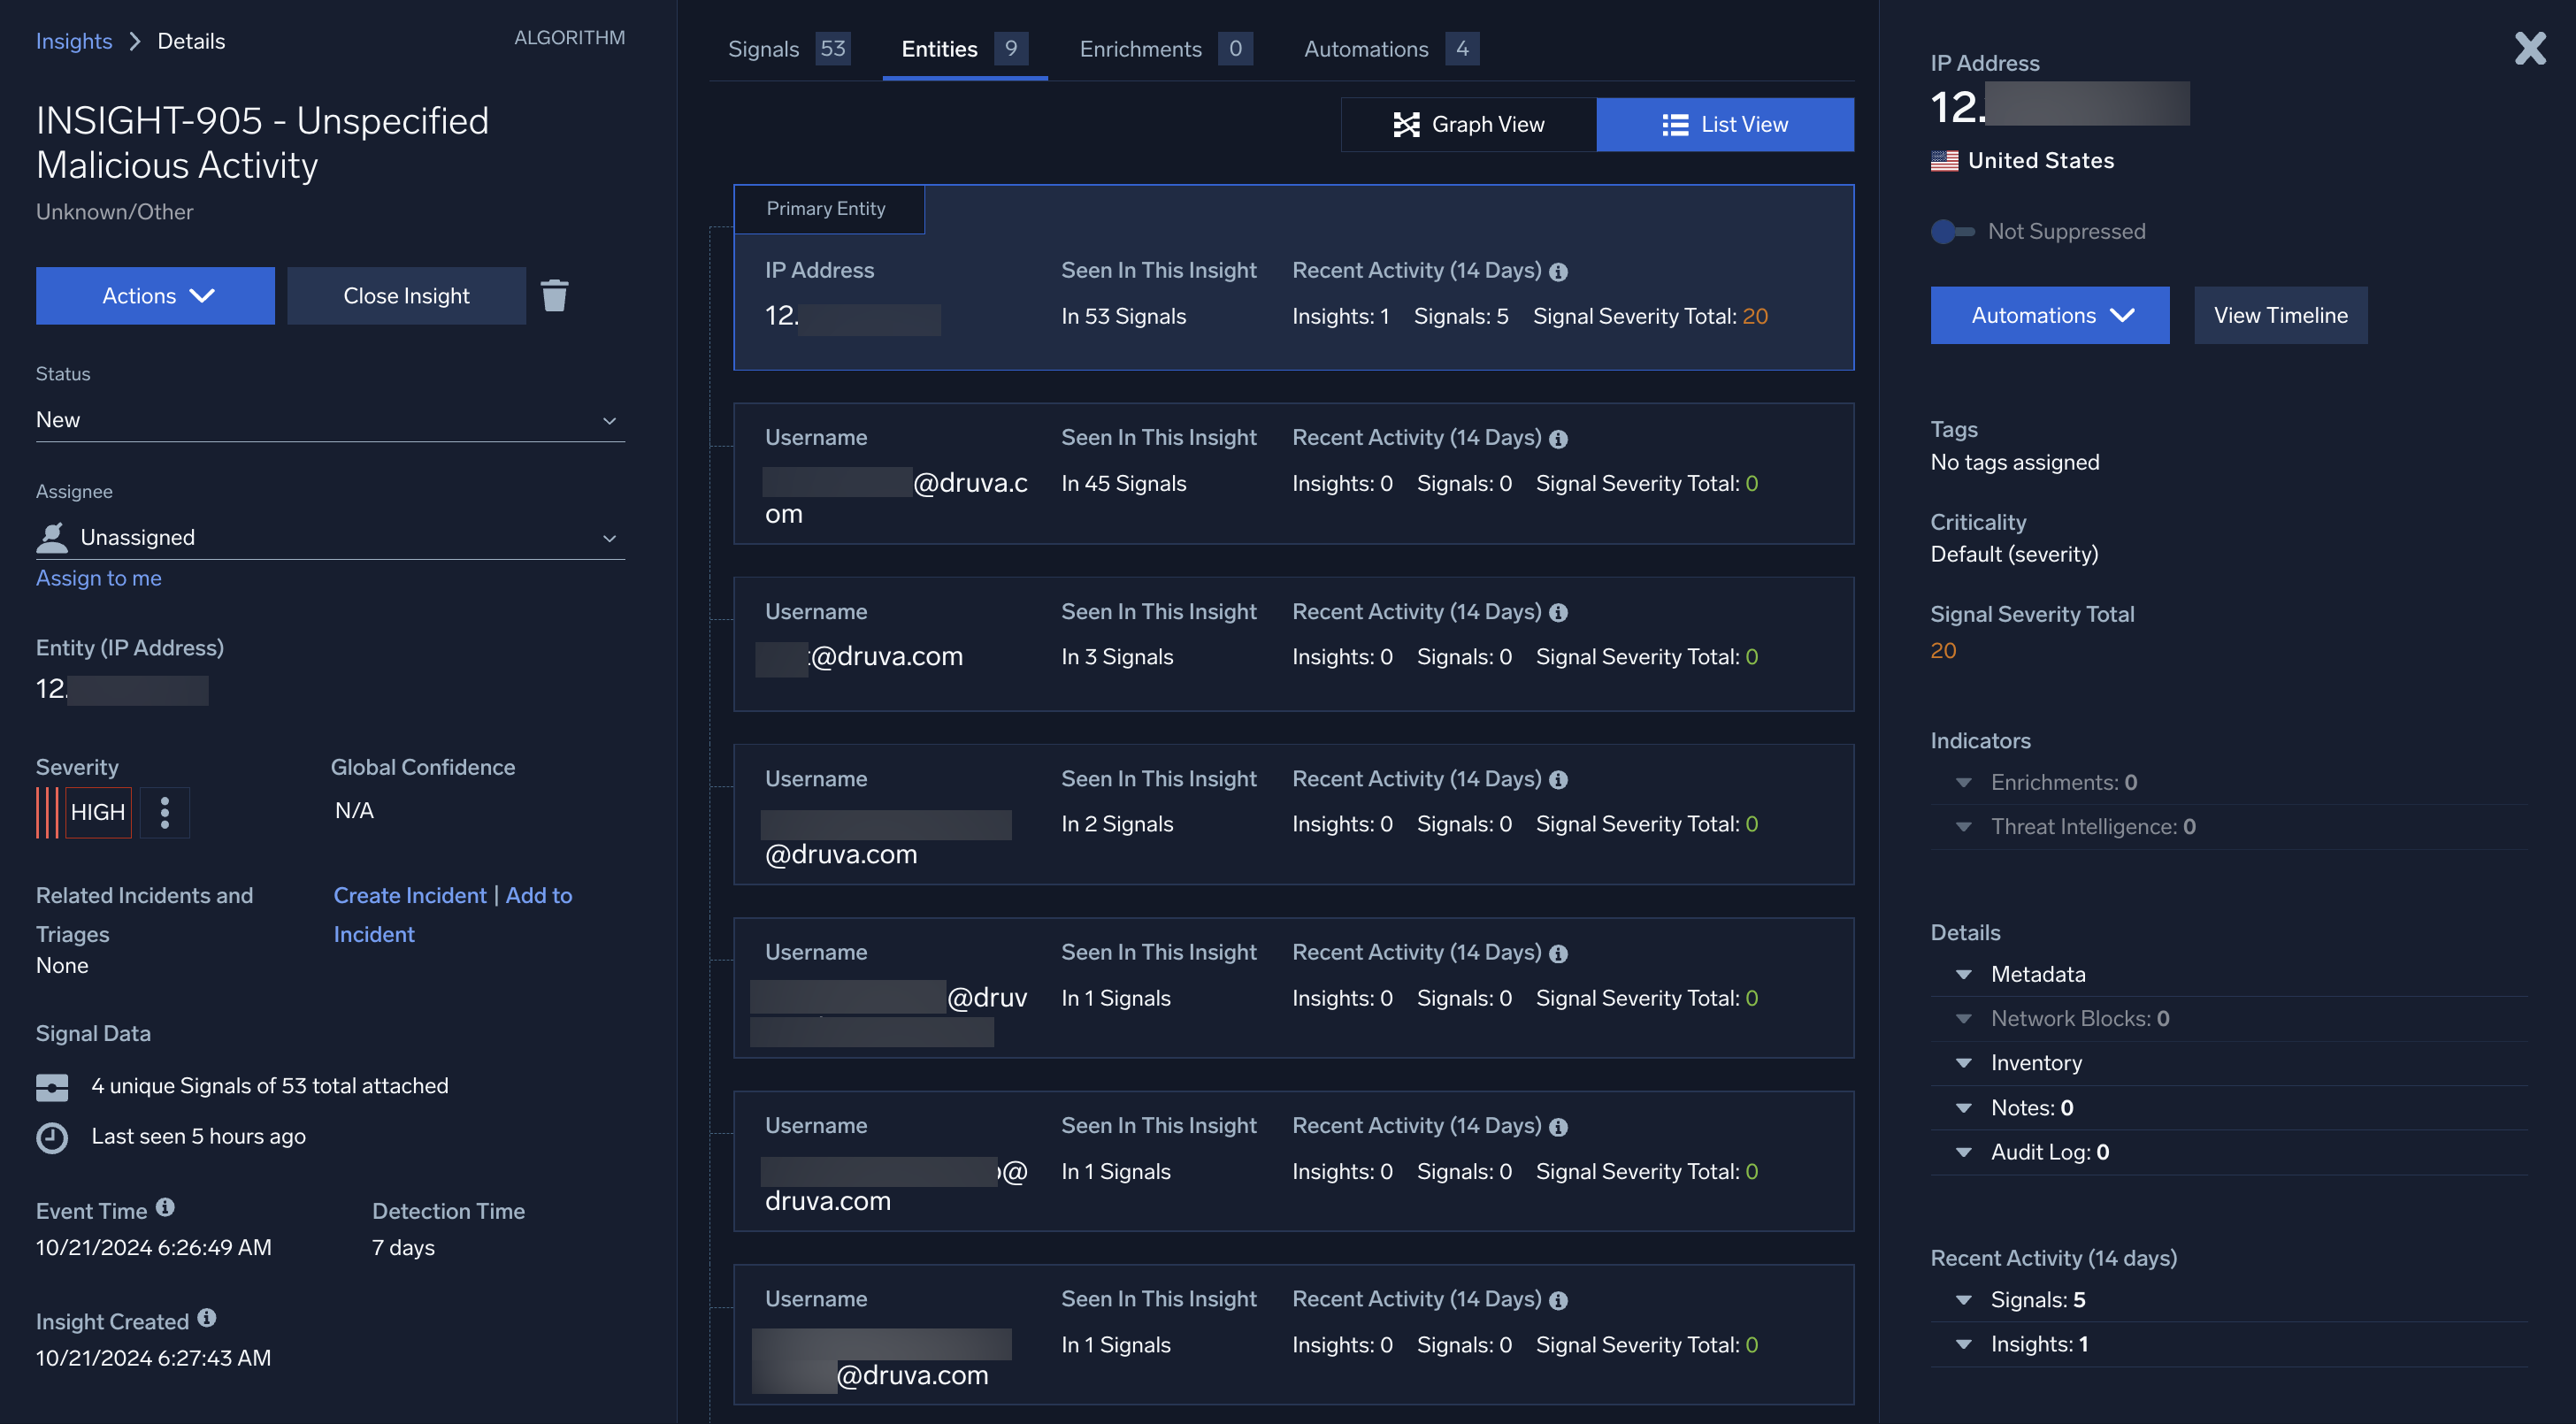
In this view, the primary entity is always displayed first. (This is the entity common to each of the signals in the insight). Below the primary entity all of the related entities are listed.
The related entities fall into two categories. The first category, sometimes referred to as involved entities, are those entities that aren't the primary entity but are listed in one or more records in the signal(s) in the insight. So, for example, while the primary entity for an insight could be a username, a record in one of the signals in that insight could also include an IP address. That address would be included in this list.
Other entities could be included due to detected entity relationships. For each entity in the insight — including the primary entity and other involved entities — Cloud SIEM searches for other entities that seem to be related (across all records, not just that insight's). This search is run across a time range that corresponds to the span of time during which there was activity on the insight. So, for example, if the first record in an insight was created at 8 AM on Wednesday and the last record at 10 PM on Friday, Cloud SIEM might detect that the IP address listed in the insight was associated with a specific hostname (in another record) at that point.
Involved entities are connected to the primary entity with dashed lines. Entities whose relationships are detected are labeled "May also be", indented, and connected with solid lines.
It's possible for a related entity to both be involved and detected. In that case, it typically be displayed as detected unless it is in a number of the insight's signals.
How does Cloud SIEM detect entity relationships outside of the insight? Within the time range of the insight, described above, Cloud SIEM searches for related entities in the following normalized record fields:
*_command*_domain*_email*_file*_hash*_hostname*_ip*_mac*_process*_url*_useragent*_username
Custom entities that match will also be included in the results.
What’s in an entity card
The card for an entity displays any tags that have been assigned the entity, along with the following information:
- The number of times that entity was referenced in the signals in the insight.
- The number of insights, created during the insight generation detection window, in which the current entity is the primary entity.
note
The detection window is 14 days by default, but can be configured to be a different duration.
- The number of signals that fired during the insight generation detection window, in which the current entity is the primary entity, and the sum of the severities for those signals.
note
The cumulative severity value is color coded: cyan for less than 12, orange for 12-23, and red for 24 and above, assuming your insight generation threshold is 12. If the insight threshold is set to a value other than the default of 12, the color coding will be adjusted to match.
About the Entities tab graph view
The screenshot below shows the Entities tab graph view for an insight.
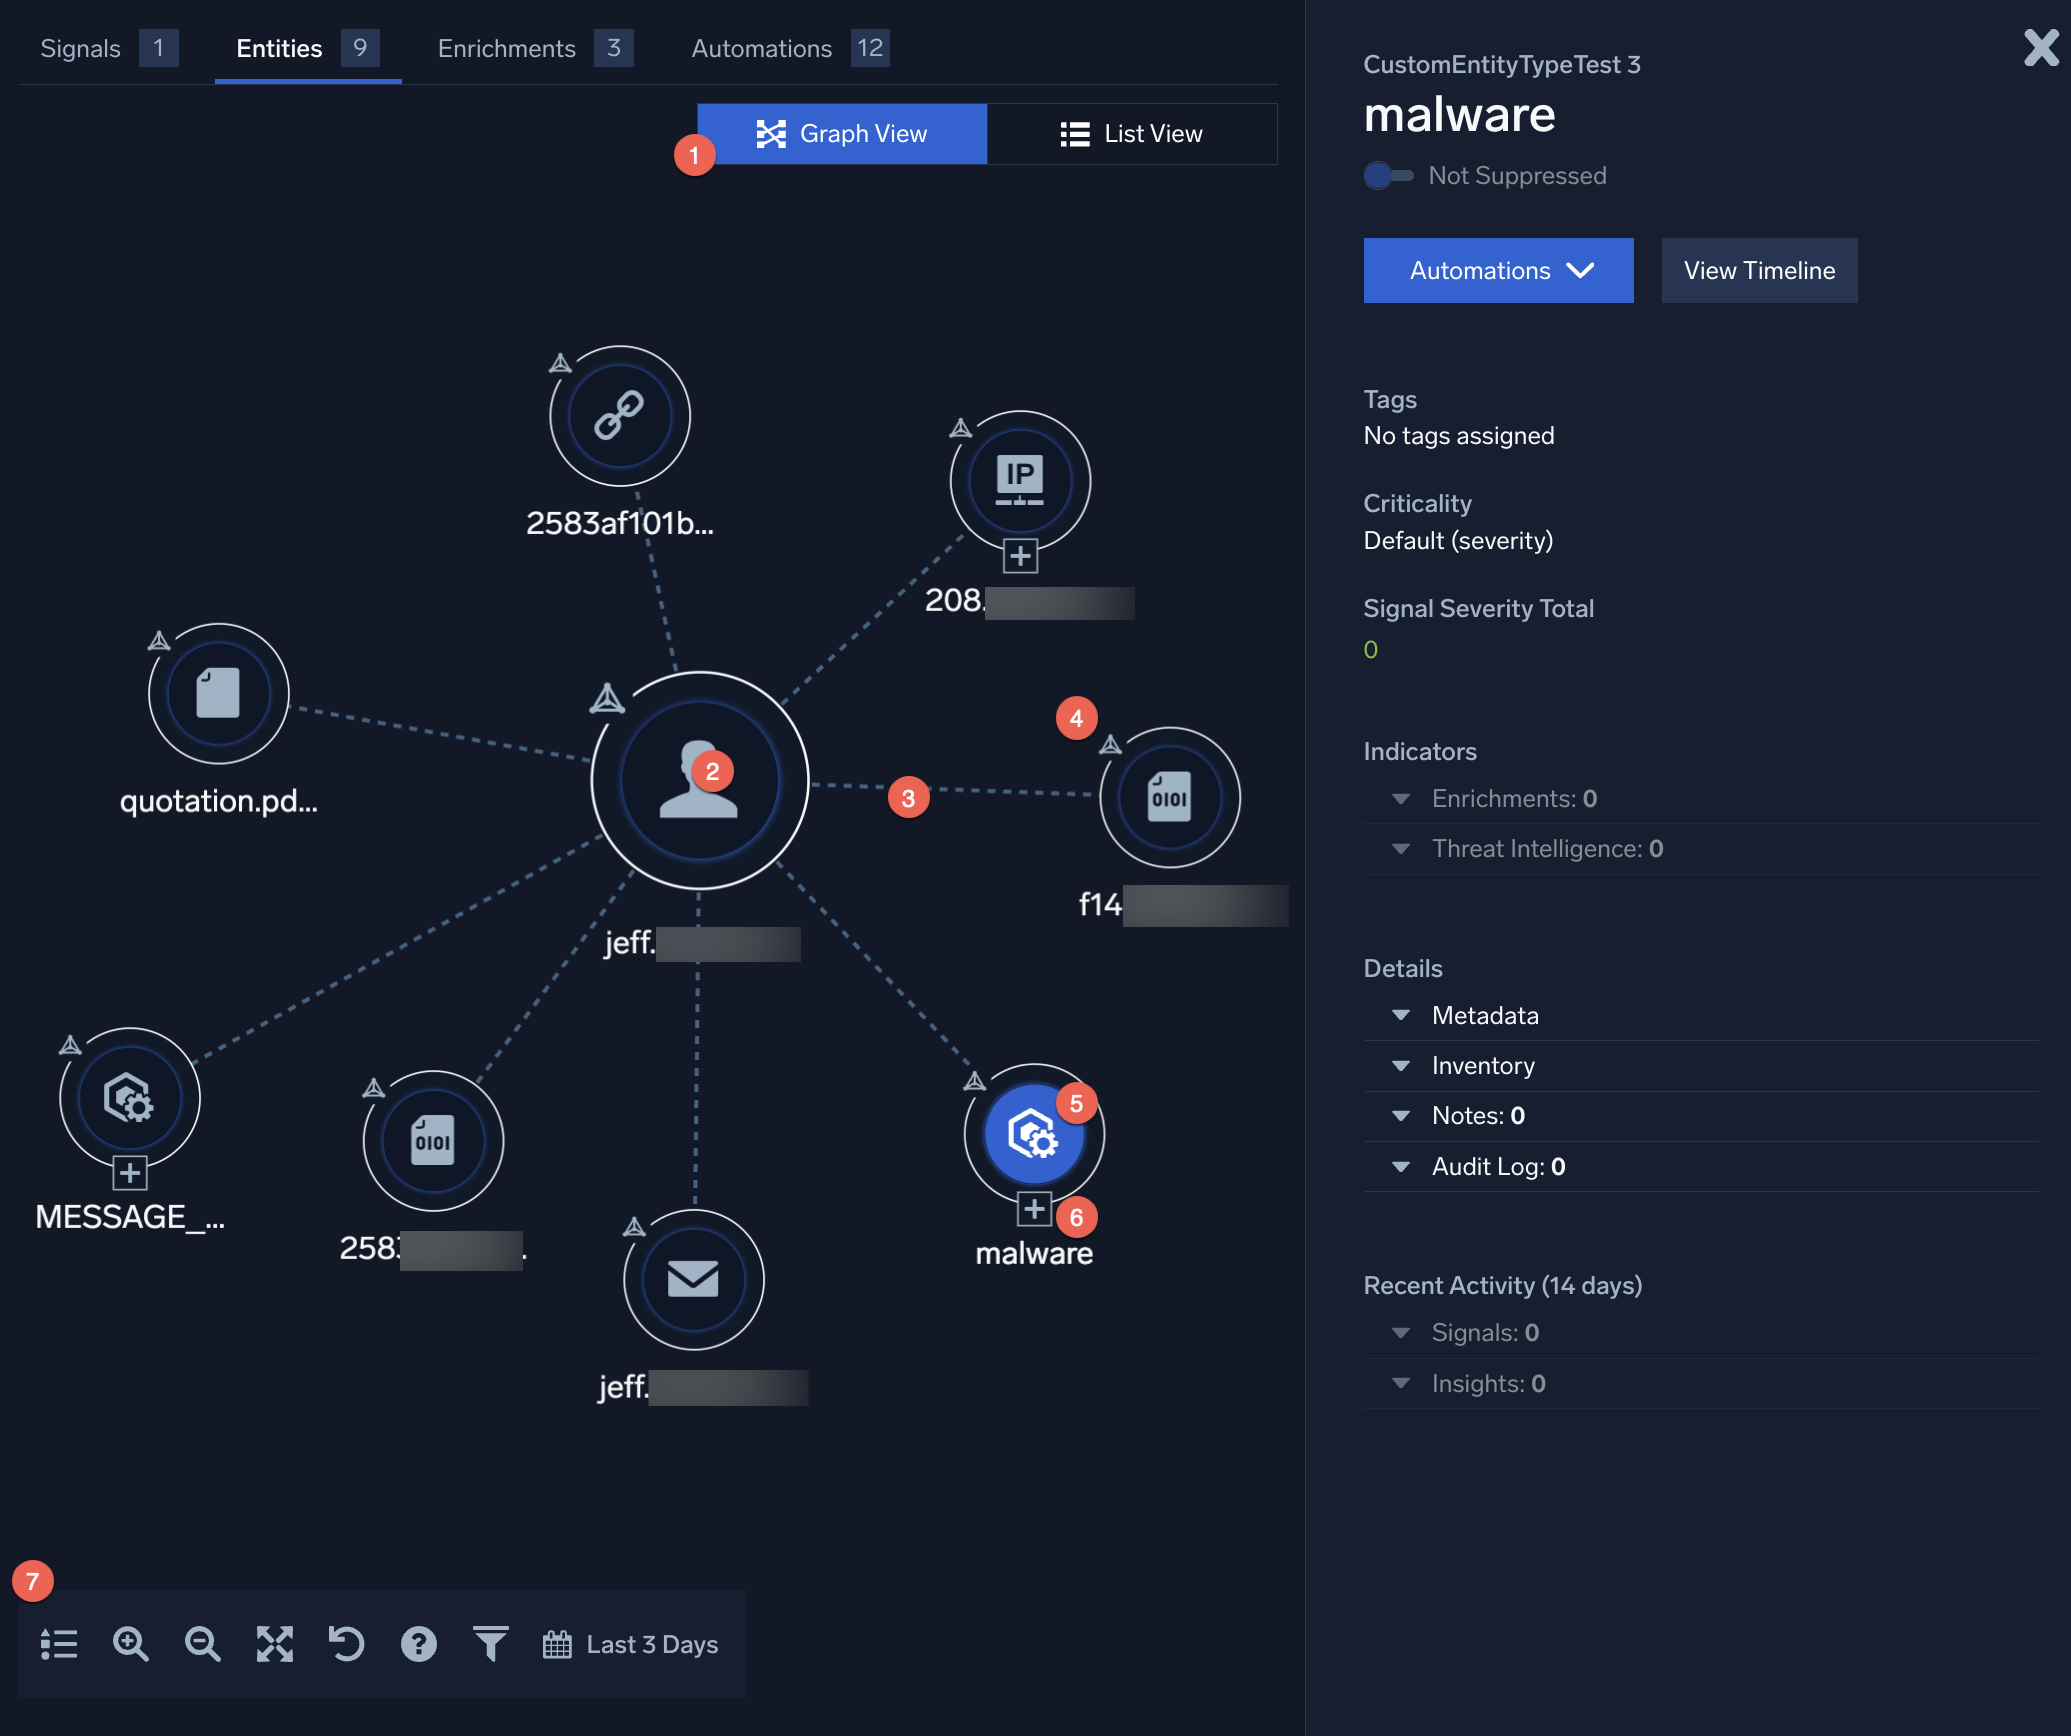
By default, this view shows the same entities that are displayed on the list view. However, the system will look for additional relationships outside of the insight during the detection window to aid in deeper investigation.
- Graph view. To switch between the list and graph view, click the chooser in the upper-right corner of the panel.
- Primary Entity. Each node in the graph represents a single entity and will include an icon representing the entity type and the value (name). The primary entity for this insight will be larger and centered by default.
- Involved Entities. As on the list view, the entities that appear on the same signal (also known as involved entities) will be connected with dashed lines.
- Related entities. Entities that are related to this insight will have an insight icon on their upper-left edge.
- Selected Entity. When you select an entity, it will be highlighted in blue and the entity details pane will appear on the right.
- Expand control. If Cloud SIEM has detected additional relationships outside of the insight during the selected time frame, an expand/contract control will appear on the entity. Clicking on that control will reveal (or hide) those additional relationships.
- Controls. The graph view has several controls:
- A key that explains how to read the graph
- Zoom controls (you can also use your mouse wheel)
- A screen size control, which toggles between the center pane view and a full browser window view.
- A reset control, which resets the view to the original default.
- A link to help.
- A filter control, which enables you to view only specific entity types in the graph.
- A time frame control, which controls what time frame to use when searching for and viewing relationships outside of the insight.
In addition, the following can appear in the graph:
- Detected entities. Entities with a detected relationship will be connected with solid lines. A detected relationship is when a relationship is detected between entities (for example, when an IP and hostname appear in a record together, but not necessarily in the insight being viewed).
- Threat indicators. Any entity with a threat indicator will have an additional icon in the upper right. If the threat indicator is Malicious or Suspicious, the entity will be highlighted in red or yellow accordingly.
- Hover. If you hover over an entity, it and all connections to it will be highlighted in blue. If its value is not fully visible by default, the full value will be displayed.
Watch this micro lesson to learn more about the entity relationship graph.
Entity details in the right pane
When you select an entity on the page, the right pane displays details about that entity. The information displayed depends on what type of entity is selected and can include:
- A Threat indicator (if any)
- A link to the entity’s details page
- Geographic location
- Suppression Status
- Tags
- Entity criticality, if it is set to something other than the default
- Metadata such as geographic location, Inventory information, the network blocks it falls within, as applicable, and so on.
- A signal graph if the entity was the primary entity in any signals during the detection window (time/date is the horizontal axis and severity of each signal is the vertical axis; the icon/color for each point depends on the signal type)
- Lists of the recent signals and insights the entity has been associated with, and links to each object’s details page.
Accessing related entities using the API
You can access related entity information using the Cloud SIEM API. For more information, see Cloud SIEM APIs.