Cloud SIEM Heads Up Display
This topic describes Cloud SIEM Heads Up Display (HUD), the landing page for the Cloud SIEM UI. The HUD provides an at-a-glance overview of insight status and activity.
Classic UI. To access the HUD, in the main Sumo Logic menu select Cloud SIEM.
New UI. To access the HUD, in the main Sumo Logic menu select Cloud SIEM > SIEM Overview. You can also click Go To... at the top of the screen and select SIEM Overview.
Data on the HUD is generated by internal searches that may result in slightly different results than a log search query for the same time period, because of the way each method calculates time periods. But these differences cancel out over time. So while there may be a small variance between numbers of records, signals, and insights in a given time frame, the effect is only noticeable when viewing very small time slices, for example, under 30 minutes. If you need to get exact tracking for reporting or other use cases, use dashboards in apps like the Enterprise Audit - Cloud SIEM app.
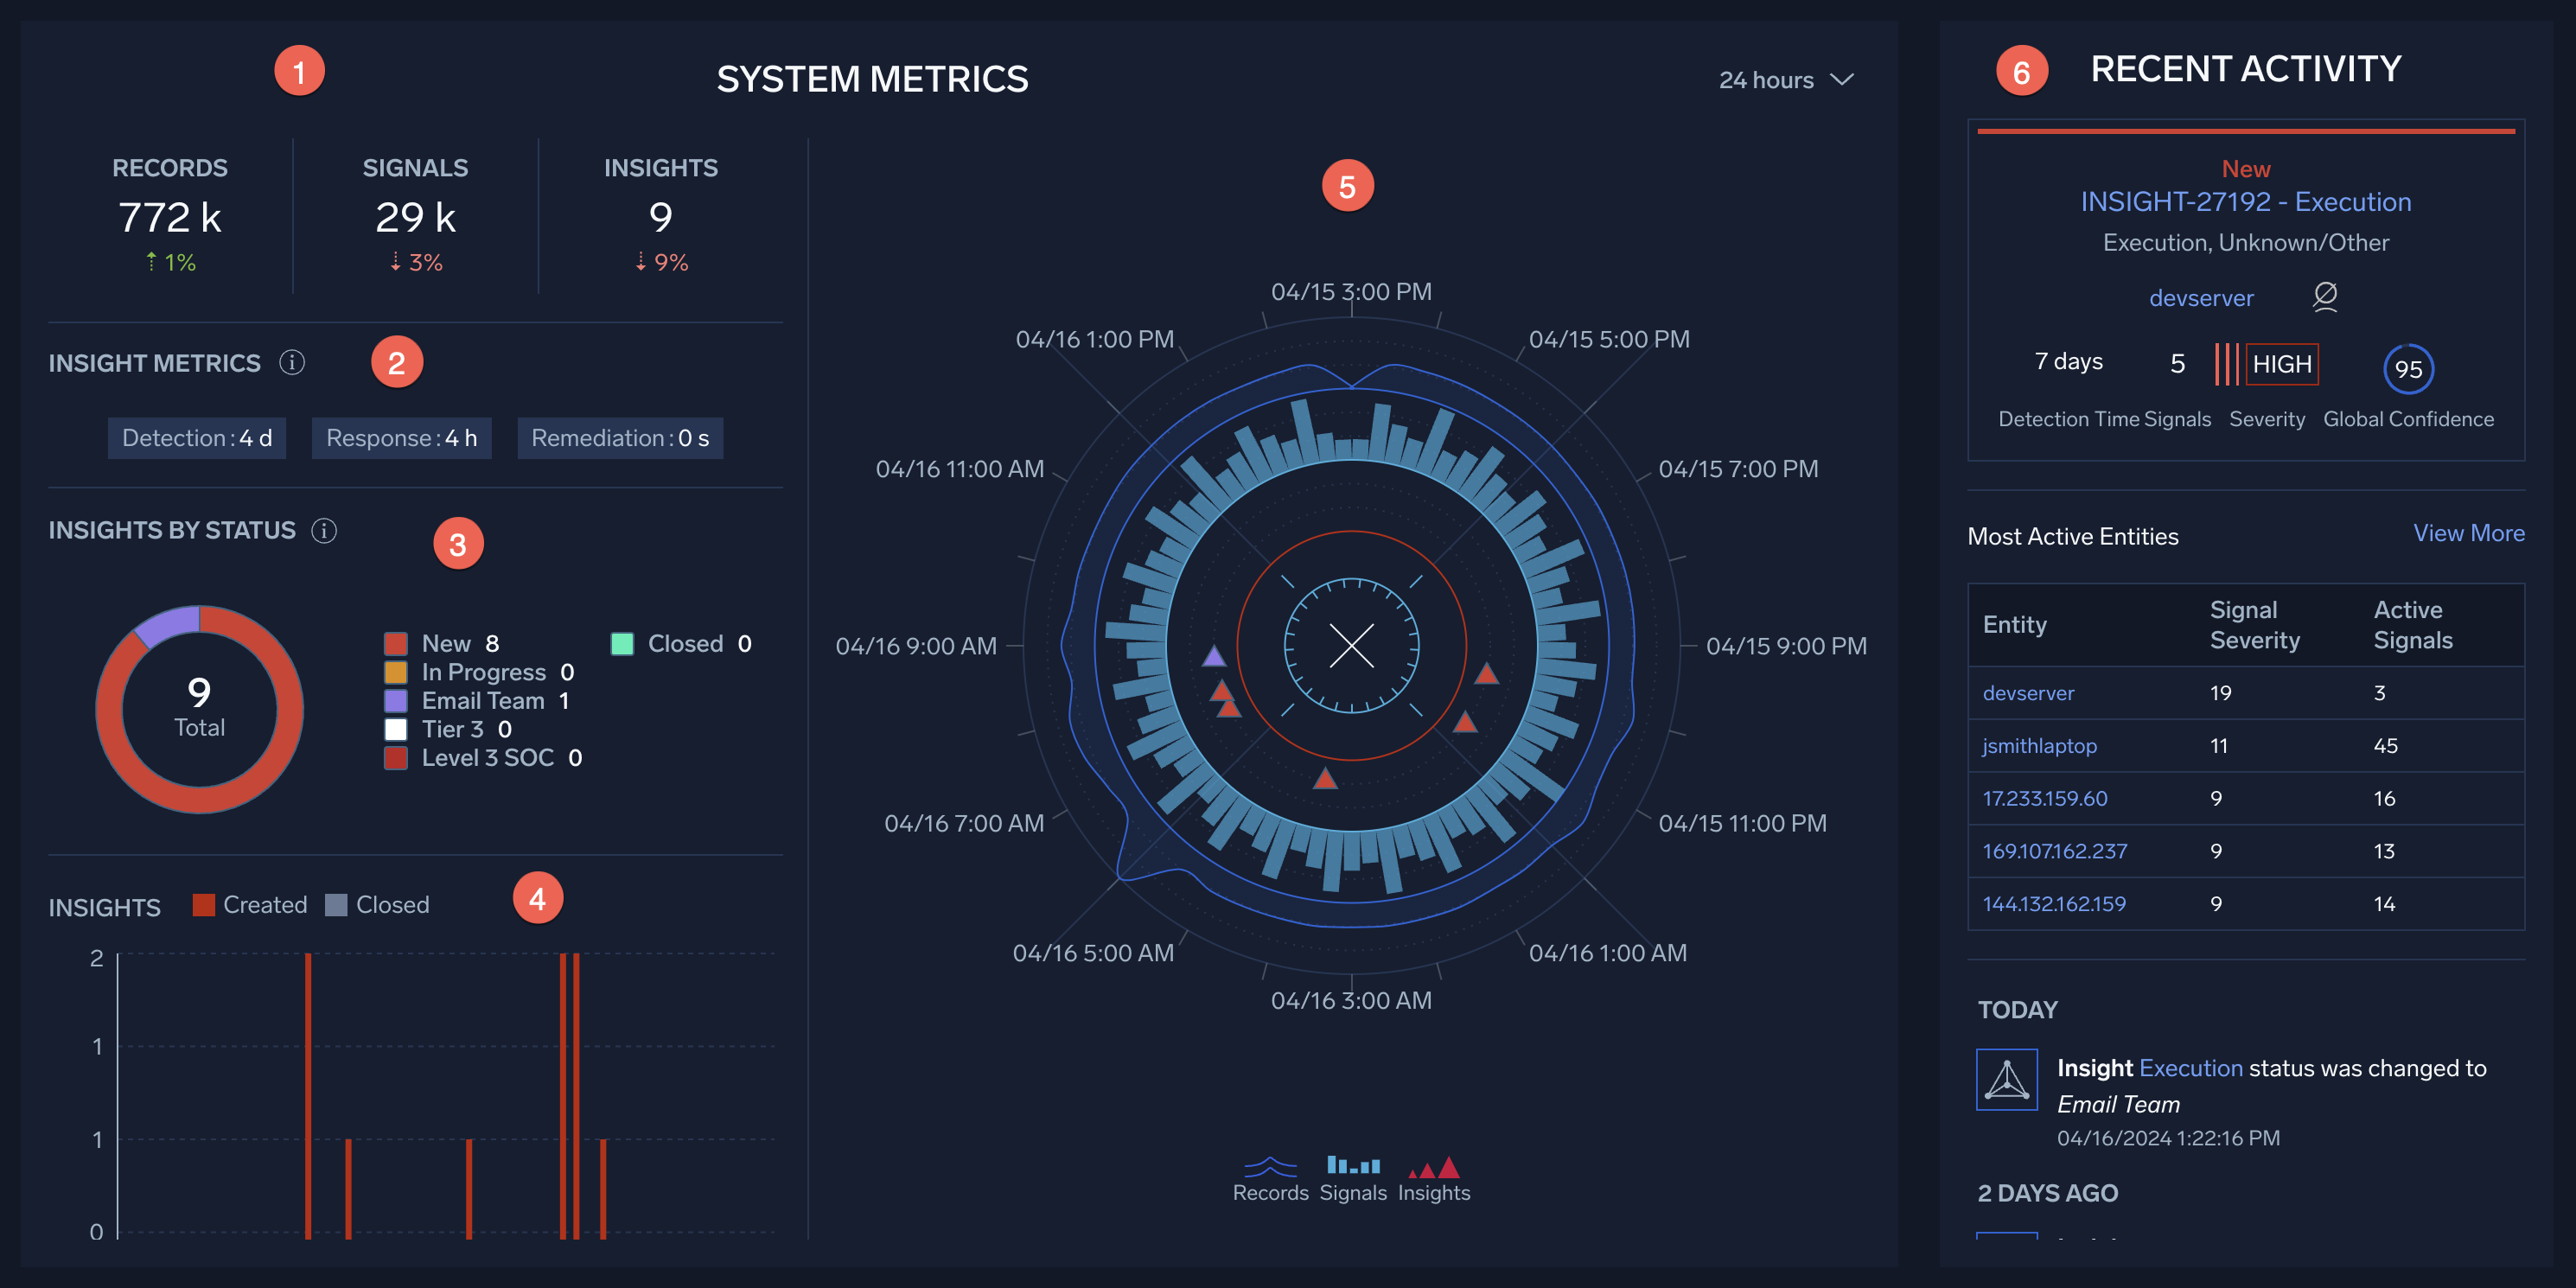
HUD overview
The left side of the HUD is a compact view of insight activity and status in your environment. You can see the volume of records being processed and how many signals and insights those records result in. The HUD tells you how long it’s taking your team to spot, respond, and close insights. You can see how many insights are open, in progress, and closed. You can adjust the time range of the display depending on your interest.
The middle part of the HUD—the radar—visualizes the record, signal, and insight volumes that are summarized on the left side of the page. It’s a circular timeline. The outer blue ring shows record volume. Just inside the ring of records is a histogram-like view of signal volume. Nearest to the center are triangles that represent insights. As you mouse around the radar, small popups provide a count of the records, signals, or insights in that timeslice, depending on your focus.
The right side of the HUD contains a list of recent insight activity. The card above the list shows key information about the latest new insight with the highest severity.
See the sections below for more details on each element of the HUD.
1. Records / Signals / Insights
This section shows the count of records ingested, signals fired, and insights generated during the currently selected time range, along with the percentage change compared to the previous time period. For example, if the currently selected time range is 24 hours, the percentage change is compared to the counts for the 24 hours previous to that.
The default time range is 24 hours. You can change the time range using the dropdown to the right of the currently selected time range; the options range from 4 hours to 7 days. When you change the time range, the counts and metrics in the left and middle columns of the HUD update accordingly.
2. Insight Metrics
The Insight Metrics section displays the following metrics for all the insights in the Heads Up Display for the currently selected time range:
- Detection. The average period of time for all insights between when the first record is observed and the insight is created. (This differs from "dwell time", which is the time between when the first record and the last record occurred.)
- Response. The average time for all insights since the insight was last updated. Any update of the insights, including from automation processes, changes the average response time.
- Remediation. The average time between when the insights are created and the insights are closed. A value of "0" means that no insights were closed during the selected timeframe.
If you use an HTTP POST V2 Action to send insights to the Sumo Logic platform or another system, the insight metrics are included in the insight JSON object. The fields are timeToDetection, timeToResponse , and timeToRemediation.
3. Insights by Status
The Insights by Status section provides a quick view of what analysts are working on. The counts are a breakdown by current status of the insights created during the currently selected time range. To create new statuses, see Managing Custom Insight Statuses.
4. Insights created and closed
This section contains a stacked bar chart that shows the count of insights opened and closed over time during the time range. When you hover over a bar, you’ll see the breakdown.
5. Insight radar
In the middle of the display is the insight radar, the HUD’s key feature. The radar visualizes the volume of records, signals, and insights over time in a bulls eye-like view. Like the panels on the left side of the HUD, the radar updates when you select a different time range. The radar automatically refreshes every 60 seconds.
In the circular visualization the three outermost rings represent records, signals, and insights.
The blue ring around the outside of the radar represents records. The selected time range is broken down into intervals, and as you hover over the outer border of the ring, traversing the time range, the count of records created during each interval is displayed.
Within the blue ring is another ring that contains light blue bars, each of which represents the signals that fired during a time interval. The height of a column corresponds to the number of signals that fired. If no signals fired during an interval, no column appears. As you hover over an interval, the count of signals that fired is displayed. If you click a column, the Signals page appears, and displays the corresponding signals.
The third ring contains triangles, each of which represents one or more insights. As you hover over an interval, the count of insights that fired is displayed. If you click a triangle, the insights page appears, and displays the corresponding insights.
6. Recent Activity
The Recent Activity pane shows recently created insights and recent insight activity.
The card at the top of the pane provides key information about the latest new insight with the highest severity. The card provides the following information:
- The insight ID and name, separated by a dash character. The name is typically formed from the MITRE stage(s) associated with the signals in the insight. In the case of a custom insight, the name is the one supplied when the insight was configured.
- The insight description, typically formed from the MITRE stage(s) associated with the signals in the insight. In the case of a custom insight, the description is the one supplied when the insight was configured.
- The entity the insight fired on. You can click on the entity to view its details. Note that there is a six-button context menu that has options for searching for the entity in other insights and in signals and records. It also has the built-in Add to Match List and Add to Suppressed List actions, along with any custom Context Actions defined in your environment.
- The analyst assigned to the insight, if the insight has been assigned to one.
- Detection Time. The time between the moment of first activity observation (when the oldest signal in the insight was fired) and when the insight was created. (This differs from "dwell time", which is the time between when the first record and the last record occurred in an insight.)
- Signals. The number of signals in the insight.
- Severity. The severity of the insight.
- Global Confidence. Global Confidence for the insight, if available.
- Most Active Entities. Entities that are currently appearing the most in activity. Hover your mouse over an entity and click View Timeline to see the entity timeline.
- Today. Shows changes made today, such as insights created, status changes, and comments. Items are listed in chronological order, with the newest first.