Network Sensor Deployment Guide
This article describes using the Cloud SIEM Network Sensor. The Network Sensor has reached its end of life. Instead, use Zeek. For more information, see Ingest Zeek Logs.
This section has instructions for deploying the Cloud SIEM Network Sensor. It covers deployment planning, standard sensor placement, sensor requirements, installation, general configuration, and helpful commands.
Network Sensor overview
The Cloud SIEM Network Sensor is a network security monitor. It uses Zeek, an open source network analysis framework to organize packets into flows, decode common protocols, perform file extraction, SSL certificate validation, OS fingerprinting and more.
The Network Sensor monitors live network traffic, and produces log files that record a network’s activity in high-level terms. These logs record every connection seen on the wire, and application-layer transcripts, including all HTTP sessions with their requested URIs, key headers, MIME types, and server responses; DNS requests with replies; SSL certificates; key content of SMTP sessions. The log files generated by the sensor are ingested by Cloud SIEM.
The Network Sensor has a file extraction policy, enabled by default, that saves files observed on the network (unencrypted transfers, e.g. over protocols including SMB and HTTP). Configuration of this policy includes mime-types (exe, zip, pdf, and so on) and maximum extracted file size.
The sensor uses PF_RING for flow-based load balancing across a number of processes that are monitoring/sniffing the same interface.
Deployment process overview
- Determine the appropriate location for each sensor, based on anticipated traffic.
- For each location you designate:
- Determine the amount of throughput you will get with this placement.
- Use the scaling guide to determine the CPU and memory requirements for the VM or hardware. Confirm that their firewall rules are in place.
- Confirm that there is traffic flowing on the interface.
- Install the sensor.
- Confirm the configuration and that data is flowing into the cluster.
Network Sensor positioning best practices
Robust network defense is enabled by visibility into events happening on the network. Events affecting digital assets may occur without observable after effects.
Cloud SIEM helps clients achieve a robust level of network security and surface insights from their environment through the Cloud SIEM platform and deployed sensors. A number of best practices apply to positioning these sensors for the best results. This section provides detailed guidance on optimal sensor visibility in the most common network environments.
Position sensor in front of forward proxies
Forward proxies, such as HTTP web proxies, broker client connections to the internet and perform caching and content filtering. Because many threats are hosted on the web and delivered to internal clients by means of drive-by download attacks and similar methods, this outbound web pathway is critically important to security monitoring.
The following diagram Illustrates optimal sensor positioning prior to a web proxy.
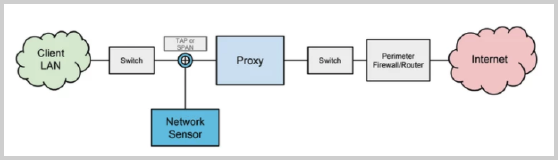
Sumo Logic advises positioning Network Sensors for visibility at a monitoring point immediately in front of the proxy server(s). This allows the sensor to record client source addresses and to see all web requests prior to content filtering. This is an important factor for a number of Cloud SIEM’s rules and analytics, which rely on knowing the “true” source of requests. Because a number of threats beacon to remote internet servers, seeing even those requests that are filtered by a proxy server is important for monitoring and response.
Positioning the Network Sensor after a forward proxy is not advised. This placement results in the sensor seeing all traffic sourced from the proxy and complicates (or renders impossible) the ability to determine which assets or users on the LAN were the origin of the traffic.
Explicit versus transparent forward proxies and server access logs
Forward proxies may be configured in an environment in either or both of the following ways:
- Explicit. Explicit proxy settings configure clients to use a proxy server for web access. This is often configured by admin policies or by using mechanisms such as proxy auto-configuration (PAC) files or Web Proxy Auto-Discovery Protocol (WPAD).
- Transparent. Transparent proxies intercept outbound web traffic with the assistance of network devices such as firewalls, routers, switches or load balancers, sometimes using Web Cache Communication Protocol (WCCP) to redirect and balance traffic flows. Clients that are transparently proxied require no configuration as the traffic is proxied upstream when it egresses the network.
In an explicit proxy configuration, clients connect to the proxy server and issue requests. The proxy performs DNS resolution and connects to the remote (origin) server on behalf of the client, meaning the destination IP address for client requests is that of the proxy server rather than the remote server on the internet. In a transparent topology, clients are unaware of the proxy. They perform DNS resolution and attempt to connect to the remote (origin) server directly, meaning the destination IP address in request traffic is that of the remote server. In either case, pre-proxy sensor placement is recommended. A Network Sensor positioned after the proxy server sees the proxy server as the source IP address for all web traffic, masking the identity of the client.
Position sensor behind reverse proxies
Reverse proxy servers are positioned in front of web servers and can provide caching, load balancing and request filtering capabilities. Many reverse proxies also provide SSL acceleration services to offload SSL/TLS processing from backend servers. Cloud SIEM recommends positioning Network Sensor behind reverse proxies, between them and the backend web servers. This positioning allows the sensor to see traffic that is decrypted (allowing it to inspect and collect metadata for the complete request/response) and allows the Network Sensor to collect the true destination address of the backend server behind the proxy. This is particularly useful when large pools of servers exist behind reverse proxies to help identify targeted and affected hosts accurately. Because positioning the sensor behind the reverse proxy causes the network traffic to carry the IP address of the proxy as the source, it is important to send the original client address in the RFC7239 Forwarded extension, X-Forwarded-For header, or whatever related standard is best supported by reverse proxies in the environment.
Position sensor inside perimeter firewalls and NATs
In all cases, sensor visibility inside of firewalls and NAT devices is advised.
Perimeter firewalls
Perimeter firewalls are positioned at an organization’s network border and are often one of the last devices for traffic outbound from an organization or inbound to it from the internet. In both cases, Sumo Logic recommends Network Sensor placement inside the firewall.
For outbound traffic, this ensures that the sensor can see traffic prior to Network Address Translation (NAT) and before any egress filters/ACLs are applied. As is the case with forward proxies, it is important to see outbound communication attempts from hosts on the network even if they are filtered upstream.
The Network Sensor logs every connection attempt observed, even those consisting of only a single TCP SYN packet. For inbound traffic, it is important that the sensor inspects only traffic that is allowed through the firewall filter policy and/or ingress ACLs. Doing so eliminates unimportant internet background noise. It also reduces the amount of traffic inspected, both bits per second (bps) and packets per second (pps), which can reduce load on the Network Sensor. This has a positive effect on log volume. These simple steps make it easier to surface insights on the more meaningful traffic which successfully passes into the environment.
NAT Devices
Aside from the devices and configurations described above, similar challenges are presented any time a Network Sensor inspects traffic after application of Network Address Translation. (NAT). NAT may refer to port address translation (PAT), source or destination NATs. In any case that a NAT policy rewrites the source IP address of a connection, it can impact the ability for Cloud SIEM to analyze and identify affected assets and makes it difficult for operations teams to respond effectively. Sumo Logic recommends that Network Sensors have visibility in front of NAT.
Installation requirements
This section describes resource requirements and prerequisites for Network Sensor deployment.
Host resource requirements
We recommend installing the Network Sensor on a host with at least two interfaces - one for traffic monitoring and one for management. That way, the sensor doesn't process and upload traffic associated with sensor management for analysis.
The system upon which you install the Network Sensor must have the following resources, at a minimum. Depending on expected throughput, additional core, memory, and storage resources may be required, as shown in Throughput-dependent resource requirements below.
| Operating System | Cores (CPU) | Memory (RAM) | Storage (Disk) |
|---|---|---|---|
| CentOS 7 or Ubuntu 16, 18, 20 | 4 | 4GB | 250GB |
Before you deploy the Network Sensor, make sure you know the TAP or SPAN interface upon which captured data is available.
Prerequisites for CentOS
For CentOS, before running the install command, run these commands as root (or prefix with sudo):
yum update -y
yum install -y kernel-$(uname -r) kernel-headers-$(uname -r) kernel-devel-$(uname -r) gcc*
dnf install -y 'dnf-command(config-manager)'
dnf config-manager --set-enabled powertools
yum install -y elfutils-libelf-devel python3
reboot
Throughput-dependent resource requirements
| Throughput Specs | Cores (CPU) | Memory (RAM) | Storage (Disk) |
|---|---|---|---|
| 250mbps | 4 | 4GB | 250GB |
| 500mbps | 5 | 8GB | 250GB |
| 750mbps | 6 | 12GB | 250GB |
| 1gbps | 7 | 16GB | 500GB |
| 1.25gbps | 8 | 20GB | 500GB |
| 1.5gbps | 9 | 24GB | 500GB |
| 1.75gbps | 10 | 28GB | 500GB |
| 2gbps+ | Consult your SE. | Consult SE (Estimate is 4GB per 250Mbs) | Consult your SE. |
Outbound firewall rules
See Securing access to Sumo Logic infrastructure via DNS name or IP address for information on how to configure your firewall for outbound access to Sumo Logic.
Interface considerations
Offload Features
Modern network chipsets utilize hardware features to offload work from the host CPU as a performance improvement. Most drivers utilize these features by default These features are often detrimental to the proper functioning of capture interfaces on network sensors.
Verify information about the kernel module (driver) supporting the interface and view offload feature states for the NIC:
ethtool -i eno1
ethtool -k eno1
A number of NIC offload features should be disabled on capture devices (interfaces that monitor traffic, but not the management interface). An example of interface configuration that disables such features is provided below in Recommended interface configuration.
NIC Hardware Buffer Queue Length
The default size of the ring buffer on many NICs is conservative and in high traffic, scenarios may cause some frames to be dropped before they can be processed.
Verify the ring parameters for the capture interface(s). The following example shows a maximum RX value of 4096, but an effective setting of 256.
Input ring buffer queue length
$ ethtool -g eno1
Ring parameters for eno1:
Pre-set maximums:
RX:         4096
RX Mini:    0
RX Jumbo:   0
TX:         4096
Current hardware settings:
RX:         256
RX Mini:    0
RX Jumbo:   0
TX:         256
An example interface configuration which increases the RX ring buffer size is provided below.
Recommended interface configuration
The following stanza can be set as an interface (5) configuration in Debian or Ubuntu Linux sensors. Most often the file path is /etc/network/interfaces (some installations may use a file in /etc/network/interfaces.d/). These settings configure the network interface for optimized traffic capture as described above. Similar concepts apply to Red Hat-based distributions using interface setup configurations provided by the distribution.
/etc/network/interfaces (Debian/Ubuntu)
iface eno1 inet manual
    # Increase MTU if required for jumbo frames, VLAN tags, etc.
    mtu 1500
    pre-up /sbin/ethtool -G $IFACE rx 4096 tx 0
    pre-up /sbin/ethtool -K $IFACE gro off gso off lro off rx off sg off tso off tx off ufo off
    pre-up /sbin/ethtool -A $IFACE rx off autoneg off
    up ip link set $IFACE arp off allmulticast on
    down ip link set $IFACE down
    post-down /sbin/ethtool -G $IFACE rx 256 tx 256
    post-down /sbin/ethtool -K $IFACE gro on gso on lro on rx on sg on tso on tx on ufo on
    post-down /sbin/ethtool -A $IFACE rx on autoneg on
The section below describes the settings configured above.
Interface settings
Link settings
arp off= disable ARP resolution on the interface. The only traffic forwarded to the interface will be a feed from the monitored network segment.allmulticast on= enable IFF_ALLMULTI. The driver forwards all multicast packets to the kernel for handling.
-G
rx= ring entries for Rx; NIC hardware buffer queue lengthtx= Tx queue; transmission is not utilized on capture interfaces
-K
rx= rx-checksumming; Receive checksummingtx= tx-checksumming; Transmit checksummingsg= scatter-gathertso= tcp-segmentation-offload; TCP segmentation offloadufo= udp-fragmentation-offload; UDP fragmentation offloadgso= generic-segmentation-offload; generic segmentation offloadgro= generic-receive-offload; generic receive offloadlro= large-receive-offload; large receive offload
-A
rx= Rx pause frames; flow controlautoneg= autonegotiation pause frames
Install the Network Sensor
Download the installer using the download link for your deployment shown on Sensor Download Locations. Start the installer using the command provided on that page, and then respond to the prompts as described below.
Uninstall the Network Sensor
-
Before uninstalling the Network Sensor, make sure that the service is stopped:
sudo service trident_sensor stop -
To remove the package:
- On Ubuntu, using
dpkg:sudo dpkg -r trident-sensor - On Ubuntu, using
apt(removes dependencies):sudo apt remove trident-sensor - On Centos:
sudo yum remove trident-sensor
- On Ubuntu, using
-
Remove remaining configuration and log files:
sudo rm -rf /opt/trident/sensor
Network Sensor configuration settings
This section describes the configuration options in the Network Sensor configuration file, /opt/trident/sensor/conf/trident-sensor.cfg.
We strongly recommend that you do not edit trident-sensor.cfg manually. Instead, you should run /opt/trident/sensor/bin/configure.sh, which is
the wizard that runs when you install a Network Sensor. For some configuration options, the wizard updates both /opt/trident/sensor/conf/trident-sensor.cfg and node.cfg.
If you do make manual updates to trident-sensor.cfg, you must restart the Network Sensor for the changes to take effect with this command:
sudo service trident_sensor restart
compression
Description. This option controls whether the sensor compresses the Bro output files stored in /opt/trident/sensor/output/. By default, the sensor does compress the Bro files using gzip when the size of the Bro file exceeds the value of the compression_threshold option, described below. To turn compression off, set this option to “no”, or any value other than “gzip”. Compression occurs when the parameter is missing or set to gzip and the Bro output file is above the value set in compression_threshold.
Default Value. gzip
Configured by wizard? No
compression_threshold
Description. Minimum file size for compression.
Default Value. 50kB
Configured by wizard? No
debug
Description. The sensor writes messages about the upload process, that is, the process of uploading captured data to Sumo Logic. By default, this log file is /opt/trident/sensor/logs/trident-shipper.log. You can use the debug option to tell the sensor to write debug-level to the log file.
Default Value. false
Configured by wizard? No
extracted_file_directory
Description. The directory to which the sensor writes files extracted from network traffic, in accordance with the extracted_file_types option.
Default Value. /opt/trident/sensor/output/extract_files
Configured by wizard? No
extracted_file_types
Description. In the case that the sensor detects files in network traffic, this option controls what files the sensor will extract. Files that have the MIME types specified in this parameter will be extracted.
Default Value.
application/x-dosexec,application/x-msdownload,application/zip,application/x-msdos-program
Configured by wizard? No
file_carving_enabled
Description. Enables the sensor’s file extraction functionality, the extraction of files detected in network traffic, in accordance with the extracted_file_types option. Set to “false” to disable file extraction.
Default Value. true
Configured by wizard? no
filter
Description. This option tells Bro not to capture network traffic between the sensor and the Sumo Logic. The sensor sends status reports and Bro output files to end points on the destination, which we don’t want Bro to capture.
This option is populated when first you install the sensor, or when you reconfigure it by running /opt/trident/sensor/bin/configure.sh.
Default Value. none
Configured by wizard? No. The wizard does not prompt for this value, instead it determines the value based on the Sumo Logic HTTP Source URL you supply to the wizard.
input_directory
Description. The directory which Bro log files will be written.
Default Value. /opt/trident/sensor/output
Configured by wizard? No
installation_directory
Description. Directory where the sensor is installed; this is used for auto updating.
Default Value. /opt/trident/sensor
Configured by wizard? No
log_file
Description. The log file that contains messages written by the process that sends the collected data to Sumo Logic.
Default Value. /opt/trident/sensor/logs/trident-shipper.log
Configured by wizard? The wizard does not prompt for this value, instead it determines the value based on the Sumo Logic HTTP Source URL you supply to the wizard.
maximum_extracted_file_size
Description. The maximum size (in bytes) below which files will be extracted.
Default Value. 10485760
Configured by wizard? No
no_data_cutoff
Description. Threshold used to determine when data is being captured by the Network Sensor (value is in records per second). When records per second is below this threshold for a status report interval (default is 5 minutes) the report will be counted towards no_data_restart_threshold. Use this parameter to tune automatic restarts of the Network Sensor when no data is being captured/reported (requires no_data_restart_threshold to be set, the recommended value for this parameter is 3, as described below ).
Default value. 3
Configured by wizard? No
no_data_restart_threshold
Description. Number of consecutive status reports with no data that should trigger a restart of the Network Sensor. This may be enabled to handle Zeek out-of-memory issues that causes capturing to stop occasionally. Recommended number to start with is 3 (a single status report with no data is normal).
Default value. -1 (disabled)
Configured by wizard? No
proxy_https
Description. Whether or not the configured proxy is using SSL.
Default Value. true
Configured by wizard? Yes
proxy
Description. The hostname and port of of the proxy server, required if proxy_required is set to true,
Default Value. None
Configured by wizard? No
proxy_auth_required
Description. If a proxy is used, is authentication required?
Default Value. false
Configured by wizard? yes
proxy_password
Description. Password to use when authenticating to the proxy; required if proxy_auth_required is set to true; note: do not edit the config file directly to change this, change it by re-running the configuration wizard.
Default Value. None
Configured by wizard? No
proxy_required
Description. Whether or not a proxy is required to access the internet.
Default Value. false
Configured by wizard? yes
proxy_user
Description. Username to use when authenticating to the proxy; required if proxy_auth_required is set to “true”.
Default Value. No.
Configured by wizard? Yes
sensor_id
Description. Random uuid.
Default Value. None.
Configured by wizard? No, set automatically during installation.
sensor_iface
Description. Interface on which bro will listen.
Default Value. None
Configured by wizard? Yes
sensor_name
Description. The hostname of the system on which the sensor is installed.
Default Value. None
Configured by wizard? No, the wizard does not prompt for this value, it is set during installation. You can manually change it later if desired.
set_source_category
Description. When this option is set to "true", the value of the _sourceCategory metadata field assigned to the data collected by the sensor is cse/network/<type>. If you set the option to "false", the _sourceCategory value will be the same as the _sourceCategory assigned the Sumo Logic collector.
Default Value. true
Configured by wizard? No, the wizard does not prompt for this value, it is set during installation. You can manually change it later if desired.
shipper_threads
Description. The number of threads the process that sends the collected data to Sumo Logic will use to send files concurrently; setting this higher than 8 will have no impact.
Default Value. Varies from 3 to 8; set dynamically based on the number of available CPUs.
Configured by wizard? No
skipped_log_types
Description. This option controls which log files are discarded and not uploaded by the sensor. (For a list of log files generated by Zeek, see Log Files).
Example. To filter discard ntp.log, add the following parameter to trident-sensor.cfg:
skipped_log_types = dpd,weird,syslog,pe,tunnel,communication,conn-summary,known_hosts,software,stdout.stderr,loaded_scripts,ntp
Default Value.
dpd,weird,syslog,pe,tunnel,communication,conn-summary,known_hosts,software,stdout.stderr,loaded_scripts
status_interval
Description. The time interval (in seconds) at which the sensor status report will be sent; setting this to less than 60 seconds will have no impact.
Default Value. 300
Configured by wizard? No
version
Description. Obsolete. Older sensor installations will have option, but it's not used in newer sensors.
Default Value. None
Configured by wizard? No
zip_password_protected_only
Description. If application/zip files are extracted, should only password-protected zip files be kept (uploaded to the cluster)?
Default Value. true
Configured by wizard? no
Sample configuration files
This section contains examples of the trident-sensor.cfg and node.cfg files.
Sensor configured to use a single worker
This sample /opt/trident/sensor/conf/trident-sensor.cfg file specifies the use of a single worker.
log_file                    = /opt/trident/sensor/logs/trident-shipper.log
input_directory             = /opt/trident/sensor/output
sensor_name                 = pontoon-ubuntu1804
sensor_id                   = c4b6e2c7-d696-444a-9803-398cd9407fc4
sensor_zone                 = default
sensor_iface                = enp0s3
extracted_file_directory    = /opt/trident/sensor/output/extract_files
maximum_extracted_file_size = 10485760
proxy_required              = false
proxy_https                 = true
proxy_auth_required         = false
extracted_file_types        = application/x-dosexec,application/x-msdownload,application/zip,application/x-msdos-program
zip_password_protected_only = true
status_interval             = 300
compression                 = gzip
sumo_http_source_url        = https://example.sumologic.com/receive..._and_numbers__
cluster_config_file         = /opt/trident/sensor/bro/etc/node.cfg
filter                      = not ( host example.sumologic.com )
cluster                     = true
workers                     = 1
Sensor configured to use four workers
This sample /opt/trident/sensor/conf/trident-sensor.cfg file specifies
the use of four workers.
log_file                    = /opt/trident/sensor/logs/trident-shipper.log
input_directory             = /opt/trident/sensor/output
sensor_name                 = demo-sensor
sensor_id                   = 99b63729-007v-038u-8t42-51dikn72j7g
sensor_iface                = eth0
extracted_file_directory    = /opt/trident/sensor/output/extract_files
maximum_extracted_file_size = 10485760
proxy_required              = false
proxy_auth_required         = false
extracted_file_types        = application/x-dosexec,application/x-msdownload,application/zip,application/x-msdos-program
zip_password_protected_only = true
status_interval             = 300
sumo_http_source_url        = https://example.sumologic.com/receive..._and_numbers__
filter                      = not ( host example.sumologic.com )
cluster                     = true
workers                     = 4
cluster_config_file         = /opt/trident/sensor/bro/etc/node.cfg
Sample node.cfg file (cluster configuration file)
The /opt/trident/sensor/bro/etc/node.cfg file is automatically generated, based on the choices you make when running the configuration wizard at installation time.
Typically you should not edit node.cfg without consulting Cloud SIEM support. Under some circumstances, edits may be necessary, for example, if you want to monitor more than one capture interface.
If you do make manual updates to node.cfg, you must restart the Network Sensor for the changes to take effect with this command:
sudo service trident_sensor restart
[manager]
type=manager
host=127.0.0.1

[proxy-0]
type=proxy
host=127.0.0.1

[worker-0]
type=worker
host=127.0.0.1
interface=eth0
lb_method=pf_ring
lb_procs=1 # this can be changed to have multiple cores dedicated to it

[worker-1]
type=worker
host=127.0.0.1
interface=eth1
lb_method=pf_ring
lb_procs=1 # this can be changed to have multiple cores dedicated to it

[worker-2]
type=worker
host=127.0.0.1
interface=eth2
lb_method=pf_ring
lb_procs=1 # this can be changed to have multiple cores dedicated to it

[worker-3]
type=worker
host=127.0.0.1
interface=eth3
lb_method=pf_ring
lb_procs=1 # this can be changed to have multiple cores dedicated to it
Useful Linux commands
This section contains Linux command for working with the sensor and its configuration files.
# Restart sensor
$ systemctl restart trident_sensor

# Sensor status
$ systemctl status trident_sensor

# Standard Performance check 1
$ top

# Bro Control Access
$ sudo /opt/trident/sensor/bro/bin/broctl # then you can run `help` to see all commands

# View Trident Config
$ cat /opt/trident/sensor/conf/trident-sensor.cfg

# Edit Trident Config
$ vi /opt/trident/sensor/conf/trident-sensor.cfg

# View Node Config
$ cat /opt/trident/sensor/bro/etc/node.cfg

# Edit Node Config
$ vi /opt/trident/sensor/bro/etc/node.cfg

# View Logs
$ tail -f /opt/trident/sensor/logs/trident-sensor.log

# View Data Flow Logs
$ tail -f /opt/trident/sensor/logs/trident-shipper.log

# View Outputs
$ ls -lh /opt/trident/sensor/output/

# TCPDump to verify the monitoring interface is seeing traffic
$ sudo tcpdump -c 20 -i <<interface name>>     Or    $ sudo tcpdump -c 20 -i <<interface name>> port 80
Troubleshooting
Interface status
If an Ubuntu VM (possibly other Linux distributions) does not show both interfaces (one for traffic monitoring and one for management) that have been assigned when using the ifconfig command, but does show both interfaces when running an ip link show then the second interface is not currently in an UP state.
You can temporarily put the interface in the UP state, using the following command:
$ ip link set\<<interface name\>> up
To make the UP state persist through a reboot or service restart, edit the /etc/network/interfaces file with your choice of editor. Remember to use sudo. Add the following line to this file:
auto\<<interface name\>>
After you save this file, clear any existing IPs from the interface by running:
$ sudo ip addr flush\<<interface name\>>
Troubleshoot Bro/Zeek
Diagnose issues with Bro/Zeek using the following command:
/opt/trident/sensor/bro/bin/broctl diag
The output of this command shows any fatal errors observed when one or more workers crashed.
There’s also a crash-diagscript you can run for the node that had an issue (The output below is from intentionally crashing Bro worker-0-1 node with an invalid pcap filter):
[root@localhost ~]# /opt/trident/sensor/bro/share/broctl/scripts/crash-diag /opt/trident/sensor/output/worker-0-1/

No core file found.

Bro 2.6-255
Linux 3.10.0-1062.18.1.el7.x86_64

Bro plugins: (none found)

==== No reporter.log

==== stderr.log
warning in /opt/trident/sensor/output/installed-scripts-do-not-touch/site/osdetect.bro, line 24: deprecated (bro_init)
warning in /opt/trident/sensor/output/installed-scripts-do-not-touch/site/exploit-kit.bro, line 14: Use of deprecated attribute: &synchronized
warning in /opt/trident/sensor/output/installed-scripts-do-not-touch/site/exploit-kit.bro, line 14: Use of deprecated attribute: &mergeable
warning in /opt/trident/sensor/output/installed-scripts-do-not-touch/site/ja3.bro, line 59: deprecated (bro_init)
warning in /opt/trident/sensor/output/installed-scripts-do-not-touch/site/ja3s.zeek, line 41: deprecated (bro_init)
listening on enp0s3

fatal error in /opt/trident/sensor/bro/share/bro/base/frameworks/packet-filter/./main.zeek, line 282: Bad pcap filter 'not ( host https://localhost ) and not ( dst port 514 )'

==== stdout.log
max memory size         (kbytes, -m) unlimited
data seg size           (kbytes, -d) unlimited
virtual memory          (kbytes, -v) unlimited
core file size          (blocks, -c) unlimited

==== .cmdline
-i enp0s3 -U .status -p broctl -p broctl-live -p local -p worker-0-1 trident-sensor.bro broctl base/frameworks/cluster broctl/auto -C

==== .env_vars
PATH=/opt/trident/sensor/bro/bin:/opt/trident/sensor/bro/share/broctl/scripts:/usr/local/sbin:/usr/local/bin:/usr/sbin:/usr/bin
BROPATH=/opt/trident/sensor/output/installed-scripts-do-not-touch/site::/opt/trident/sensor/output/installed-scripts-do-not-touch/auto:/opt/trident/sensor/bro/share/bro:/opt/trident/sensor/bro/share/bro/policy:/opt/trident/sensor/bro/share/bro/site
CLUSTER_NODE=worker-0-1

==== .status
TERMINATED [atexit]

==== No prof.log

==== No packet_filter.log

==== No loaded_scripts.log
[root@localhost ~]#