Create a Dashboard
This page demonstrates how to create a Dashboard, add a query, and then add the chart to the dashboard. You create your Dashboard by selecting template options from menus and dropdowns.
Dashboard allows you to view logs and metrics data on the same dashboard in an integrated and seamless view. This gives you the same control over how your metrics and log data are visualized. Dashboard template capabilities provide for easier data scoping and intuitive chart creation.
Rather watch a short micro lesson video?
Dashboard AutoSave
When you rename or add a panel to a dashboard it is automatically saved in your Sumo Logic Personal folder. Likewise, ongoing changes and additions to the dashboard are saved. This ensures the integrity of your work and prevents any loss due to unforeseen interruptions or outages.
Create a Dashboard
There are two ways to create a Dashboard, either by using the following method, or by creating it directly from the Log Search page or Metrics page. Panels and customized charts will be added in later steps.
- Classic UI. Go to the Home screen and select Dashboard.
New UI. In the main Sumo Logic menu, select Dashboards > New Dashboard. You can also click the Go To... menu at the top of the screen and select New Dashboard. - Select the Dashboard text field at the top of the window and enter a unique name for your new dashboard.
Add a panel
Now that you have created a new Dashboard, you can populate it with panels that visually display your data. This task shows you how to add a panel to your new dashboard and customize the display.
To add a panel to a new Dashboard, do the following:
- Select a panel type by clicking the corresponding icon.
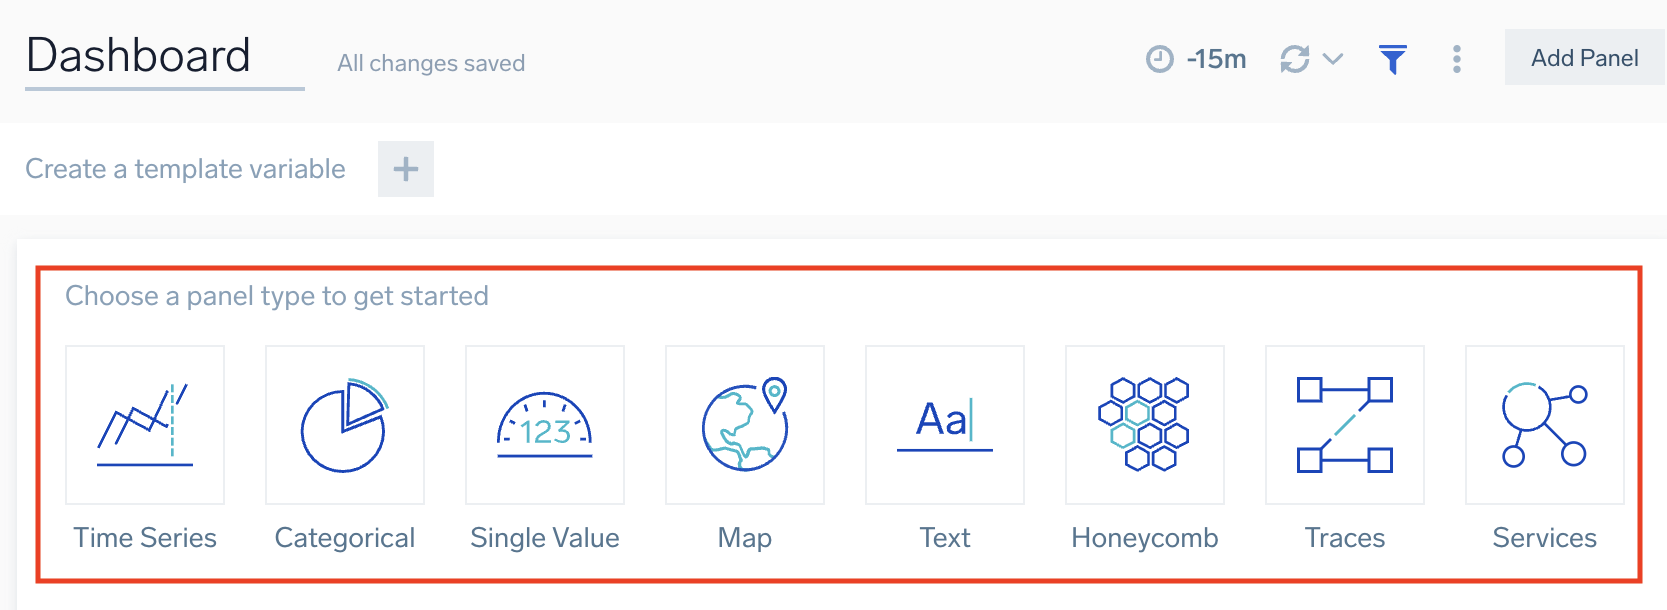
- You are prompted to provide a query.
See Choosing a panel type for details.
Add queries
You can create Log and Metric queries on the same panel.
Log Query
Enter your aggregate search query in the input field and press enter. A few important things to note are:
- Only search results that have been aggregated using a group or aggregate operator can be charted. See Group or Aggregate Operators for a list.
- By default, the query builder is set to Logs.
- Joining log queries in a separate query is not supported.

Metrics Query
Click the left-most dropdown option and select Metrics. You should be familiar with the basics of creating metrics queries to ensure successful results. By default, the query builder is set to Logs.
To create a metrics query utilize the Metrics Explorer.
Multiple Query
To add another query to a panel click the plus + icon on the last query row. Each query is assigned a letter for reference.
Modify Chart
You can customize a chart on a dashboard panel in a variety of ways. To include changing the chart type to analyze the data in another format. See Modify a Chart for details on all the available options.
Add to Dashboard
Click the Add to Dashboard button on the top right of the window to add the panel to your dashboard. 
That's it, start using your Dashboard.
Delete a Panel
You can delete a panel that you no longer need.
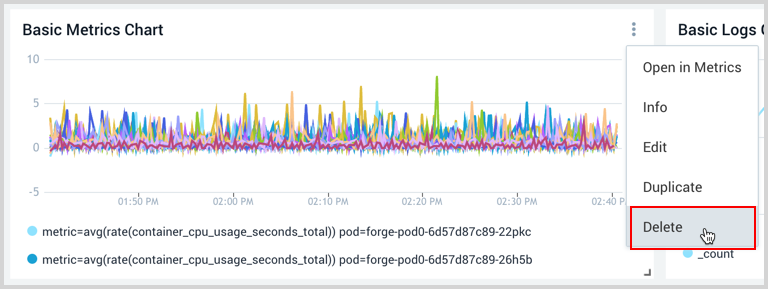
- Go to the Dashboard in Sumo Logic that has the panel you want to delete.
- Hover the cursor over the Details icon to display the pop-up menu.
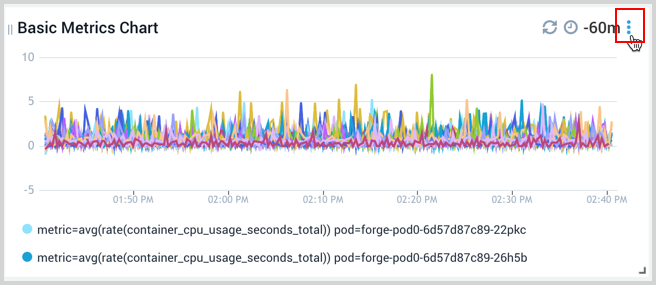
- Select Delete.
Log Search page
To create a Dashboard from the Log Search page:
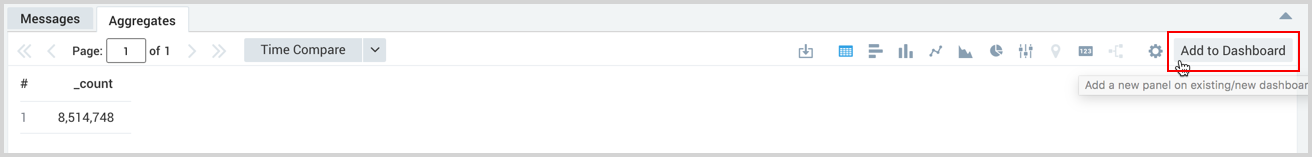
- From the Log Search page click the Add to Dashboard button on the Aggregates tab after running your aggregate query you want to add to a Dashboard panel.
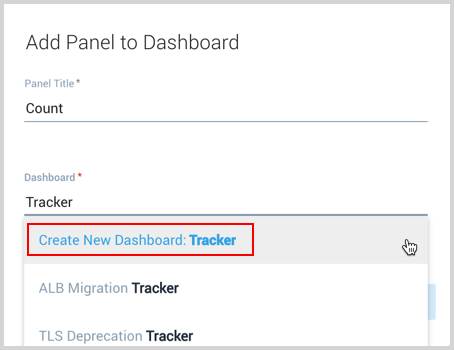
- In the Add Panel to Dashboard window provide a Panel Title and a name for the Dashboard. Once the name is entered you will have an option to select Create New Dashboard with your name. Select that option.
- In the updated window toggle the Create as Dashboard option.
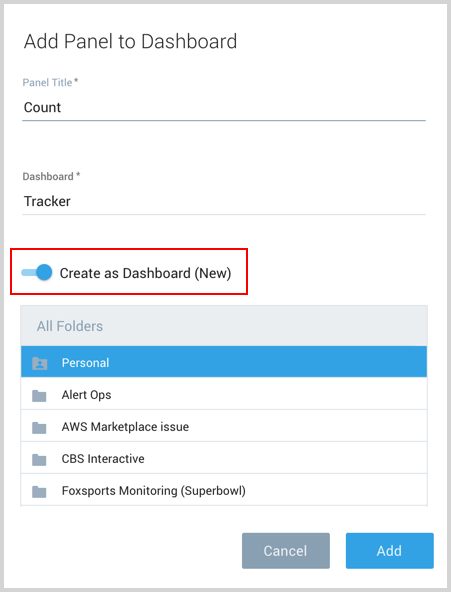
- Click Add and your new Dashboard is created.
Metrics page
To create a Dashboard from the Metrics page:
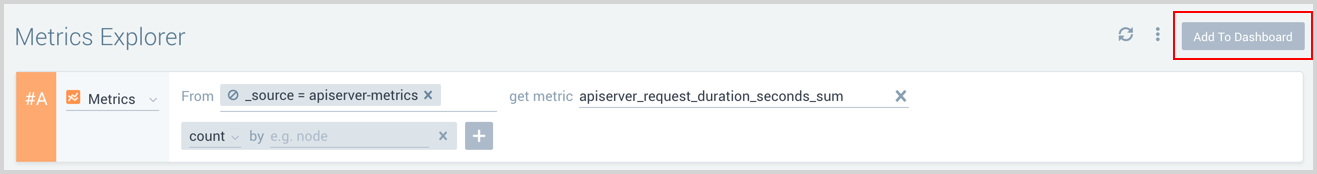
- From the Metrics page click the Add to Dashboard button on the Metrics Explorer.
- In the Add Panel to Dashboard window provide a Panel Title and a name for the Dashboard. Once the name is entered you will have an option to select Create New Dashboard with your name. Select that option.
- In the updated window toggle the Create as Dashboard option.
- Click Add and your new Dashboard is created.