Explore Monitoring Dashboards
Sumo Logic provides monitoring dashboards for an intuitive visual hierarchy of your environment to facilitate successful monitoring, managing, and troubleshooting.
Classic UI. To access the monitoring dashboards, go to the Home screen and select Explore. Then in the upper-left corner of the screen, select from the dropdown menu under Explore By.
New UI. To access the monitoring dashboards, in the main Sumo Logic menu select Observability, and then select from the following menu options:
- Infrastructure Monitoring
- Application Monitoring
- Real User Monitoring
Navigating
To navigate, do the following:
- Classic UI. Go to the Home screen and select Explore.
New UI. In the main Sumo Logic menu, select Observability, and then select options under Infrastructure Monitoring or Application Monitoring. - Drill down further until you find your desired component which you'd like to explore. Metrics will be displayed/visualized as dashboards.
Stack linking
Stack linking connects dashboards so you can view dashboards when exploring infrastructure components. Learn more. 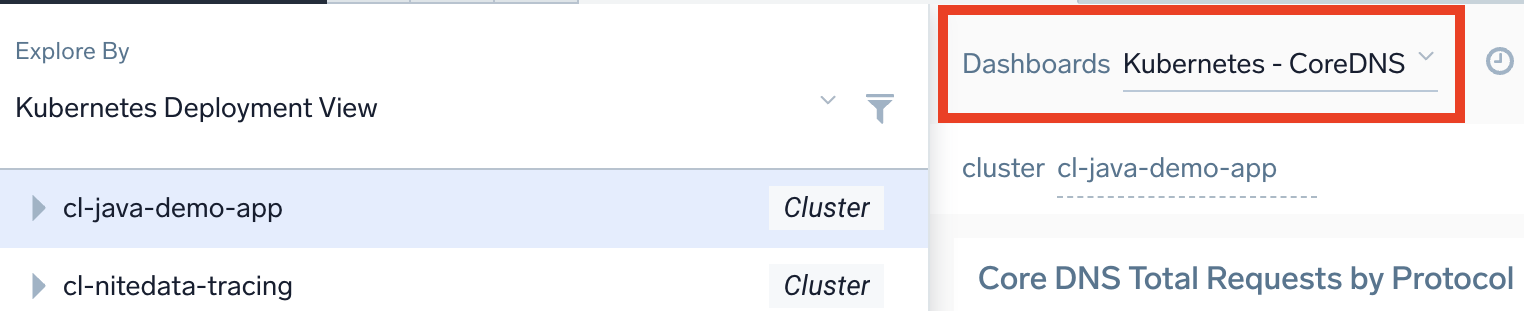
Monitoring dashboard categories
Monitoring dashboards are available for the following apps and solutions.
AWS Observability
AWS Observability provides an intuitive dashboard framework that mirrors industry-standard AWS hierarchies. You can quickly navigate across multiple AWS accounts and view resources hosted in multiple locations worldwide. From this tab, you can quickly navigate across multiple AWS accounts and view resources hosted in multiple locations worldwide. Learn more.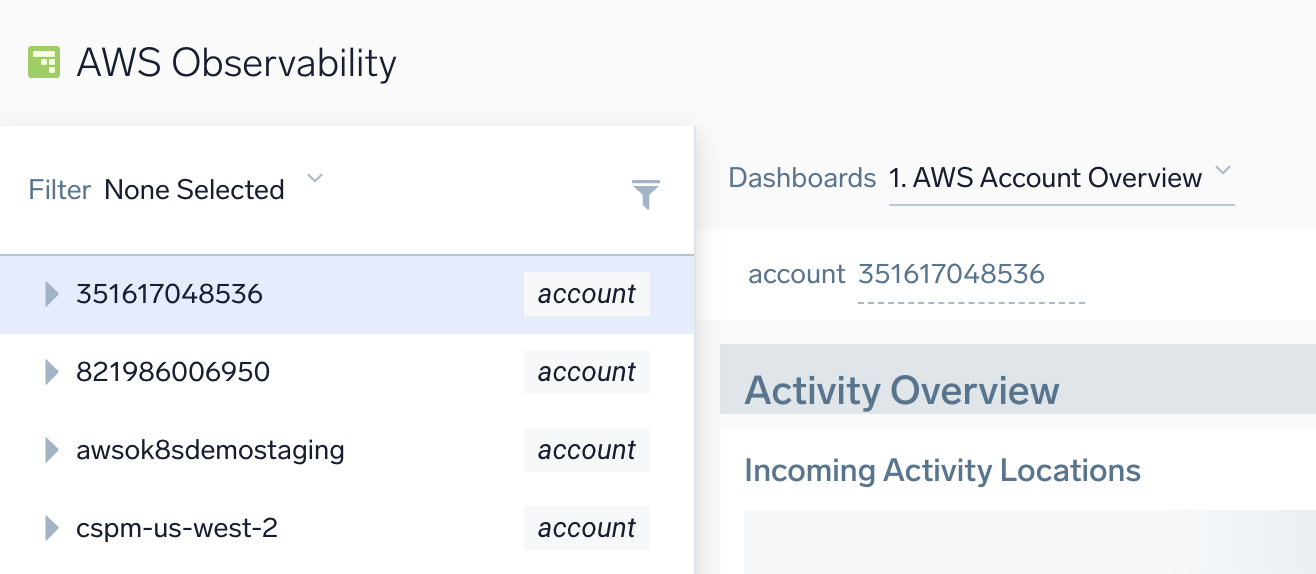
Kubernetes Views
Kubernetes views provide a visual hierarchy of the clusters in your environment that allows you to view and switch between clusters with a single click. These views, used in conjunction with the Sumo Logic Kubernetes App, allow you to intuitively monitor and troubleshoot issues as they arise. You can intuitively filter on four hierarchical views of your Kubernetes system: Node, Deployment, Service, and Namespace. Learn more.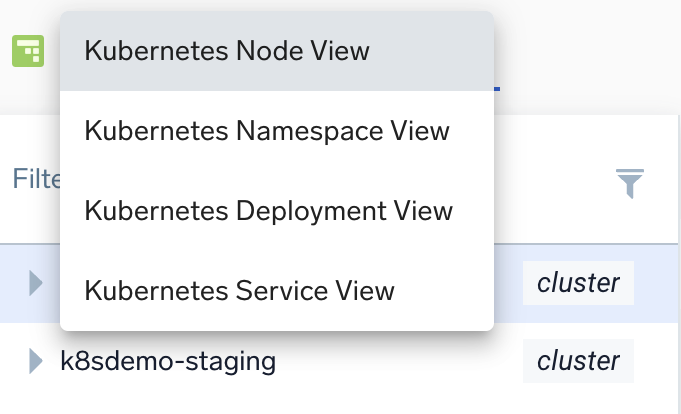
Application service views
Application Monitoring provides three Service and Application dashboard views. This allows you to review tracing data by application (all or grouped), environment, and services by top level and breaking down their health by application. This helps you review the most active operations performed on specified applications and services. See Service Map Traces and Sumo Logic Apps for more info. 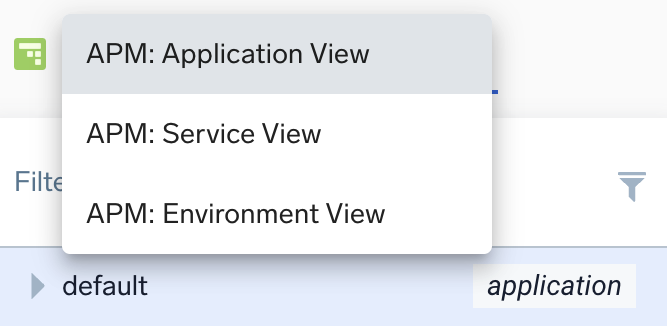
Real User Monitoring
Real User Monitoring allows you to visualize Real User Monitoring (RUM) metrics gathered from tracing instrumentation in the browser. This provides visibility into an actual end-user experience by geographical locations, browser, and operating system types. This also helps you to understand how your customers experience the performance of your web application.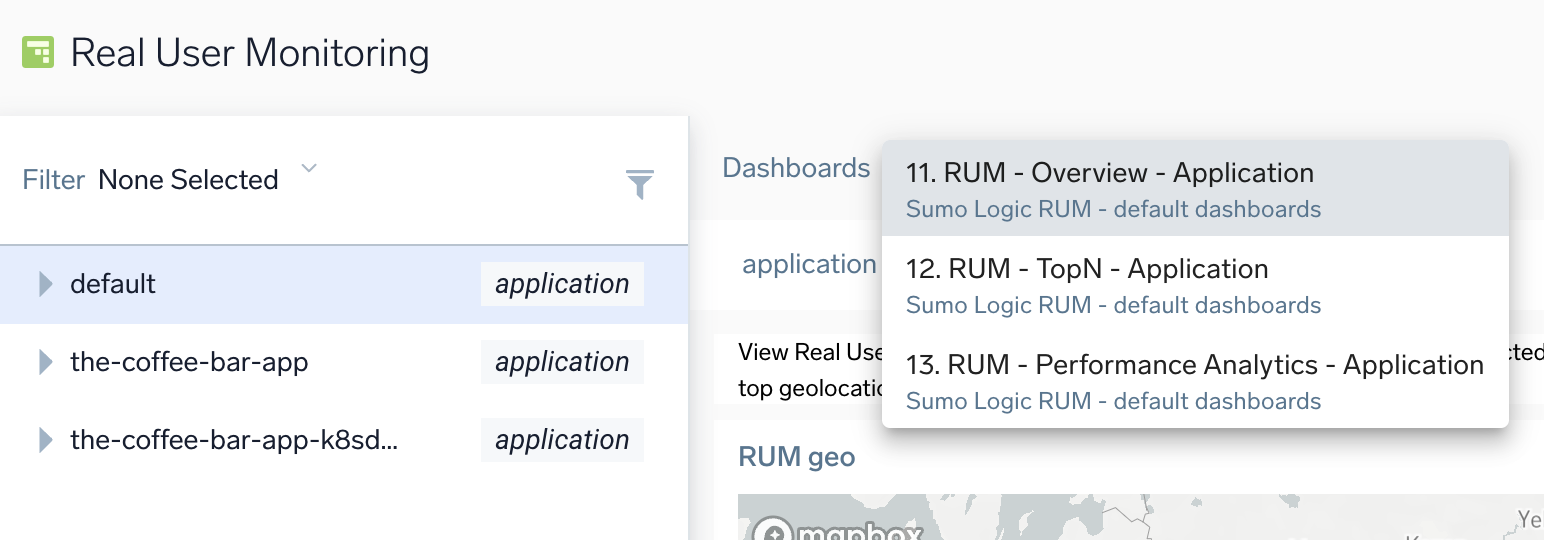
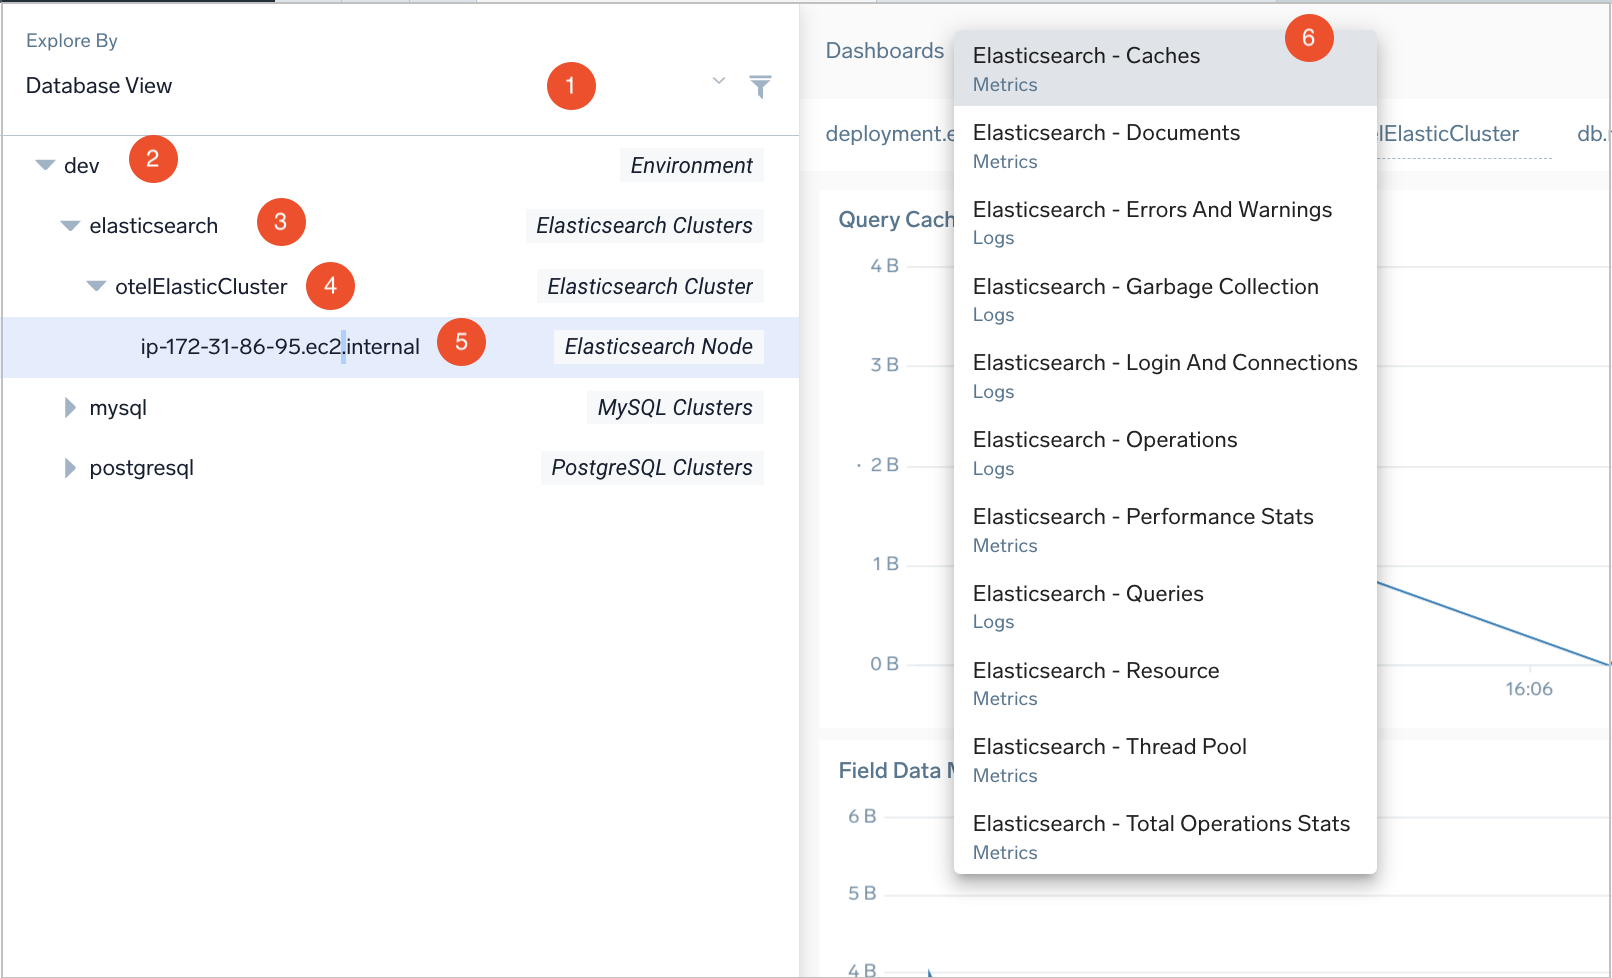
Database View
Sumo Logic provides a set of dashboards for various components of your application that allow you to review the state of individual parts of your system. You can track errors, performance, and usage of application components, grouped by their type and logical clusters.
This feature is currently supported only for Database apps. To learn more, go to the Database docs and Application Component Solution.
- Select the Database View category.
- Select an environment (e.g.,
devorprod).- Application Components - Environments Overview will appear on the right. This dashboard provides insights into the CRUD activities and monitor errors of each of the components in that environment.
- Select from the list of that environment's components (e.g.,
Elastisearch Clusters).- The respective dashboard will appear in the right nav.
- Then choose a specific database .
- Drill down into hierarchy to find specific component entities to view dashboards at more granular levels.
- Toggle between various dashboards to get your desired info.
Filtering
You can filter your view so you can focus on specific entities and sections of your system.
Create filters
-
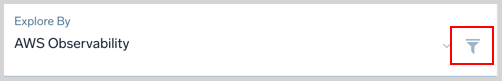
To filter click the filter icon in the left-hand navigation menu. You can click the icon to toggle the visibility of the menu.
-
Once clicked the filter menu appears below:

The Filter menu allows you to select a saved filter or write a new one. If you have any saved filters they are available in the dropdown menu Filter. The default value is None Selected. The Clear All button is available to clear any filters that are already applied.
-
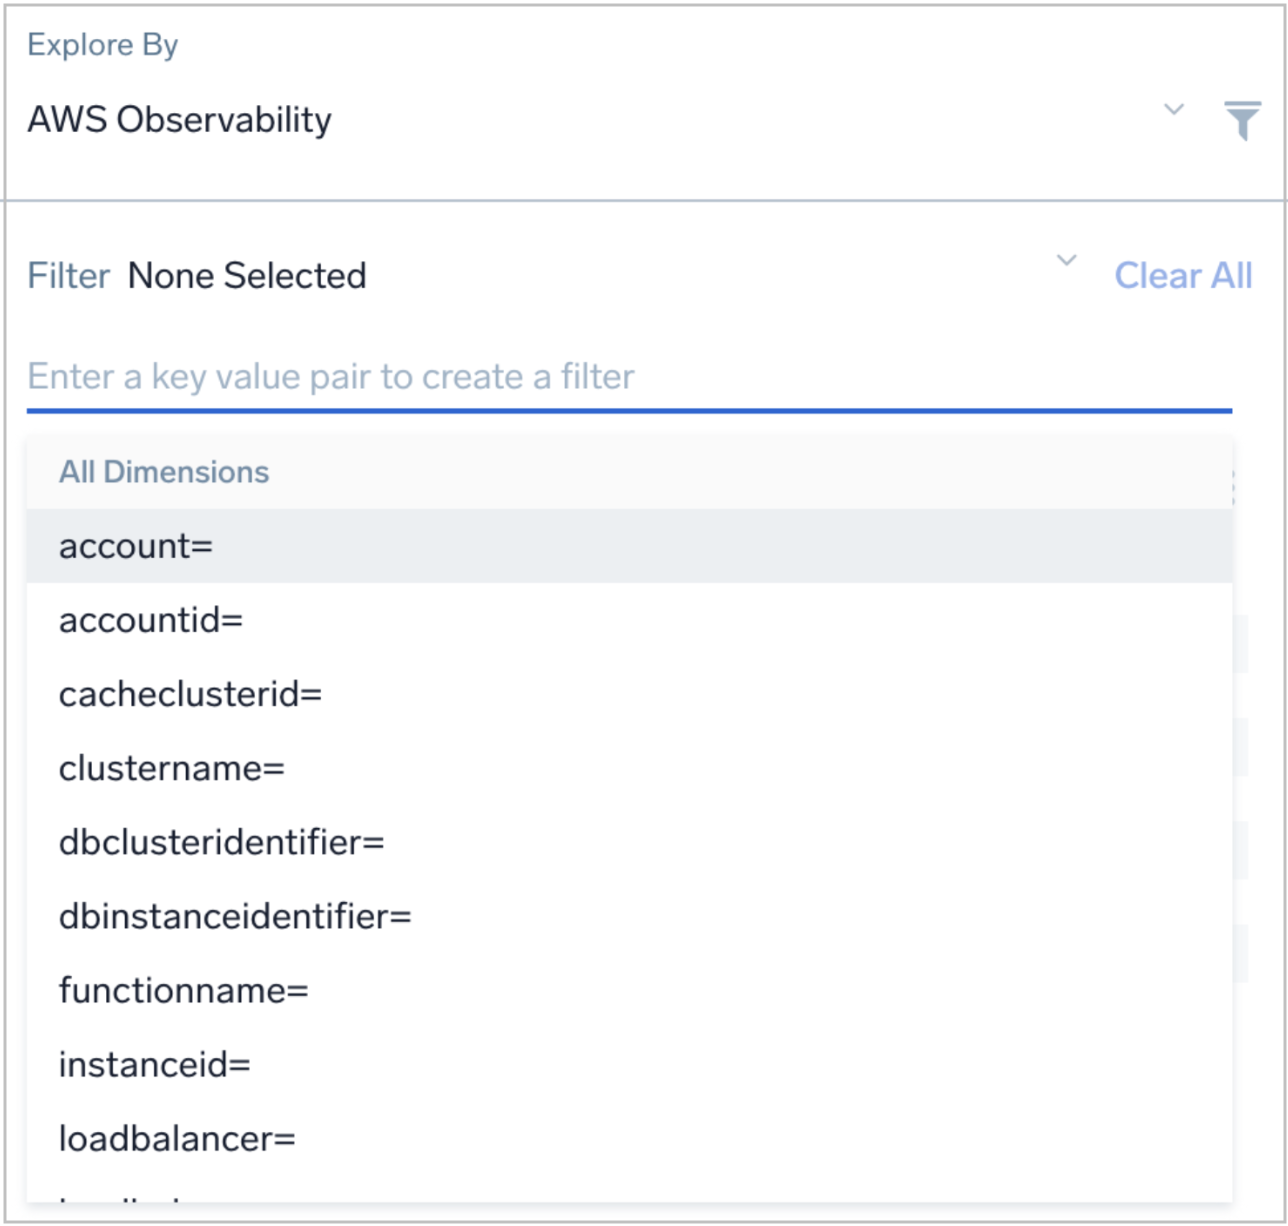
To create a new filter click in the Enter a key value pair to create a filter input area. A dropdown will appear showing you available keys you can filter by. You may only provide a value without a key.
-
Enter or select the keys you want to filter by then click Apply. Filters of the same key behave as an OR condition and different keys behave as an AND condition.

The menu will refresh with your filters applied.
You can apply the filter as an exclusion or negation so the filter acts as a not or bang !. This way the filter will return results that do not have those values. Simply click the prohibition or no sign to set. The filter will get a red border when set to exclude. You may manually add an exclamation or bang ! to the input area before selecting your filter. For example, !_key=value.
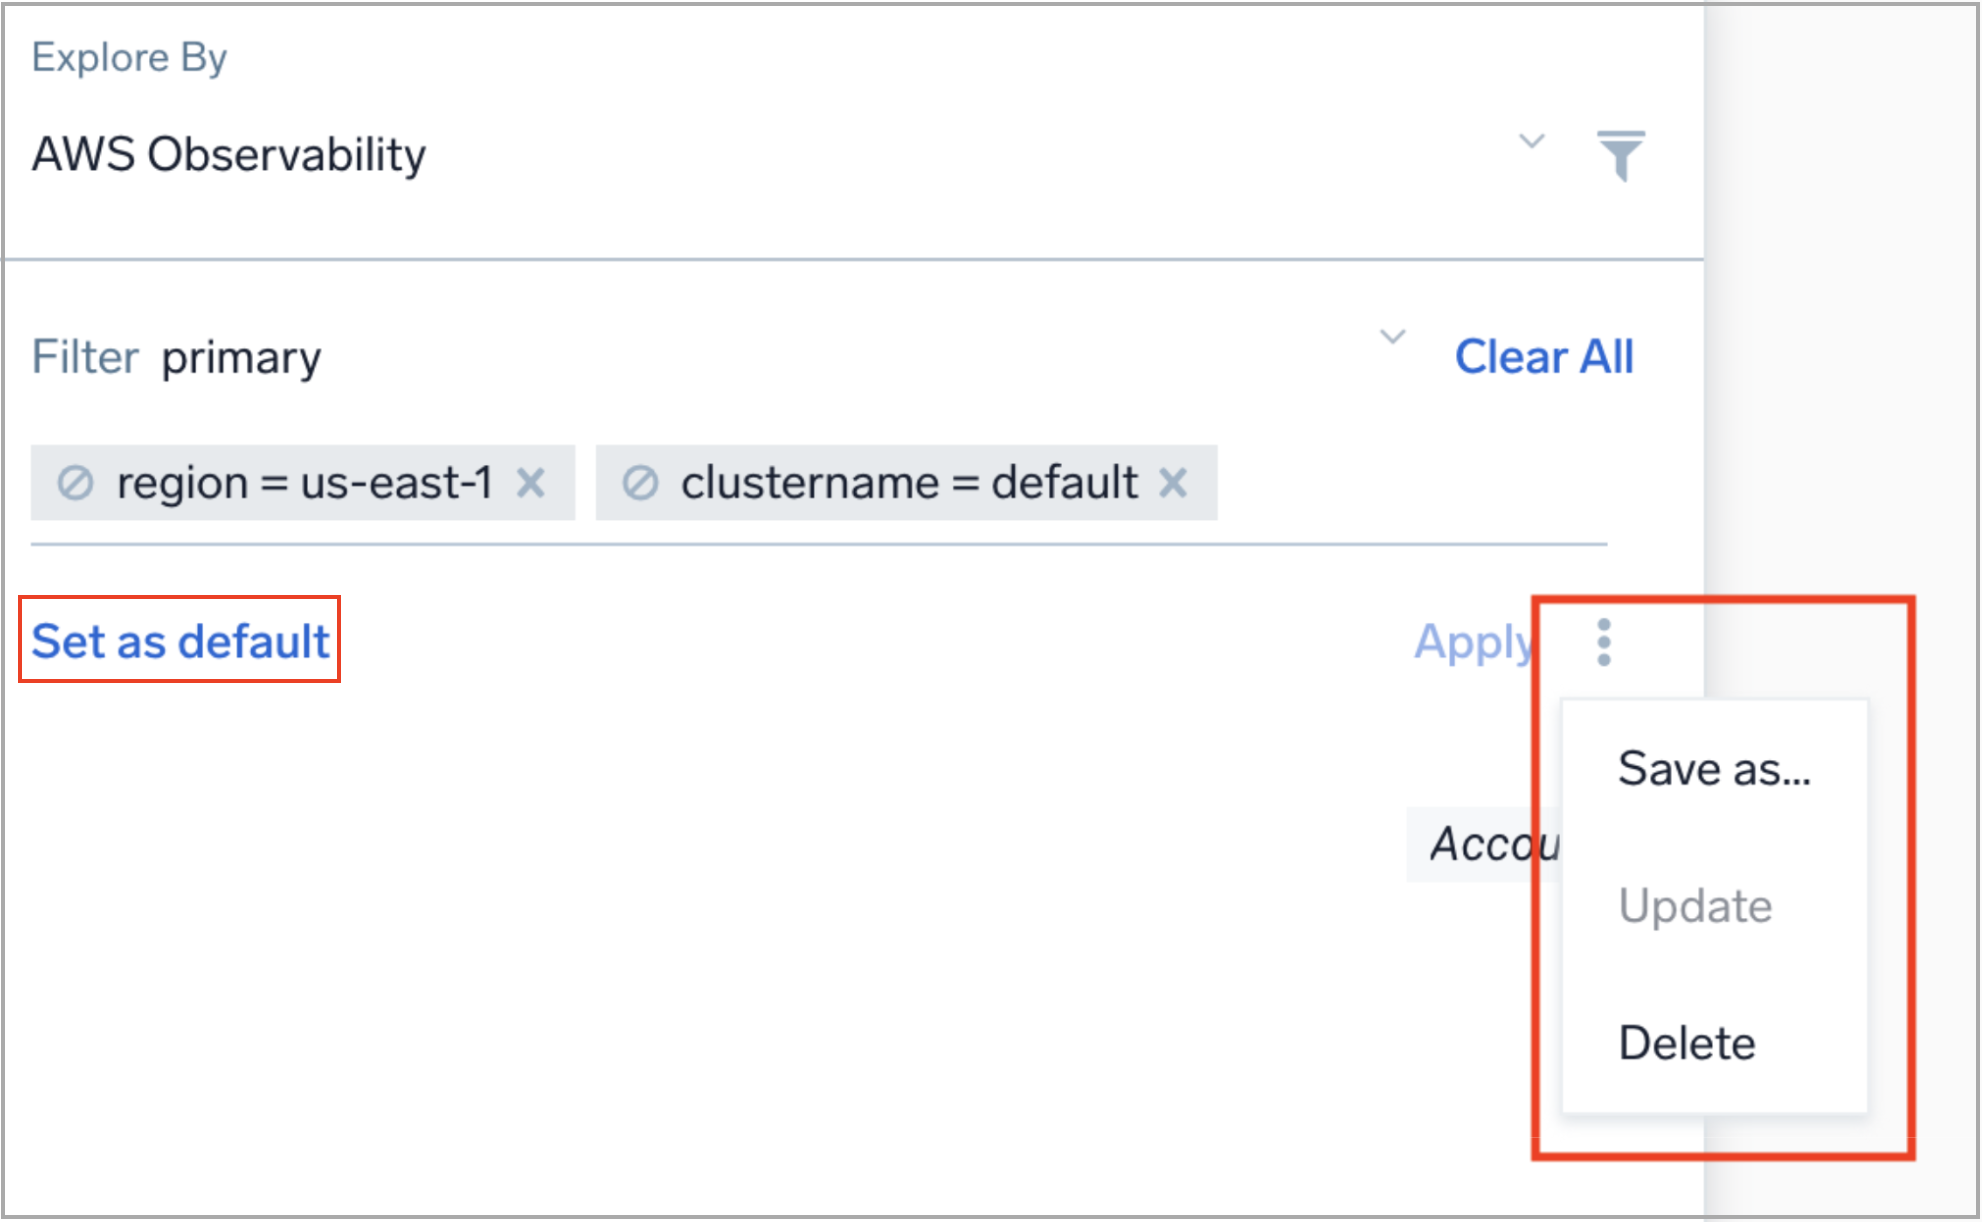
Saving filters
You can save filters so they are applied every time you explore the same dashboards. To save, click the three-vertical dots icon and then click Save.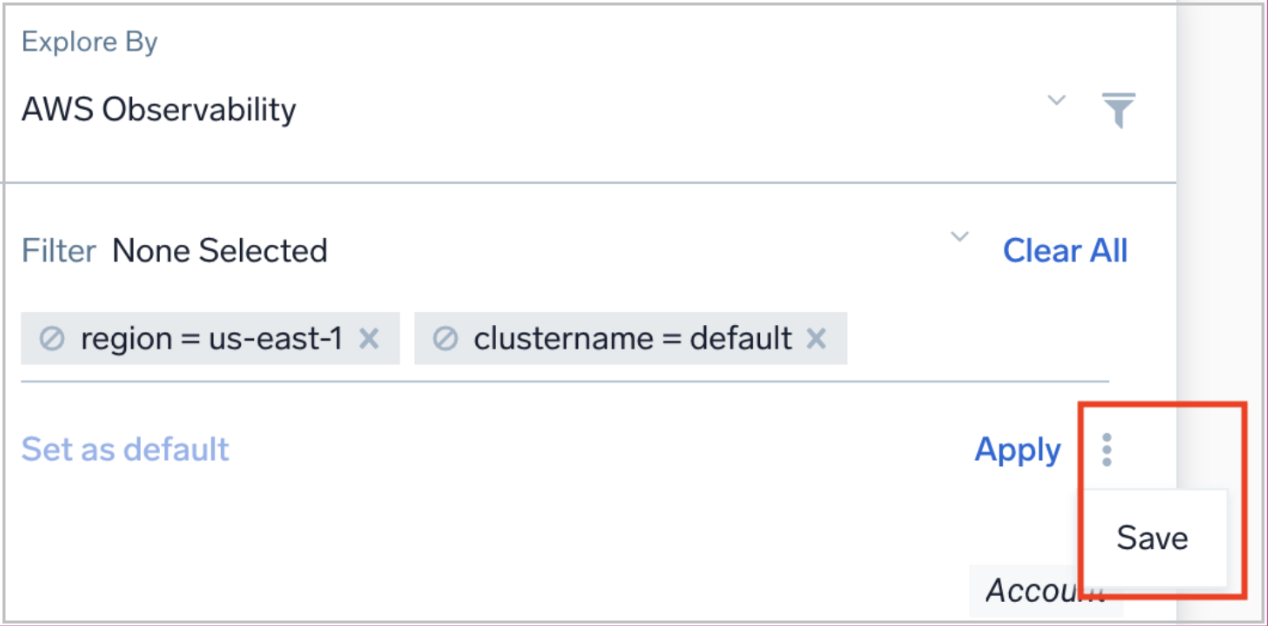
A pop up window is shown where you need to provide the filter a name. This name is what you'll see in the Filter dropdown menu.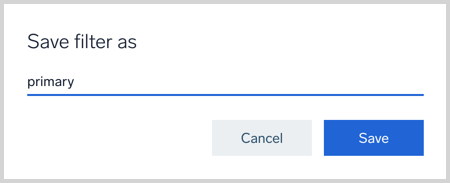
We have named the filter "primary" in the above image. Once done click Save. When opening the view, you'll now see the primary filter as an option in the Filter menu.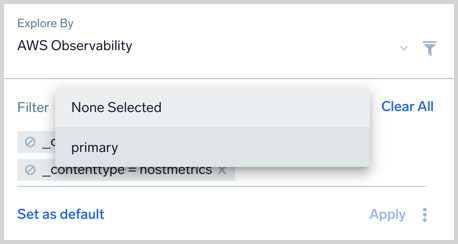
Updating, deleting, saving filters as default
Saved filters can be applied as a default filter, edited, or deleted.
- A default filter is applied every time you open the view.
- The update option is available if you edit a saved filter.
- A deleted filter is not recoverable.
Remove default filter
The default filter is displayed in the Filter dropdown menu with a Default label. Select the Remove default text link to clear your set default filter.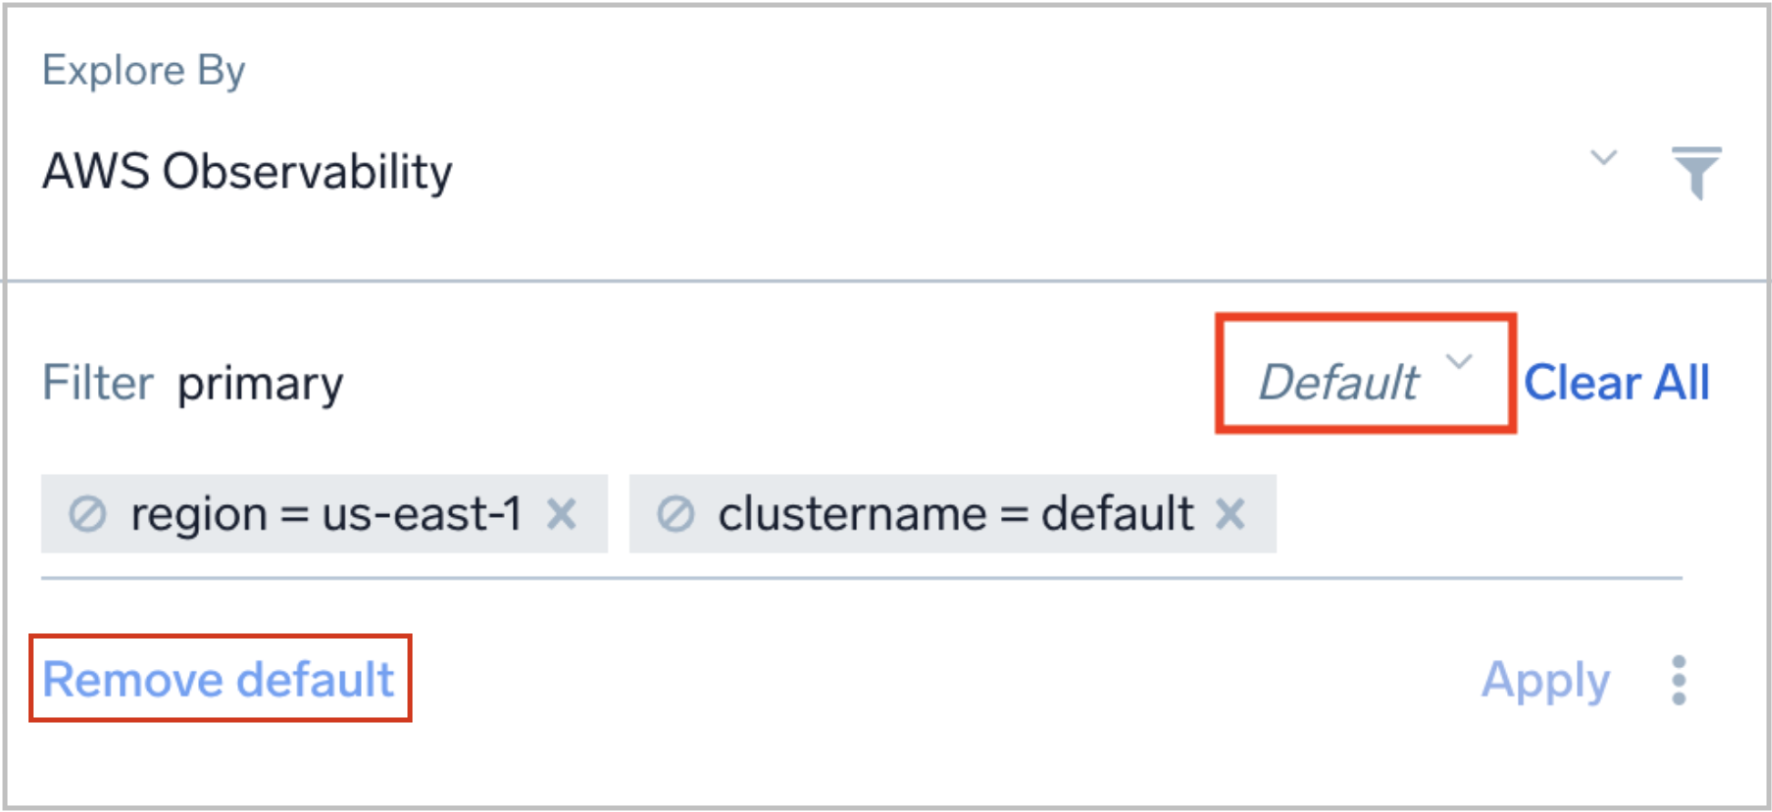
Linking to entities
Obtaining Links
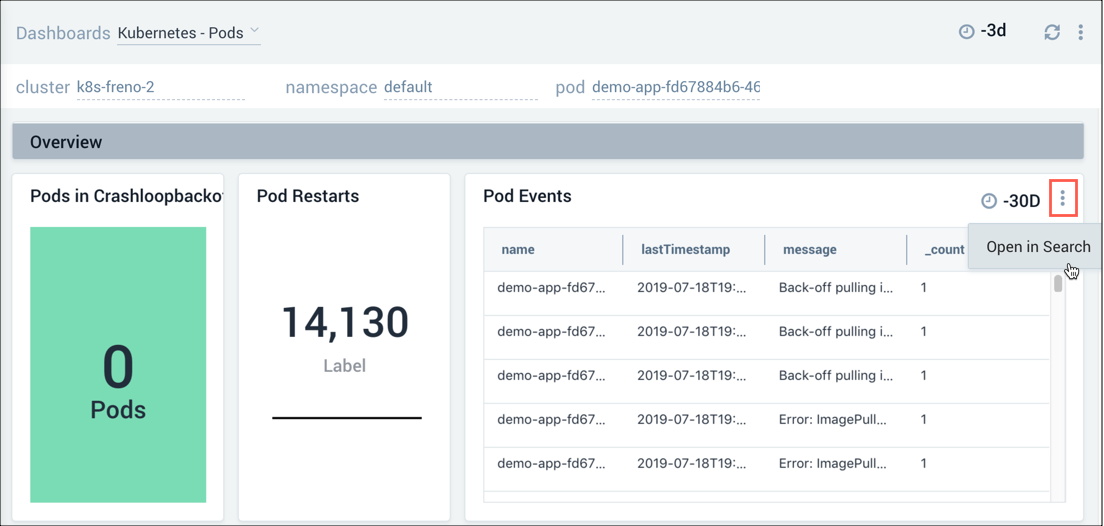
Use the link button to the right of the dashboard title to copy the link to your specific entity view in the dashboard. This is related to Stack Linking.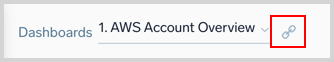
Manually creating links
You can create a URL to a specific entity.
Syntax
https://<endpoint>/ui/#/explore/[@<startMs>,<endMs>]@topology=<topologyId>@<entityId>,<entityTypeId>,<entityName>[@<entityId>,<entityTypeId>,<entityName>][@filters@<negation>:<filterValue>[:<filter>],<negation2>:<filterValue2>[:<filter2>] ...]@selectedDashboardId@<dashboardId>
Required:
<endpoint>is your Sumo Logic service endpoint. See Sumo Logic Endpoints and Firewall Security for the endpoint URLs.<entityKey>is the type of entity you want to explore, such as cluster, deployment, service, node, account, region, namespace, or pod.<entityValue>is the value of the entity to explore.
Optional arguments:
<start>is the start of your dashboard time range in milliseconds since epoch.<end>is the end of your dashboard time range in milliseconds since epoch.
Filters:
<filterValue>is the value of a key you want to filter.<filter>(optional) is the metadata key you want to apply as a filter to explore. You do not have to provide a filter, you may only provide afilterValue.<negation>set as0to apply your filters or1to treat the filters as an exclusion. Think of using1as using anotor!bang, so the filter will return results that do not have those values. This is an example:
https://<endpoint>/ui/#//explore/@1628023955694,1628024855694@topology=0000000000000041@cluster=kubernetes@filters@1:cl-tracing-training:_collector,0:kubernetes:_origin
Dashboard:
<dashboardId>is the unique identifier of the dashboard.
Example
Let’s create a URL to open on the primary-eks cluster, kube-system namespace, and metrics-server service.
The custom URL that launches this log query in the Sumo Logic Search page would be similar to the following. The exact URL would depend on your Sumo Logic account endpoint, as listed in Sumo Logic Endpoints and Firewall Security.
https://service.us2.sumologic.com/ui/#/explore/@cluster=primary-eks@namespace=kube-system@service=metrics-server
Using milliseconds as this time range: 09/26/2020 to 09/29/2020 10:33:10.282 AM GMT-04:00 DST
https://service.us2.sumologic.com/ui/#/explore/@1601092800000,1601389990282@cluster=primary-eks@namespace=kube-system@service=metrics-server
Troubleshooting
Navigation capabilities allow you to quickly locate the object that needs debugging in a physical stack. This section walks you through a high-level troubleshooting scenario to illustrate the possibilities.
Step 1: Analyzing the cluster
We suspect there's a problem with a Kubernetes cluster but aren't sure where, so we start by analyzing the Cluster Overview dashboard. Everything that is running on the cluster is shown on this dashboard. The Terminated and Waiting by Namespace panel allows us to easily comprehend the failure states the namespaces are in. Here we can easily see if there are configuration issues or overall administration issues that need to be addressed.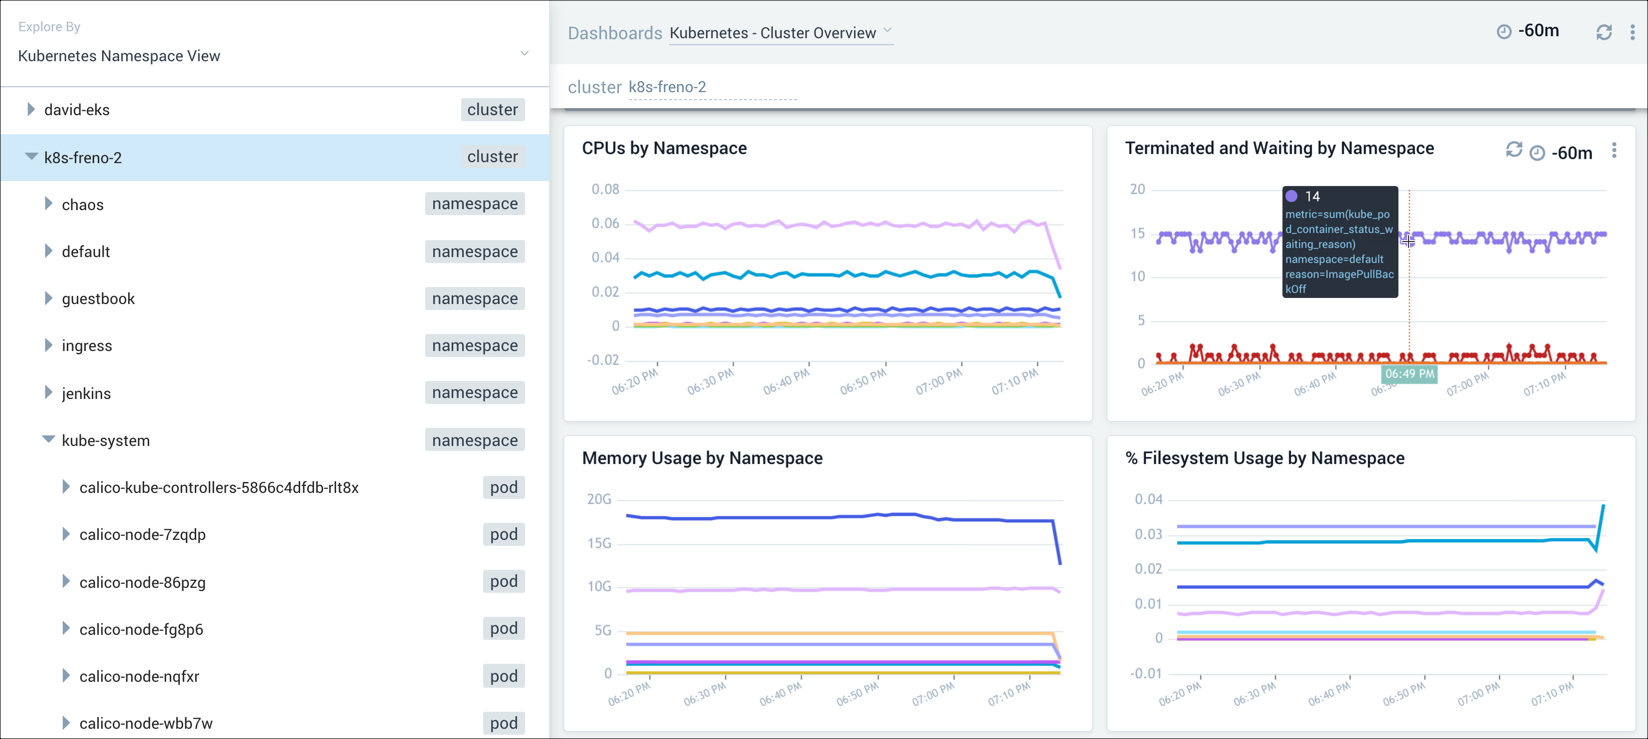
Step 2: Exploring a namespace
To further pinpoint the problem with our cluster, we investigated the namespace by selecting kube-system in the navigation panel and switching to the Namespace Overview dashboard. This dashboard provides information on pods running in the deployment, failed pods, errors, CPU and memory usage, file system usage, terminated and waiting pods and containers. In this example, we're focusing on the CPU and memory usage panels of the dashboard in our attempt to find out where our application is running into problems.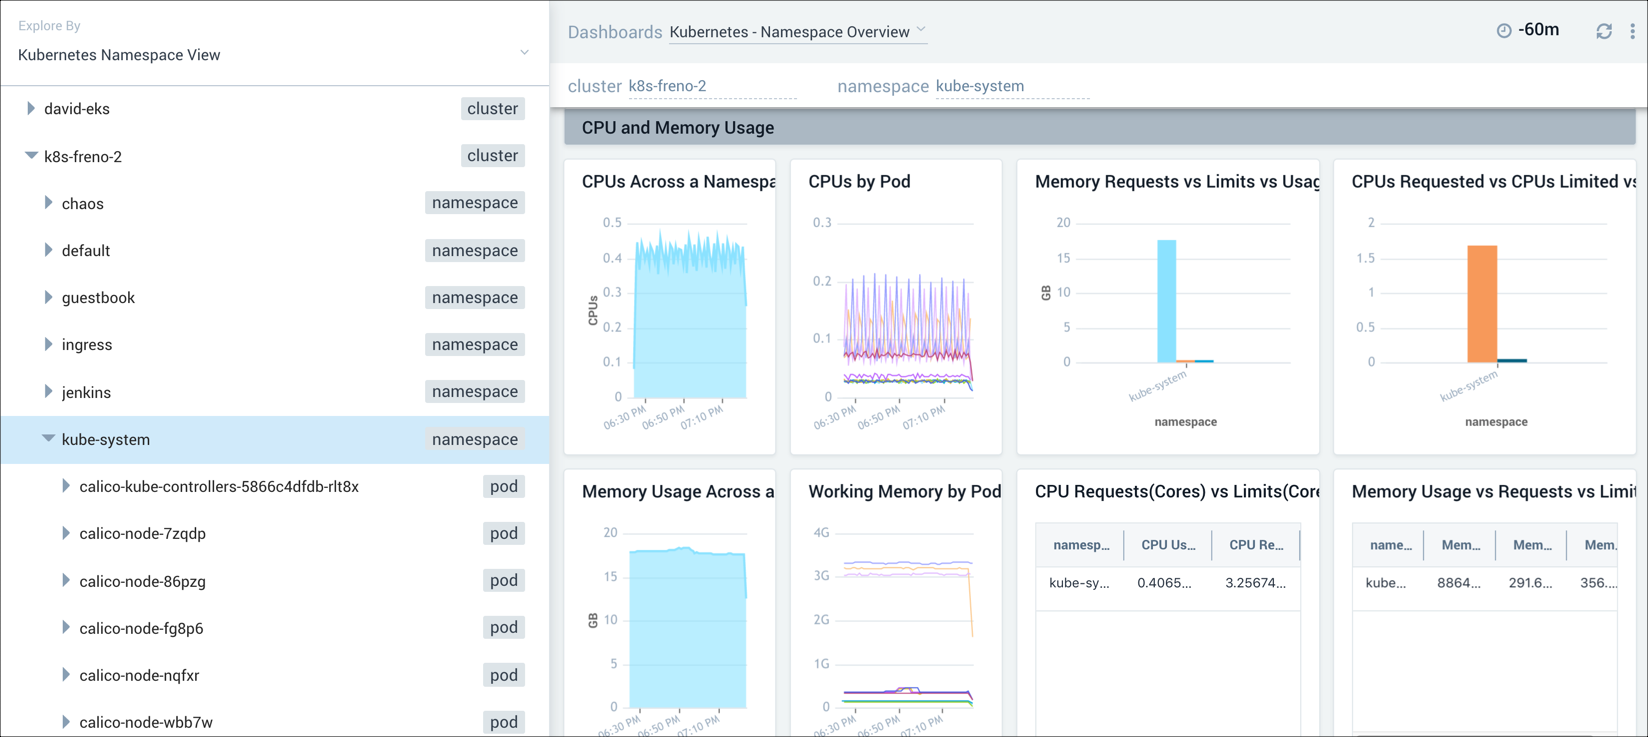
Step 3: Drilling down into a pod
Once we've determined which pod is having problems, we can drill down into the pod for more granular data. For example, you can select the Details icon for a panel to view that data in a search. Or, you can review the actual logs in the Log Stream panel.