Linking Multiple Dashboards
Linking multiple dashboards
You can link dashboards together to quickly view related data. Each panel can have links to other dashboards. Links have options to include metadata and time range. When you select a data point on the panel you will have an option to click on linked dashboards. This allows you to quickly reference other related dashboards to investigate.
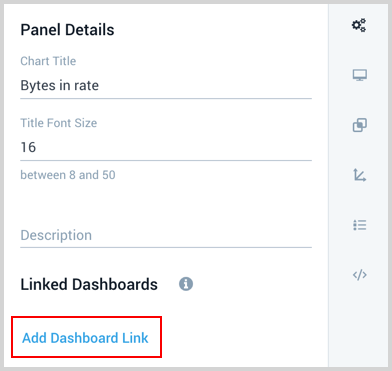
- Click the Add Dashboard Link from the general settings menu when modifying a chart in a panel.
- Click in the Dashboard Name input area and select or enter the name of the dashboard you want the panel to link to.
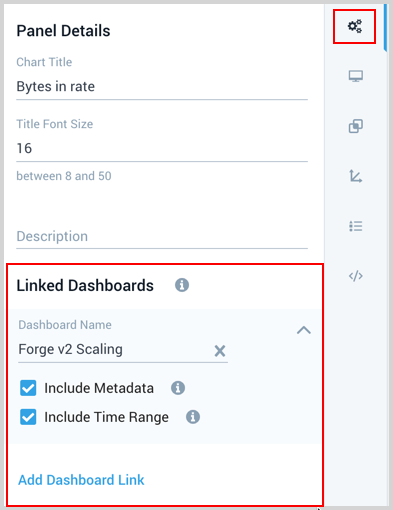
- Select to Include Metadata if you want the linked dashboard to run against the metadata and variable values of this panel.
- Select to Include Time Range if you want the linked dashboard to run with the time range of this panel.
Using links
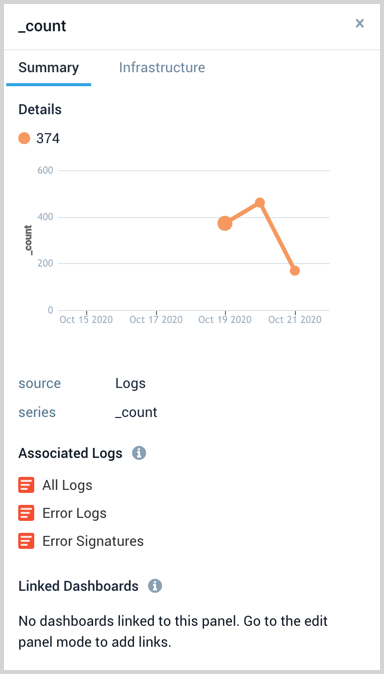
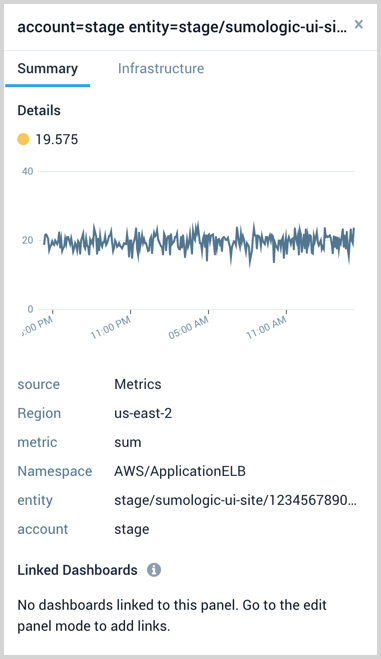
When you click a data point on a Dashboard chart the Summary tab provides your Linked Dashboards.
- The following image shows a Summary panel from a selected log data point. The Linked Dashboards section is at the bottom.
- The following image shows a Summary panel from a selected metric data point. The Linked Dashboards section is at the bottom.
Link a custom Dashboard to your stack
Stack linking connects Dashboard to monitoring dashboards so you can view dashboards when exploring infrastructure components.
You link a Dashboard by specifying metadata key-value pairs:
- Entity Type. Predefined entity object representing a given part of your system and its related set of data (such as EC2 Instance, Application, MySQL Cluster).
- Entity Name. Name of a given entity, as displayed in the monitoring dashboards tab. An asterisk (
*) can be used to match all entities of a given type.
The metadata keys assigned to your Dashboard Stack Linking must be the same as the explored component for the dashboard to show as an option. For example, if your component is named tablename, and has account, region, and namespace metadata assigned to it, as seen in the following monitoring dashboards screenshot: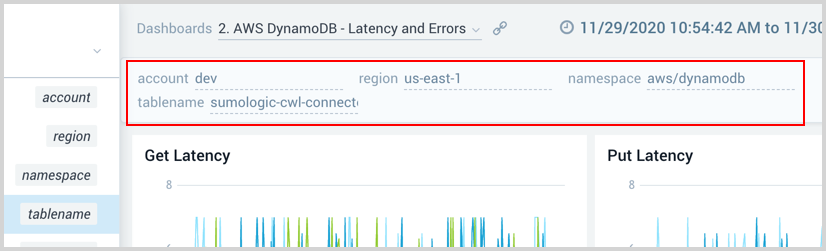
The keys assigned to the Dashboard Stack Linking would need to include those, for example: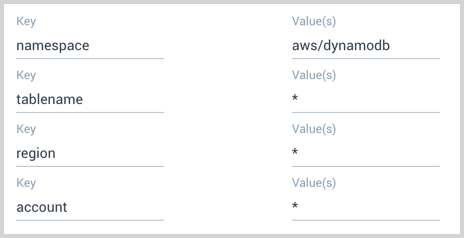
To link a custom Dashboard to your stack in monitoring dashboards, do the following:
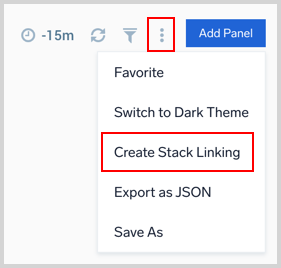
- From your custom dashboard, click the three-dot kebab icon in the upper right corner of the window and select Create Stack Linking from the dropdown menu.
info
Make sure you have edit permission for a dashboard to create stack linking.
- In the Dashboard Stack Linking dialog, set the Domain you want the key available in.
- Select an Entity Type for which you would like to display the dashboard.
- If you would like to further specify for which entities of a given type the dashboard is displayed, you can input the relevant Entity Name (as displayed in the monitoring dashboards tab). If you would like to see the dashboards for all entities of a given type, you can use (
*) as the Entity Name.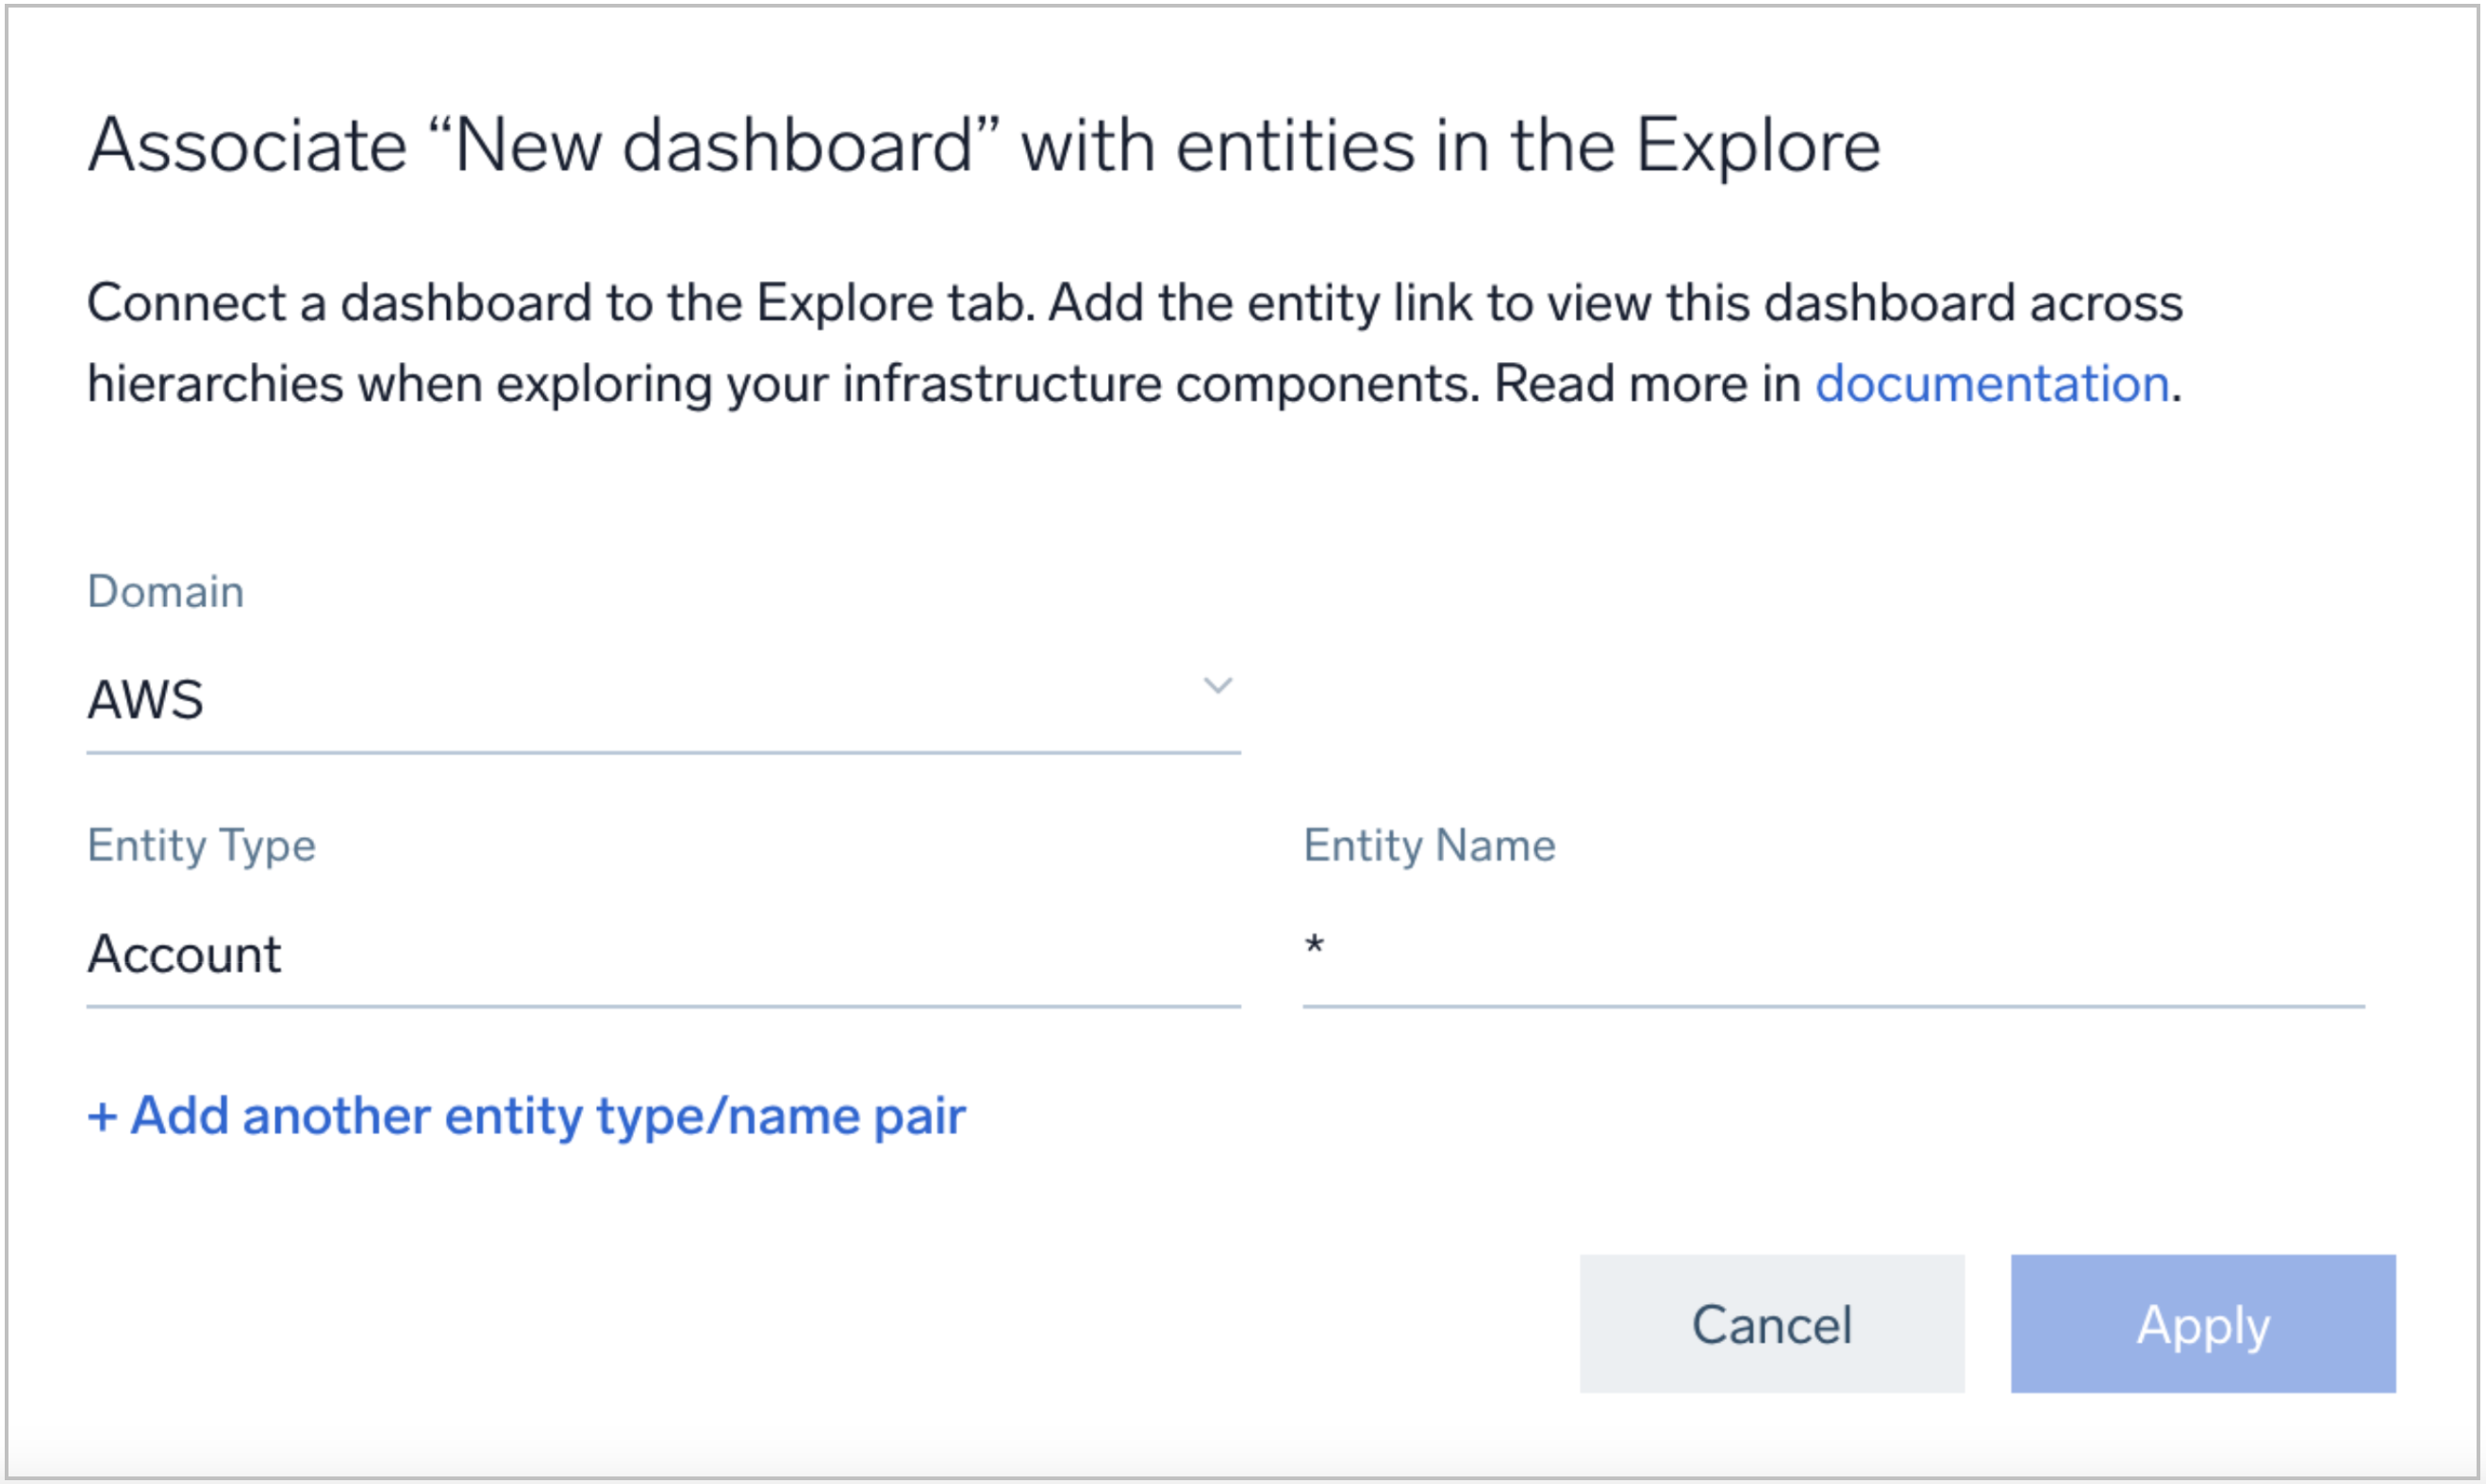
- You can add more entity associations by clicking Add another entity type/name pair.
- Click Apply to apply the stack link.
- Now when you navigate in a monitoring dashboard to an entity with matching entity type and entity name, you will have the option to view your Dashboard in the monitoring dashboards view.
View linked dashboards
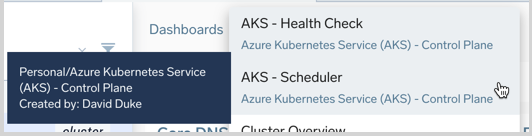
In monitoring dashboards, when navigating to components you will have the option to select other dashboards that are linked.
From the Dashboards dropdown menu, select the name of the linked dashboard to load it in monitoring dashboards. When hovering over available dashboards the tooltip provides the location and creator so it is easier to identify.