Map Charts
Map charts are visual representations that use color coding to display data values across regions and provide insights into data patterns, trends, and distribution of the data globally.
Cluster and Heatmap
Cluster and Heatmap graphically depicts the location and number of hits from data on a map.
To map your data you can:
- Use the geoip or Geo Lookup operators to provide these values from extracted IPv4 and IPv6 addresses.
- Manually provide valid aggregated latitude and longitude values. Ensure the field names are
latitudeandlongitudeso that map chart can recognize them. Format the values with positive or negative values based on being north/south or east/west, instead of using the terms N/S, E/W, such as:30.42and-87.21. - A
_countaggregator is required. - Other aggregators like
sumoravgdo not provide accurate results.
Create a Cluster or Heatmap
To add a panel with a Cluster or Heatmap:
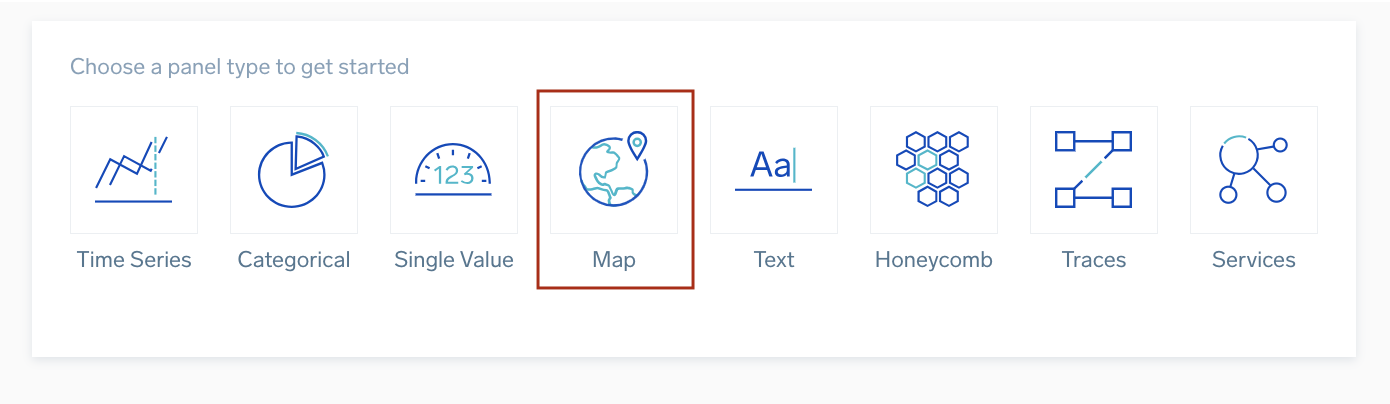
- Create or open a Dashboard and click on Add Panel > Map.
- Provide a Geo Lookup query and press Enter for it to run.

- A map chart is available in two types, Cluster or Heatmap.
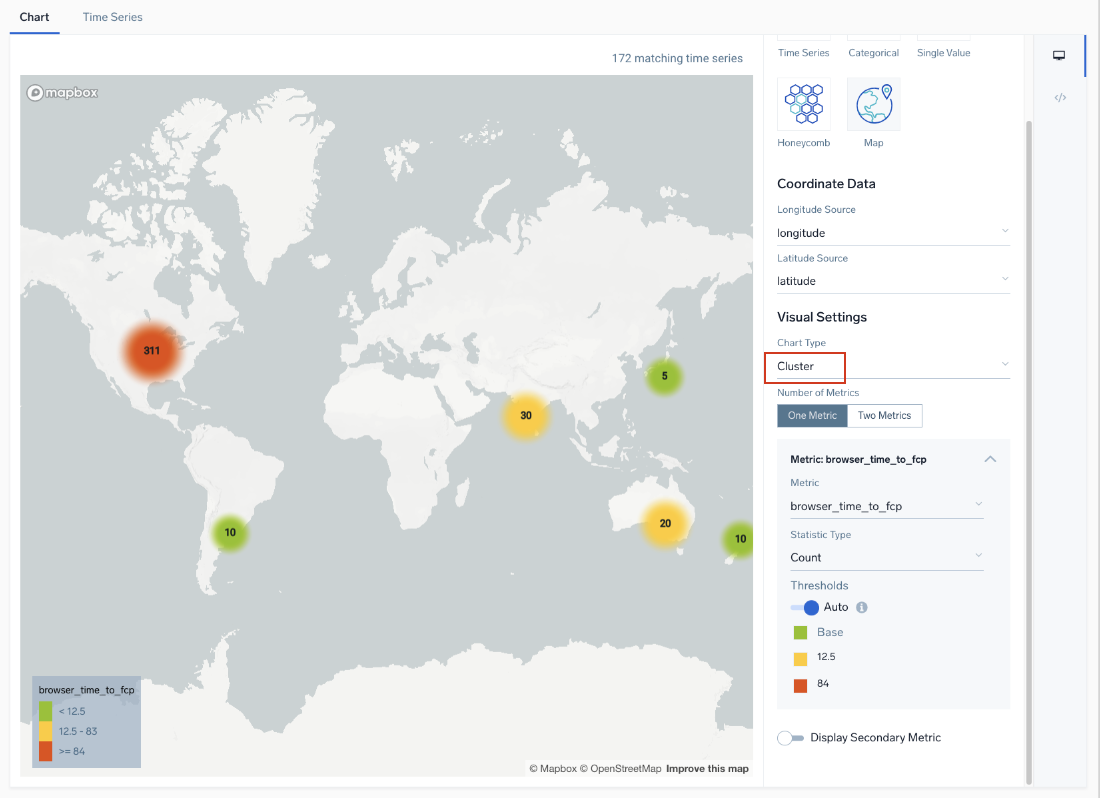
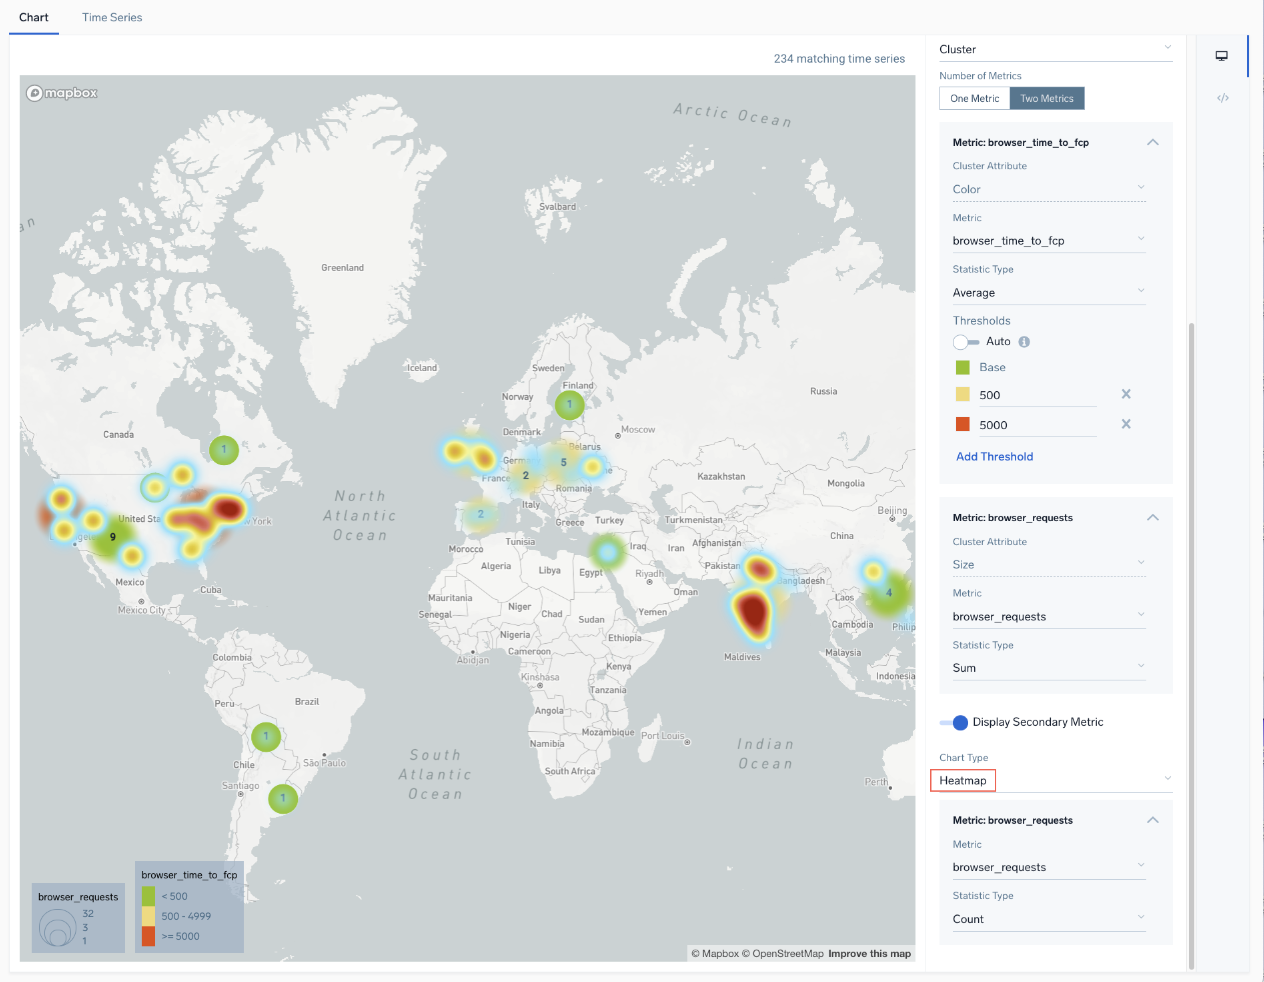
- Modify the chart as desired.
- Click the Add to Dashboard button on the top right of the window to add the panel to your dashboard.
Limitations
- Map charts have a display limit of 10,000 results.
- Colors of map markers cannot be changed.
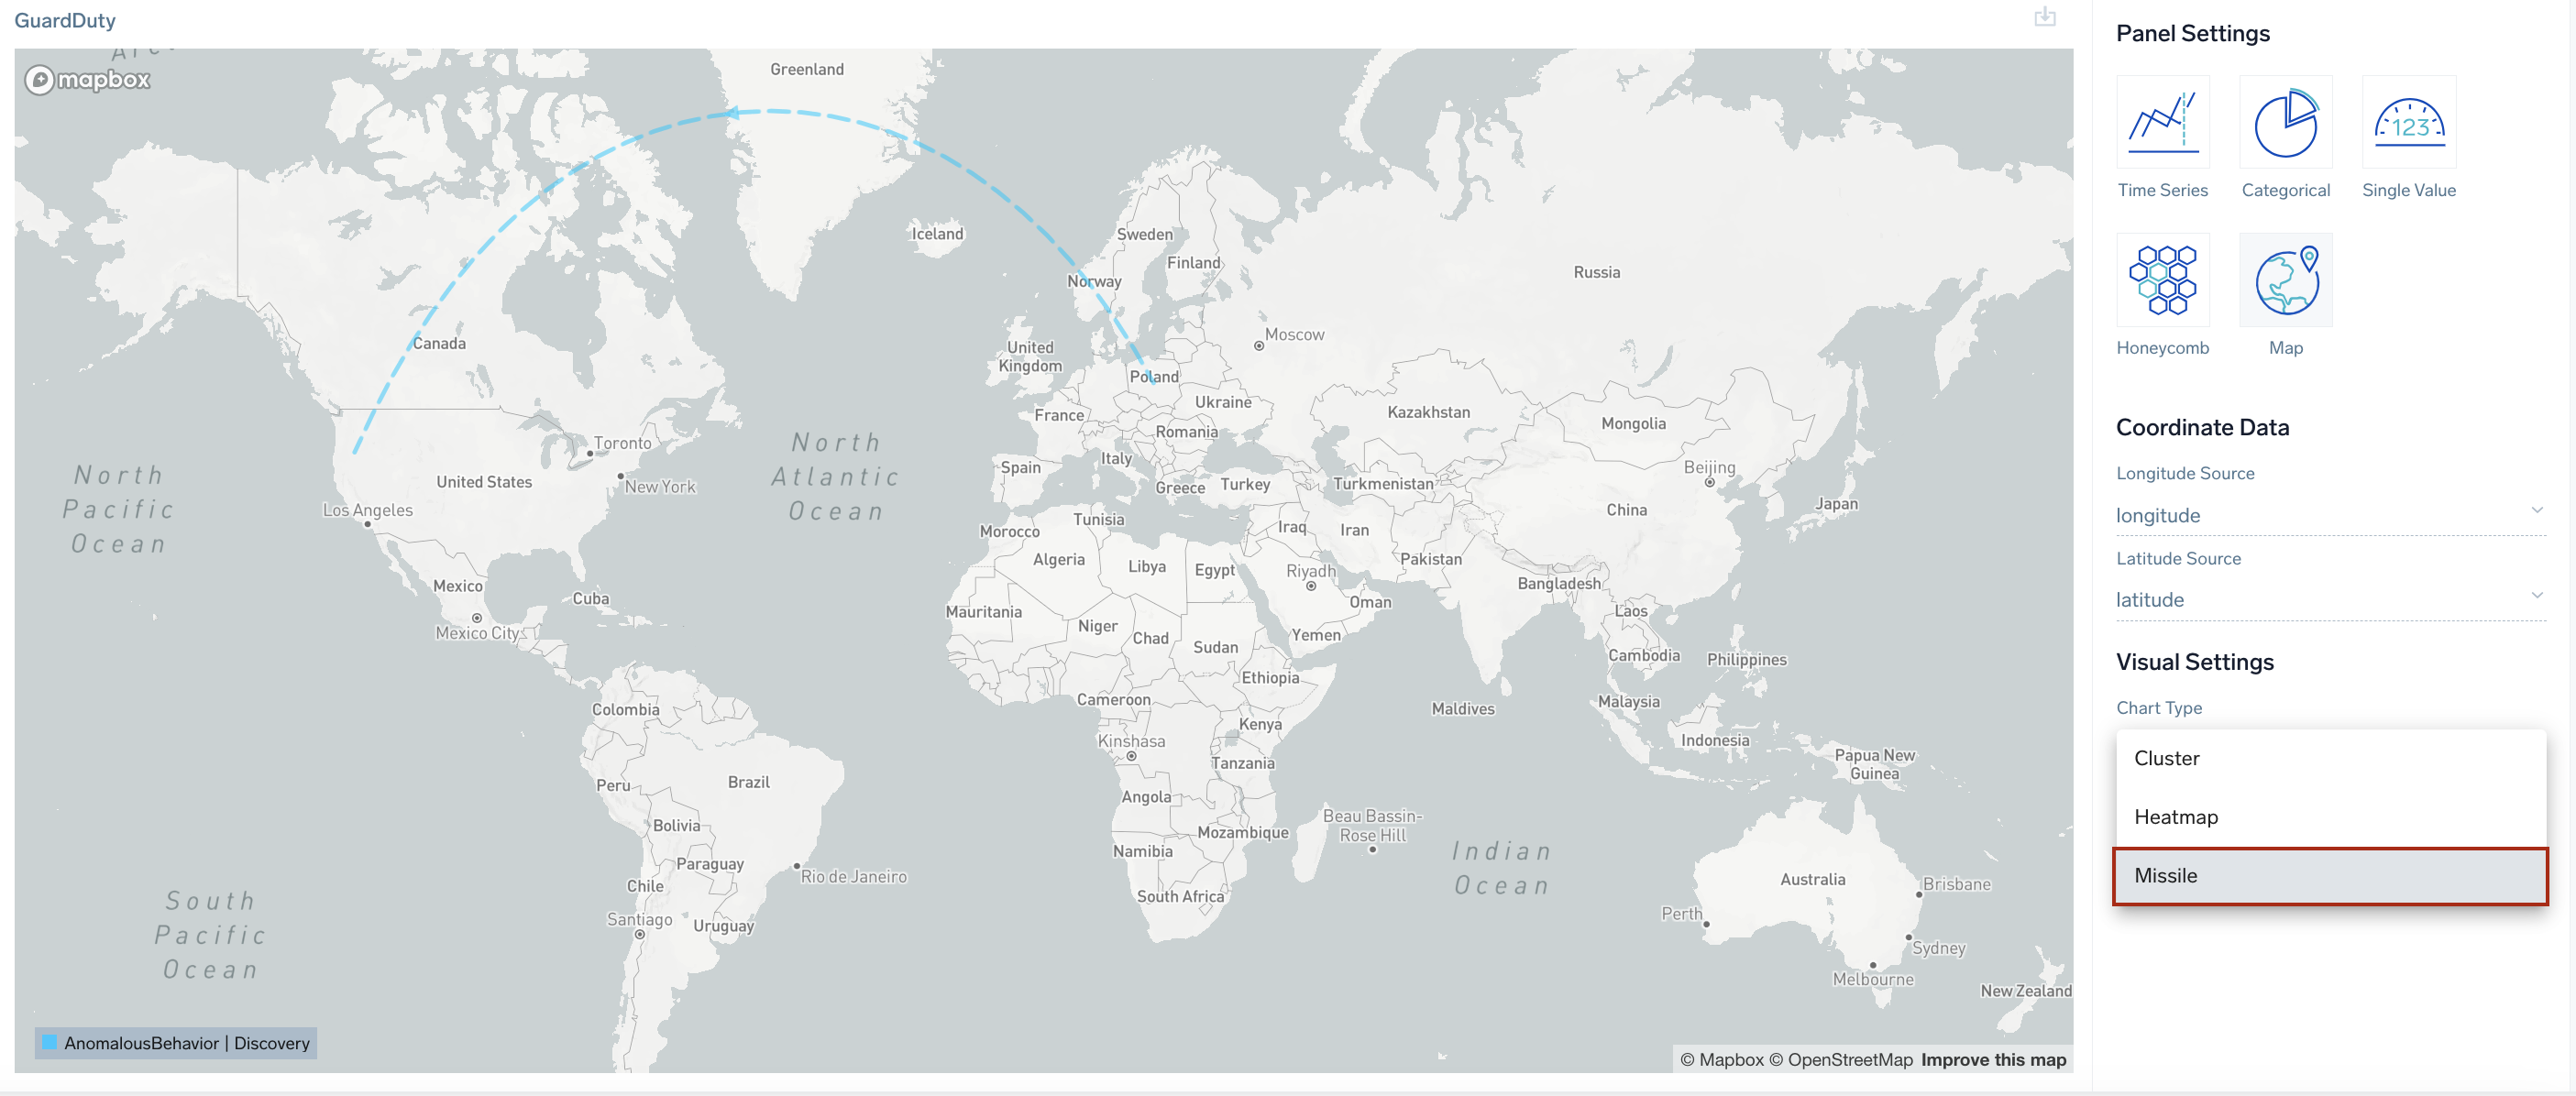
Missile map
Missile map is used to geographically depict any data that has an origin and destination. This map helps you to visualize the relationships between the source and destination by providing insights into the pathways that may follow.
To create Connection map, your query must include:
sourcelat- Source latittudesourcelon- Source longitudedestinationlat- Destination latittudedestinationlon- Destination longitude
Create a Missile map
To add a panel with a missile map:
- Create or open a Dashboard and click on Add Panel > Map.
- Type a supported query in the Search box, including all of the required field names and press Enter for it to run.
- Once the search results appear, select Missile from the Map Type dropdown.
- Modify the chart as desired.