Amazon EC2 Auto Scaling

Amazon EC2 Auto Scaling helps you maintain application availability and lets you automatically add or remove EC2 instances using scaling policies that you define. Dynamic or predictive scaling policies let you add or remove EC2 instance capacity to service established or real-time demand patterns.
The Sumo Logic App for Amazon EC2 Auto Scaling provides comprehensive insights into the performance and health of your EC2 Auto Scaling groups within your AWS environment. This App offers a centralized view to monitor and analyze the scaling activities and behavior of your EC2 instances. Leverage the prebuilt dashboards to gain visibility into key metrics such as instance launches, terminations, scaling events, and overall group health.
Log and metrics types
The Amazon EC2 Auto Scaling app uses the following logs and metrics:
Sample CloudTrail log message
Click to expand
{
    "eventVersion":"1.08",
    "userIdentity":{
        "type":"IAMUser",
        "principalId":"AIDAIHL7V6WZEXAMPLEVU",
        "arn":"arn:aws:iam::123456789981:user/greg",
        "accountId":"123456789981",
        "accessKeyId":"AKIA12345EXAMPLE67890",
        "userName":"greg",
        },
    "eventTime":"2025-03-10T15:05:37Z",
    "eventSource":"autoscaling.amazonaws.com",
    "eventName":"CreateAutoScalingGroup",
    "awsRegion":"us-east-1",
    "sourceIPAddress":"223.233.233.233",
    "userAgent":"Mozilla/5.0 (Macintosh; Intel Mac OS X 10_15_7) AppleWebKit/537.36 (KHTML, like Gecko) Chrome/133.0.0.0 Safari/537.36",
    "requestParameters":{
        "autoScalingGroupName":"catalogService",
        "launchTemplate":{
            "launchTemplateId":"lt-02c96752a8d5a34d9",
            "version":"$Default"
            },
        "minSize":1,
        "maxSize":3,
        "desiredCapacity":2,
        "healthCheckType":"EBS",
        "healthCheckGracePeriod":300,
        "vPCZoneIdentifier":"subnet-010d7504b1d1a23f,subnet-02aff57192da8785",
        "newInstancesProtectedFromScaleIn":false,
        "defaultInstanceWarmup":-1,
        "capacityReservationSpecification":{"capacityReservationPreference":"default"},
        "availabilityZoneDistribution":{"capacityDistributionStrategy":"balanced-best-effort"}
        },
    "responseElements":null,
    "requestID":"61a1e435-d8cc-4a7e-a314-6f96c0f016fe",
    "eventID":"fcb4f52d-bf15-4732-8d0b-25688be73a47",
    "readOnly":false,
    "eventType":"AwsApiCall",
    "managementEvent":true,
    "recipientAccountId":"123456789981",
    "eventCategory":"Management",
    "tlsDetails":{
        "tlsVersion":"TLSv1.3",
        "cipherSuite":"TLS_AES_128_GCM_SHA256",
        "clientProvidedHostHeader":"autoscaling.us-east-1.amazonaws.com"
        },
    "sessionCredentialFromConsole":"true"
}
Sample queries
account="account" region="region" "\"eventsource\":\"autoscaling.amazonaws.com\""
| json "userIdentity", "eventSource", "eventName", "awsRegion", "sourceIPAddress", "userAgent", "eventType", "recipientAccountId", "requestParameters", "responseElements", "requestID", "errorCode", "errorMessage", "apiVersion" as userIdentity, event_source, event_name, region, src_ip, user_agent, event_type, recipient_account_id, requestParameters, responseElements, request_id, error_code, error_message, api_version nodrop
| where event_source = "autoscaling.amazonaws.com"
| where namespace matches "aws/autoscaling" or isEmpty(namespace)
| json field=userIdentity "accountId", "type", "arn", "userName"  as accountid, type, arn, username nodrop
| parse field=arn ":assumed-role/*" as user nodrop
| parse field=arn "arn:aws:iam::*:*" as accountid, user nodrop
| json field=requestParameters "autoScalingGroupName" as asgname nodrop
| if (isBlank(accountid), recipient_account_id, accountid) as accountid
| where (tolowercase(asgname) matches tolowercase("{{autoscalinggroup}}")) or isBlank(asgname)
| if (isEmpty(error_code), "Success", "Failure") as event_status
| if (isEmpty(username), user, username) as user
| count by event_status
| sort by _count, event_status asc
account=account region=region autoscalinggroupname=cartService namespace=aws/autoscaling metric=GroupDesiredCapacity Statistic=average
| avg by account, region, autoscalinggroupname
Collecting logs and metrics for the Amazon EC2 Auto Scaling
When you create an AWS Source, you'll need to identify the Hosted Collector you want to use or create a new Hosted Collector. Once you create an AWS Source, associate it with a Hosted Collector. For instructions, see Configure a Hosted Collector and Source.
Collecting Cloudtrail logs
- Configure a Amazon EC2 Auto Scaling Cloudtrail Logs Source.
- Metadata. Click the +Add Field link to add custom log metadata Fields. Define the fields you want to associate. Each field needs a name (key) and a value.
- Add an account field and assign it a value that is a friendly name/alias to your AWS account from which you are collecting logs. Logs can be queried via the “account field”.
- Keep in mind:
 A green circle with a check mark is shown when the field exists and is enabled in the Fields table schema.
 An orange triangle with an exclamation point is shown when the field doesn't exist, or is disabled in the Fields table schema. In this case, you'll see an option to automatically add or enable the nonexistent fields to the Fields table schema. If a field is sent to Sumo Logic but isn’t present or enabled in the schema, it’s ignored and marked as Dropped.
Collecting metrics
- Sumo Logic supports collecting metrics using two source types:
- Configure an AWS Kinesis Firehose for Metrics Source (recommended); or
- Configure an Amazon CloudWatch Source for Metrics
- Metadata. Click the +Add Field link to add custom log metadata fields. Define the fields you want to associate. Each field needs a name (key) and a value.
- Add an account field and assign it a value that is a friendly name/alias to your AWS account from which you are collecting logs. Logs can be queried via the “account field”.

- Keep in mind:
 A green circle with a check mark is shown when the field exists and is enabled in the Fields table schema.
 An orange triangle with an exclamation point is shown when the field doesn't exist, or is disabled in the Fields table schema. In this case, you'll see an option to automatically add or enable the nonexistent fields to the Fields table schema. If a field is sent to Sumo Logic but isn’t present or enabled in the schema, it’s ignored and marked as Dropped.
- Add an account field and assign it a value that is a friendly name/alias to your AWS account from which you are collecting logs. Logs can be queried via the “account field”.
The namespace for Amazon EC2 Auto Scaling Service is AWS/AutoScaling.
Configure field in field schema
- New UI. In the main Sumo Logic menu, select Data Management, and then under Logs select Fields. You can also click the Go To... menu at the top of the screen and select Fields.
Classic UI. In the main Sumo Logic menu, select Manage Data > Logs > Fields. - Search for the
autoscalinggroupfield. - If not present, create it. Learn how to create and manage fields here.
Configure Field Extraction Rule(s)
Create a Field Extraction Rule (FER) for Amazon EC2 Auto Scaling access logs and CloudTrail logs. Learn how to create a Field Extraction Rule here.
Amazon EC2 Auto Scaling CloudTrail logs
Rule Name: AwsObservabilityEC2ASGCloudTrailLogsFER
Applied at: Ingest Time
Scope (Specific Data): account=* eventSource eventName
json "eventSource", "awsRegion", "requestParameters", "recipientAccountId" as eventSource, region, requestParameters, accountid nodrop
| json field=requestParameters "autoScalingGroupName" as autoscalinggroup nodrop
| where eventSource = "autoscaling.amazonaws.com"
| "aws/autoscaling" as namespace
| tolowercase(autoscalinggroup) as autoscalinggroup
| fields region, namespace, autoscalinggroup, accountid
Installing the Amazon EC2 Auto Scaling app
Now that you have set up collection for Amazon EC2 Auto Scaling, install the Sumo Logic App to use the pre-configured searches and dashboards that provide visibility into your environment for real-time analysis of overall usage.
To install the app:
- Select App Catalog.
- In the Search Apps field, search for and then select your app.
- Optionally, you can scroll down to preview the dashboards included with the app. Then, click Install App (sometimes this button says Add Integration).
- Click Next.
- Look for the dialog confirming that your app was installed successfully.

Once an app is installed, it will appear in your Personal folder or the folder that you specified. From here, you can share it with other users in your organization. Dashboard panels will automatically start to fill with data matching the time range query received since you created the panel. Results won't be available immediately, but within about 20 minutes, you'll see completed graphs and maps.
As part of the app installation process, the following fields will be created by default:
account: The friendly name or alias assigned to the AWS account.region: The geographical region where the AWS resource is located (for example, us-east-1 or eu-west-2).accountid: The unique 12-digit identifier for the AWS account where the resource is present.namespace: The AWS service namespace that the resource or metric belongs to (for example, AWS/EC2 or AWS/AutoScaling).autoscalinggroup: A specific identifier for the Auto Scaling Group within AWS EC2 Auto Scaling.
Viewing Amazon EC2 Auto Scaling dashboards
Overview
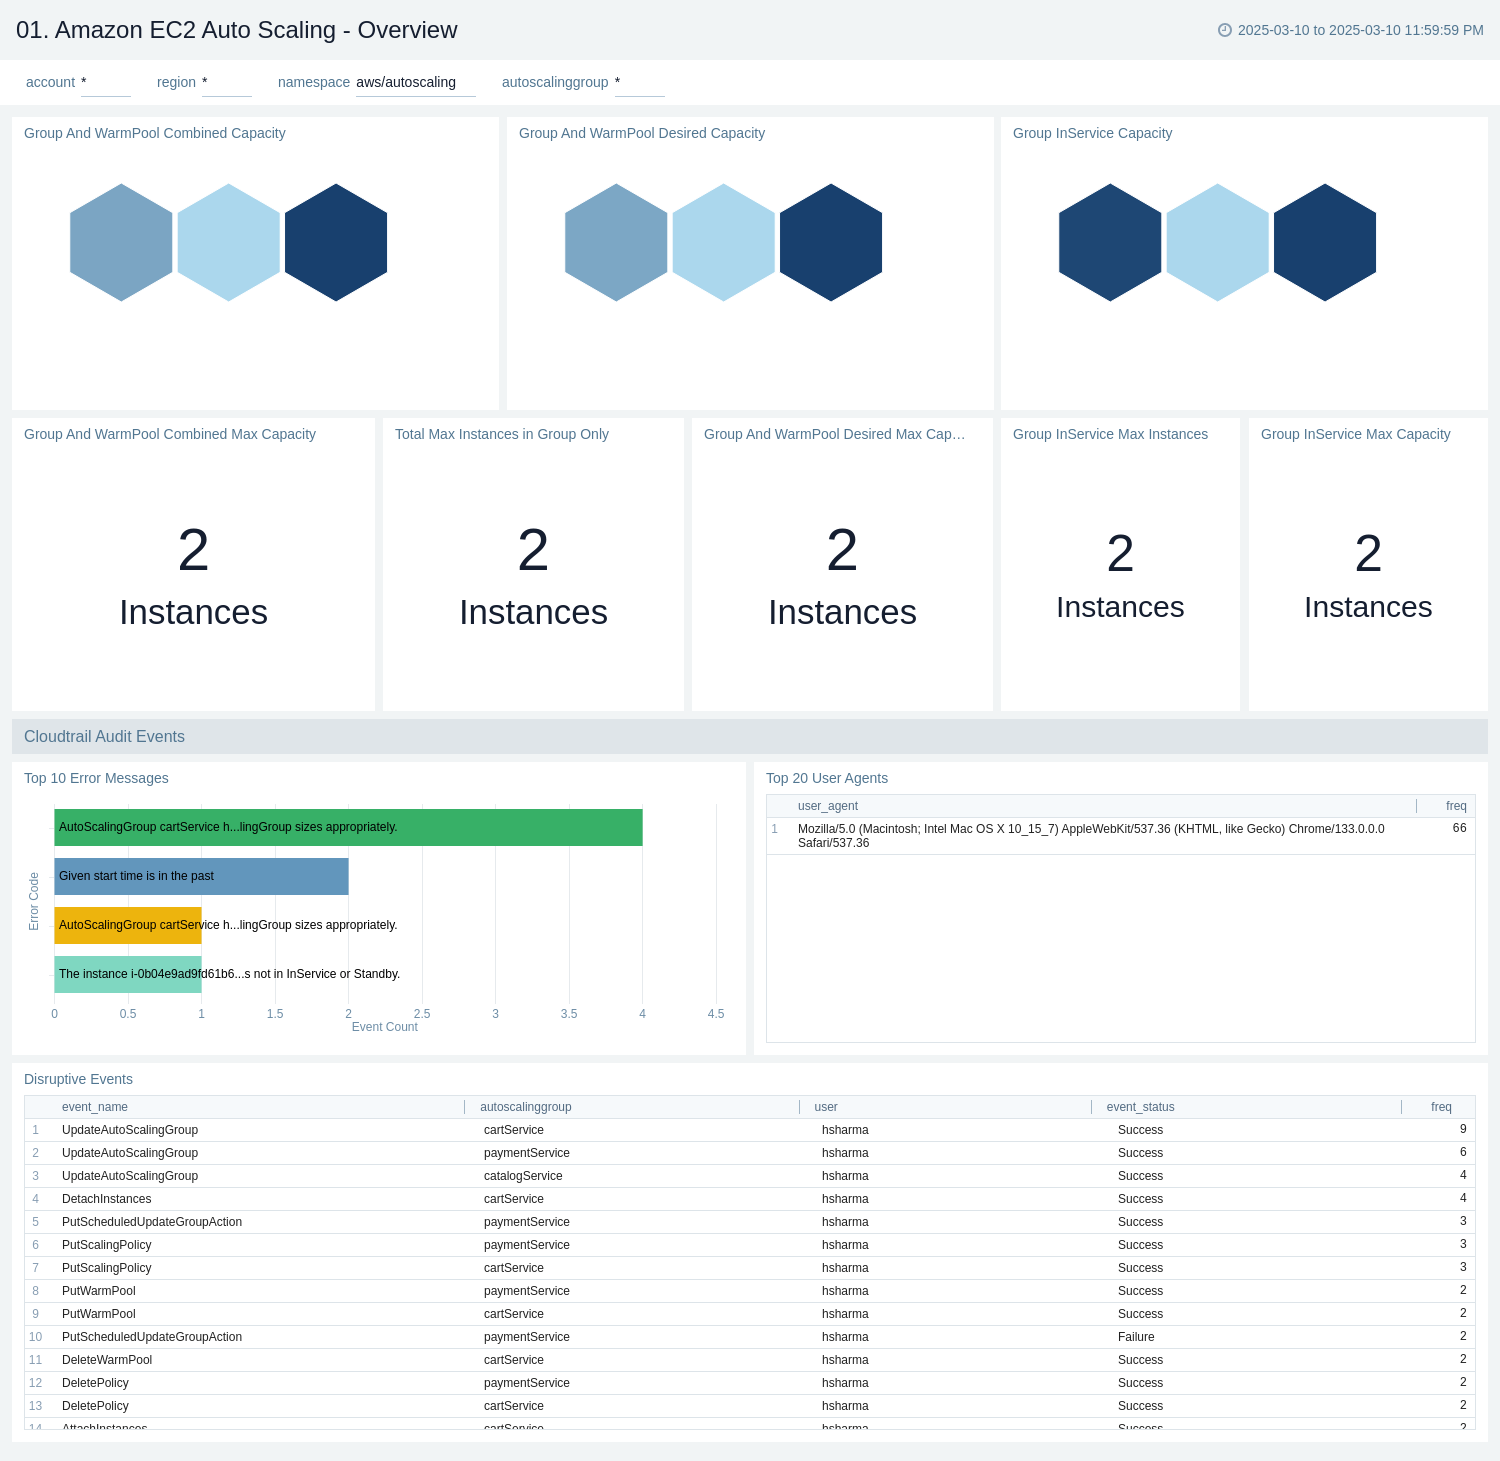
The Amazon EC2 Autoscaling - Overview dashboard provides an overview of Amazon EC2 Autoscaling operations, offering insights into instance capacity, error messages, user agents, and disruptive events. It allows users to monitor and analyze the performance and behavior of their autoscaling groups in real-time.
Use this dashboard for:
- Monitoring the current capacity of EC2 instances, including group and warm pool instances.
- Tracking the desired capacity of autoscaling groups.
- Identifying and troubleshooting common error messages related to autoscaling operations.
- Monitoring disruptive events such as group updates, instance detachments, and policy changes.
CloudTrail Audit
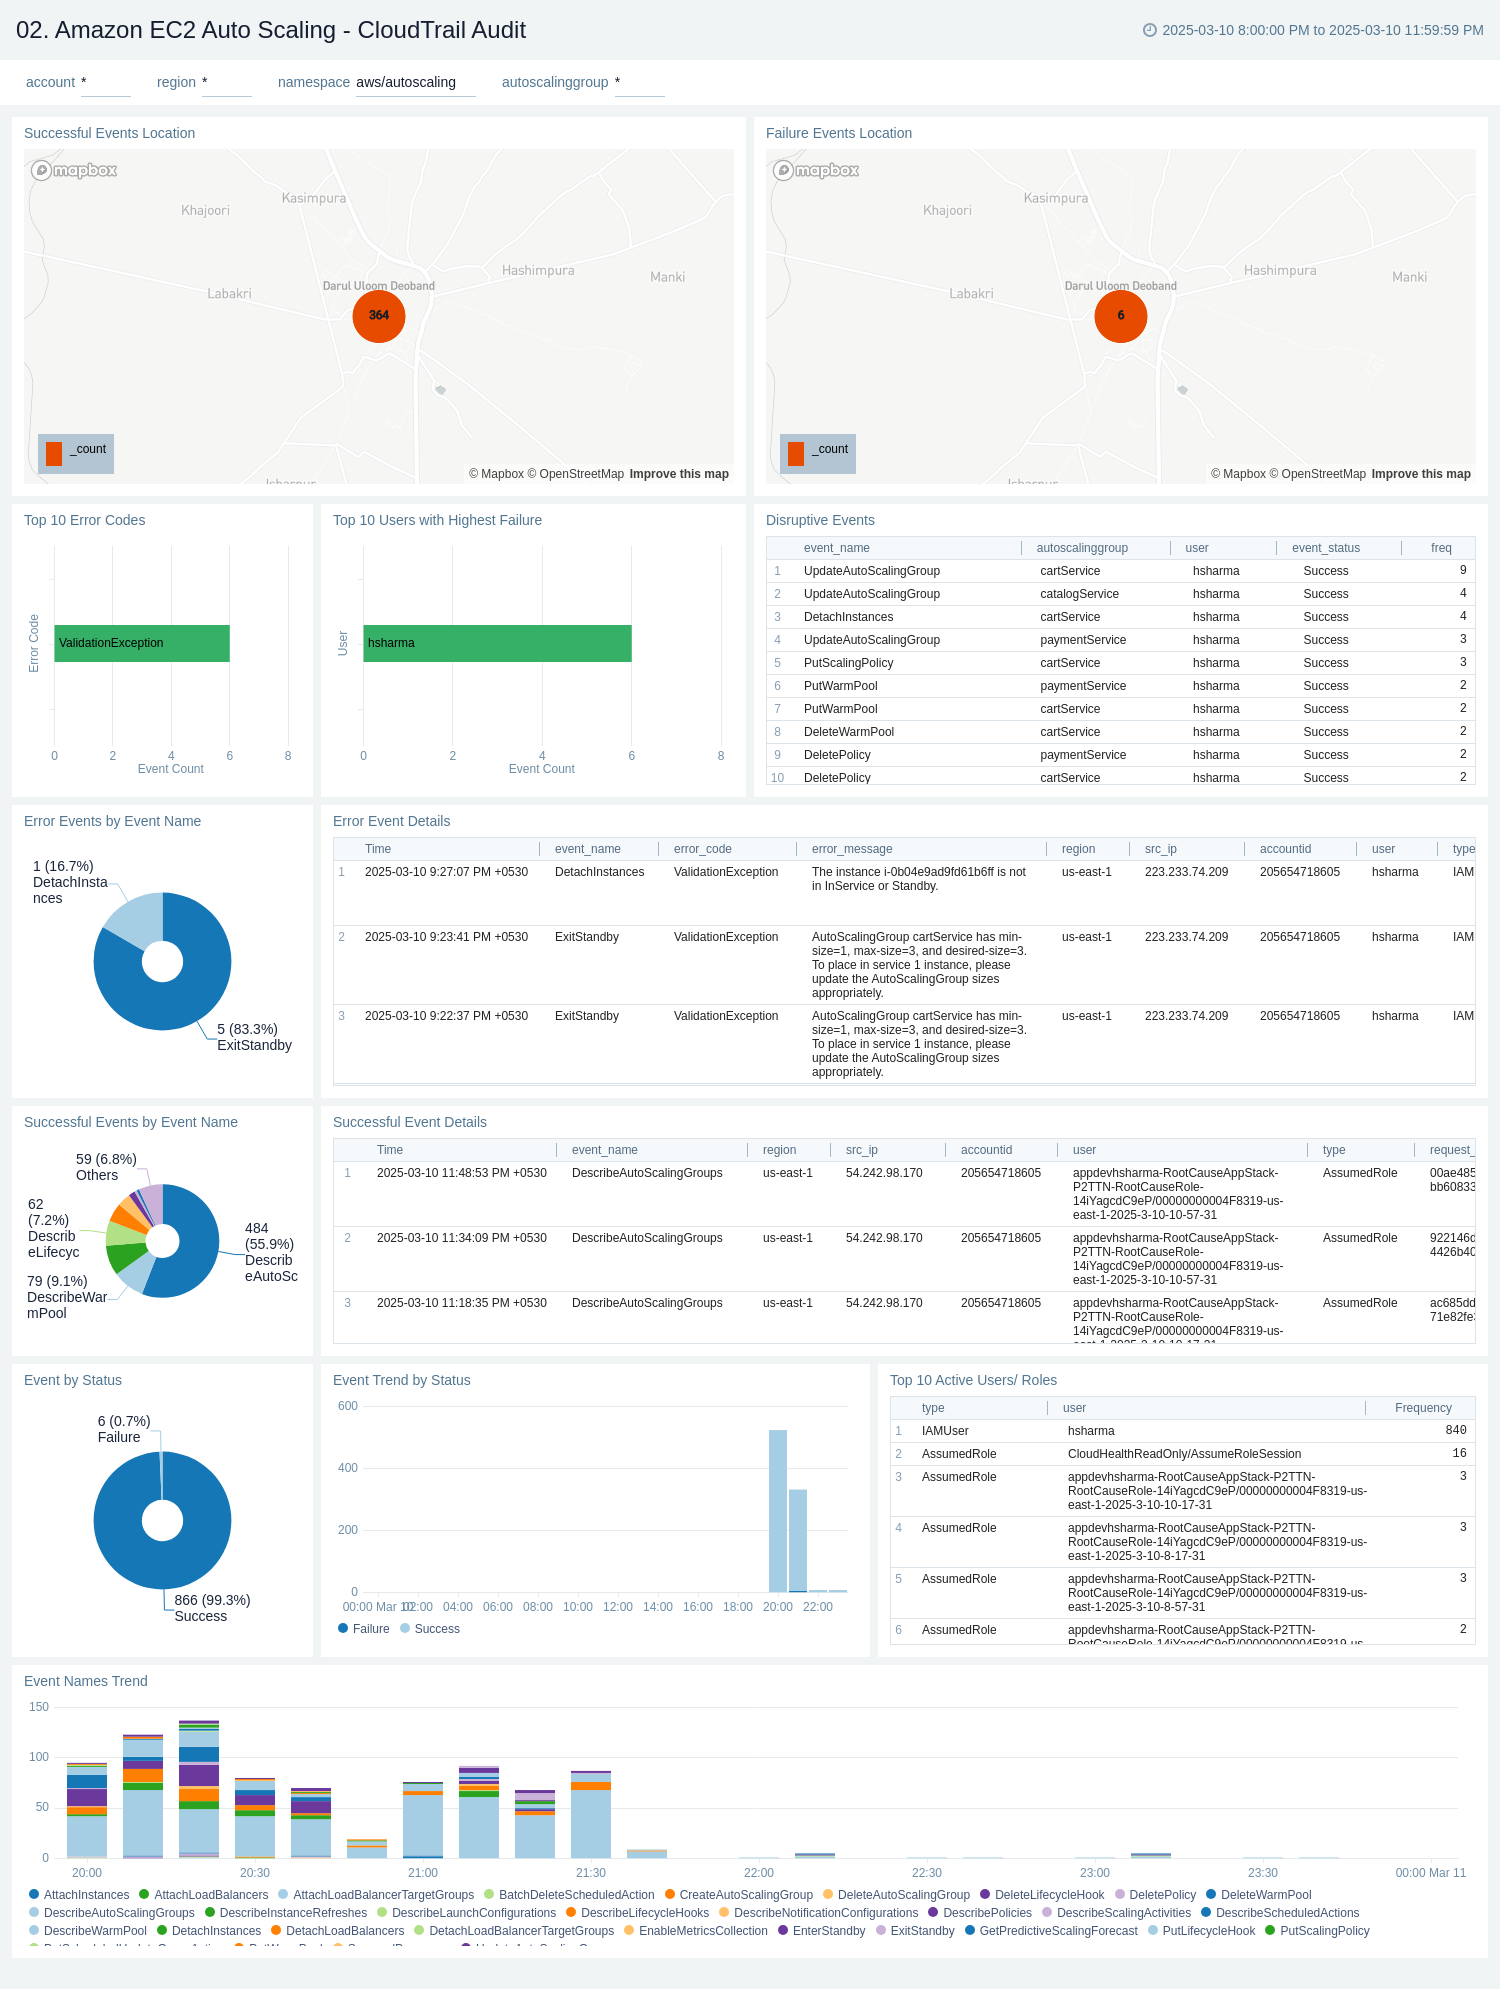
The Amazon EC2 Auto Scaling - CloudTrail Audit dashboard provides a comprehensive overview of Amazon EC2 Auto Scaling activities and CloudTrail audit logs. The dashboard displays information on event locations, top error codes, users with the highest failure rates, disruptive events, error details, successful events, event status, and active users/roles.
Use this dashboard for:
- Monitoring the overall health and performance of your Amazon EC2 Auto Scaling groups.
- Identifying and troubleshooting common errors and failures in auto scaling operations.
- Tracking user activities and potential security concerns related to auto scaling events.
- Analyzing trends in event types, success rates, and failure patterns over time.
Instances
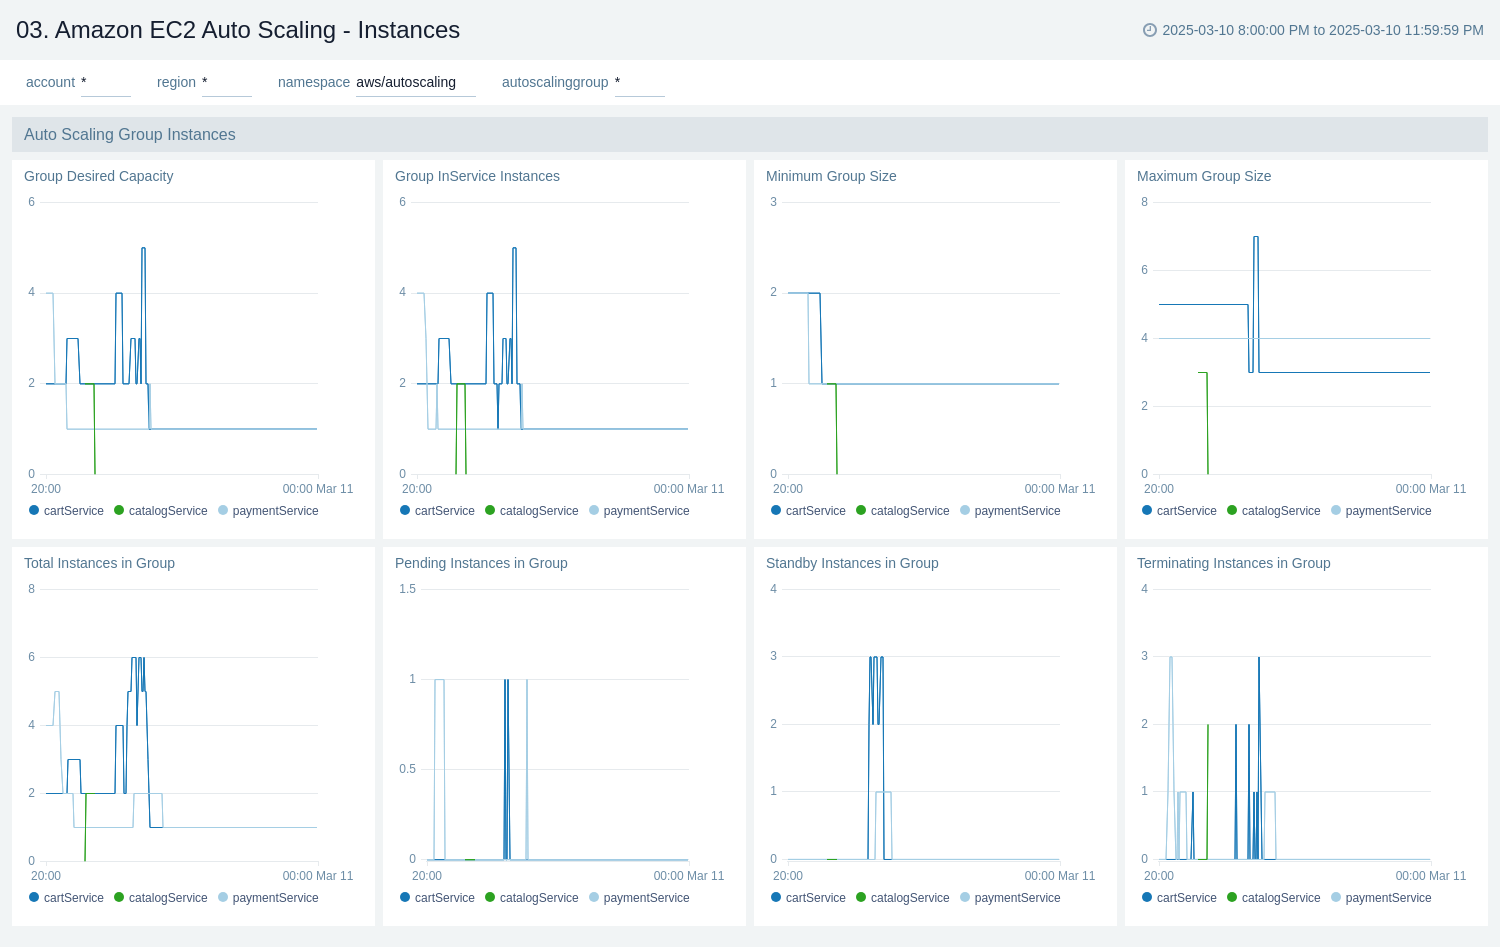
The Amazon EC2 Auto Scaling - Instances dashboard provides a detailed overview of Amazon EC2 Auto Scaling instance metrics, allowing users to monitor and analyze the behavior of their auto scaling groups across different autoscaling groups. It offers real-time insights into instance capacities, states, and group configurations.
Use this dashboard for:
- Tracking the desired capacity and actual in-service instances for each auto scaling group.
- Monitoring the minimum and maximum group size limits to ensure proper scaling boundaries.
- Observing the total number of instances in each group, including their various states (pending, standby, and terminating).
- Comparing instance metrics across different auto scaling groups.
Capacity
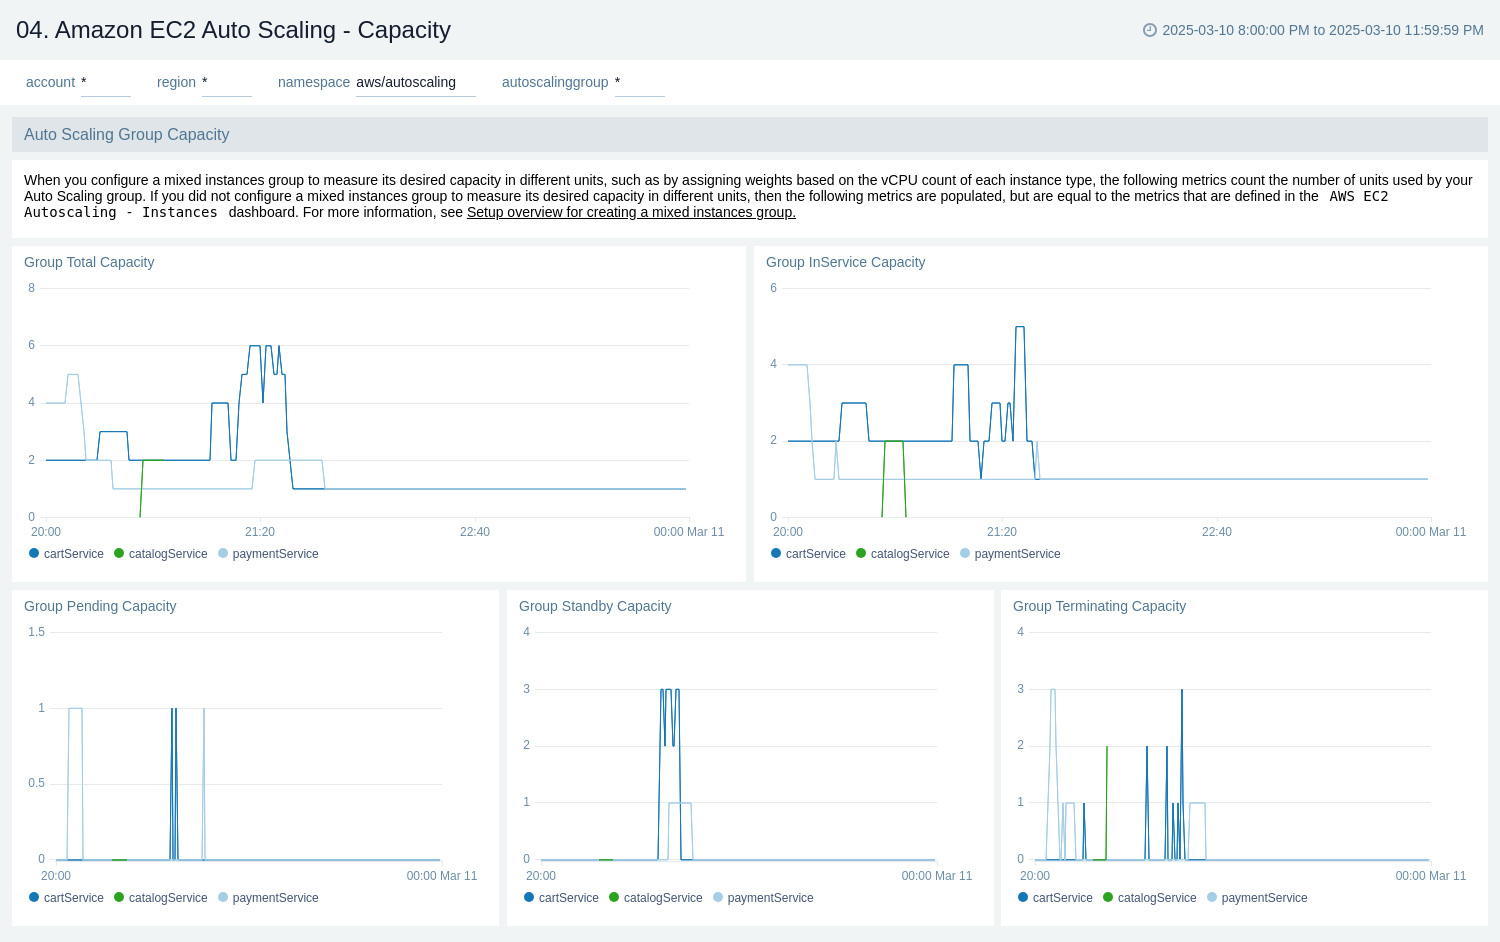
The Amazon EC2 Auto Scaling - Capacity dashboard provides a comprehensive view of Amazon EC2 Auto Scaling group capacity metrics, offering insights into the total, in-service, pending, standby, and terminating capacities for different autoscaling groups. It allows users to monitor and analyze the capacity fluctuations and states of their auto scaling groups over time.
Use this dashboard for:
- Tracking the total capacity of auto scaling groups across different auto scaling groups.
- Monitoring the in-service capacity to ensure adequate resources are available to handle current workloads.
- Analyzing standby capacity to understand the reserve resources available for quick scaling.
- Tracking terminating capacity to monitor the scale-in process and resource optimization.
- Detecting potential issues in the scaling process, such as instances stuck in pending or terminating states.
Warm Pool
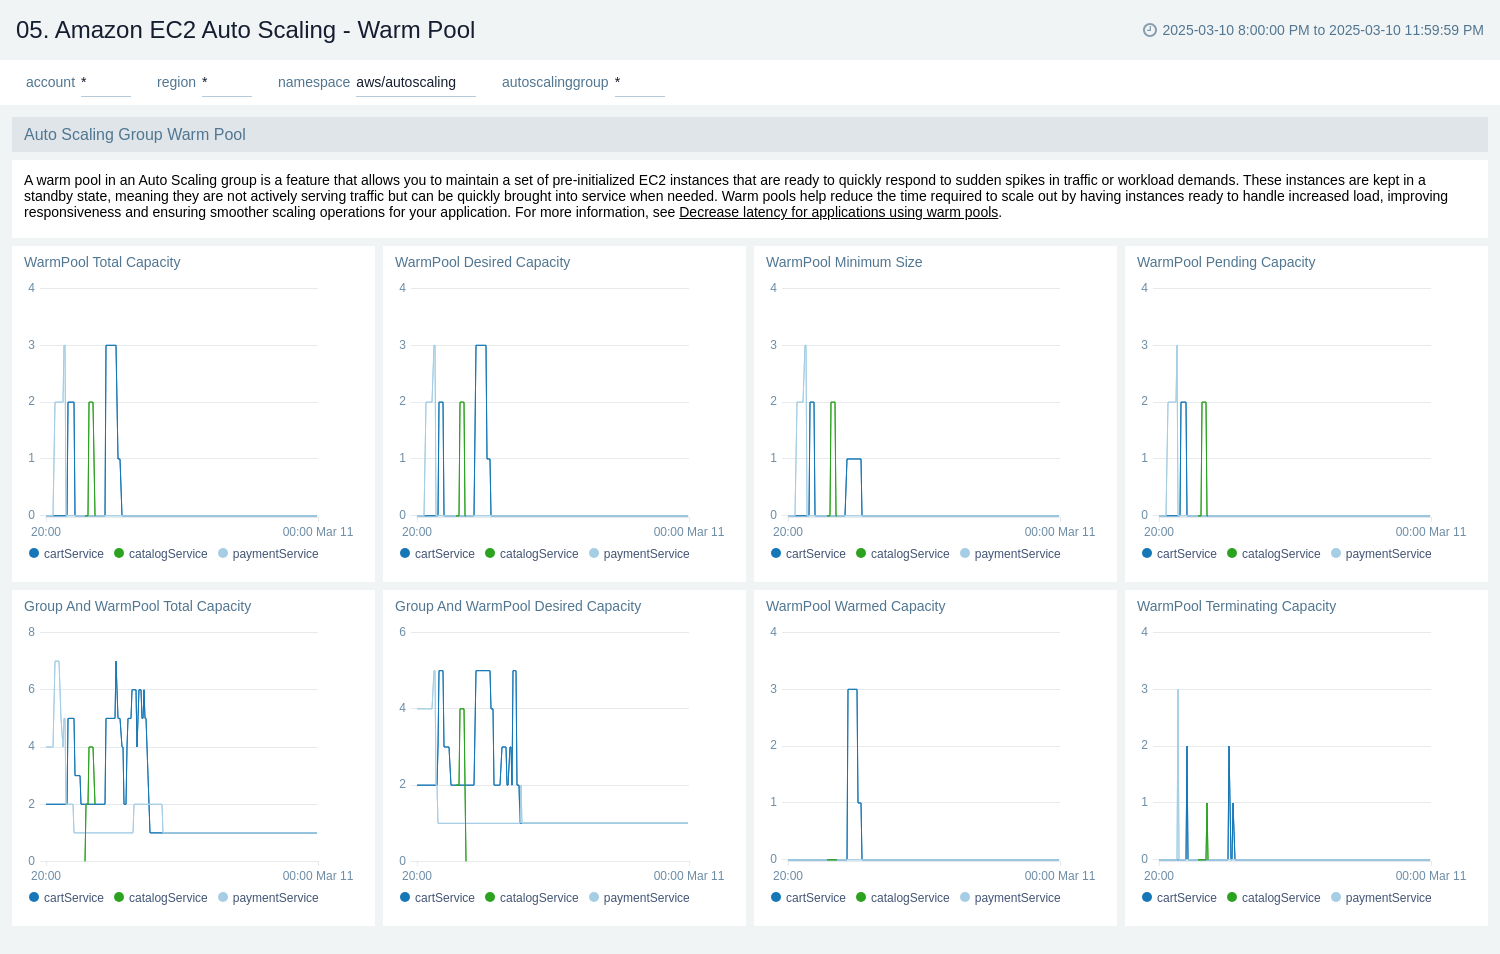
The Amazon EC2 Auto Scaling - Warm Pool dashboard provides a detailed view of Amazon EC2 Auto Scaling Warm Pool metrics, offering insights into the capacity and state of pre-initialized instances ready to quickly respond to sudden traffic spikes or workload demands. It allows users to monitor and analyze the warm pool behavior across different autoscaling groups.
Use this dashboard for:
- Tracking the total and desired capacity of warm pools for each autoscaling group.
- Monitoring the minimum size of warm pools to ensure adequate reserve capacity.
- Observing pending capacity in warm pools to identify potential delays in instance preparation.
- Monitoring the terminating capacity in warm pools to understand the instance lifecycle.
- Optimizing warm pool size and capacity to improve application responsiveness during sudden load increases.
Create monitors for Amazon EC2 Auto Scaling app
From your App Catalog:
- From the Sumo Logic navigation, select App Catalog.
- In the Search Apps field, search for and then select your app.
- Make sure the app is installed.
- Navigate to What's Included tab and scroll down to the Monitors section.
- Click Create next to the pre-configured monitors. In the create monitors window, adjust the trigger conditions and notifications settings based on your requirements.
- Scroll down to Monitor Details.
- Under Location click on New Folder.
note
By default, monitor will be saved in the root folder. So to make the maintenance easier, create a new folder in the location of your choice.
- Enter Folder Name. Folder Description is optional.
tip
Using app version in the folder name will be helpful to determine the versioning for future updates.
- Click Create. Once the folder is created, click on Save.
Amazon EC2 Auto Scaling alerts
| Name | Description | Alert Condition | Recover Condition |
|---|---|---|---|
Amazon EC2 Auto Scaling - In-Service Capacity Below Desired | This alert is triggered when the number of healthy, active instances falls below the desired capacity, indicating that your application may lack the capacity to handle its current load. | Count > 0 | Count < = 0 |
Amazon EC2 Auto Scaling - Instance To Max Capacity Ratio | This alert is triggered when the total number of instances approaches the configured maximum size, warning of an inability to scale out further. | Count > 0.9 | Count < = 0.9 |
Amazon EC2 Auto Scaling - Instances in Pending State | This alert is triggered when instances remain in a 'Pending' state for a prolonged period, indicating potential issues with instance launch or configuration. | Count > 0 | Count < = 0 |
Amazon EC2 Auto Scaling - Instances in Terminating State | This alert is triggered when instances remain in a 'Terminating' state for a prolonged period, often indicating issues with lifecycle hooks. | Count > 0 | Count < = 0 |
Upgrade/Downgrade the Amazon EC2 Auto Scaling app (Optional)
To update the app, do the following:
Next-Gen App: To install or update the app, you must be an account administrator or a user with Manage Apps, Manage Monitors, Manage Fields, Manage Metric Rules, and Manage Collectors capabilities depending upon the different content types part of the app.
- Select App Catalog.
- In the Search Apps field, search for and then select your app.
Optionally, you can identify apps that can be upgraded in the Upgrade available section. - To upgrade the app, select Upgrade from the Manage dropdown.
- If the upgrade does not have any configuration or property changes, you will be redirected to the Preview & Done section.
- If the upgrade has any configuration or property changes, you will be redirected to the Setup Data page.
- In the Configure section of your respective app, complete the following fields.
- Field Name. If you already have collectors and sources set up, select the configured metadata field name (eg _sourcecategory) or specify other custom metadata (eg: _collector) along with its metadata Field Value.
- Click Next. You will be redirected to the Preview & Done section.
Post-update
Your upgraded app will be installed in the Installed Apps folder and dashboard panels will start to fill automatically.
See our Release Notes changelog for new updates in the app.
To revert the app to a previous version, do the following:
- Select App Catalog.
- In the Search Apps field, search for and then select your app.
- To version down the app, select Revert to < previous version of your app > from the Manage dropdown.
Uninstalling the Amazon EC2 Auto Scaling app (Optional)
To uninstall the app, do the following:
- Select App Catalog.
- In the 🔎 Search Apps field, run a search for your desired app, then select it.
- Click Uninstall.