Amazon Elastic Block Store (Amazon EBS)
Amazon Elastic Block Store (Amazon EBS) provides block level storage volumes for use with EC2 instances. EBS volumes behave like raw, unformatted block devices. You can mount these volumes as devices on your instances. EBS volumes that are attached to an instance are exposed as storage volumes that persist independently from the life of the instance. You can create a file system on top of these volumes, or use them in any way you would use a block device (such as a hard drive). You can dynamically change the configuration of a volume attached to an instance.
Amazon EBS is recommended for data that must be quickly accessible and requires long-term persistence. EBS volumes are particularly well-suited for use as the primary storage for file systems, databases, or for any applications that require fine granular updates and access to raw, unformatted, block-level storage. Amazon EBS is well suited to both database-style applications that rely on random reads and writes, and to throughput-intensive applications that perform long, continuous reads and writes. For more details, refer to the AWS documentation.
Metric type
For CloudTrail log, Amazon EBS and Amazon EC2 are tightly integrated services. Most EBS-related events are captured and reflected as part of EC2 events, since EBS volumes are typically attached to EC2 instances for storage and compute operations. See the Amazon EC2 app for EBS related captured events.
Setup
You can collect the metrics for Sumo Logic's Amazon Elastic Block Store (Amazon EBS) integration by following the below steps.
Collect CloudWatch Metrics
Sumo Logic supports collecting metrics using two source types:
-
Configure an AWS Kinesis Firehose for Metrics Source (recommended); or
-
Configure an Amazon CloudWatch Source for Metrics
-
The namespace for Amazon Elastic Block Store Service is AWS/EBS.
- Metadata. Add an account field to the source and assign it a value that is a friendly name/alias to your AWS account from which you are collecting metrics. Metrics can be queried via the “account field”.
Installing the Elastic Block Store app
Now that you have set up a collection for Amazon Elastic Block Store, install the Sumo Logic app to use the pre-configured dashboards that provide visibility into your environment for real-time analysis of overall usage.
To install the app, do the following:
Next-Gen App: To install or update the app, you must be an account administrator or a user with Manage Apps, Manage Monitors, Manage Fields, Manage Metric Rules, and Manage Collectors capabilities depending upon the different content types part of the app.
- Select App Catalog.
- In the 🔎 Search Apps field, run a search for your desired app, then select it.
- Click Install App.
note
Sometimes this button says Add Integration.
- Click Next in the Setup Data section.
- In the Configure section of your respective app, complete the following fields.
- Field Name. If you already have collectors and sources set up, select the configured metadata field name (eg _sourcecategory) or specify other custom metadata (eg: _collector) along with its metadata Field Value.
- Click Next. You will be redirected to the Preview & Done section.
Post-installation
Once your app is installed, it will appear in your Installed Apps folder, and dashboard panels will start to fill automatically.
Each panel slowly fills with data matching the time range query received since the panel was created. Results will not immediately be available but will be updated with full graphs and charts over time.
Viewing the Elastic Block Store dashboards
We highly recommend you view these dashboards in the AWS Observability view of the AWS Observability solution.
Most Amazon EBS metrics shown on the dashboard depend on the volume type and usage conditions. For more details, refer to CloudWatch Metrics.
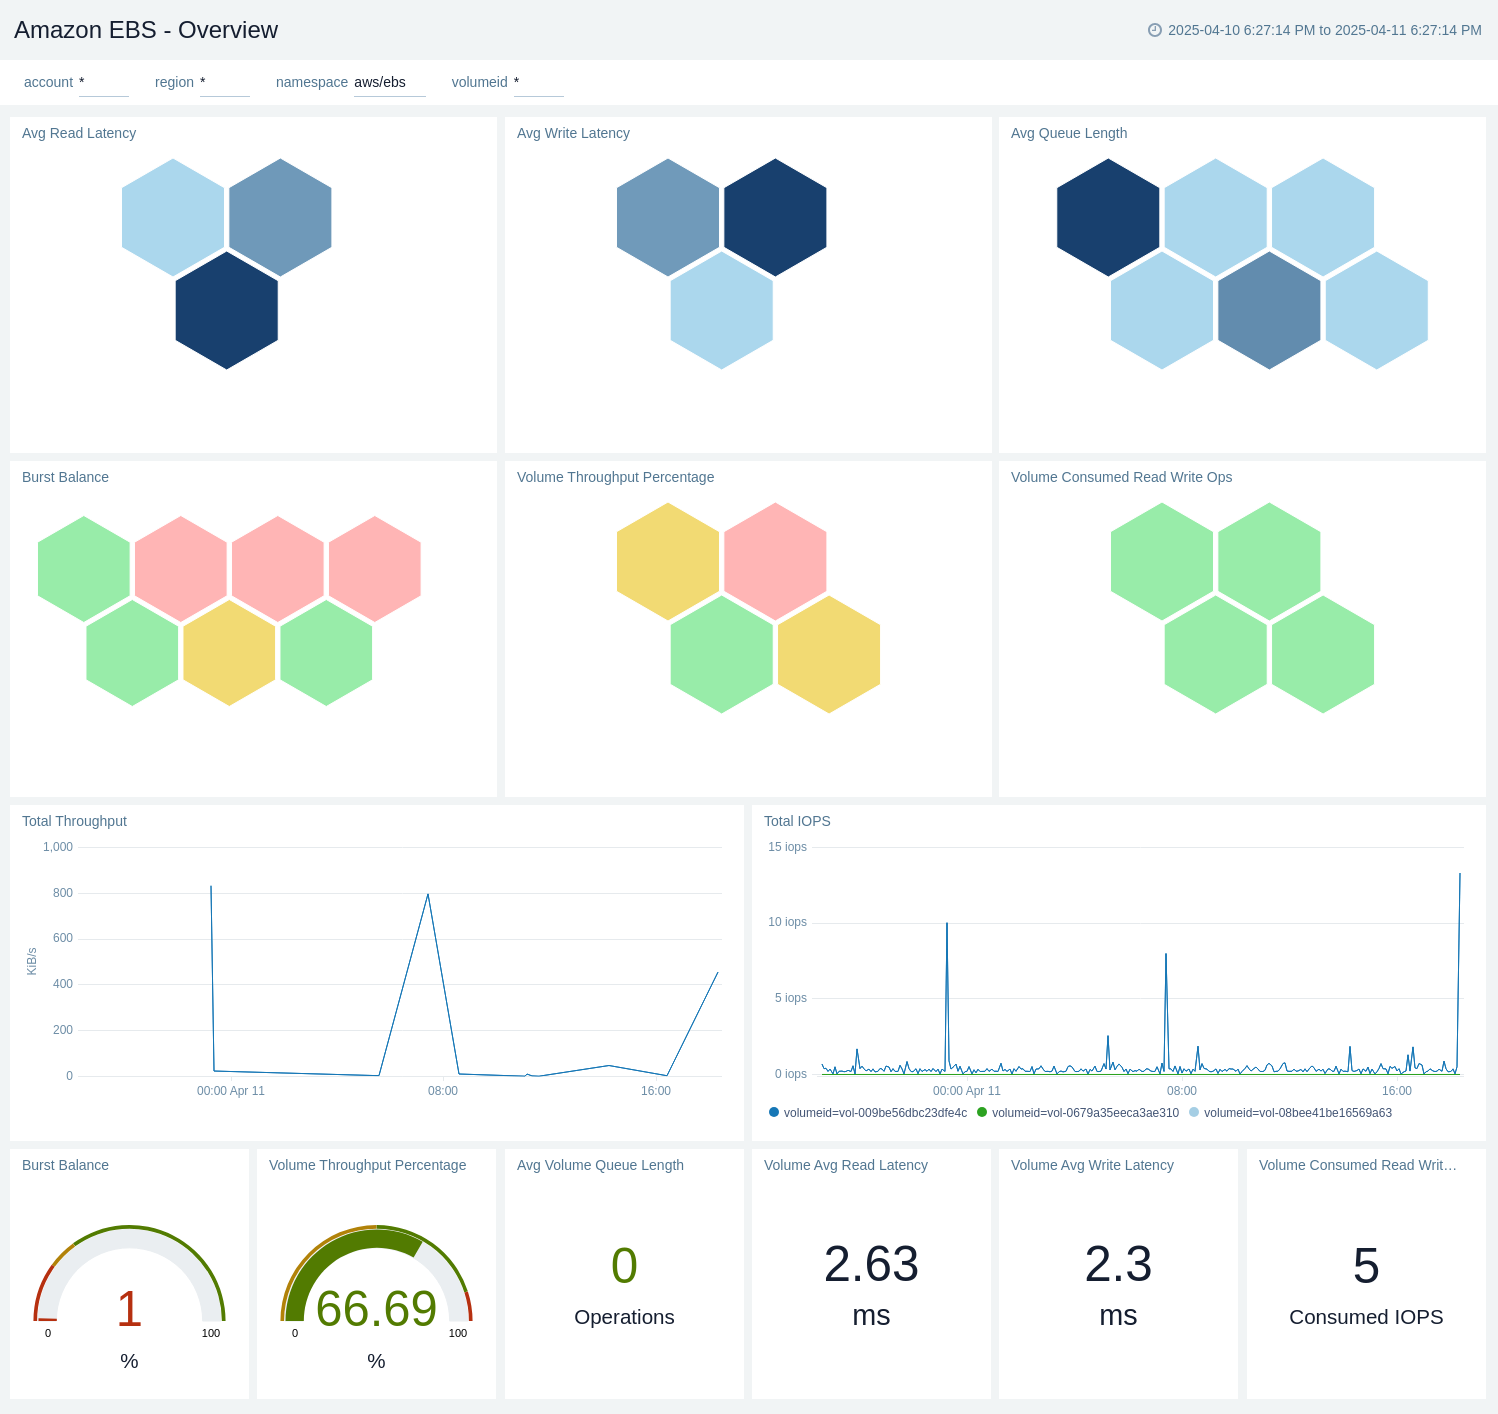
Overview
The Amazon EBS - Overview dashboard offers a comprehensive view of the performance and utilization throughout the lifecycle of your EBS volumes. It allows you to monitor essential metrics such as volume activity, data throughput, and latency.
Use this dashboard to:
- Monitor EBS volume performance metrics like IOPS, throughput, and latency.
- Track burst balance and queue depth to assess I/O efficiency.
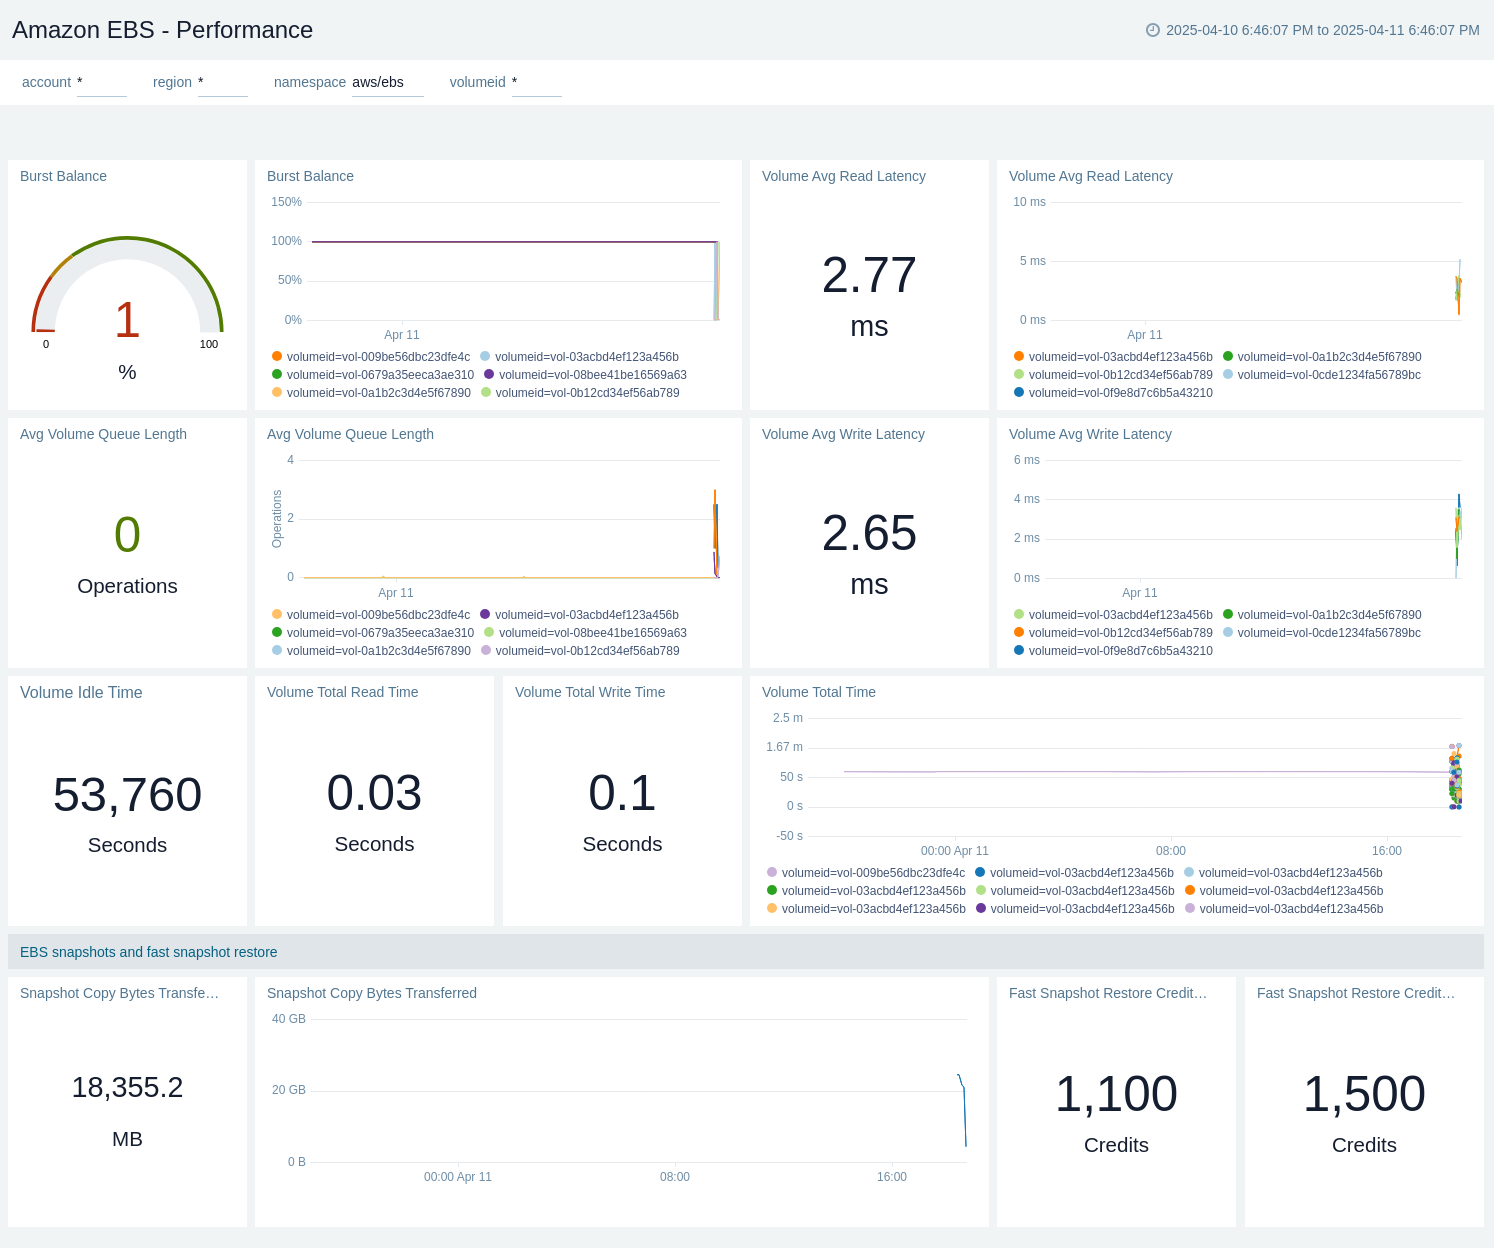
Performance Monitoring
The Amazon EBS - Performance dashboard provides detail visibility into the performance and utilization of your EBS volumes, fast snapshot restore capabilities, and snapshot lifecycle. It enables monitoring of key metrics related to volume activity, latency.
Use this dashboard to:
- Monitor EBS volume performance metrics like latency, time spent on operations.
- Track burst balance and queue depth to assess I/O efficiency.
- Monitor status checks to detect degraded or impaired volumes and snapshot copy progress.
- Track Fast Snapshot Restore readiness and available restore credits.
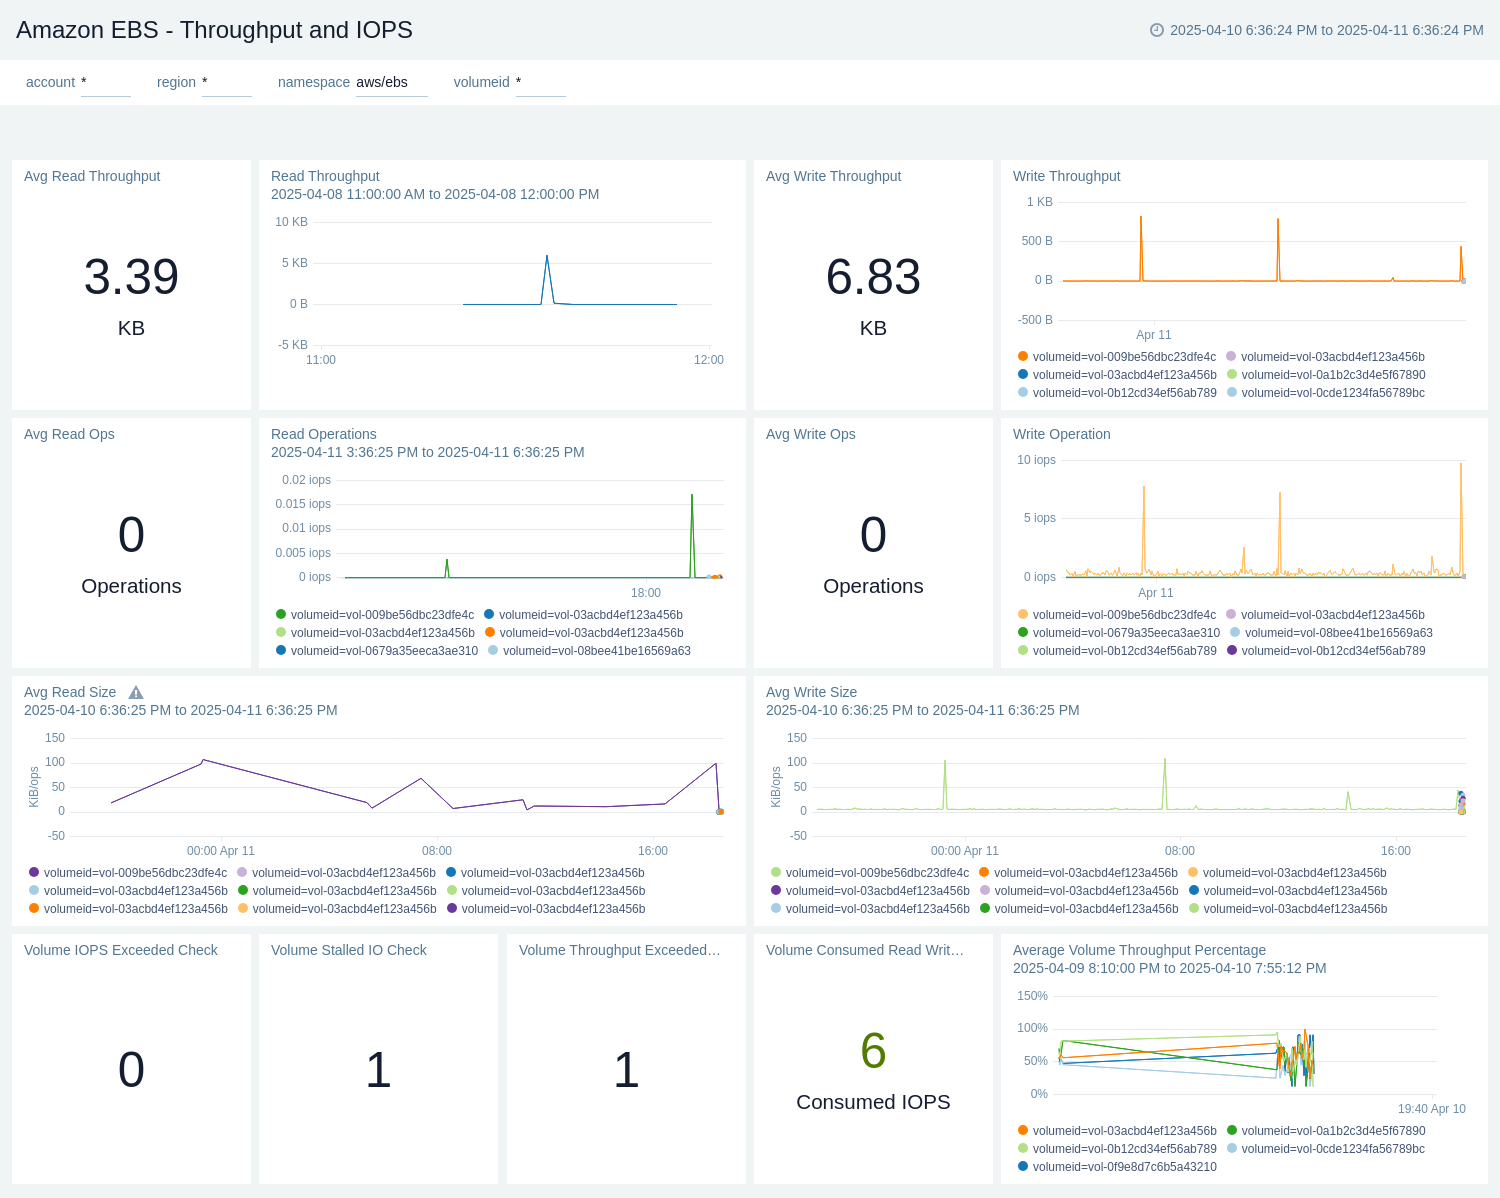
The Amazon EBS - Throughput and IOPS dashboard provides detail visibility into the Throughput and IOPS utilization of your EBS volumes, It enables monitoring of key metrics related to volume IOPS activity, data throughput.
Use this dashboard to:
- Monitor EBS volume performance metrics like IOPS, throughput.
- Monitor status checks to detect degraded or impaired volumes.
- Track data transfer activity to understand read/write patterns over time.
Create monitors for Amazon Elastic Block Store app
From your App Catalog:
- From the Sumo Logic navigation, select App Catalog.
- In the Search Apps field, search for and then select your app.
- Make sure the app is installed.
- Navigate to What's Included tab and scroll down to the Monitors section.
- Click Create next to the pre-configured monitors. In the create monitors window, adjust the trigger conditions and notifications settings based on your requirements.
- Scroll down to Monitor Details.
- Under Location click on New Folder.
note
By default, monitor will be saved in the root folder. So to make the maintenance easier, create a new folder in the location of your choice.
- Enter Folder Name. Folder Description is optional.
tip
Using app version in the folder name will be helpful to determine the versioning for future updates.
- Click Create. Once the folder is created, click on Save.
Amazon Elastic Block Store Alerts
| Name | Description | Alert Condition | Recover Condition |
|---|---|---|---|
Amazon EBS - Volume Stalled IO Detected | This alert triggers when the stalled I/O value on a volume is greater than or equal to 1 over a 5-minute interval. A stalled I/O indicates that the volume is unable to complete read or write operations, which could impact the performance or availability of applications relying on the volume. | Count >= 1 | Count < 1 |
Upgrade/Downgrade the Amazon Elastic Block Store app (Optional)
To update the app, do the following:
Next-Gen App: To install or update the app, you must be an account administrator or a user with Manage Apps, Manage Monitors, Manage Fields, Manage Metric Rules, and Manage Collectors capabilities depending upon the different content types part of the app.
- Select App Catalog.
- In the Search Apps field, search for and then select your app.
Optionally, you can identify apps that can be upgraded in the Upgrade available section. - To upgrade the app, select Upgrade from the Manage dropdown.
- If the upgrade does not have any configuration or property changes, you will be redirected to the Preview & Done section.
- If the upgrade has any configuration or property changes, you will be redirected to the Setup Data page.
- In the Configure section of your respective app, complete the following fields.
- Field Name. If you already have collectors and sources set up, select the configured metadata field name (eg _sourcecategory) or specify other custom metadata (eg: _collector) along with its metadata Field Value.
- Click Next. You will be redirected to the Preview & Done section.
Post-update
Your upgraded app will be installed in the Installed Apps folder and dashboard panels will start to fill automatically.
See our Release Notes changelog for new updates in the app.
To revert the app to a previous version, do the following:
- Select App Catalog.
- In the Search Apps field, search for and then select your app.
- To version down the app, select Revert to < previous version of your app > from the Manage dropdown.
Uninstalling the Amazon Elastic Block Store app (Optional)
To uninstall the app, do the following:
- Select App Catalog.
- In the 🔎 Search Apps field, run a search for your desired app, then select it.
- Click Uninstall.