AWS EC2 Host Metrics

Amazon Elastic Compute Cloud (Amazon EC2) provides scalable computing capacity in the Amazon Web Services (AWS) Cloud. You can use Amazon EC2 to launch as many or as few virtual servers as you need, configure security and networking, and manage storage.
The Sumo Logic App for Host Metrics (EC2) allows you to collect your EC2 instance metrics and display them using predefined dashboards. The App provides dashboards to display analysis of EC2 instance metrics for CPU, memory, disk, network, and TCP. Also, it provides detailed insights into all CloudTrail audit events associated with EC2 instances and specifically helps identify changes, errors, and user activities.
Metrics Types
Host metrics are gathered by the open-source SIGAR library. The metrics that are collected are described in Host Metrics for Installed Collectors.
Sample queries
_sourceCategory=Labs/AWS/Host/Metrics metric=CPU_Total account=* region=* namespace=aws/ec2 instanceid=* | avg
Collecting Metrics for the Host Metrics (EC2) App
The Host Metrics (EC2) app relies upon an Installed Collector with a Host Metrics Source on each of your AWS EC2 hosts. This page describes the data sources for the Host Metrics (EC2) app and has instructions for setting up metric collection.
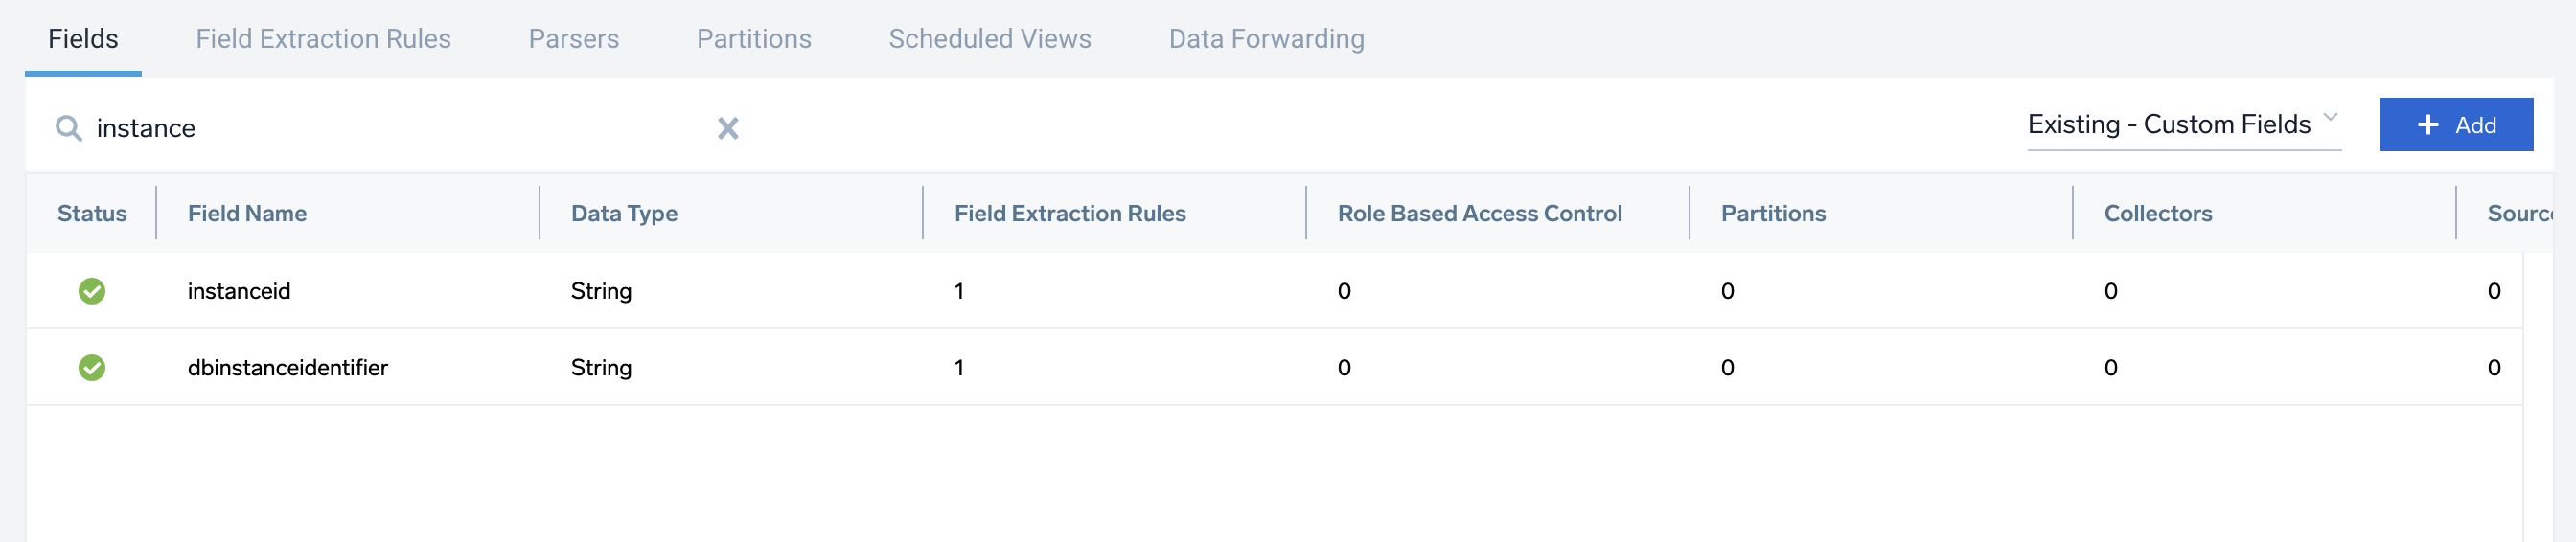
Field in Field Schema
- Classic UI. In the main Sumo Logic menu, select Manage Data > Logs > Fields.
New UI. In the top menu select Configuration, and then under Logs select Fields. You can also click the Go To... menu at the top of the screen and select Fields. - Search for the
instanceidfield. - If not present, create it. Learn how to create and manage fields here.
Configure Host Metrics sources
Follow the instructions in this section to configure the Sumo Logic Installed Collector and a Host Metrics Source on each of your AWS EC2 hosts. You will assign account and namespace metadata fields to the sources so that incoming logs and metrics will be appropriately tagged.
This step is not necessary if you already have an Installed Collector and Host Metrics tagged with account and Namespace metadata fields.
Perform these steps for each EC2 host:
- Set up an Installed Collector. For instructions, see Installed Collectors.
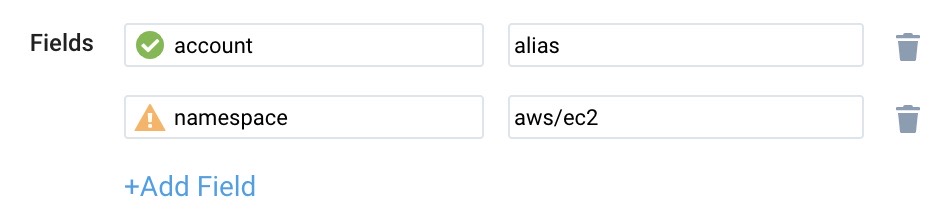
- Add a Host Metrics Source to the Installed Collector. For instructions, see Manually Configure a Host Metrics Source. In the Fields portion of the configuration::
- Add a field named account, and set it to your AWS account alias.
- Add a field named namespace and set it to aws/ec2.
- Set the Scan Interval (the frequency at which the Source is scanned) to 1 minute.
A default Scan Interval of 1 minute is recommended. You can set it to a higher or lower interval as needed. Faster intervals may result in increased consumption cost.
You can also build your EC2 AMI machine image with these fields and settings. For instructions, see this blog. Here’s a sample sources.json file that you can include in your AMI.
{
  "api.version": "v1",
   "source": {
    "name": "Host Metrics",
    "category": "hostmetrics",
    "automaticDateParsing": false,
    "multilineProcessingEnabled": true,
    "useAutolineMatching": true,
    "contentType": "HostMetrics",
    "forceTimeZone": false,
    "filters": [],
    "cutoffTimestamp": 0,
    "encoding": "UTF-8",
    "fields": {
      "account": "<your AWS account alias>",
      "Namespace": "AWS/EC2"
    },
    "thirdPartyRef": {
      "resources": [
        {
          "serviceType": "HostMetrics",
          "path": {
            "type": "NoPathExpression"
          },
          "authentication": {
            "type": "NoAuthentication"
          }
        }
      ]
    },
    "interval": 300000,
    "metrics": [
      "CPU_User",
      "CPU_Sys",
 …..
    ],
    "processMetrics": [],
    "sourceType": "SystemStats"
  }
}
AWS Metadata
Collectors running on AWS EC2 instances can optionally collect AWS Metadata such as EC2 tags to make it easier to search for Host Metrics. Only one AWS Metadata Source for Metrics is required to collect EC2 tags from multiple hosts. For more information, see AWS Metadata Source for Metrics.
Install the Host Metrics (EC2) App
Now that you have set up the collection for Host Metrics (EC2) metrics, install the Sumo Logic App to use the pre-configured searches and dashboards that provide visibility into your environment for real-time analysis of overall usage.
To install the app:
- Select App Catalog.
- In the 🔎 Search Apps field, run a search for your desired app, then select it.
- Click Install App.
note
Sometimes this button says Add Integration.
- On the next configuration page, under Select Data Source for your App, complete the following fields:
- Data Source. Select one of the following options:
- Choose Source Category and select a source category from the list; or
- Choose Enter a Custom Data Filter, and enter a custom source category beginning with an underscore. For example,
_sourceCategory=MyCategory.
- Folder Name. You can retain the existing name or enter a custom name of your choice for the app.
- All Folders (optional). The default location is the Personal folder in your Library. If desired, you can choose a different location and/or click New Folder to add it to a new folder.
- Data Source. Select one of the following options:
- Click Next.
- Look for the dialog confirming that your app was installed successfully.
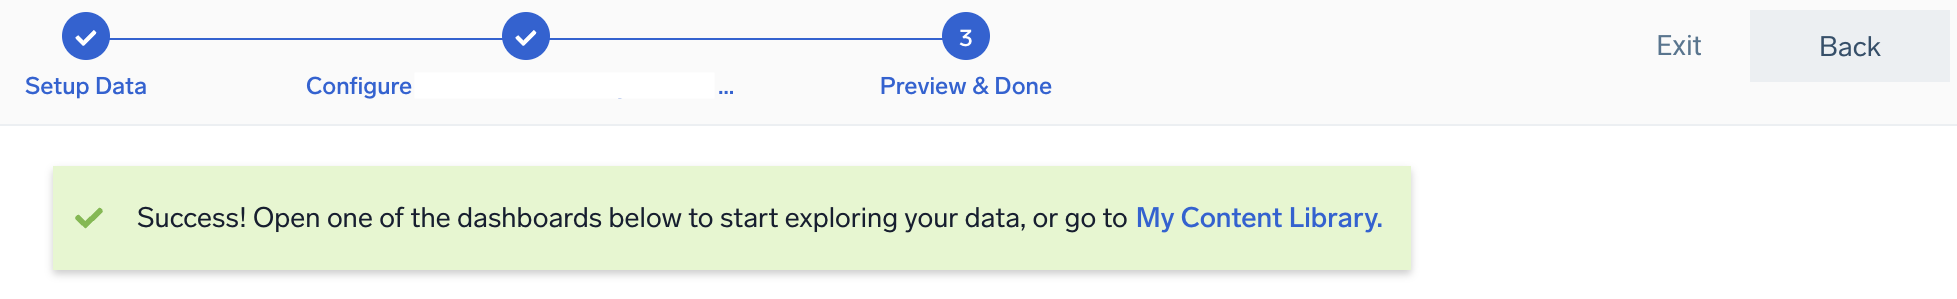
Post-installation
Once your app is installed, it will appear in your Personal folder or the folder that you specified. From here, you can share it with other users in your organization. Dashboard panels will automatically start to fill with data matching the time range query received since you created the panel. Results won't be available immediately, but within about 20 minutes, you'll see completed graphs and maps.
Viewing EC2 Host Metrics Dashboards
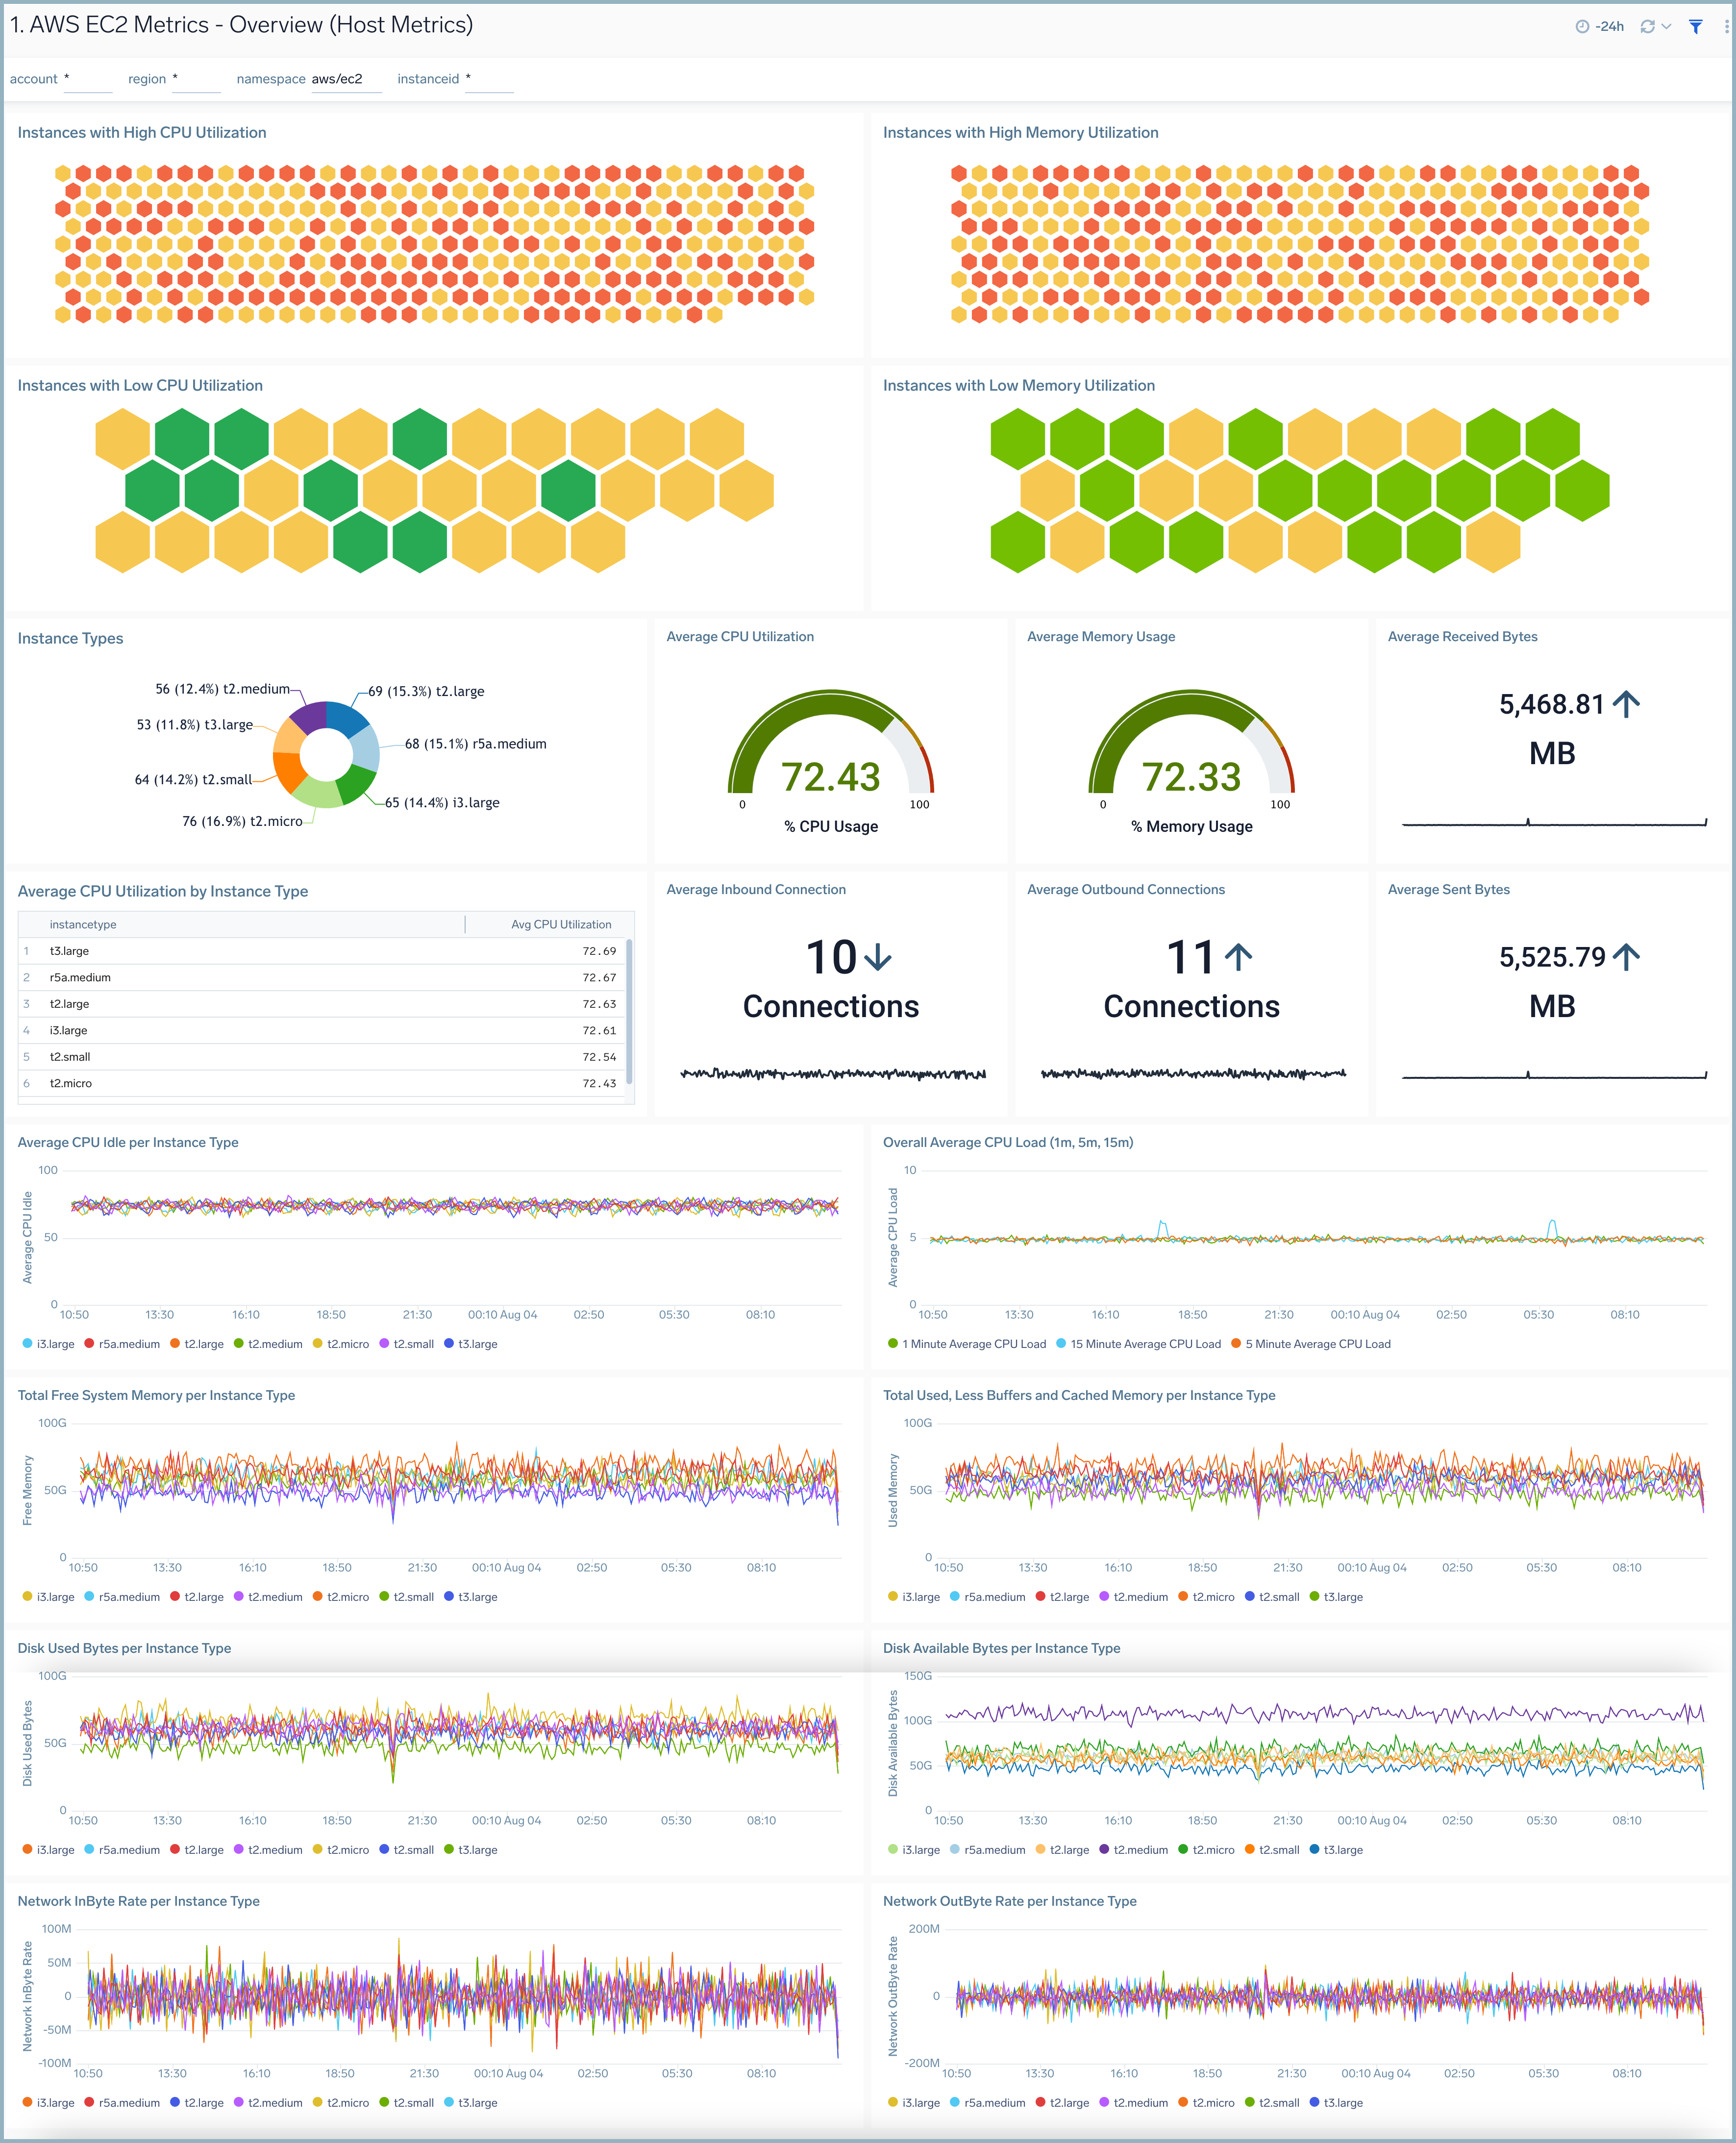
AWS EC2 - Overview (Host OS Metrics)
The AWS EC2 - Overview (Host OS Metrics) dashboard provides insights into EC2 performance throughout your infrastructure, including CPU utilization, network rates, disk, and memory usage.
Use this dashboard to:
- Quickly identify instances with high and low CPU and memory utilization.
- Monitor average statistics across various resource dimensions across all of your EC2 instances.
- Identify trends and deviations in resource usage across instance types, based upon which you can identify which instance types need to be resized.
- Monitor average CPU utilization by instance type.
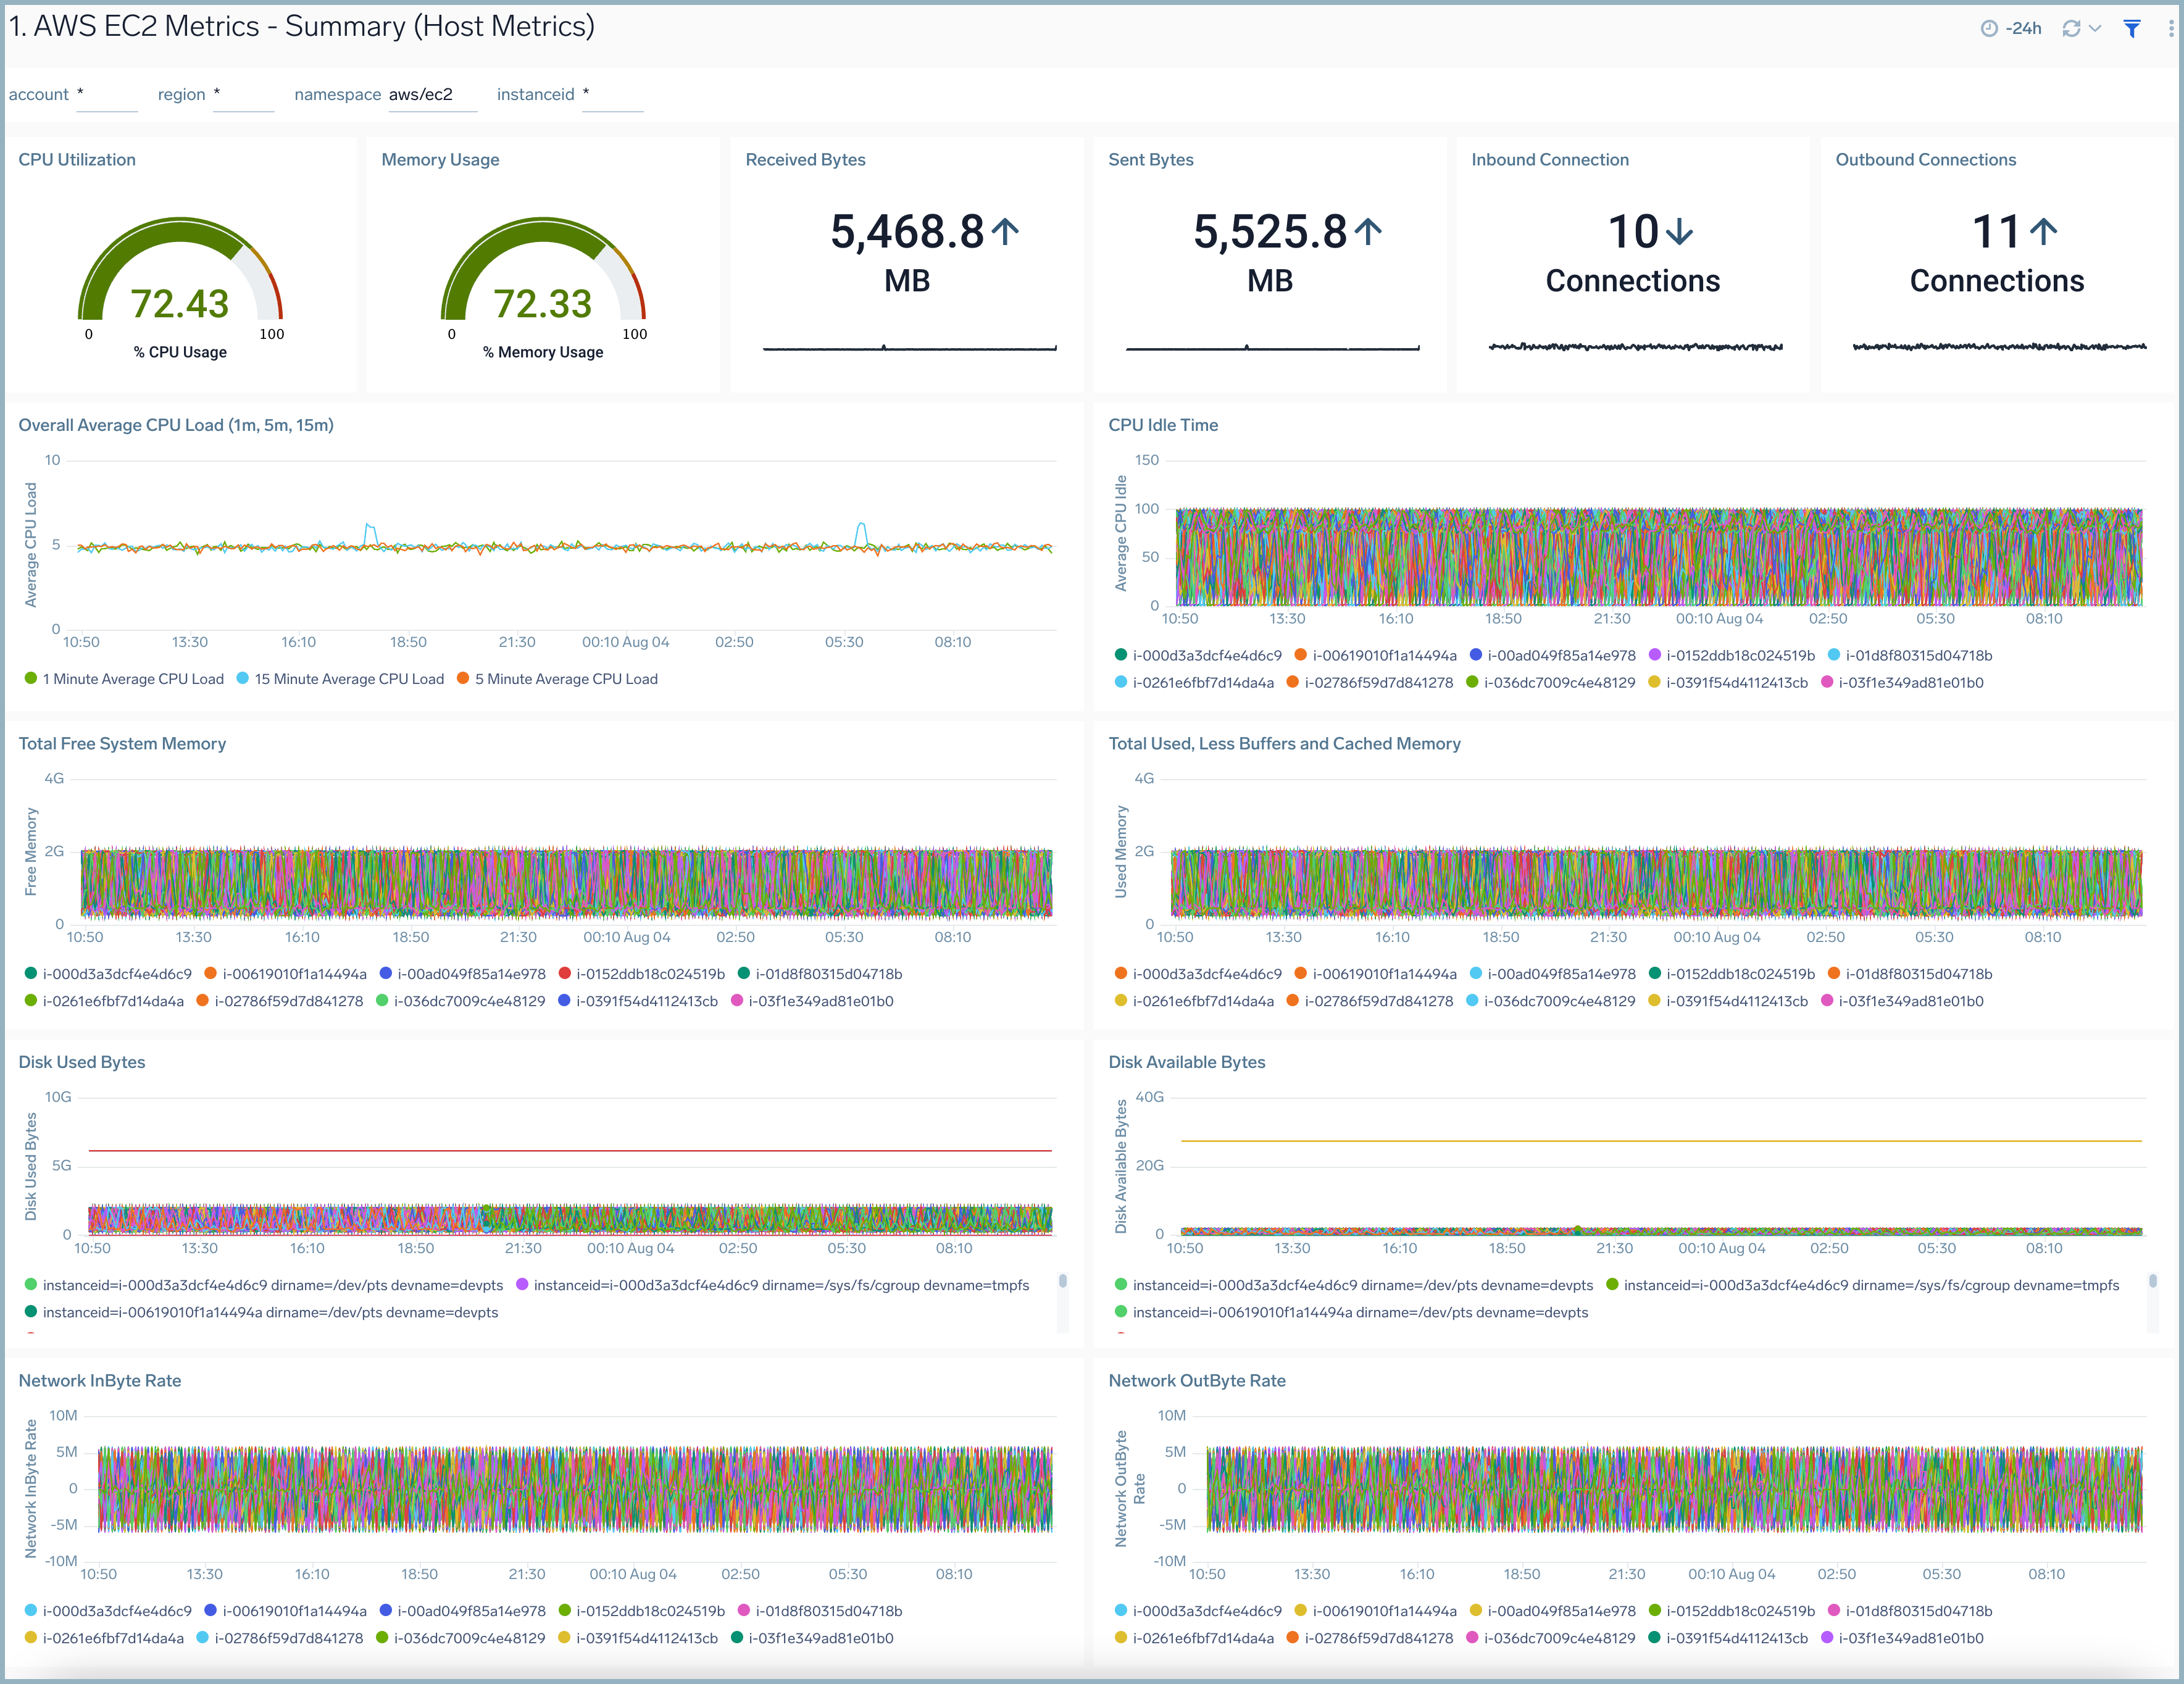
AWS EC2 - Summary (Host OS Metrics)
The AWS EC2 - Summary (Host OS Metrics) dashboard provides resource utilization insights for a specific EC2 instance.
Use this dashboard to:
- Monitor resource utilization statistics for a specific EC2 instance.
- Determine if an instance needs to be resized based on utilization.
- Identify potential infrastructure issues by identifying deviations in trends and monitoring.
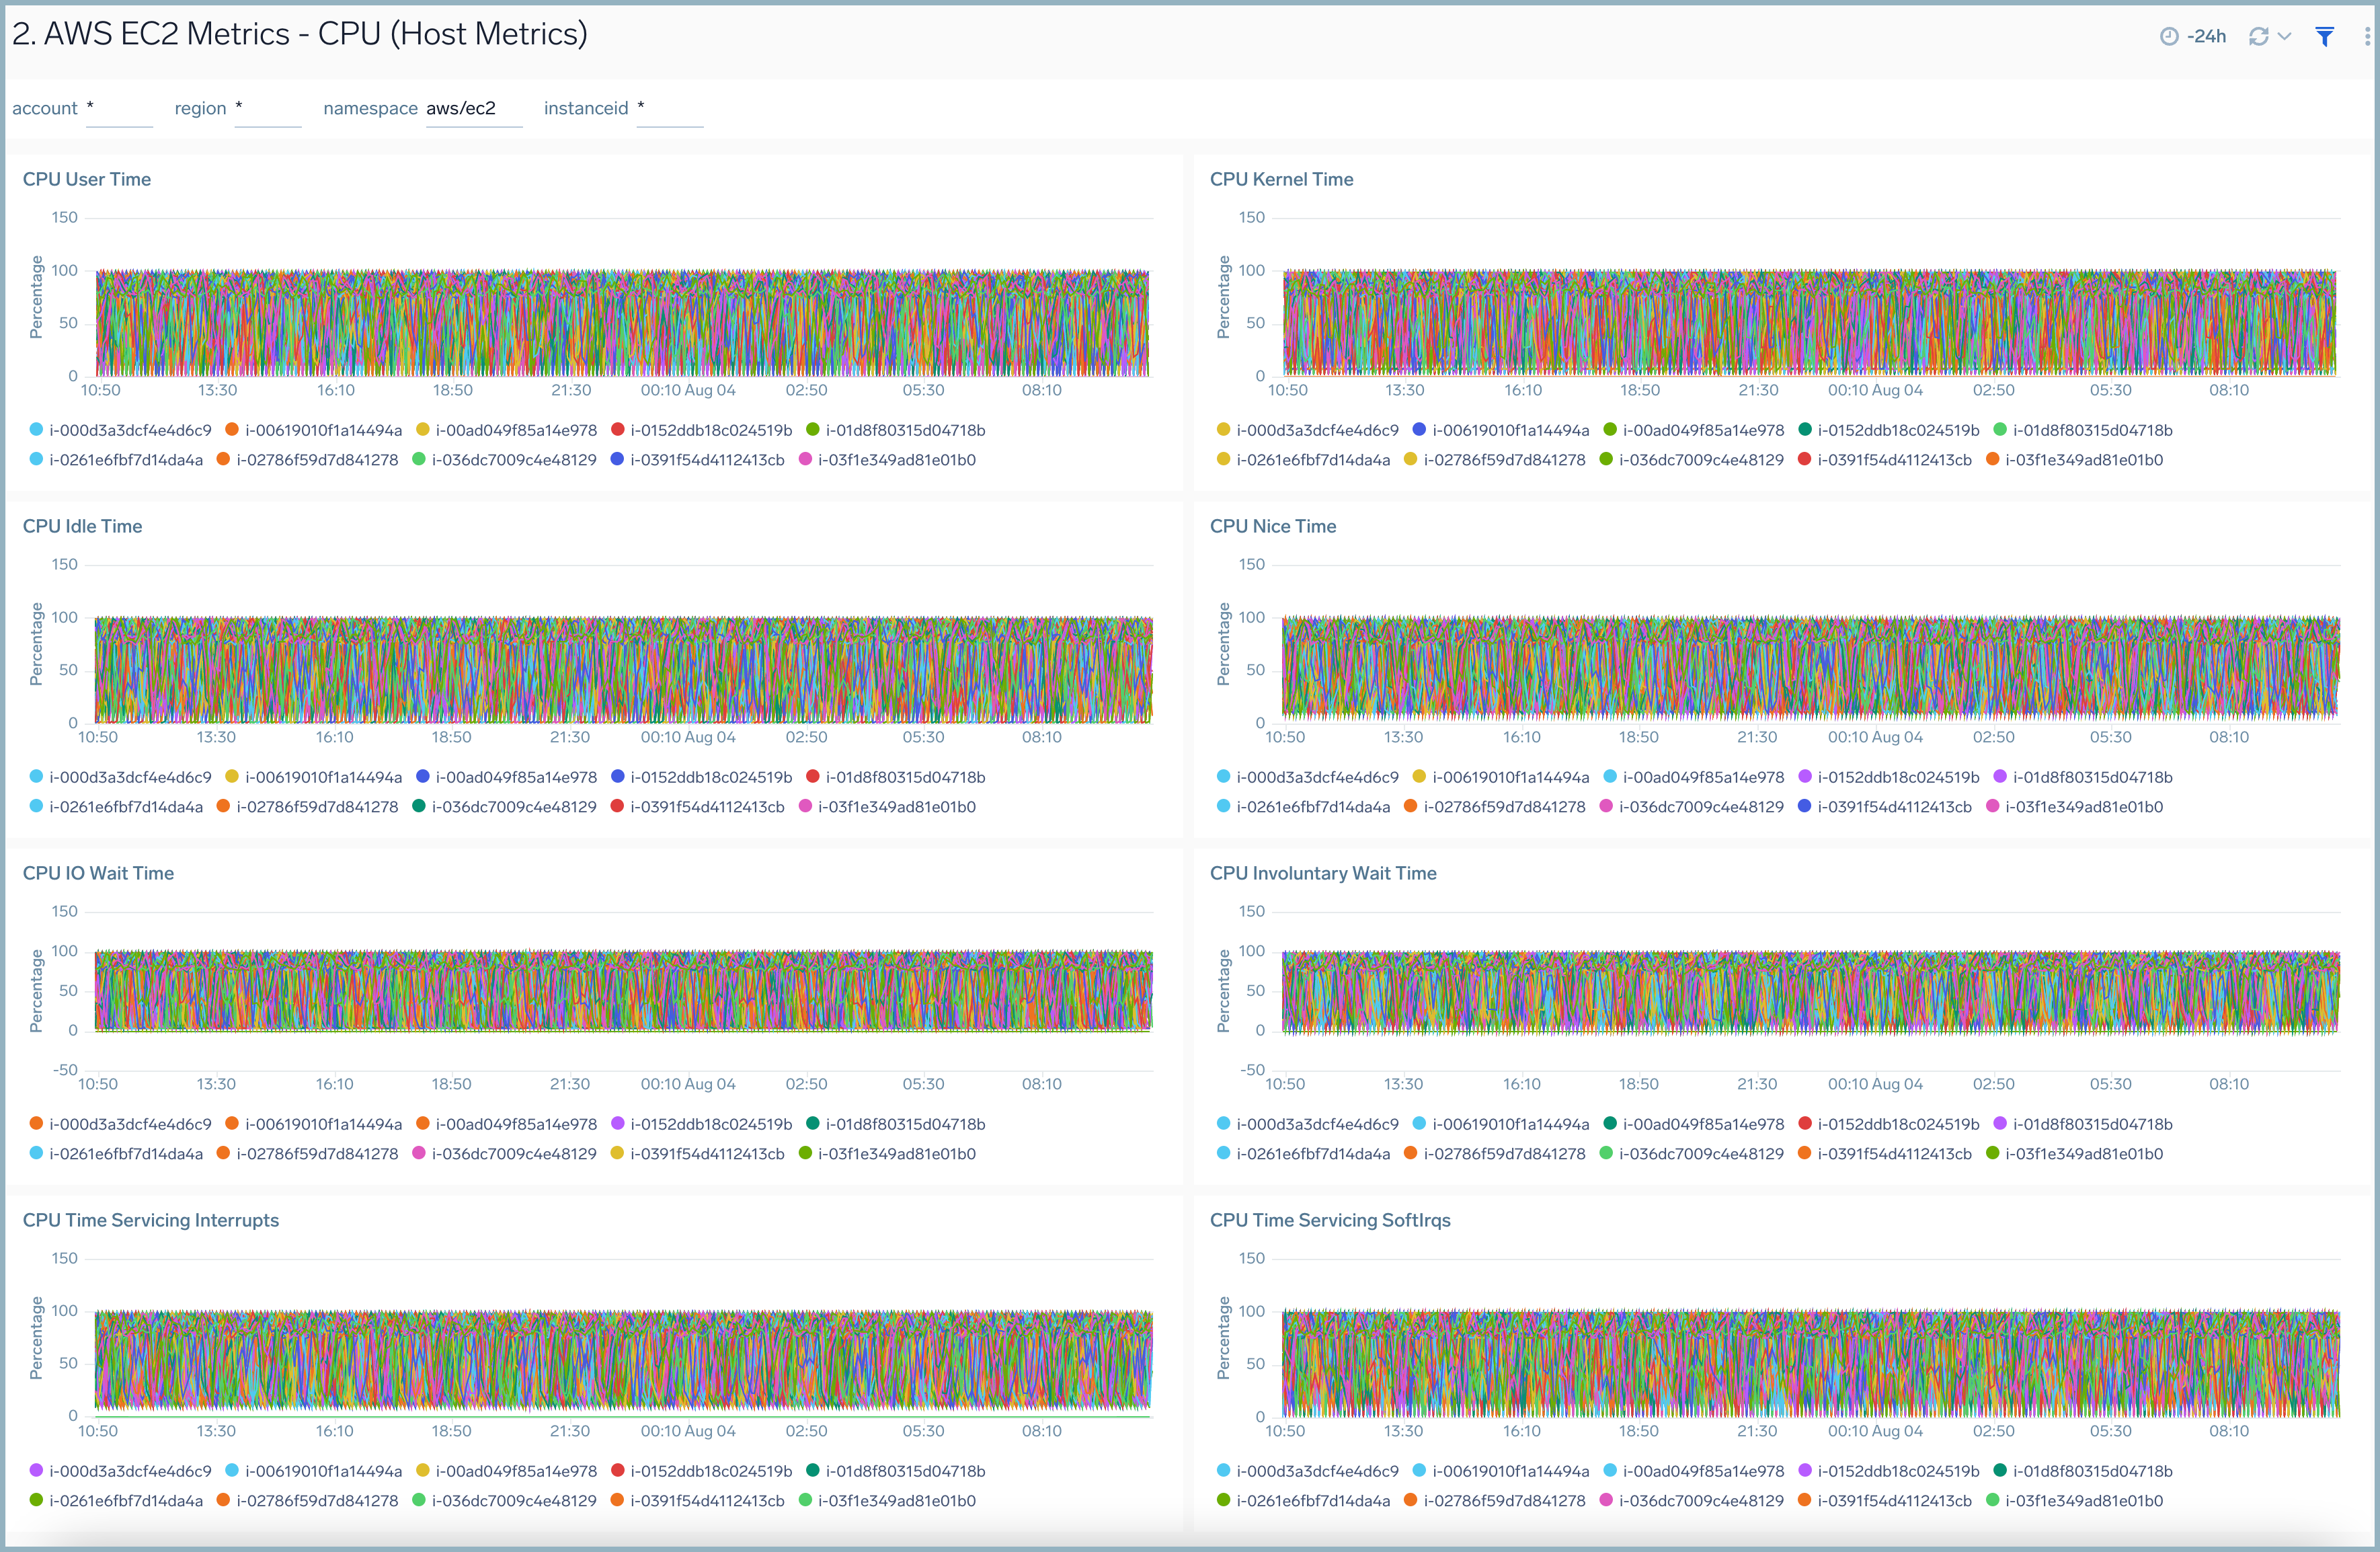
AWS EC2 - CPU
The AWS EC2 - CPU (Host OS Metrics) dashboard provides insights into EC2 CPU performance throughout your infrastructure, including average CPU load, system, user, idle, and wait times, as well as statistics per instance.
Use this dashboard to:
- Quickly identify if high CPU utilization for an EC2 instance is potentially causing a production issue.
- Determine how CPU cycles are being spent across CPU user time, system time, and IO wait time.
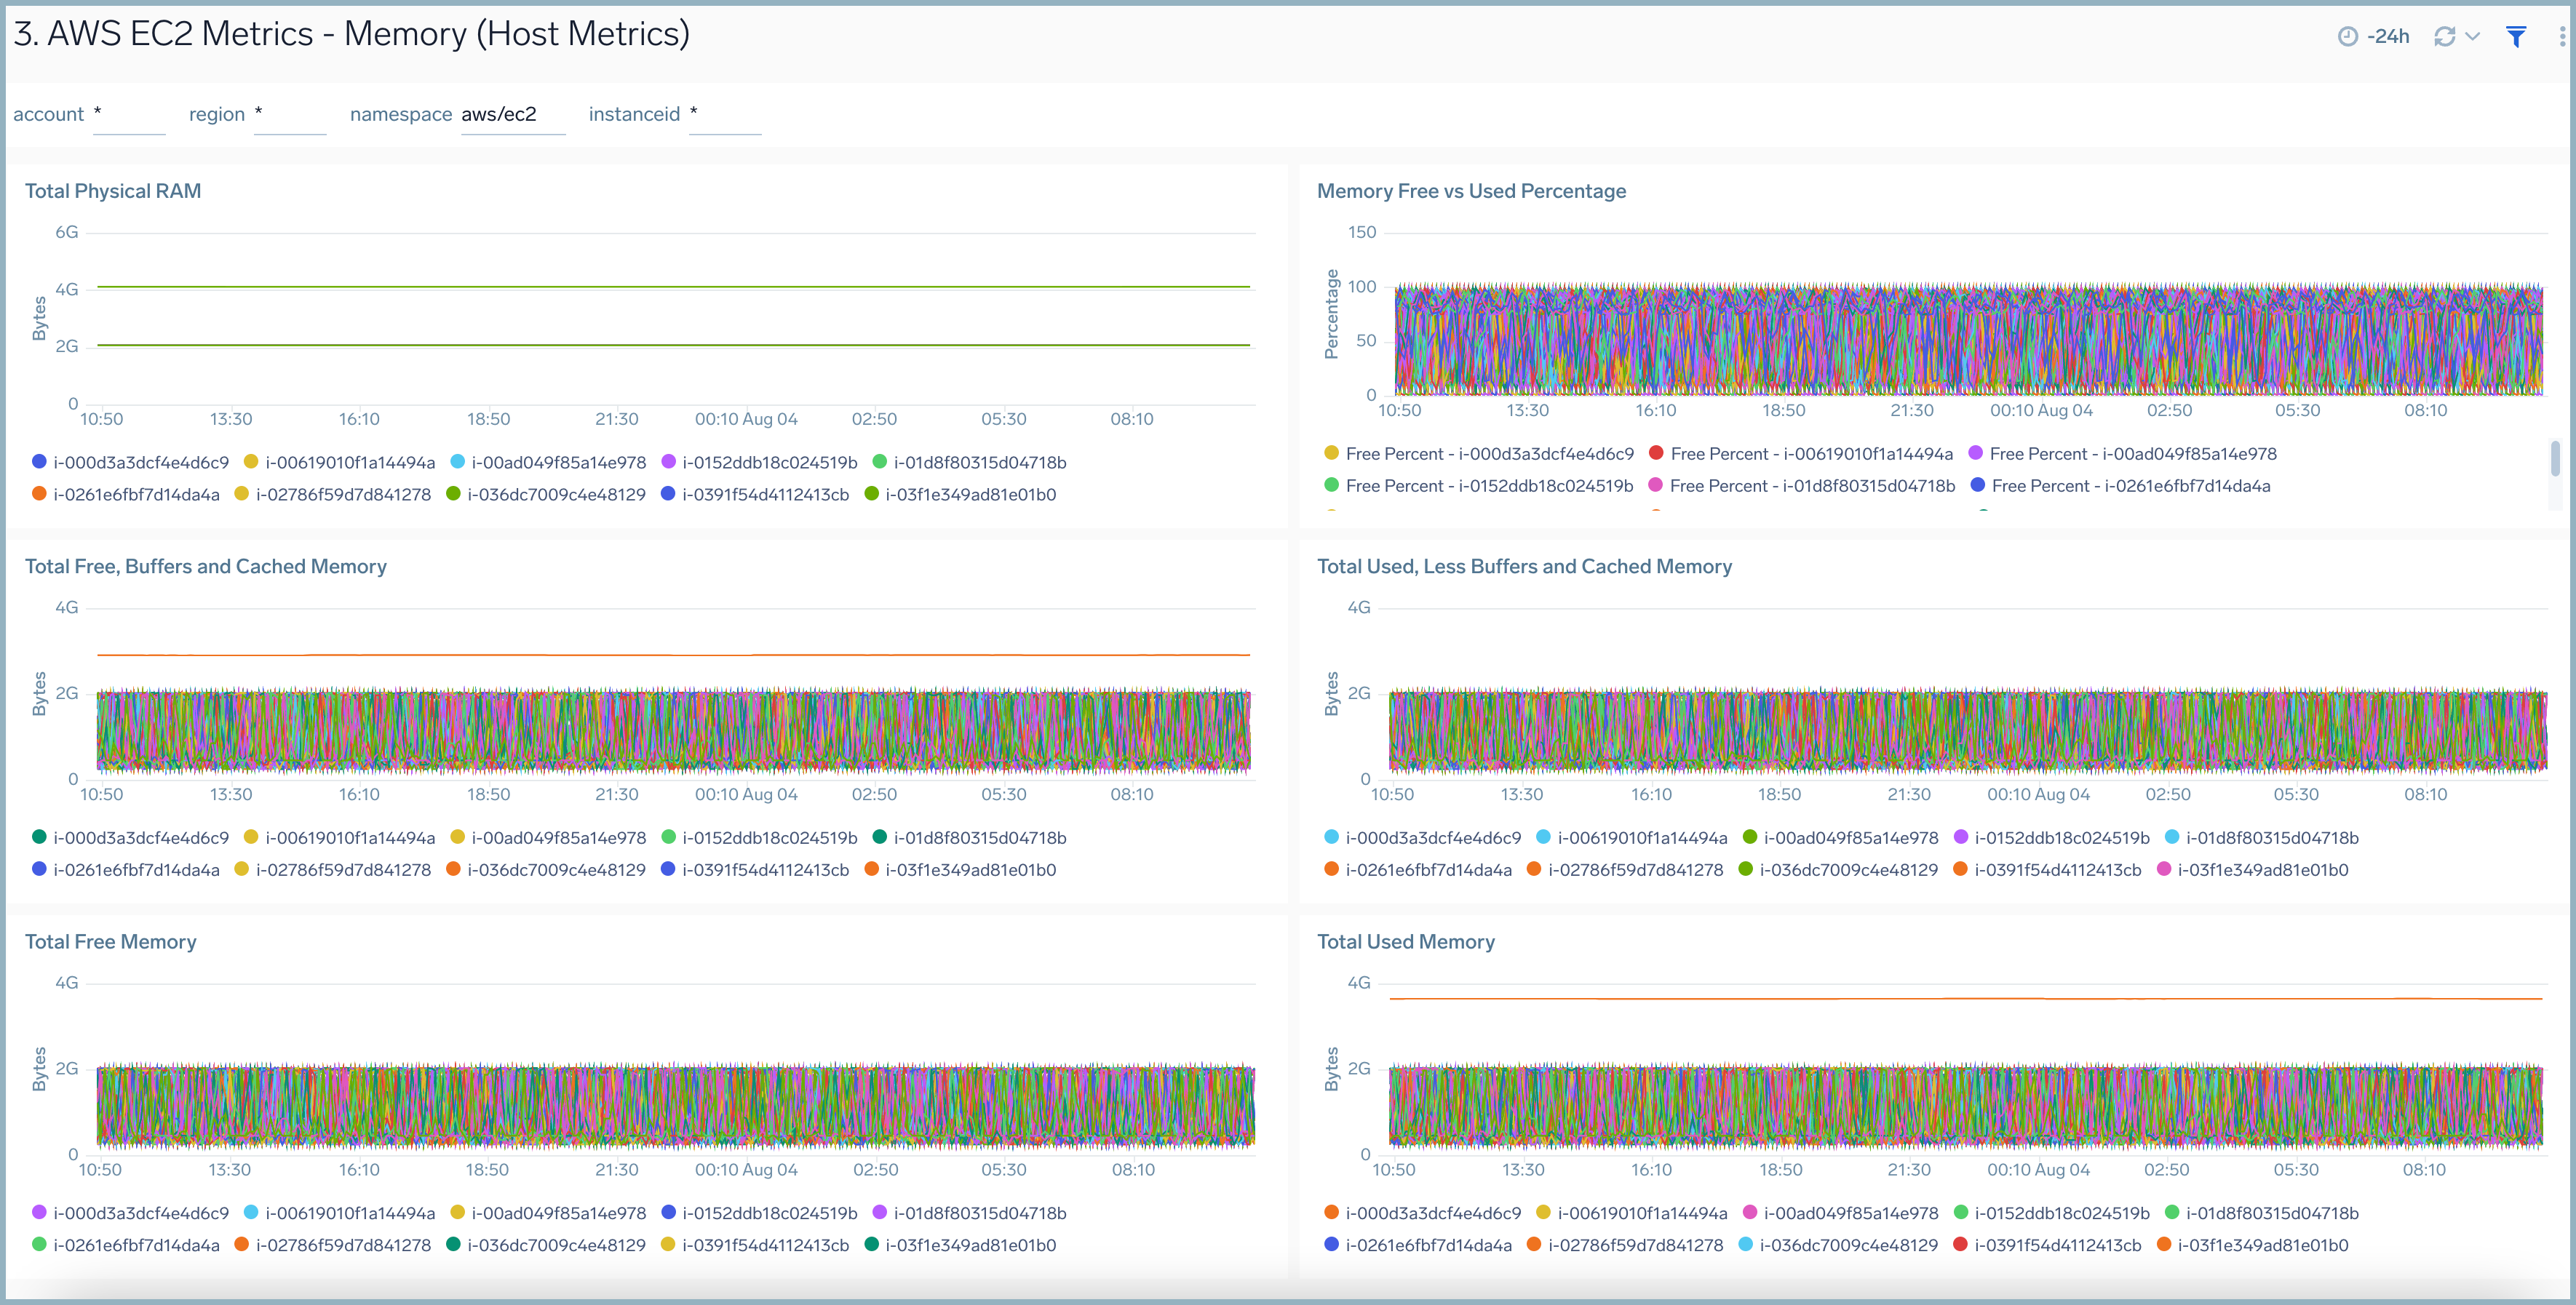
AWS EC2 - Memory (Host OS Metrics)
The AWS EC2 - Memory (Host OS Metrics) dashboard provides insights into EC2 memory usage per instance for total and percentage memory usage, free memory use, buffers, cache memory, and system memory.
Use this dashboard to:
- Quickly identify if high memory utilization for an EC2 instance is potentially causing a production issue
- Determine how memory is being used across buffers and cache memory.
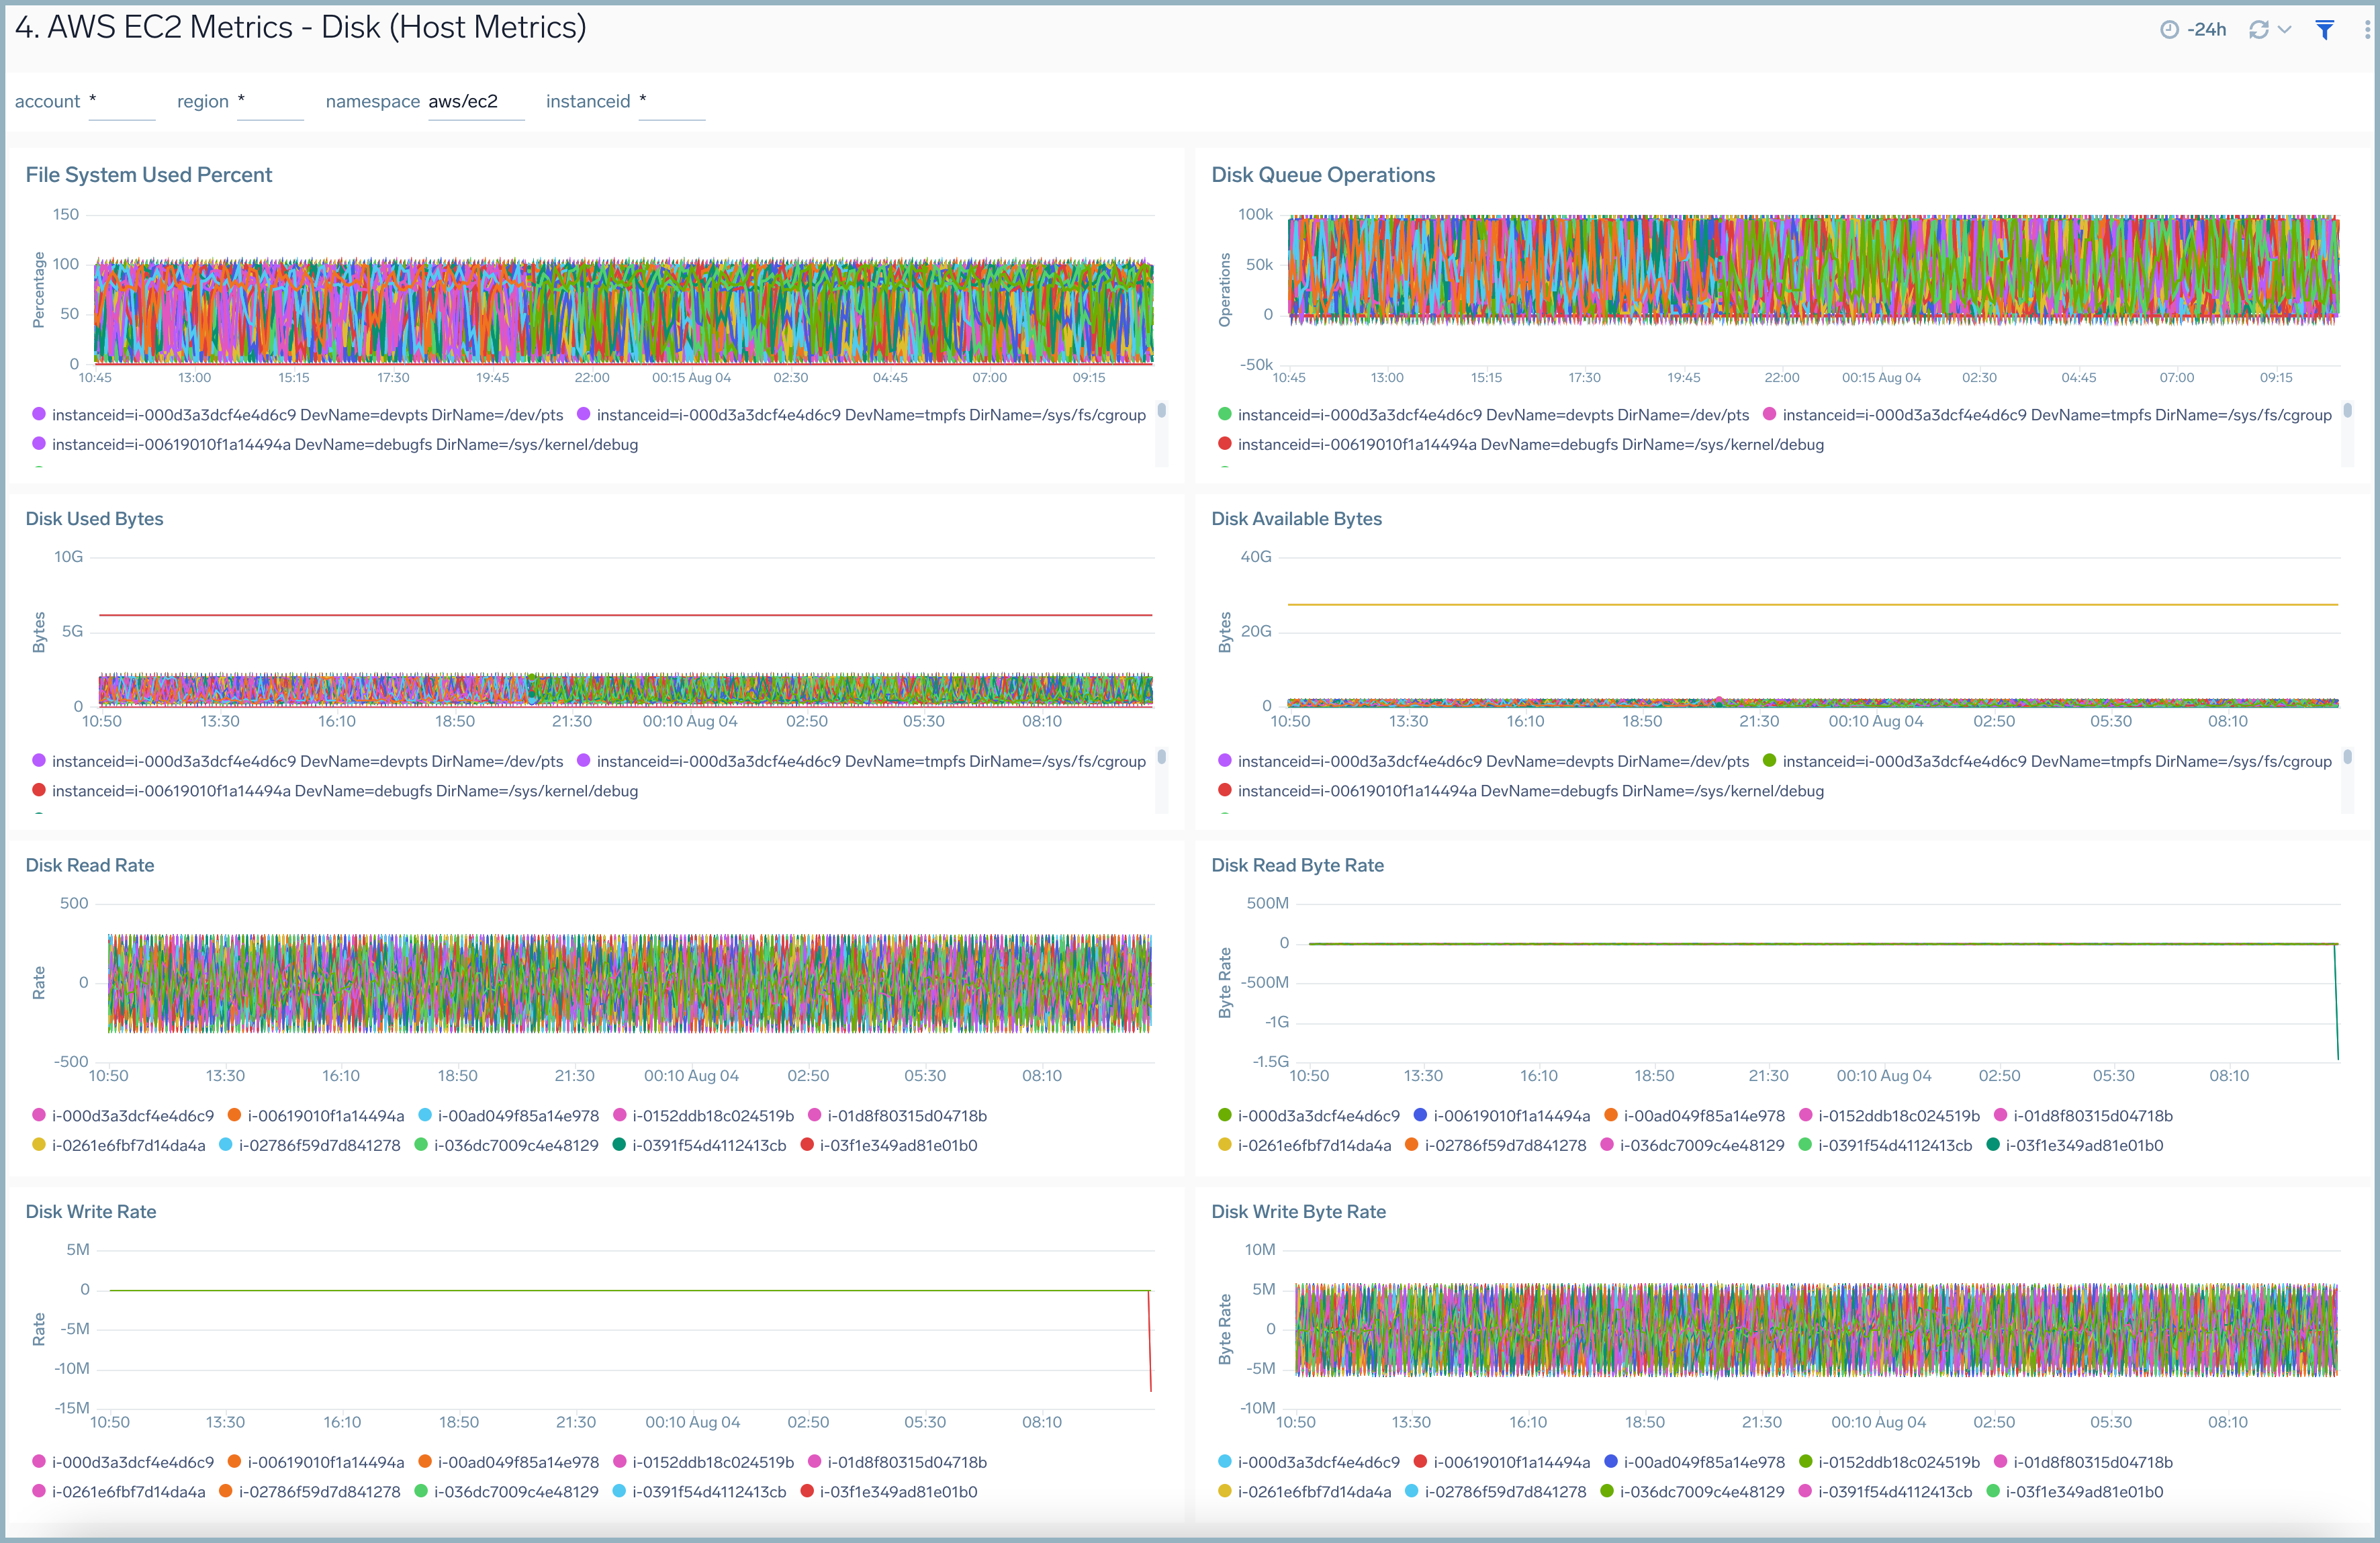
AWS EC2 - Disk (Host OS Metrics)
The AWS EC2 - Disk (Host OS Metrics) dashboard provides insights into EC2 disk usage per instance throughout your infrastructure, including directory, writes and usage, available bytes, used bytes, and byte read and write rates.
Use this dashboard to:
- Quickly identify if high disk utilization for an EC2 instance is potentially causing a production issue.
- Determine which directories have the most disk usage.
- Determine the performance of your storage by monitoring disk read/write rates.
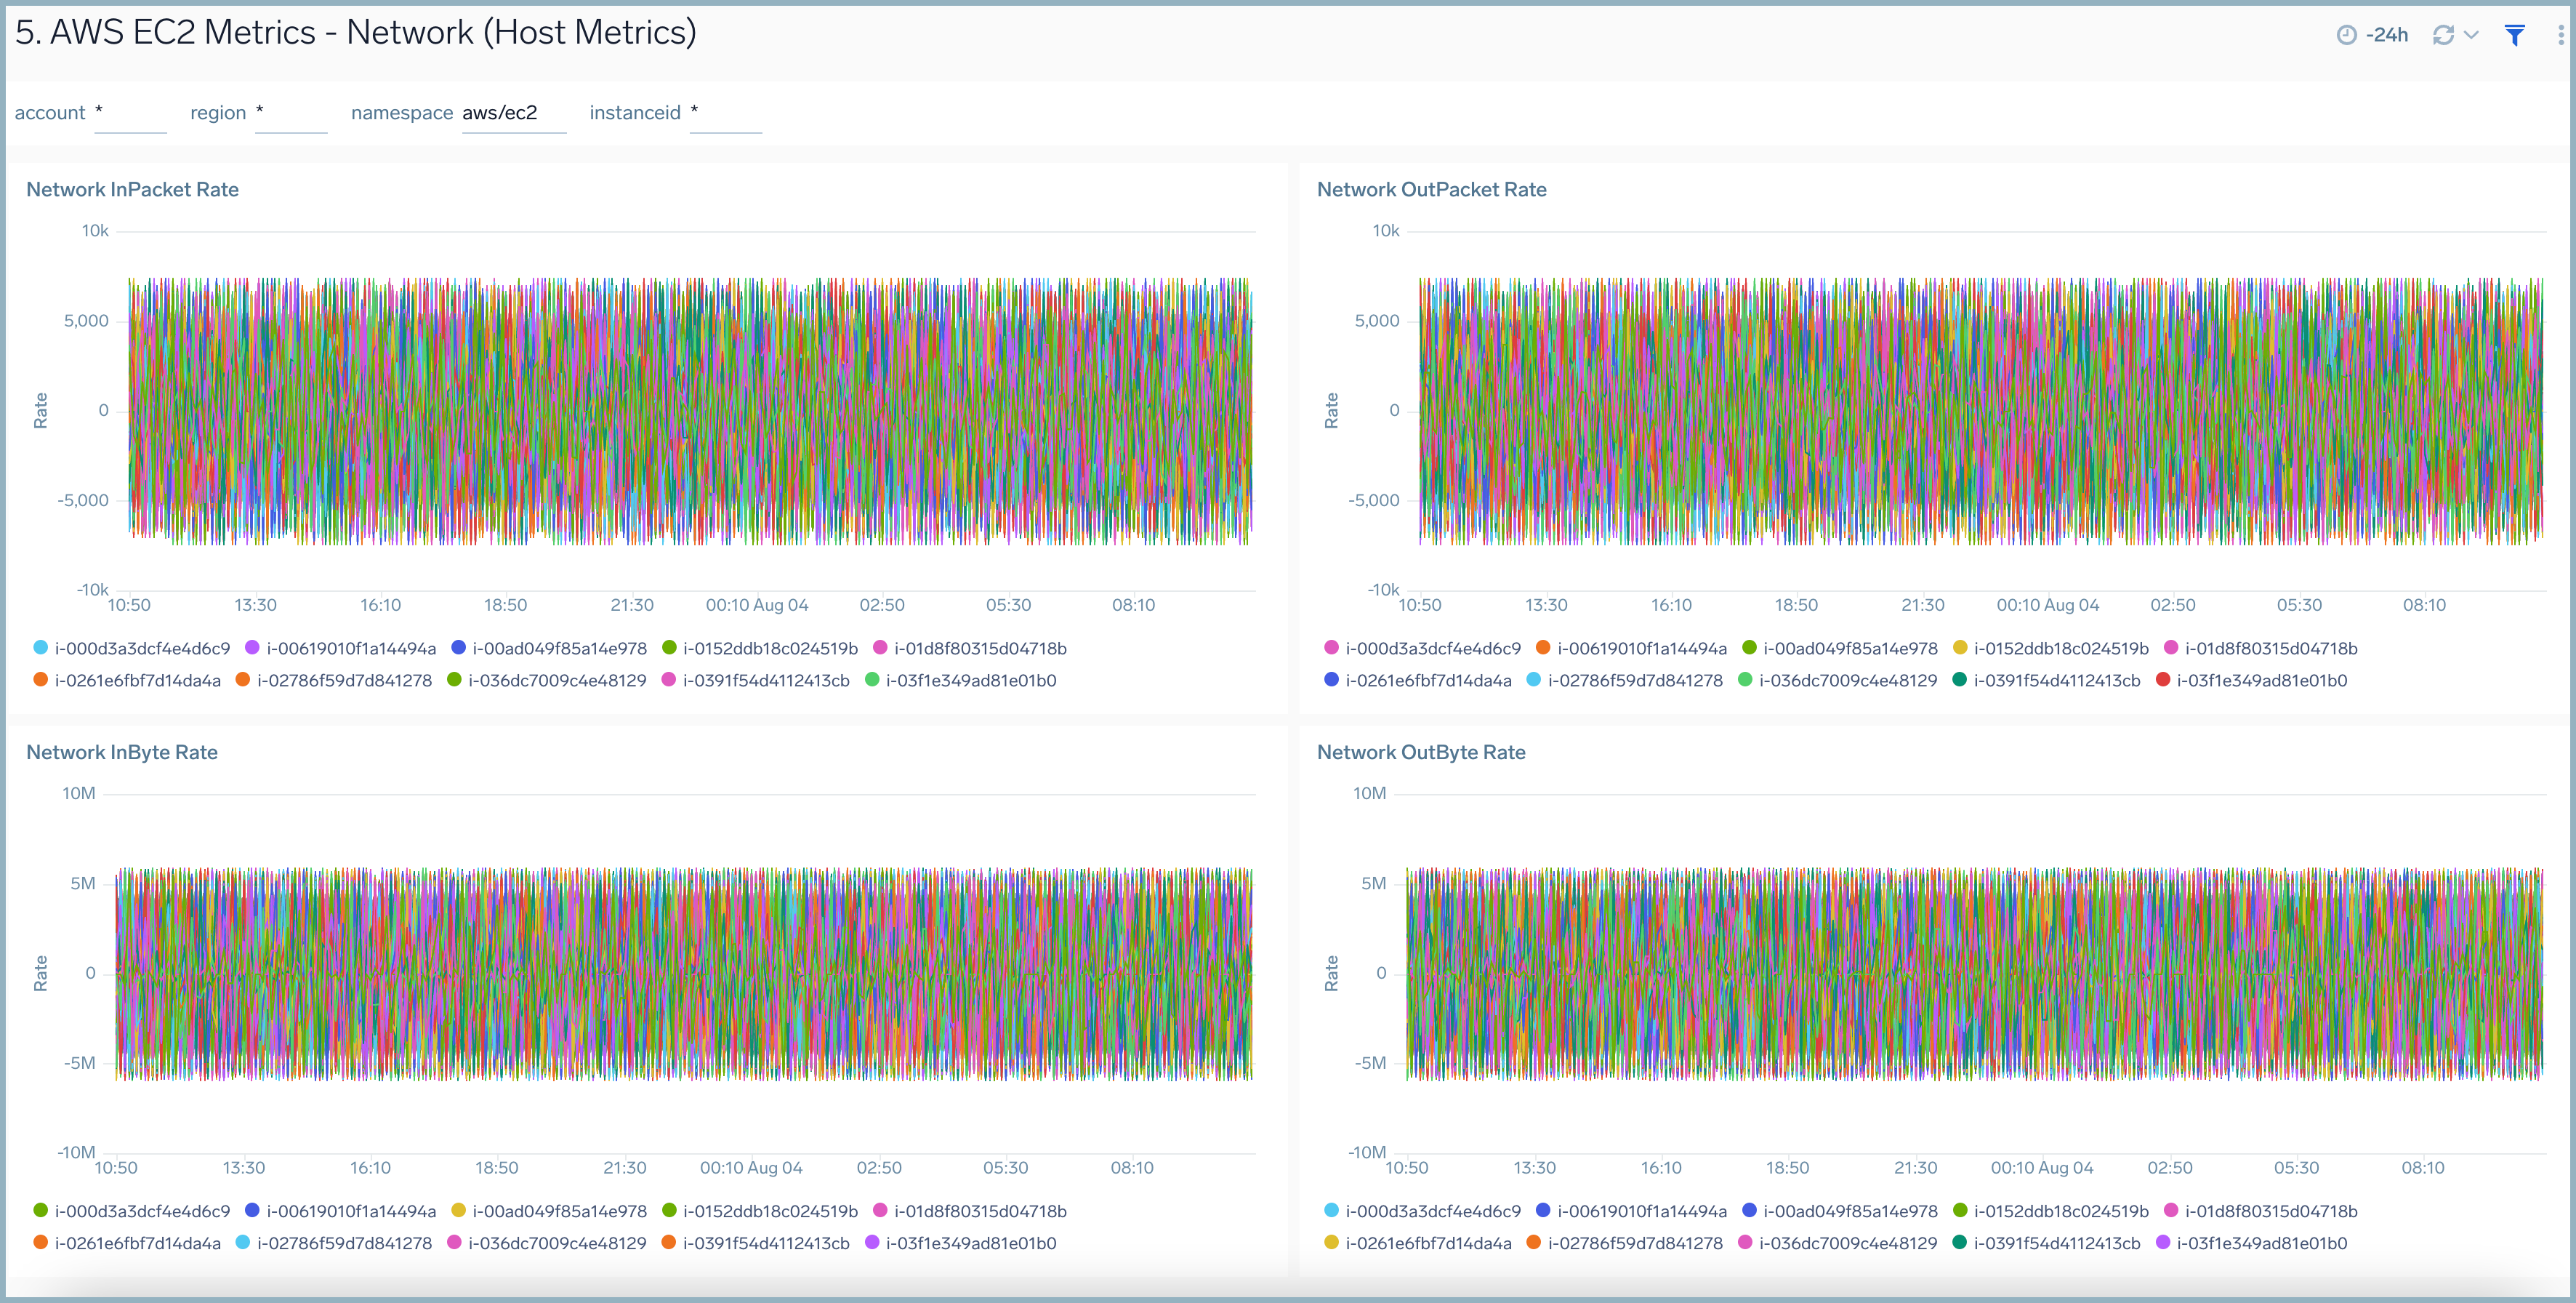
AWS EC2 - Network (Host OS Metrics)
The AWS EC2 - Network (Host OS Metrics) dashboard provides insights into EC2 network performance per instance across your infrastructure, including metrics for the average number of packets in and out, packet rate in and out, and byte rate in and out.
Use this dashboard to:
- Quickly identify if traffic sent and received rates for an EC2 instance is potentially causing a production issue.
- Determine if any improvements need to be made to your AWS networking infrastructure for optimal performance.
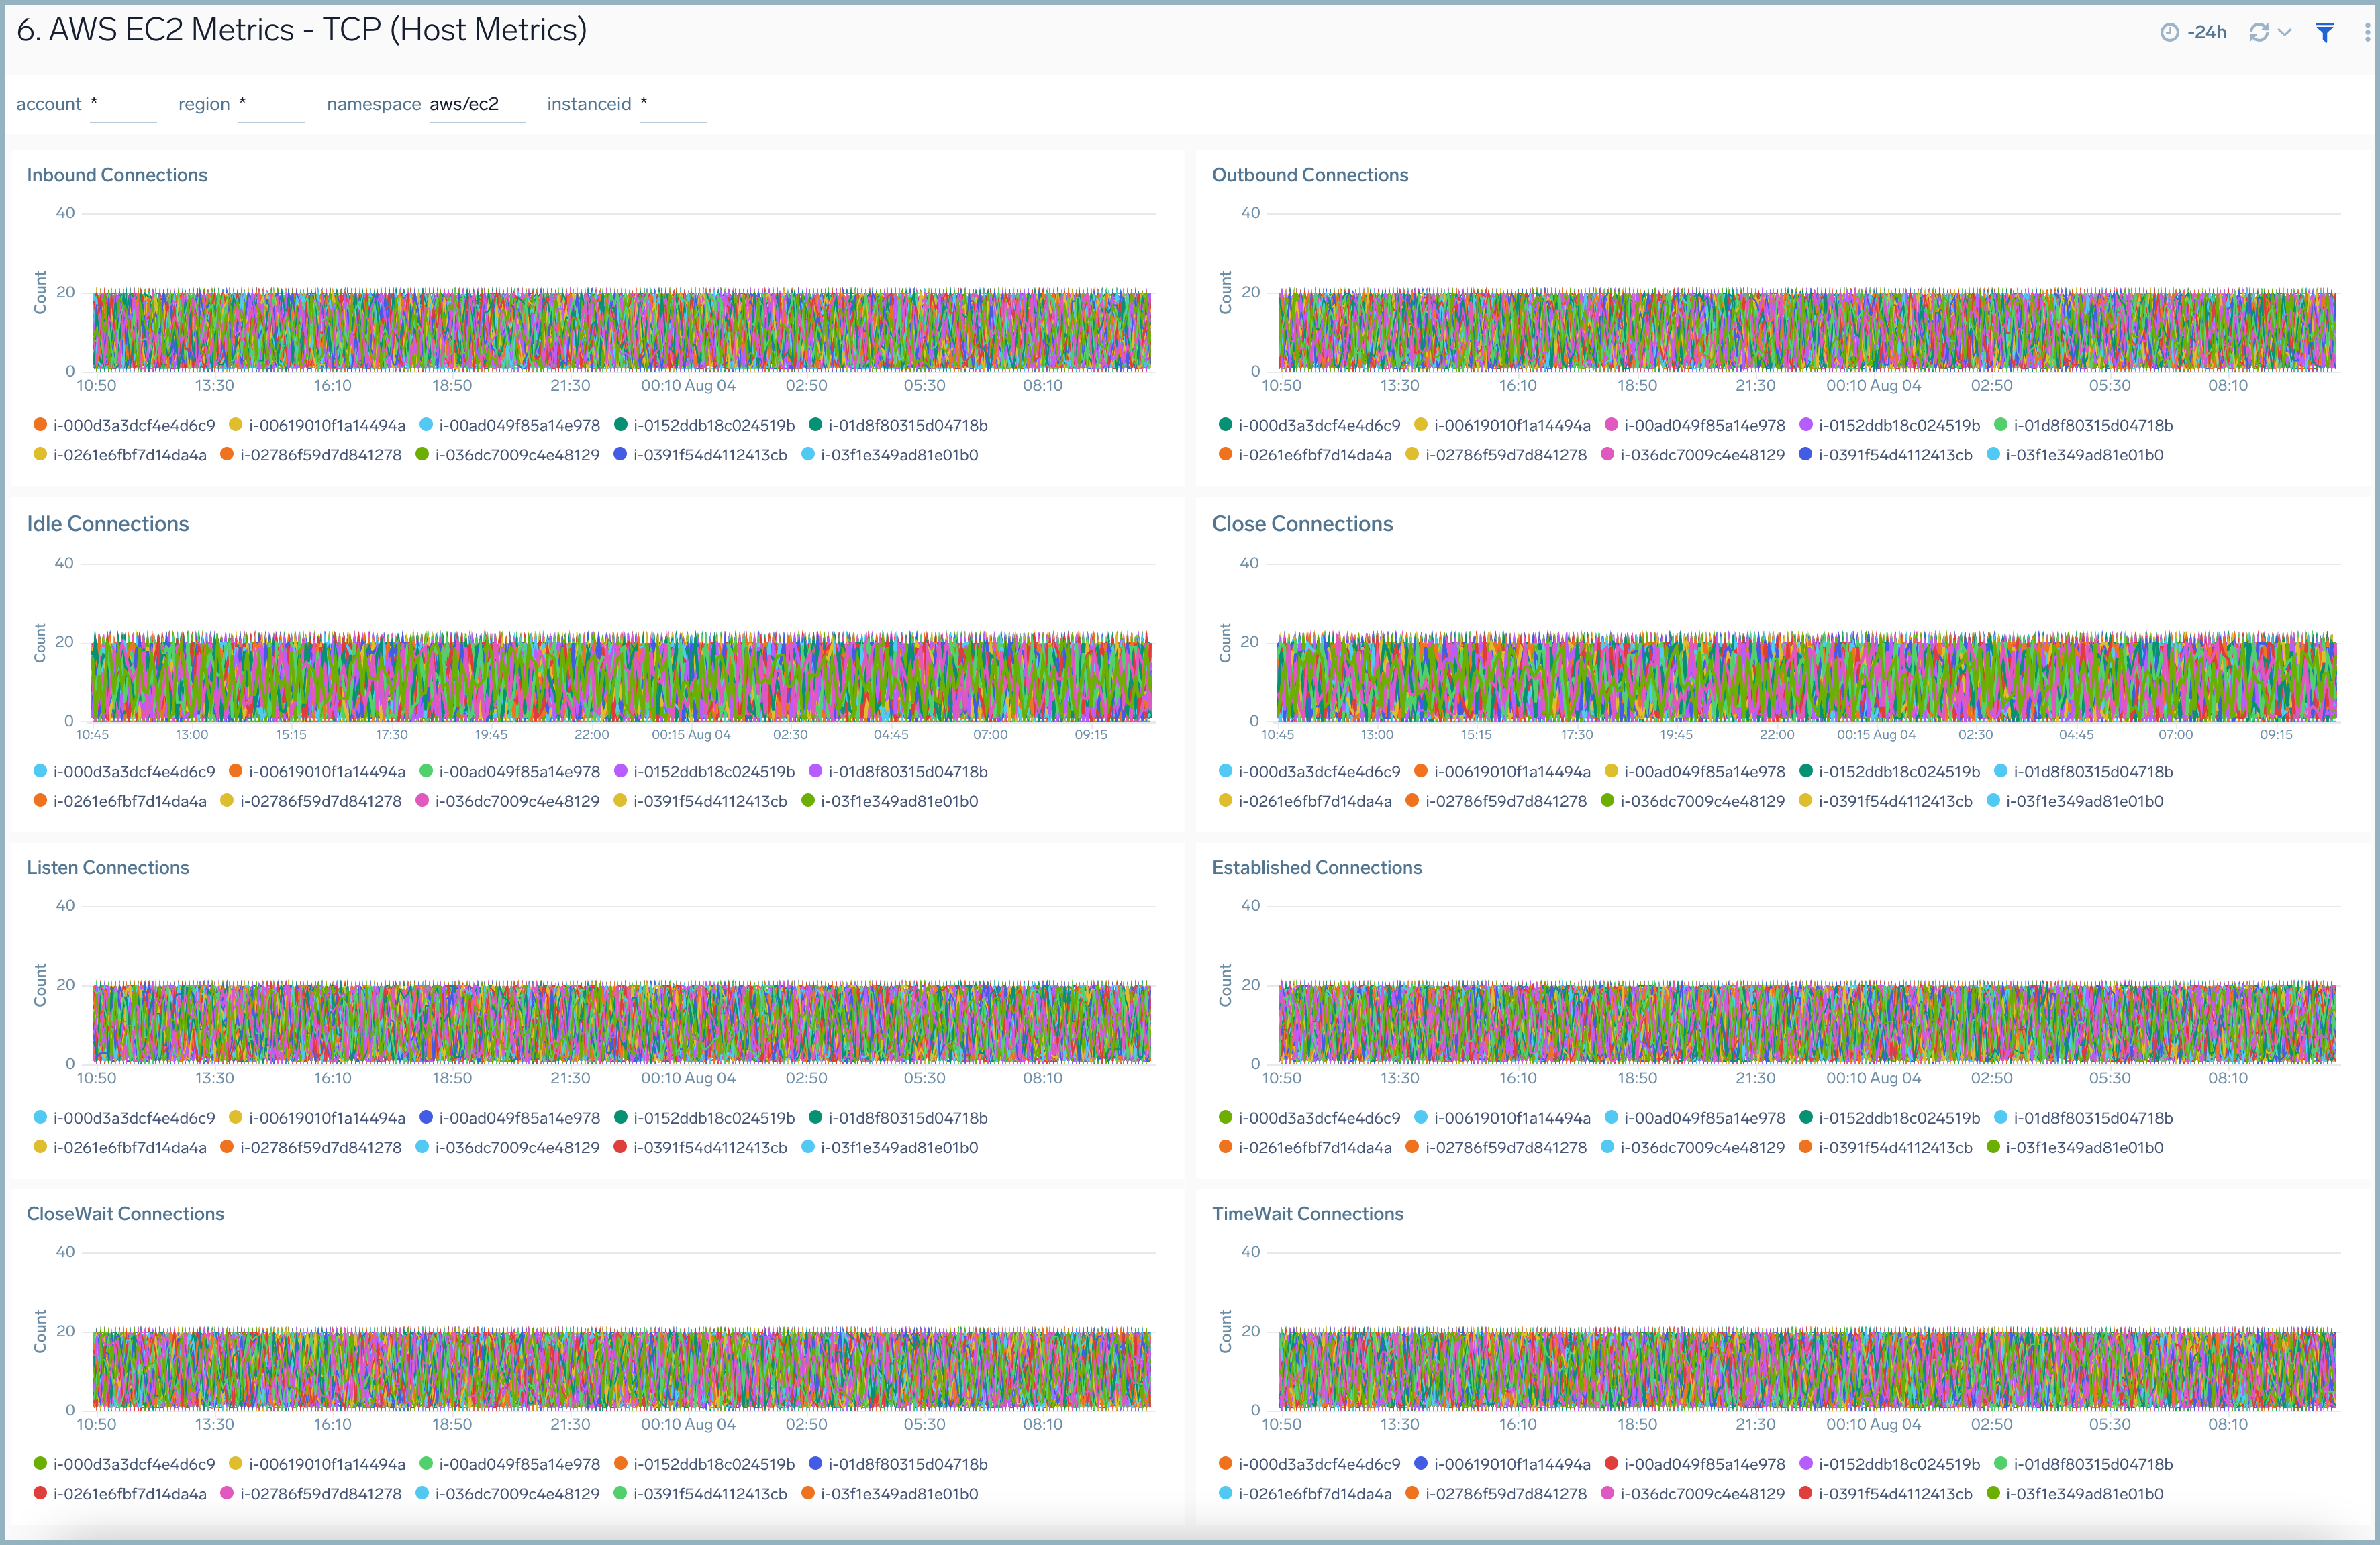
AWS EC2 - TCP (Host OS Metrics)
The AWS EC2 - TCP (Host OS Metrics) dashboard provides insights into TCP traffic performance per EC2 instance throughout your infrastructure, including metrics for inbound and outbound connections, listen and established connections, and close wait and time wait connections.
Use this dashboard to:
- Quickly identify if TCP traffic for an EC2 instance is potentially causing a production issue.
- Identify if any improvements need to be made to optimize TCP traffic by analyzing various TCP connection states.