Amazon EKS - Control Plane

Amazon Elastic Kubernetes Service (EKS) allows you to readily deploy, manage, and scale container-based applications with Kubernetes on AWS. The Sumo Logic app for Amazon EKS - Control Plane provides visibility into the EKS control plane with operational insights into the api server, scheduler, control manager, and worker nodes. The app’s preconfigured dashboards display resource-related metrics for Kubernetes deployments, clusters, namespaces, pods, containers, and daemonsets.
Prerequisites
The list of supported platforms can be found here.
Log types
The Amazon EKS - Control Plane app utilizes the following CloudWatch Logs:
- Kubernetes API server component logs (api). The cluster API server is the control plane component that exposes the Kubernetes API.
- Audit (audit). Kubernetes audit logs provide a record of the individual users, administrators, or system components that have affected your cluster.
- Authenticator (authenticator). Authenticator logs are unique to Amazon EKS. These logs represent the control plane component that Amazon EKS uses for Kubernetes Role Based Access Control (RBAC) authentication using IAM credentials.
- Controller manager (controllerManager). The controller manager manages the core control loops that are shipped with Kubernetes.
- Scheduler (scheduler). The scheduler component manages when and where to run pods in your cluster.
For more details about EKS logging, refer the Amazon documentation.
Sample log messages
{
   "timestamp":1561532751495,
   "message":{
   "kind":"Event",
   "apiVersion":"audit.k8s.io/v1beta1",
   "metadata":{
      "creationTimestamp":"2019-06-26T07:05:51Z"
   },
   "level":"Metadata",
   "timestamp":"2019-06-26T07:05:51Z",
   "auditID":"8c7f04e6-19ae-4b02-a3a1-c1e03bea7f98",
   "stage":"ResponseComplete",
   "requestURI":"/api/v1/namespaces/kube-system/secrets/kube-proxy-token-w7wkr",
   "verb":"get",
   "user":{
      "username":"system:apiserver",
      "uid":"bf2d8ee6-319d-4735-94a1-2903bcef27cf",
      "groups":[
         "system:masters"
      ]
   },
   "sourceIPs":[
      "127.0.0.1"
   ],
   "objectRef":{
      "resource":"secrets",
      "namespace":"kube-system",
      "name":"kube-proxy-token-w7wkr",
      "apiVersion":"v1"
   },
   "responseStatus":{
      "metadata":{
      },
      "code":200
   },
   "requestReceivedTimestamp":"2019-06-26T07:05:51.447627Z",
   "stageTimestamp":"2019-06-26T07:05:51.450399Z",
   "annotations":{
      "authorization.k8s.io/decision":"allow",
      "authorization.k8s.io/reason":""
   }
   }
}
{
   "timestamp":1561533513014,
   "message":"time=\"2019-06-26T07:18:27Z\" level=info msg=\"access granted\"
   arn=\"arn:aws:iam::956882708938:role/arun-k8s-worker-nodes-NodeInstanceRole-1Q2W9LCWIMWT3\"
   client=\"127.0.0.1:58464\" groups=\"[system:bootstrappers system:nodes]\" method=POST
   path=/authenticate uid=\"heptio-authenticator-aws:956882708938:AROA55SVHNHFL55HJ3F5S\"
   username=\"system:node:ip-192-168-222-214.ec2.internal\""
}
{
   "timestamp":1561543835000,
   "message":"I0626 10:10:35.292107   1 get.go:245] Starting watch for /api/v1/persistentvolumes,
   rv=4220807 labels= fields= timeout=5m2s"
}
{"timestamp":1561544407000,"message":"I0626 10:20:07.755497       1
cronjob_controller.go:173] Unable to update status for default/sumologic-k8s-api (rv = 6489402):
Operation cannot be fulfilled on cronjobs.batch \"sumologic-k8s-api\": the object has been modified;
please apply your changes to the latest version and try again"}
{"timestamp":1561106587000,"message":"I0621 08:43:07.395400       1
scheduler.go:197] Failed to schedule pod: hello-app/frontend-56f7975f44-8sgj7"}
Sample queries
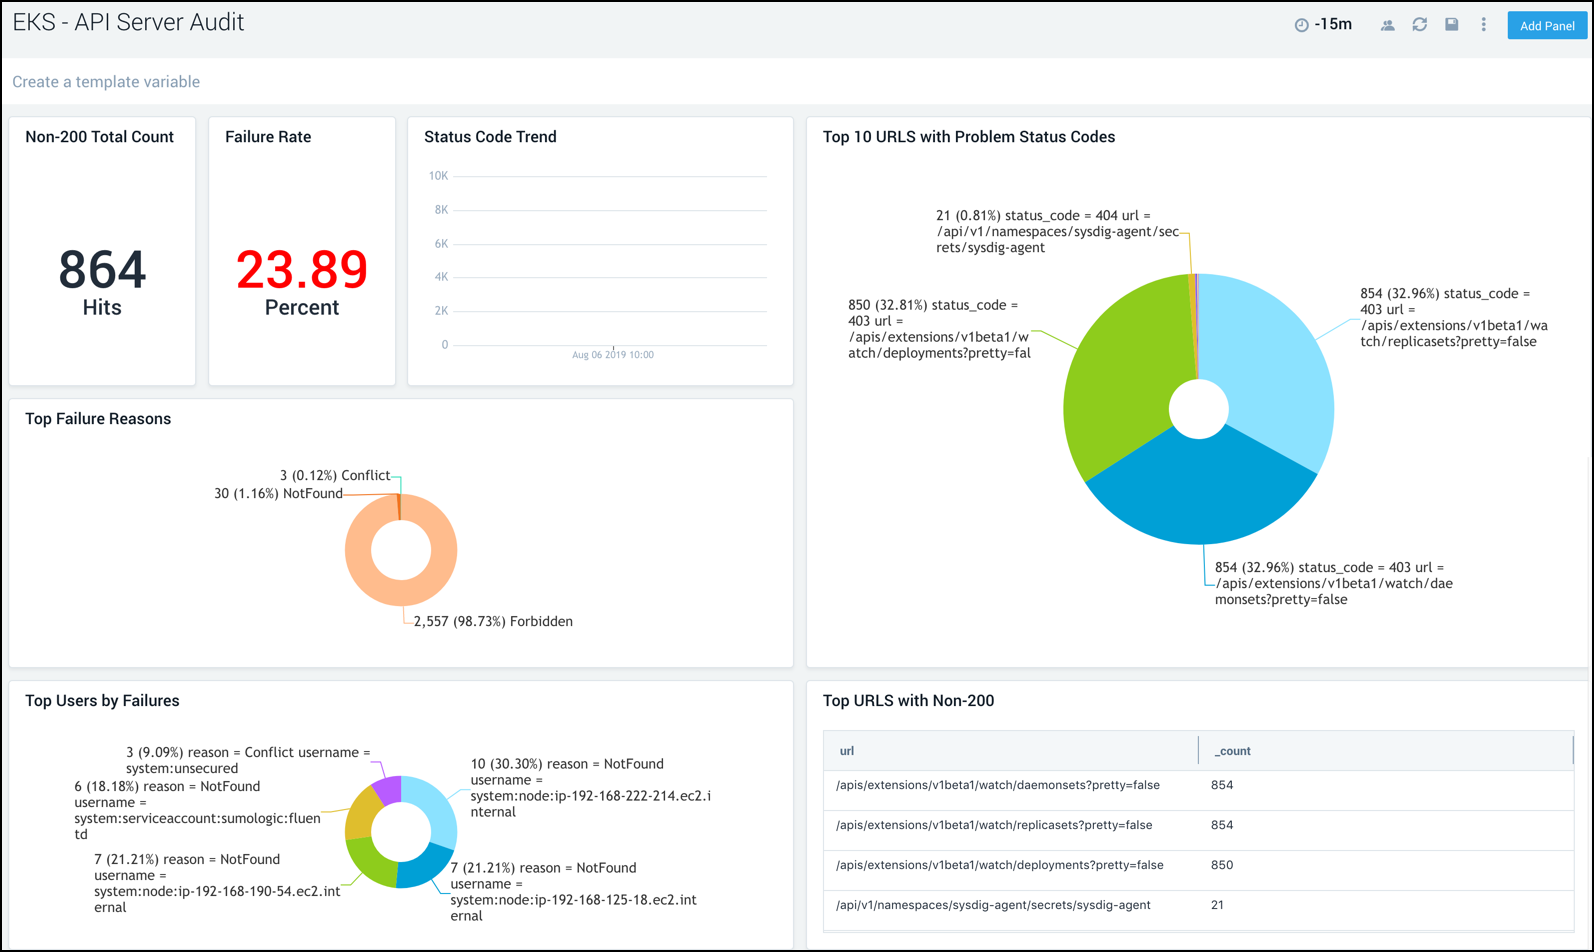
The following query sample is taken from the Top 10 URLs with Problem Status Codes panel on the EKS - API Server Audit Overview dashboard.
_sourceCategory = "EKS_LOGS"
and _sourceName = kube-apiserver-audit*
| json field=_raw "message.responseStatus.code" as status_code
| json field=_raw "message.verb" as method
| json field=_raw "message.requestURI" as url
| json field=_raw "message.objectRef.resource" as k8_resource
| json field=_raw "message.sourceIPs" as ip
| where !(status_code matches "2*")
| count as urls_by_status by status_code, url
| sort by urls_by_status
| limit 10
Collecting logs and metrics for the Amazon EKS - Control Plane app
This section has instructions for collecting logs and metrics for the Sumo app for Amazon EKS - Control Plane. This is a two step process:
- Setting up collection and installing the Sumo Logic Kubernetes app.
- Configuring CloudWatch log collection.
The Sumo Logic Kubernetes app allows you to monitor worker node logs, as well as metrics for the EKS master and worker nodes.
Step 1. Set up and install the Kubernetes app
The Sumo Logic Kubernetes app provides the services for managing and monitoring Kubernetes worker nodes. You must set up collection and install the Kubernetes app before configuring collection for the EKS - Control Plane app. You will configure log and metric collection during this process.
To set up and install the Kubernetes app, follow the instructions in this document.
Step 2. Configure CloudWatch log collection
To configure Amazon CloudWatch log collection, do the following:
- Follow the instructions for Collecting Amazon CloudWatch Logs.
- Refer to Amazon EKS Logs for Amazon specific details.
Installing the Amazon EKS - Control Plane app
Now that you have set up collection for EKS, install the Sumo Logic app for EKS - Control Plane to use the pre-configured Kubernetes dashboards that provide visibility into your EKS environment.
To install the app:
- Select App Catalog.
- In the 🔎 Search Apps field, run a search for your desired app, then select it.
- Click Install App.
note
Sometimes this button says Add Integration.
- On the next configuration page, under Select Data Source for your App, complete the following fields:
- Data Source. Select one of the following options:
- Choose Source Category and select a source category from the list; or
- Choose Enter a Custom Data Filter, and enter a custom source category beginning with an underscore. For example,
_sourceCategory=MyCategory.
- Folder Name. You can retain the existing name or enter a custom name of your choice for the app.
- All Folders (optional). The default location is the Personal folder in your Library. If desired, you can choose a different location and/or click New Folder to add it to a new folder.
- Data Source. Select one of the following options:
- Click Next.
- Look for the dialog confirming that your app was installed successfully.
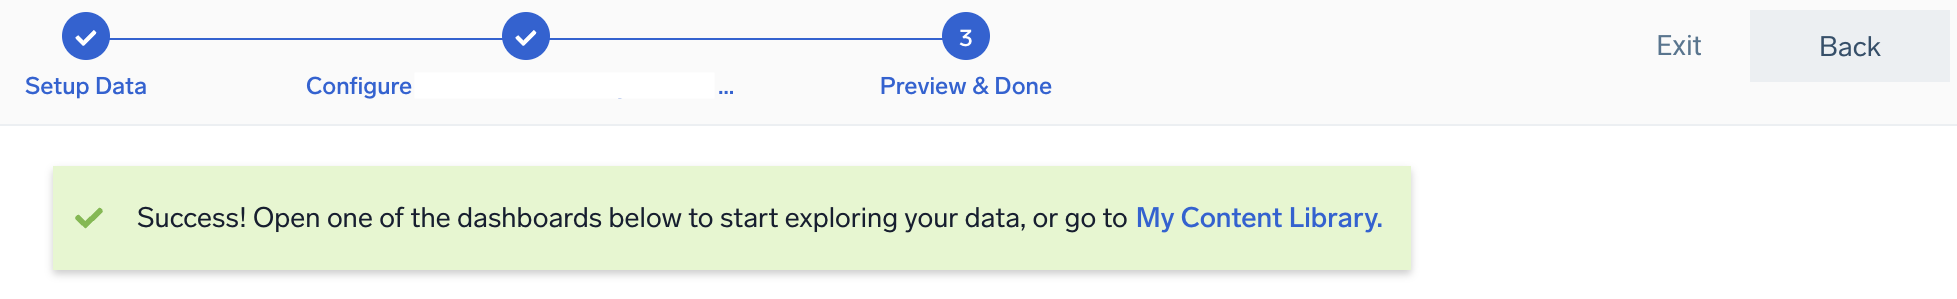
Post-installation
Once your app is installed, it will appear in your Personal folder or the folder that you specified. From here, you can share it with other users in your organization. Dashboard panels will automatically start to fill with data matching the time range query received since you created the panel. Results won't be available immediately, but within about 20 minutes, you'll see completed graphs and maps.
All the dashboards are linked to the monitoring dashboards so they can be easily accessed.
Viewing Dashboards for Amazon EKS - Control Plane
Template variables provide dynamic dashboards that rescope data on the fly. As you apply variables to troubleshoot through your dashboard, you can view dynamic changes to the data for a fast resolution to the root cause. You can use template variables to drill down and examine the data on a granular level. For more information, see the Filter with template variables help page.
API Server Audit
The EKS - API Server Audit dashboard displays information on Kubernetes audit logs. Panels provide records of individual users, administrators, or system components affected by your cluster.
Use this dashboard to:
- Monitor the health and performance of the API server.
- Review failure rates, reasons, and user failures.
- Review status code trends and the top URLs with problem status codes.
- Review overall user activity.
- Review the total number of successful hits and the top URLs.
- Review requests by stage and audit policy.
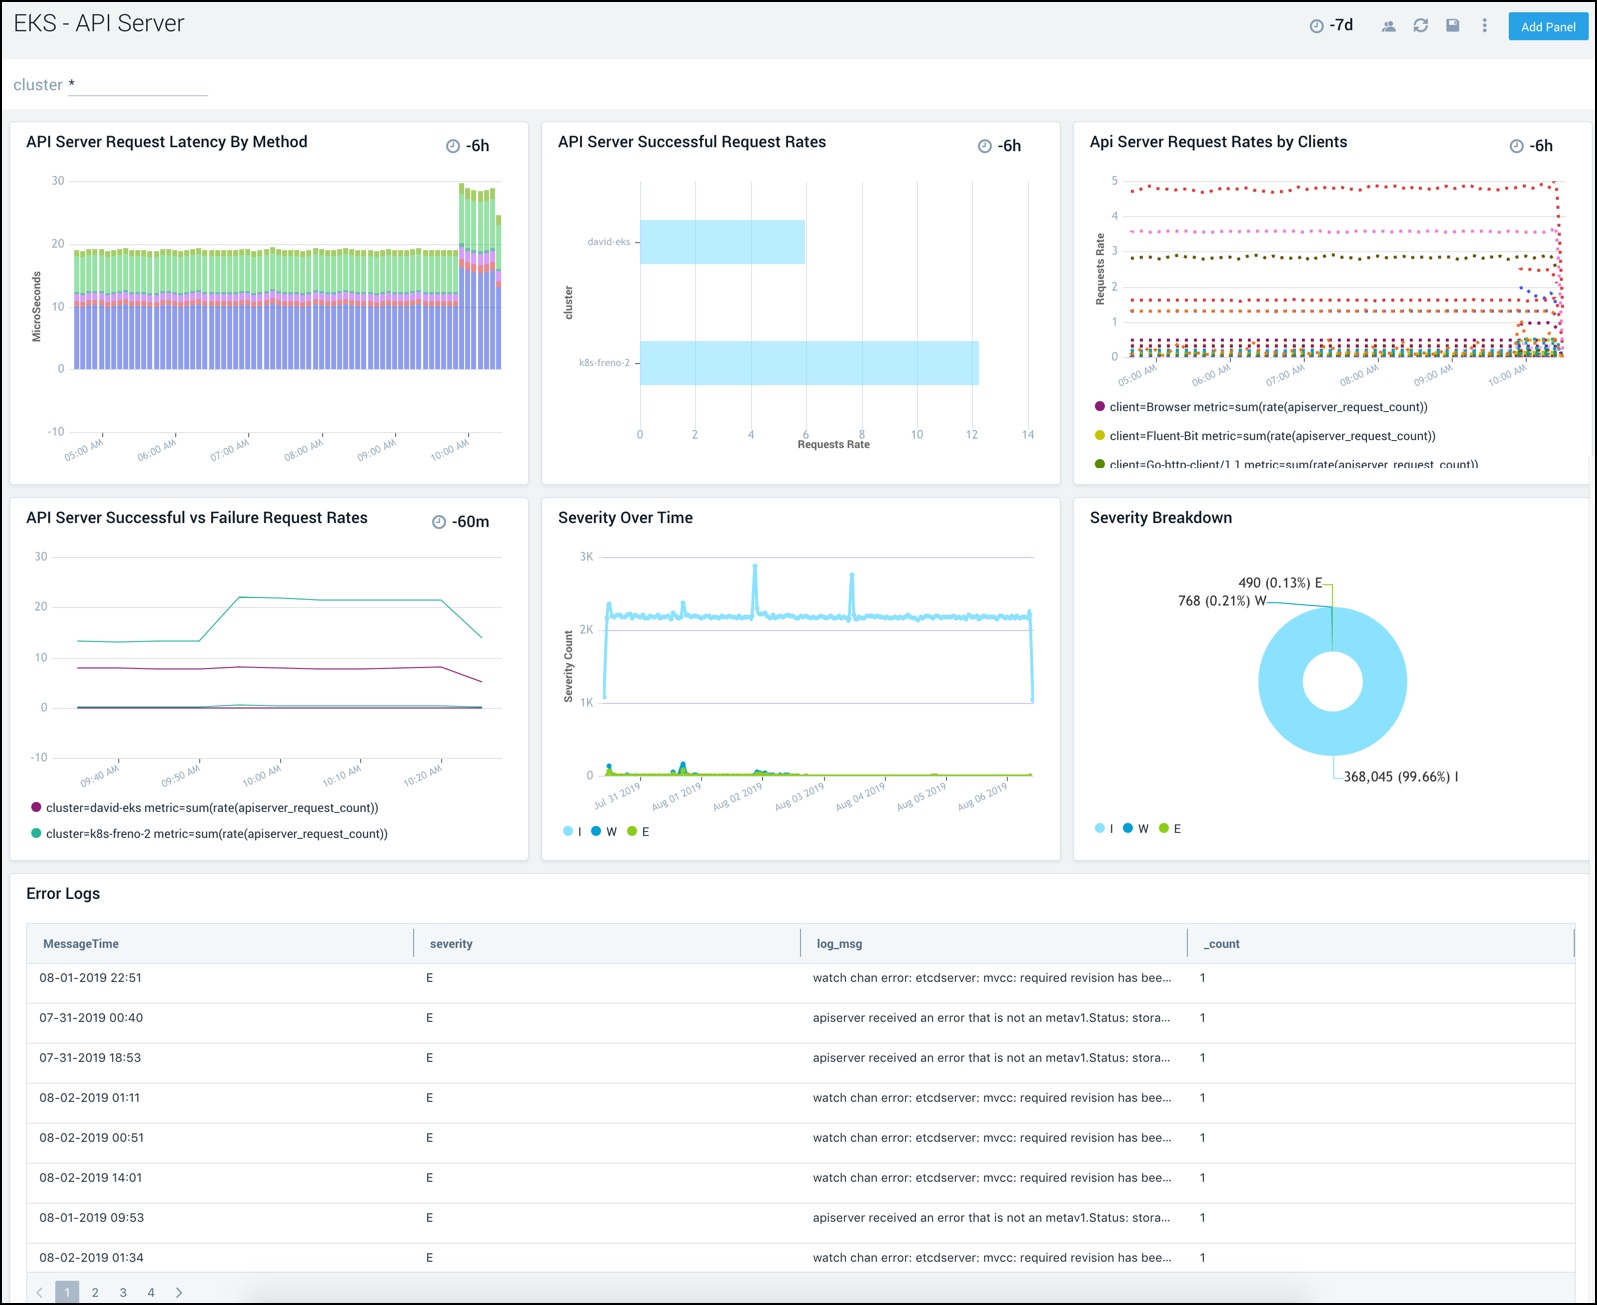
API Server
The EKS - API Server dashboard displays information on the API server logs, the control plane component that exposes the Kubernetes API. Panels show details on the API server errors, warnings, and activities.
Use this dashboard to:
- Monitor API server latency.
- Monitor API server successful request rates.
- Compare successful and failed API server request rates.
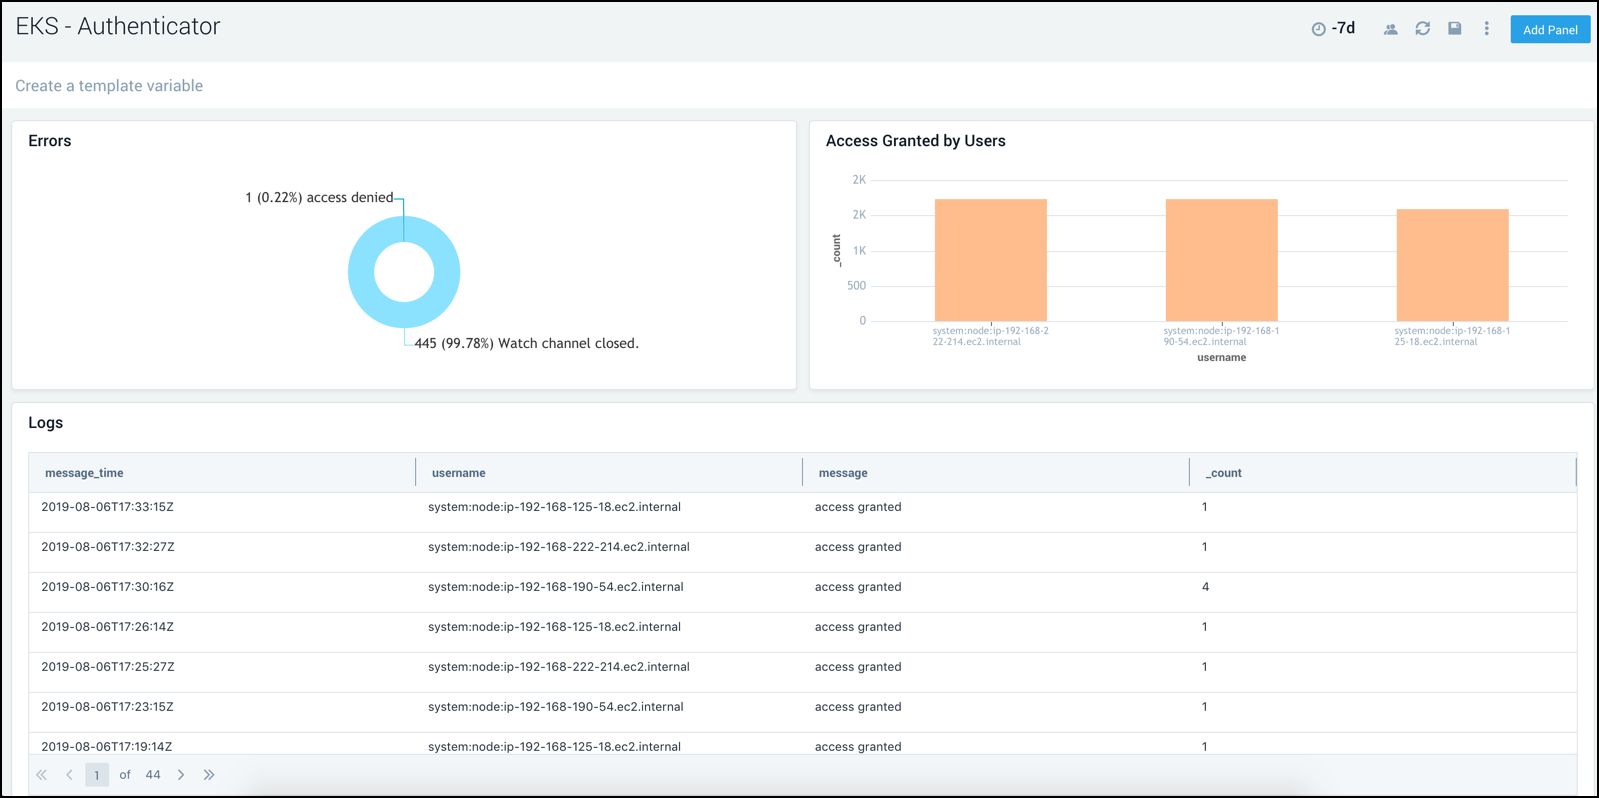
Authenticator
The EKS - Authenticator dashboard displays information on the Authenticator logs which are unique to Amazon EKS. Panels display logs that represent the control plane component Amazon EKS uses for Kubernetes Role Based Access Control (RBAC) authentication using IAM credentials. See also: Enabling IAM principal access to your cluster.
Use this dashboard to:
- Review authentication errors.
- Monitor successful user authentication rates.
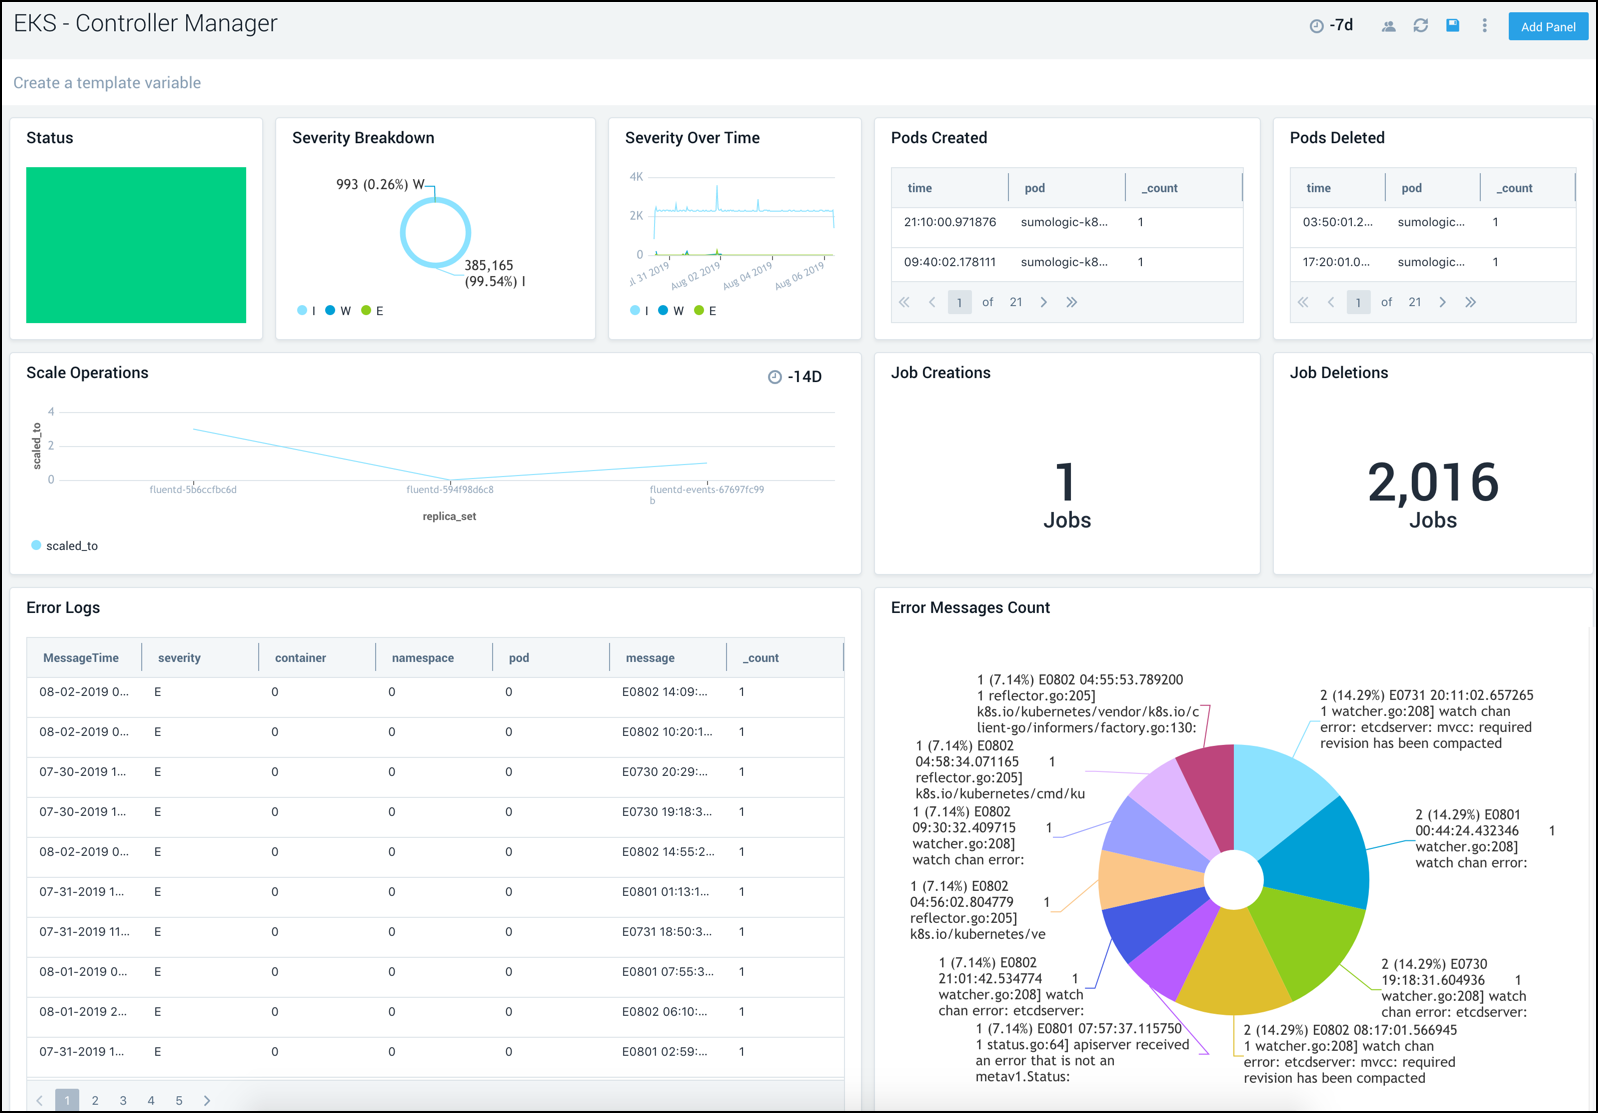
Controller Manager
The EKS - Controller Manager dashboard displays information on the controller manager, providing visibility into the core control loops for Kubernetes.
Use this dashboard to:
- Review resource modifications for pods and jobs.
- Review scaling operations and logs.
- Assess severity trends and error messages.
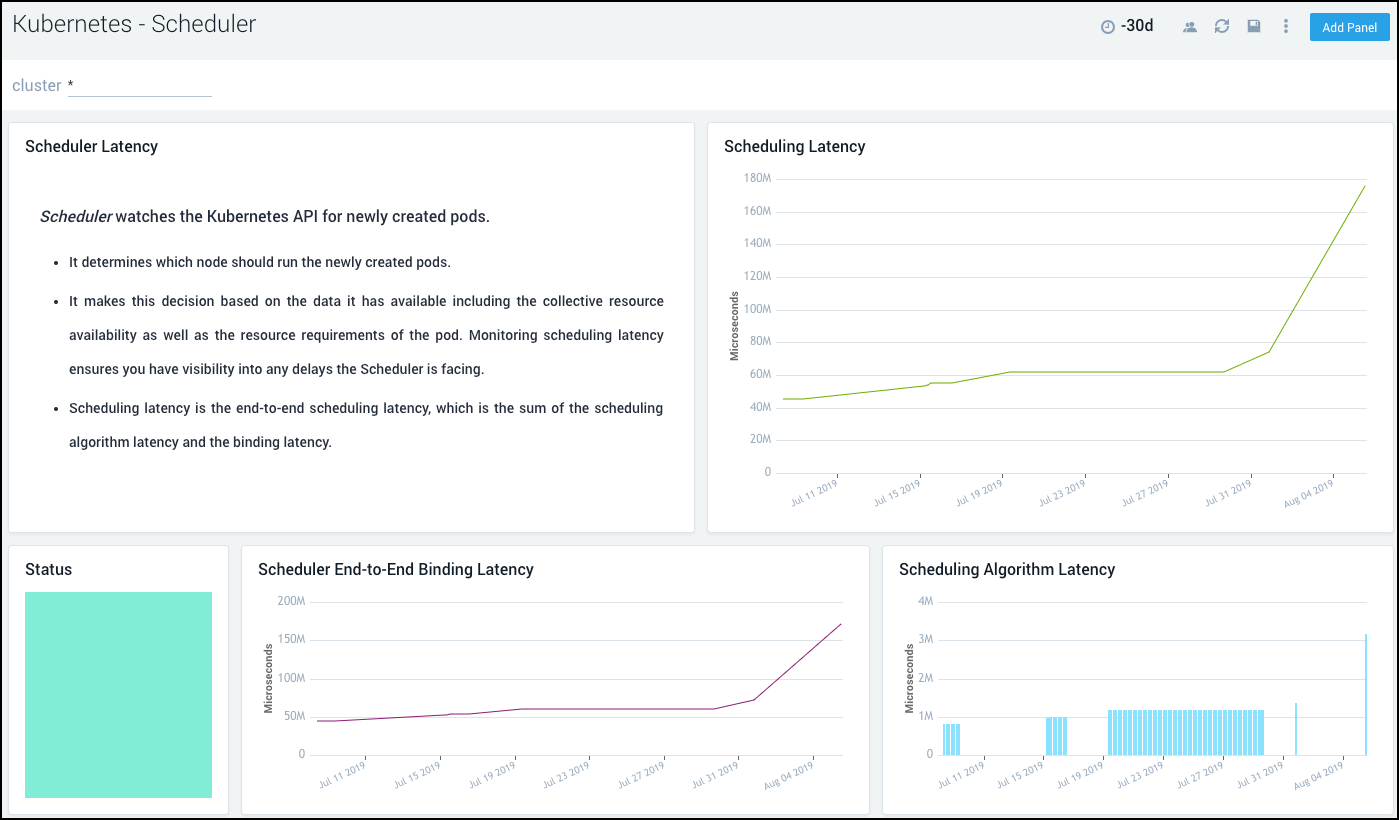
EKS - Scheduler
The EKS - Scheduler dashboard provides details of the scheduler health and latency details.
Use this dashboard to:
- Get an overview of scheduler health and status.
- Review scheduler latency details.