Amazon Elastic Container Service (ECS) using Container Insights and CloudWatch

Amazon Elastic Container Service (Amazon ECS) is a container management service that allows you to manage Docker containers on a cluster of Amazon EC2 instances. The Sumo Logic app for Amazon ECS provides preconfigured searches and Dashboards that allow you to monitor various metrics (CPU and Memory Utilization, CPU and Memory Reservation) across ECS clusters and services. The app also monitors API calls made by or on behalf of Amazon ECS in your AWS account.
We offer two different ECS versions, which have separate data collection steps:
- Collect Logs and Metrics for ECS. This version collects ECS CloudWatch Metrics and ECS Events using AWS CloudTrail. For instructions on collecting this data, refer to the Amazon Elastic Container Service (ECS).
- Collect Logs, Metrics (Container Insights+CloudWatch) and Traces for ECS. This version collects ECS CloudWatch Metrics, Container Insights Metrics, ECS Events using AWS CloudTrail, Application Logs and Traces. Metrics collected by Container Insights are charged as custom metrics. For more information about CloudWatch pricing, see Amazon CloudWatch Pricing. This solution enables you to monitor both ec2 and fargate based ecs deployments.
This page has instructions for collecting logs and metrics for the Amazon ECS app. It uses the following data:
- CloudWatch Metrics
- Container Insights Metrics
- AWS CloudTrail Events
- Container Insights Performance log Events
- ECS Application Logs
- Traces
Creating Fields in Field Schema
- Classic UI. In the main Sumo Logic menu, select Manage Data > Logs > Fields.
New UI. In the top menu select Configuration, and then under Logs select Fields. You can also click the Go To... menu at the top of the screen and select Fields. - Search for the following fields:
account,namespace,regionfield. - If not present, create it. Learn how to create and manage fields here.
Creating Field Extraction Rule(s)
Create Field Extraction Rule for CloudTrail Logs (learn more).
Rule Name: AwsObservabilityECSCloudTrailLogsFER
Applied at: Ingest Time
Scope (Specific Data):
account=* eventname eventsource "ecs.amazonaws.com"
Parse Expression:
| json "eventSource", "awsRegion", "requestParameters.tableName", "recipientAccountId" as eventSource, region, tablename, accountid nodrop
| where eventSource = "ecs.amazonaws.com"
| "aws/ecs" as namespace
| fields region, namespace, accountid
Create Field Extraction Rule for Container Insights Performance Events Logs of Task and Containers.
Rule Name: AwsObservabilityECSPerformanceEventsFER
Applied at: Ingest Time
Scope (Specific Data):
account=* (Task OR Container)
Parse Expression:
| json  "AccountID","Region", "Type" as accountid, region, Type nodrop
| where Type="Task" or Type="Container"
| "aws/ecs" as namespace
| fields region, namespace, accountid
Collect Metrics for Amazon ECS
Sumo Logic supports collecting metrics using two source types:
- Configure an AWS Kinesis Firehose for Metrics Source (recommended); or
- Configure an Amazon CloudWatch Source for Metrics
Namespace for Amazon Elastic Container Service (ECS) using Container Insights and CloudWatch service is AWS/ECS.
Metadata: Add an account field to the source and assign it a value which is a friendly name / alias to your AWS account from which you are collecting metrics. Metrics can be queried via the account field.
Collect Container Insights Metrics for Amazon ECS
When you enable Container Insights, CloudWatch collects additional metrics in the ECS/ContainerInsights namespace that describe the status of your ECS tasks, resource usage metrics and the number of running services, containers, and deployments.
In this step, you'll enable Container Insights and set up a collection to ingest those metrics.
- Enable Container Insights by referring to the AWS docs by using cli or AWS console.
- If Cloudwatch source is selected for collecting metrics, update the source created in "Collect Metrics for Amazon ECS" section to include
ECS/ContainerInsightsin custom namespaces field; or
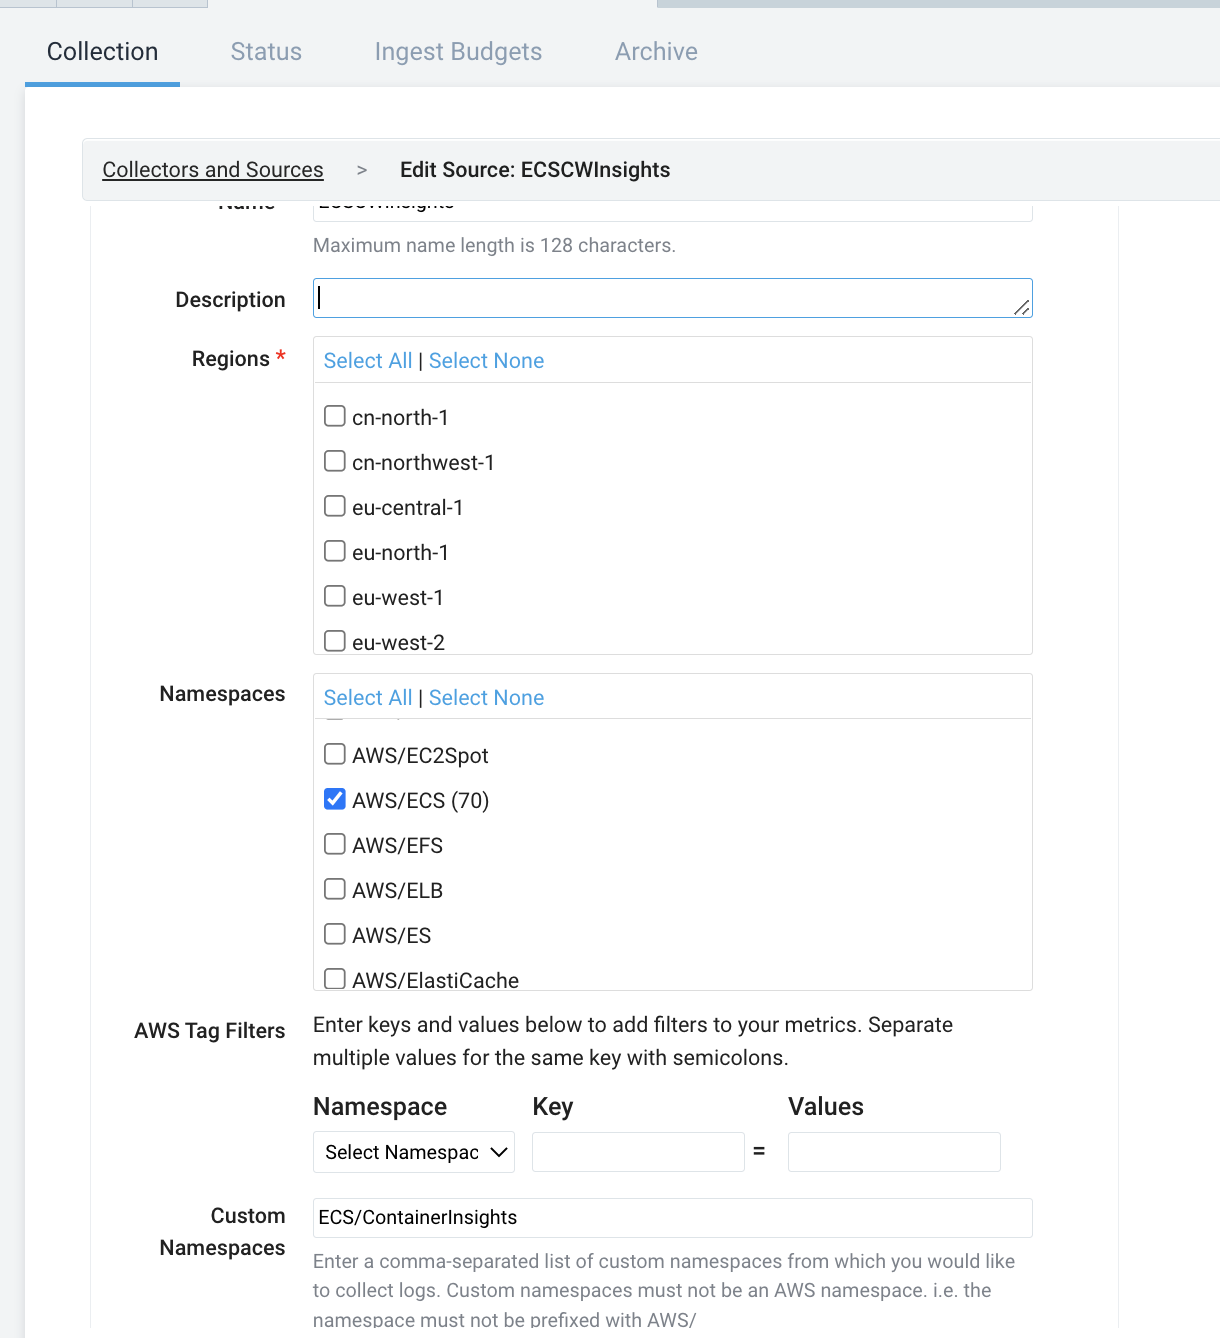
- If Kinesis Firehose source is selected for collecting metrics, update the Metrics Stream to include
ECS/ContainerInsightsin custom namespaces field.
Collect ECS events using CloudTrail
To set up an AWS CloudTrail Source to collect ECS events:
- Configure CloudTrail in your AWS account. This will create an S3 bucket, if you so choose.
- Grant Sumo Logic access to the Amazon S3 bucket.
- Confirm that logs are being delivered to the Amazon S3 bucket.
- Classic UI. In the main Sumo Logic menu, select Manage Data > Collection > Collection.
New UI. In the Sumo Logic top menu select Configuration, and then under Data Collection select Collection. You can also click the Go To... menu at the top of the screen and select Collection. - Navigate to the hosted collector you configured above and select Add > Add Source.
- Select AWS CloudTrail source.
- Name. Enter a name to display the new Source.
- Description. Enter an optional description.
- S3 Region. Select the Amazon Region for your ECS S3 bucket.
- Bucket Name. Enter the exact name of your ECS S3 bucket.
- Path Expression. Enter the string that matches the S3 objects you'd like to collect. You can use a wildcard (
*) in this string. (DO NOT use a leading forward slash. See Amazon Path Expressions.) - Source Category. Enter
aws/observability/cloudtrail/logs. - Fields. Add an account field and assign it a value that is a friendly name/alias to your AWS account from which you are collecting logs. Logs can be queried via the "account field".
- AWS Access. There are two options for AWS access:
- Role-based access. This is the preferred method. You can use this option if you granted access to Amazon ECS as described in Grant Access to an AWS Product. For Role-based access enter the Role ARN that was provided by AWS after creating the role.
- For Key access enter the Access Key ID and Secret Access Key. For more information, see Managing Access Keys for IAM Users in AWS help.
- Scan Interval. Use the default of 5 minutes. Alternately, enter the frequency Sumo Logic will scan your S3 bucket for new data.
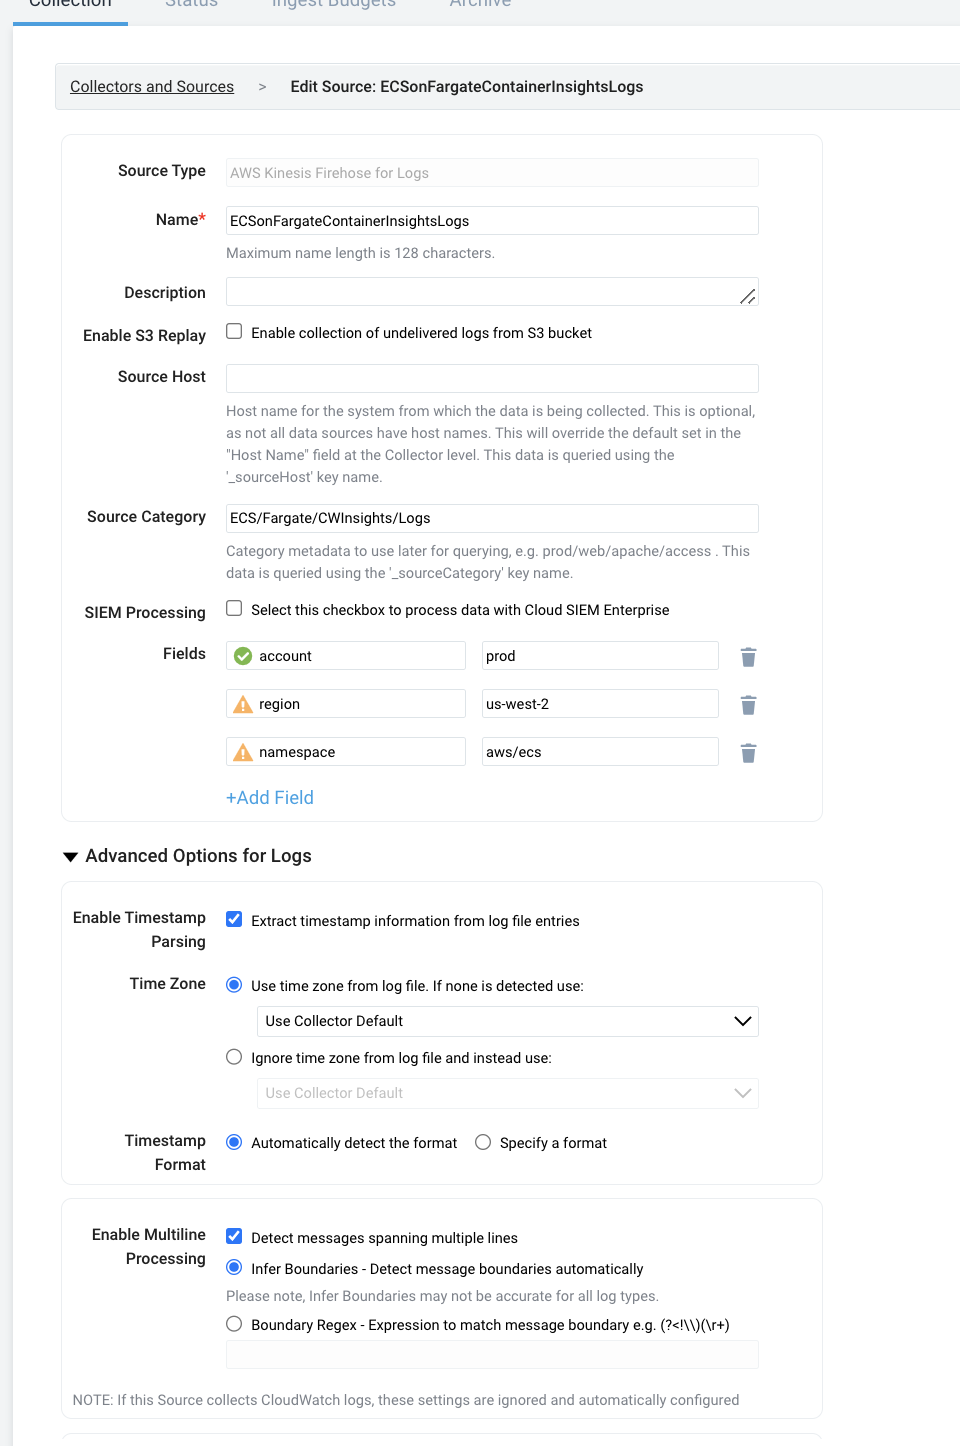
- Enable Timestamp Parsing. Select the Extract timestamp information from log file entries check box.
- Time Zone. Select Ignore time zone from the log file and instead use, and select UTC from the dropdown.
- Timestamp Format. Select Automatically detect the format.
- Enable Multiline Processing. Select the Detect messages spanning multiple lines check box, and select Infer Boundaries.
- Click Save.

Centralized AWS CloudTrail Log Collection
In case you have a centralized collection of CloudTrail logs and are ingesting them from all accounts into a single Sumo Logic CloudTrail log source, create or update the following Field Extraction Rule to map proper AWS account(s) friendly name/alias:
Rule Name: AWS Accounts
Applied at: Ingest Time
Scope (Specific Data):
_sourceCategory=aws/observability/cloudtrail/logs
Parse Expression
Enter a parse expression to create an account field that maps to the alias you set for each sub-account. For example, if you used the dev alias for an AWS account with ID 528560886094 and the prod alias for an AWS account with ID 567680881046, your parse expression would look like this:
| json "recipientAccountId"
// Manually map your aws account id with the AWS account alias you setup earlier for individual child account
| "" as account
| if (recipientAccountId = "528560886094",  "dev", account) as account
| if (recipientAccountId = "567680881046",  "prod", account) as account
| fields account
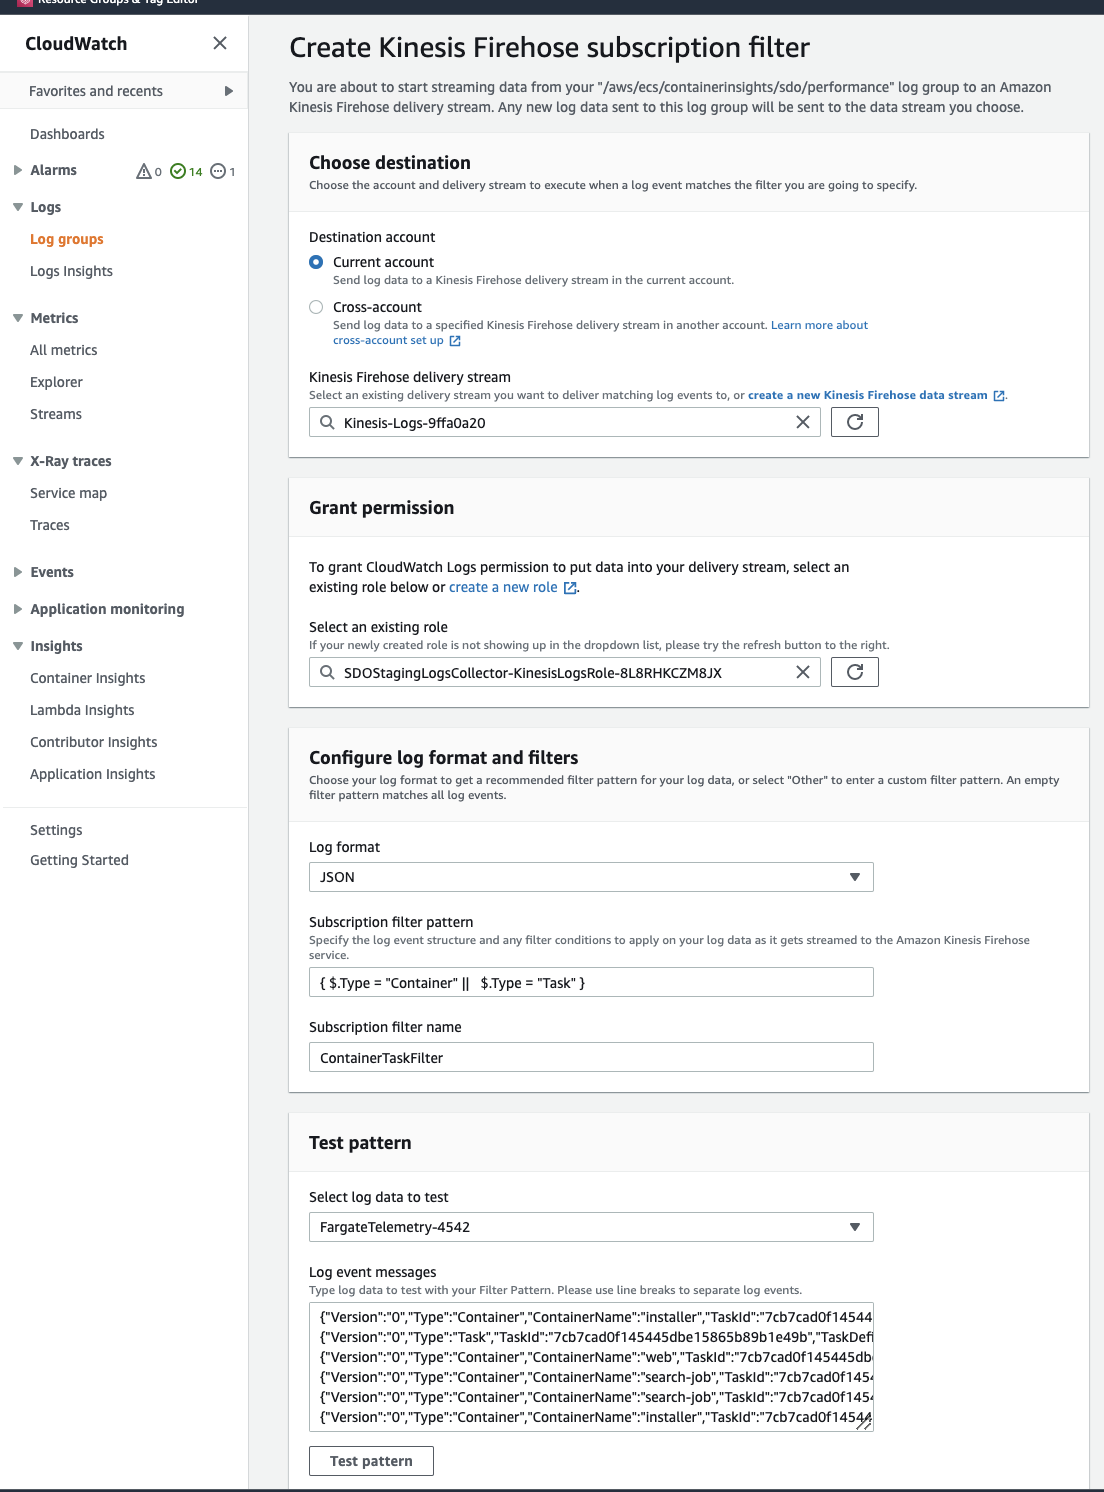
Collect Container Insights performance log events for Task and Container
Container Insights collects data as performance log events using embedded metric format. More details here.
In this step, you'll create a source to collect Task and Container level performance events, which are not converted as CloudWatch metrics.
- Configure an AWS Kinesis Firehose for Logs Source. Add the fields account, region and namespace as shown below.
- Copy the
KinesisLogsRoleARNandKinesisLogsDeliveryStreamARNvalues from the outputs tab of Cloudformation.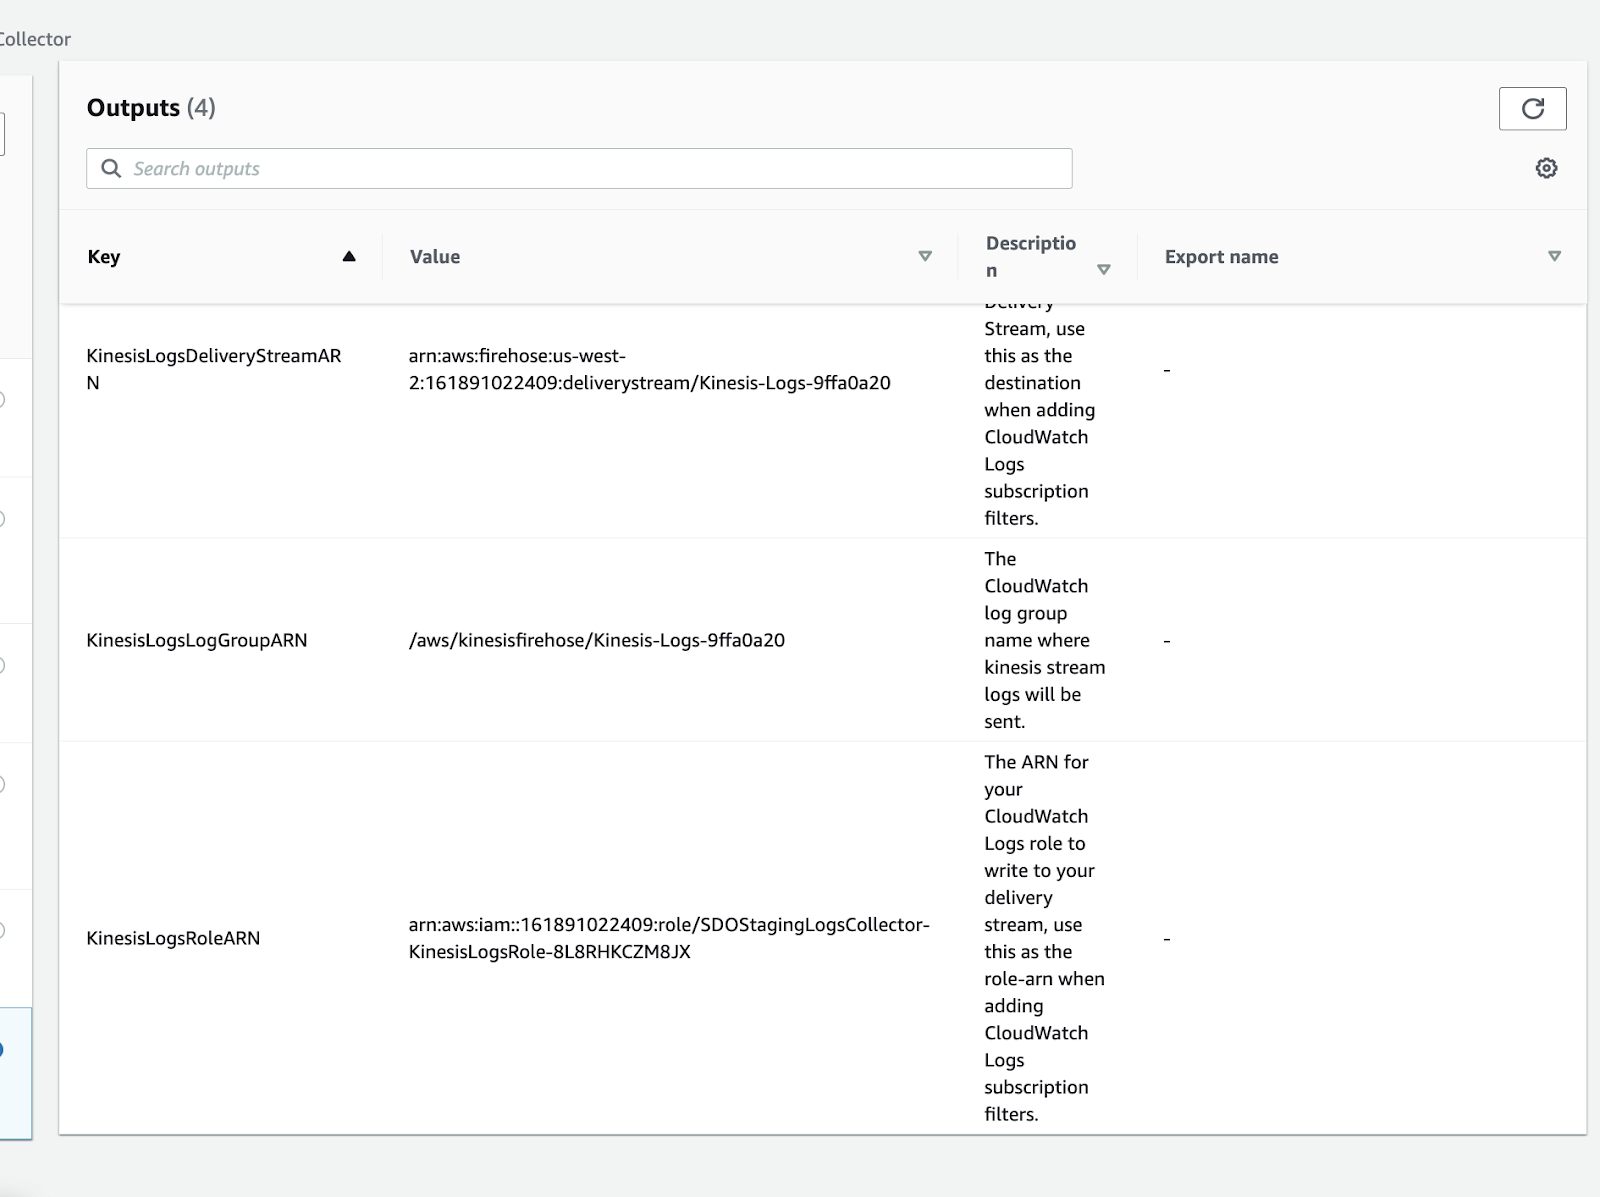
- Go to your CloudWatch > Log Groups and click on your CloudWatch log group
/aws/ecs/containerinsights/<cluster>/performance.
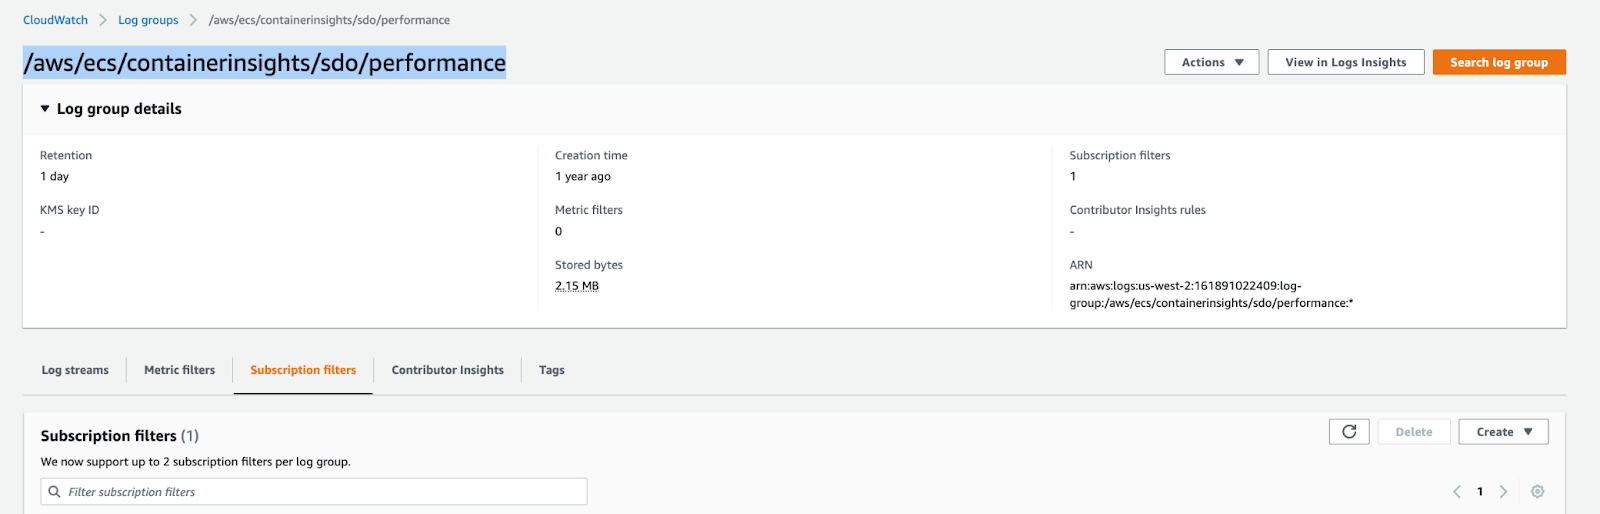
- Click on Create and in opened window fill in the below parameters
- Get the delivery stream name from the arn copied in step 2 and fill in the KinesisLogsDeliverStream field.
- Get the role name from the arn copied in step 2 and fill in the role.
- Specify the filter pattern
{ $.Type = "Container" || $.Type = "Task" }. - Specify the filter name.
- Test the pattern and click Start streaming.
Collect Application Logs for Amazon ECS
Set up the Container logs collection using the steps in following docs. You can use awsfirelens driver and avoid sending logs to CloudWatch log groups. Put account, region and namespace fields also while configuring the source.
If your logs are already going to CloudWatch logs groups then you can create a subscription filter to subscribe the log groups to the delivery stream created in the previous step.
Application logs do not contain regions. You have to configure a new Sumo Logic source for each region if you want to avoid creating multiple sources, then you will have to put the X-SUMO-Fields header inside logConfiguration by creating a custom fluent bit image and specify a custom fluent bit configuration.
For more information, see, Create a custom Fluent Bit image.
Collect Traces for Amazon ECS
To set up collection for traces:
- Create a HTTP Traces source by referring to the docs.
- Install OpenTelemetry Collector by referring to the docs.
Sample log messages
Click to expand.
{
  "eventVersion":"1.04",
  "userIdentity":{
    "type":"AssumedRole",
    "principalId":"ADFDDDFF7FDF7GFFF2DF0:i-76vfa923",
    "arn":"arn:aws:sts::435456556566:assumed-role/ecsInstanceRole/i-76vfa923",
    "accountId":"435456556566",
    "accessKeyId":"AOFGPJFIJFFOIJFIOJHF",
    "sessionContext":{
      "attributes":{
        "mfaAuthenticated":"false",
        "creationDate":"2017-10-02T20:08:54.107Z"
      },
      "sessionIssuer":{
        "type":"Role",
        "principalId":"ADFDDDFF7FDF7GFFF2DF0",
        "arn":"arn:aws:iam::435456556566:role/ecsInstanceRole",
        "accountId":"435456556566",
        "userName":"kevin"
      }
    }
  },
  "eventTime":"2017-10-02T20:08:54.107Z",
  "eventSource":"ecs.amazonaws.com",
  "eventName":"RegisterTaskDefinition",
  "awsRegion":"us-west-1",
  "sourceIPAddress":"73.168.34.72",
  "userAgent":"Amazon ECS Agent - v1.12.2 (ecda8a6) (+http://aws.amazon.com/ecs/)",
  "requestParameters":{
    "attributes":[
      {
        "name":"com.amazonaws.ecs.capability.privileged-container"
      },
      {
        "name":"com.amazonaws.ecs.capability.docker-remote-api.1.17"
      },
      {
        "name":"com.amazonaws.ecs.capability.docker-remote-api.1.18"
      },
      {
        "name":"com.amazonaws.ecs.capability.docker-remote-api.1.19"
      },
      {
        "name":"com.amazonaws.ecs.capability.docker-remote-api.1.20"
      },
      {
        "name":"com.amazonaws.ecs.capability.docker-remote-api.1.21"
      },
      {
        "name":"com.amazonaws.ecs.capability.docker-remote-api.1.22"
      },
      {
        "name":"com.amazonaws.ecs.capability.logging-driver.json-file"
      },
      {
        "name":"com.amazonaws.ecs.capability.logging-driver.syslog"
      },
      {
        "name":"com.amazonaws.ecs.capability.logging-driver.awslogs"
      },
      {
        "name":"com.amazonaws.ecs.capability.ecr-auth"
      },
      {
        "name":"com.amazonaws.ecs.capability.task-iam-role"
      },
      {
        "name":"com.amazonaws.ecs.capability.task-iam-role-network-host"
      }
    ],
    "totalResources":[
      {
        "type":"INTEGER",
        "doubleValue":0.0,
        "integerValue":1024,
        "longValue":0,
        "name":"CPU"
      },
      {
        "type":"INTEGER",
        "doubleValue":0.0,
        "integerValue":995,
        "longValue":0,
        "name":"MEMORY"
      },
      {
        "type":"STRINGSET",
        "stringSetValue":[
          "22",
          "2375",
          "2376",
          "51678",
          "51679"
        ],
        "doubleValue":0.0,
        "integerValue":0,
        "longValue":0,
        "name":"PORTS"
      },
      {
        "type":"STRINGSET",
        "stringSetValue":[

        ],
        "doubleValue":0.0,
        "integerValue":0,
        "longValue":0,
        "name":"PORTS_UDP"
      }
    ],
    "instanceIdentityDocumentSignature":"pqWe1trtreertermhC6vz\nZ0e/ZyOVVKXOb0fiiouyuyturtyreuFaoghqQ0wWurXzcHb6CrtreyteV6hPM=",
    "cluster":"graphite",
    "instanceIdentityDocument":"{\n  \"privateIp\" : \"10.0.1.83\",\n  \"devpayProductCodes\" : null,\n  \"availabilityZone\" : \"us-west-1c\",\n  \"accountId\" : \"435456556566\",\n  \"version\" : \"2010-08-31\",\n  \"instanceId\" : \"i-76vfa923\",\n  \"billingProducts\" : null,\n  \"instanceType\" : \"t2.micro\",\n  \"imageId\" : \"ami-444d0224\",\n  \"pendingTime\" : \"2016-11-15T21:07:08Z\",\n  \"architecture\" : \"x86_64\",\n  \"kernelId\" : null,\n  \"ramdiskId\" : null,\n  \"region\" : \"us-west-1\"\n}"
  },
  "responseElements":{
    "containerInstance":{
      "versionInfo":{

      },
      "runningTasksCount":0,
      "ec2InstanceId":"i-13dcar4566",
      "remainingResources":[
        {
          "type":"INTEGER",
          "doubleValue":0.0,
          "integerValue":1024,
          "longValue":0,
          "name":"CPU"
        },
        {
          "type":"INTEGER",
          "doubleValue":0.0,
          "integerValue":995,
          "longValue":0,
          "name":"MEMORY"
        },
        {
          "type":"STRINGSET",
          "stringSetValue":[
            "22",
            "2376",
            "2375",
            "51678",
            "51679"
          ],
          "doubleValue":0.0,
          "integerValue":0,
          "longValue":0,
          "name":"PORTS"
        },
        {
          "type":"STRINGSET",
          "stringSetValue":[

          ],
          "doubleValue":0.0,
          "integerValue":0,
          "longValue":0,
          "name":"PORTS_UDP"
        }
      ],
      "agentConnected":true,
      "pendingTasksCount":0,
      "registeredResources":[
        {
          "type":"INTEGER",
          "doubleValue":0.0,
          "integerValue":1024,
          "longValue":0,
          "name":"CPU"
        },
        {
          "type":"INTEGER",
          "doubleValue":0.0,
          "integerValue":995,
          "longValue":0,
          "name":"MEMORY"
        },
        {
          "type":"STRINGSET",
          "stringSetValue":[
            "22",
            "2376",
            "2375",
            "51678",
            "51679"
          ],
          "doubleValue":0.0,
          "integerValue":0,
          "longValue":0,
          "name":"PORTS"
        },
        {
          "type":"STRINGSET",
          "stringSetValue":[

          ],
          "doubleValue":0.0,
          "integerValue":0,
          "longValue":0,
          "name":"PORTS_UDP"
        }
      ],
      "containerInstanceArn":"arn:aws:ecs:us-west-1:435456556566:container-instance/3f28c319-u9n2-1476-3d2n-b7c254fv411",
      "attributes":[
        {
          "name":"com.amazonaws.ecs.capability.privileged-container"
        },
        {
          "name":"com.amazonaws.ecs.capability.docker-remote-api.1.17"
        },
        {
          "name":"com.amazonaws.ecs.capability.docker-remote-api.1.18"
        },
        {
          "name":"com.amazonaws.ecs.capability.docker-remote-api.1.19"
        },
        {
          "name":"com.amazonaws.ecs.capability.docker-remote-api.1.20"
        },
        {
          "name":"com.amazonaws.ecs.capability.docker-remote-api.1.21"
        },
        {
          "name":"com.amazonaws.ecs.capability.docker-remote-api.1.22"
        },
        {
          "name":"com.amazonaws.ecs.capability.logging-driver.json-file"
        },
        {
          "name":"com.amazonaws.ecs.capability.logging-driver.syslog"
        },
        {
          "name":"com.amazonaws.ecs.capability.logging-driver.awslogs"
        },
        {
          "name":"com.amazonaws.ecs.capability.ecr-auth"
        },
        {
          "name":"com.amazonaws.ecs.capability.task-iam-role"
        },
        {
          "name":"com.amazonaws.ecs.capability.task-iam-role-network-host"
        }
      ],
      "status":"ACTIVE",
      "version":1
    }
  },
  "requestID":"ae86b372-ab77-11e6-824c-c7c4220f0423",
  "eventID":"ff9fc985-1fbe-4717-965b-607dda32f620",
  "eventType":"AwsApiCall",
  "recipientAccountId":"435456556566"
}
Sample query
_sourceCategory=ecs* (DeleteCluster or DeleteService or DeregisterContainerInstance or DeregisterTaskDefinition or StopTask) and !(InternalFailure)
| json "eventName" as event_name
| parse "\"userName\":\"*\"" as user
| parse "\"awsRegion\":\"*\"" as region
| parse "\"cluster\":\"*\"" as cluster
| timeslice 1h
| parse regex field=event_name "^(?:Delete|Deregister|Stop)(?<resource_type>[A-Z][A-Za-z]+)"
| count by resource_type, _timeslice
| transpose row _timeslice column resource_type
Install the Sumo Logic app
Now that you have set up a collection for Amazon ECS with Container Insights and CloudWatch, install the Sumo Logic app for Amazon ECS with Container Insights and CloudWatch to use the pre-configured searches and dashboards that provide visibility into your environment for real-time analysis of overall usage.
To install the app:
- Select App Catalog.
- In the 🔎 Search Apps field, run a search for your desired app, then select it.
- Click Install App.
note
Sometimes this button says Add Integration.
- On the next configuration page, under Select Data Source for your App, complete the following fields:
- Data Source. Select one of the following options:
- Choose Source Category and select a source category from the list; or
- Choose Enter a Custom Data Filter, and enter a custom source category beginning with an underscore. For example,
_sourceCategory=MyCategory.
- Folder Name. You can retain the existing name or enter a custom name of your choice for the app.
- All Folders (optional). The default location is the Personal folder in your Library. If desired, you can choose a different location and/or click New Folder to add it to a new folder.
- Data Source. Select one of the following options:
- Click Next.
- Look for the dialog confirming that your app was installed successfully.
Post-installation
Once your app is installed, it will appear in your Personal folder or the folder that you specified. From here, you can share it with other users in your organization. Dashboard panels will automatically start to fill with data matching the time range query received since you created the panel. Results won't be available immediately, but within about 20 minutes, you'll see completed graphs and maps.
Amazon ECS CloudWatch dashboards
Cluster Overview
The Amazon ECS - Cluster Overview dashboard provides a high-level view of the cluster's health along with details on the utilized resources.
Use this dashboard to:
- Monitor the memory and CPU utilization of your cluster.
- View abnormal read-write activity and network incoming-outgoing bytes.

Cluster Performance Monitoring
The Amazon ECS - Cluster Performance Monitoring dashboard provides detailed information on the performance of your cluster, which you can use to fine-tune your cluster.
Use this dashboard to:
- Identify patterns and outliers over time.
- Monitor the performance of your cluster and use linked dashboards to drill down further into the root cause.

Cluster Resource Reservation
The Amazon ECS - Cluster Resource Reservation dashboard provides information on resource reservations which can be used to set the right resource limits.
Use this dashboard to:
- Identify the right limits for CPU and memory reservations.

Container Logs
The Amazon ECS - Container Logs dashboard provides detailed information on what is happening (errors or recent events) in a container.
Use this dashboard to:
- View recent logs of your container.
- Identify common errors and abnormal spikes in errors.

Container Overview
The Amazon ECS - Container Overview dashboard provides a high-level view of the health of the container along with details on the utilized resources.
Use this dashboard to:
- Track the container status and identify the container details like its task definition, image, account, etc.
- Monitor CPU, memory, disk, and network activity of your container.

EC2 LaunchType
The Amazon ECS - EC2 LaunchType dashboard provides a high-level view of the health of the cluster along with details on the utilized resources for EC2 launch types.
Use this dashboard to:
- Monitor CPU and memory utilization of clusters with EC2 launch type.
- View the number of clusters and tasks with EC2 launch type.

Service Overview
The Amazon ECS - Service Overview dashboard provides a high-level view of the health of the services along with details on the utilized resources.
Use this dashboard to:
- Monitor the number of running, desired, and pending tasks.
- Identify services with abnormal CPU, network, memory, and disk activity.

Service Performance Monitoring
The Amazon ECS - Service Performance Monitoring dashboard provides detailed information on the performance of your services which you can use to fine-tune your cluster.
Use this dashboard to:
- Identify patterns and outliers over time for each of the resource metrics like CPU memory network and disk.
- Track the running, pending, and desired tasks trend.
- Monitor the performance of your services and use linked dashboards to drill down further into the root cause.

Tasks Definition Family Overview
The Amazon ECS - Tasks Definition Family Overview dashboard provides a high-level view of the health of the tasks belonging to a particular task definition family and details on the utilized resources.
Use this dashboard to:
- View the number of tasks running with a single task definition family.
- Monitor CPU and memory usage by task definition family.

Tasks Overview
The Amazon ECS - Tasks Overview dashboard provides a high-level view of the health of the task along with details on the utilized resources and where they are running.
Use this dashboard to:
- View details of all the task instances and their launch type.
- Track Network Errors and Dropped Packets
- Monitor CPU, memory, disk, and network performance by task instances.

Tasks Definition Family Performance Monitoring
The Amazon ECS - Tasks Definition Family Performance Monitoring dashboard provides detailed information on the performance of your tasks which you can use to fine-tune your cluster.
Use this dashboard to:
- Identify patterns and outliers over time for each of the resource metrics like CPU, memory, network, and disk.
- Monitor the performance of your tasks and use linked dashboards to drill down further into the root cause.

Task Definition Family Resource Reservation
The Amazon ECS - Task Definition Family Resource Reservation dashboard provides information on resource reservation which can be used to set the right resource limits at the task definition level.
Use this dashboard to:
- Identify the right limits for CPU and memory reservations.

Fargate LaunchType
The Amazon ECS - Fargate LaunchType dashboard provides a high-level view of the cluster's health along with details on the utilized resources for Fargate launch types.
Use this dashboard to:
- Monitor network activity of your clusters with Fargate launch type.
- View the number of clusters and tasks with Fargate launch type.

Audit Events
The Amazon ECS - Audit Events dashboard gives information on the type of request made to ECS, the IP making the request, who made it and when, and more.
Use this dashboard to:
- View audit trail of actions taken by a user, role, or AWS service in Amazon ECS.
- Monitor container registration/deregistration events.
- Identify location, IP address from where the request was made, and resource crud events over time.
