Amazon ElastiCache

The Sumo Logic app for Amazon ElastiCache allows you to set up, run, and scale popular open-source compatible in-memory data stores in the cloud.
The Amazon ElastiCache dashboards provide visibility into key event and performance analytics that enable proactive diagnosis and response to system and environment issues. Use the preconfigured dashboards for at-a-glance analysis of event status trends, locations, successes and failures, as well as system health and performance metrics. The dashboards also have additional performance insights for Redis clusters.
Log and metric types
The Amazon ElastiCache app uses the following logs and metrics:
- Amazon ElastiCache Host-Level Metrics for individual cache nodes
- Amazon ElastiCache Cache Engine metrics
- CloudTrail Amazon ElastiCache Data Event
Sample log messages
{
	"eventVersion":"1.05",
	"userIdentity":{
		"type":"IAMUser",
		"principalId":"A12345678904QEWUABG5Q",
		"arn":"arn:aws:iam::123456789038:user/myuser",
		"accountId":"123456789038",
		"accessKeyId":"A1234567890FHCUQYQRM",
		"userName":"myuser",
		"sessionContext":{
			"attributes":{
				"mfaAuthenticated":"true",
				"creationDate":"2018-10-29T07:08:50Z"
			}
		},
		"invokedBy":"signin.amazonaws.com"
	},
	"eventTime":"2018-10-29T08:38:13Z",
	"eventSource":"elasticache.amazonaws.com",
	"eventName":"CreateCacheSubnetGroup",
	"awsRegion":"us-west-1",
	"sourceIPAddress":"29.28.30.17",
	"userAgent":"signin.amazonaws.com",
	"requestParameters":{
		"cacheSubnetGroupName":"myuser-redis-subnet-grp1",
		"subnetIds":[
			"subnet-b33fc55e"
		]
	},
	"responseElements":{
		"cacheSubnetGroupDescription":" ",
		"vpcId":"vpc-b12fc345",
		"subnets":[
			{
				"subnetAvailabilityZone":{
					"name":"us-west-1a"
				},
				"subnetIdentifier":"subnet-b33fc55e"
			}
		],
		"cacheSubnetGroupName":"myuser-redis-subnet-grp1"
	},
	"requestID":"c6a79737-1234-5678-bb74-9f27f56e6306",
	"eventID":"70c2c865-1234-4567-893c-9800b91e2502",
	"eventType":"AwsApiCall",
	"recipientAccountId":"123456789038"
}
Sample queries
account=* region=* namespace=aws/elasticache metric=EngineCPUUtilization statistic=Average CacheClusterId=* CacheNodeId=* | avg by CacheClusterId, CacheNodeId, account, region, namespace
account={{account}} region={{region}} namespace={{namespace}} "\"eventSource\":\"elasticache.amazonaws.com\"" (Reboot* or CacheNodesRebooted)
| json "userIdentity", "eventSource", "eventName", "awsRegion", "sourceIPAddress", "userAgent", "eventType", "recipientAccountId", "requestParameters", "responseElements", "requestID", "errorCode", "errorMessage" as userIdentity, event_source, event_name, region, src_ip, user_agent, event_type, recipient_account_id, requestParameters, responseElements, request_id, error_code, error_message nodrop
| where event_source = "elasticache.amazonaws.com" and (event_name matches "Reboot*" or event_name="CacheNodesRebooted")
| json field=userIdentity "type", "principalId", "arn", "userName", "accountId" nodrop
| json field=userIdentity "sessionContext.attributes.mfaAuthenticated" as mfaAuthenticated nodrop
| json field=requestParameters "replicationGroupId", "engine", "engineVersion", "cacheClusterId" as req_replicationGroupId, req_engine, req_engineVersion, req_cacheClusterId nodrop
| json field=responseElements "replicationGroupId", "engine", "engineVersion", "status", "cacheClusterId", "res_cacheClusterStatus", "snapshotRetentionLimit" as res_replicationGroupId, res_engine, res_engineVersion, res_status, res_cacheClusterId, res_cacheClusterStatus, snapshotretentionlimit  nodrop
| json field=responseElements "autoMinorVersionUpgrade", "cacheNodeType", "numCacheNodes" as auto_minorversion_upgrade, cachenodetype, numcachenodes nodrop
| parse field=arn ":assumed-role/*" as user nodrop
| parse field=arn "arn:aws:iam::*:*" as accountId, user nodrop
| if (isEmpty(error_code), "Success", "Failure") as eventStatus
| if (isEmpty(userName), user, userName) as user
| if (isEmpty(req_replicationGroupId), res_replicationGroupId, req_replicationGroupId) as replicationgroupid
| if (isEmpty(req_engine), res_engine, req_engine) as engine
| if (isEmpty(req_engineVersion), res_engineVersion, req_engineVersion) as engine_version
| if (isEmpty(req_cacheClusterId), res_cacheClusterId, req_cacheClusterId) as cacheclusterid
| eventStatus as status
| where (tolowercase(cacheclusterid) matches tolowercase("{{CacheClusterId}}")) or IsBlank(cacheclusterid)
| timeslice 1s
| count as Count by _timeslice, event_name, src_ip, user, type, request_id, user_agent, cacheclusterid, replicationgroupid // , engine, engine_version, snapshotretentionlimit, status, auto_minorversion_upgrade, cachenodetype, numcachenodes
| fields _timeslice, event_name, src_ip, user, type, request_id, user_agent, cacheclusterid, replicationgroupid // , engine, engine_version, snapshotretentionlimit, status, auto_minorversion_upgrade, cachenodetype, numcachenodes, Count
| sort by _timeslice
Collect Logs and Metrics for Amazon ElastiCache
- Sumo Logic supports collecting metrics using two source types:
- Configure an AWS Kinesis Firehose for Metrics Source (recommended); or
- Configure an Amazon CloudWatch Source for Metrics
- Namespace for Amazon ElastiCache service is AWS/ElastiCache
- Metadata: Add an account field to the source and assign it a value which is a friendly name / alias to your AWS account from which you are collecting metrics. Metrics can be queried via the “account field”.
Collect Amazon ElastiCache CloudTrail Logs
- To your Hosted Collector, add an AWS CloudTrail Source.
- Name. Enter a name to display for the new Source.
- Description. Enter an optional description.
- S3 Region. Select the Amazon Region for your ElastiCache S3 bucket.
- Bucket Name. Enter the exact name of your ElastiCache S3 bucket.
- Path Expression. Enter the string that matches the S3 objects you'd like to collect. You can use a wildcard (*) in this string. (DO NOT use a leading forward slash. See Amazon Path Expressions.) The S3 bucket name is not part of the path. Don’t include the bucket name when you are setting the Path Expression.
- Source Category. Enter aws/observability/cloudtrail/logs
- Fields. Add an account field and assign it a value which is a friendly name / alias to your AWS account from which you are collecting logs. Logs can be queried via the “account field”.
- Access Key ID and Secret Access Key. Enter your Amazon Access Key ID and Secret Access Key. Learn how to use Role-based access to AWS here
- Log File Discovery -> Scan Interval. Use the default of 5 minutes. Alternately, enter the frequency. Sumo Logic will scan your S3 bucket for new data. Learn how to configure Log File Discovery here.
- Enable Timestamp Parsing. Select the Extract timestamp information from log file entries check box.
- Time Zone. Select Ignore time zone from the log file and instead use, and select UTC from the dropdown.
- Timestamp Format. Select Automatically detect the format.
- Enable Multiline Processing. Select the Detect messages spanning multiple lines check box, and select Infer Boundaries.
- Click Save.
Field in Field Schema
- Classic UI. In the main Sumo Logic menu, select Manage Data > Logs > Fields.
New UI. In the top menu select Configuration, and then under Logs select Fields. You can also click the Go To... menu at the top of the screen and select Fields. - Search for the “cacheclusterid” field.
- If not present, create it. Learn how to create and manage fields here.
Field Extraction Rule(s)
Create a Field Extraction Rule for CloudTrail Logs. Learn how to create a Field Extraction Rule here.
Rule Name: AwsObservabilityElastiCacheCloudTrailLogsFER
Applied at: Ingest Time
Scope (Specific Data): account=* eventname eventsource "elasticache.amazonaws.com"
Parse Expression
| json "eventSource", "awsRegion", "requestParameters.cacheClusterId", "responseElements.cacheClusterId", "recipientAccountId" as eventSource, region, req_cacheClusterId, res_cacheClusterId, accountid nodrop
| where eventSource = "elasticache.amazonaws.com"
| if (!isEmpty(req_cacheClusterId), req_cacheClusterId, res_cacheClusterId) as cacheclusterid
| "aws/elasticache" as namespace
| tolowercase(cacheclusterid) as cacheclusterid
| fields region, namespace, cacheclusterid, accountid
Centralized AWS CloudTrail Log Collection
In case you have a centralized collection of CloudTrail logs and are ingesting them from all accounts into a single Sumo Logic CloudTrail log source, create the following Field Extraction Rule to map a proper AWS account(s) friendly name / alias. Create it if not already present / update it as required.
Rule Name: AWS Accounts
Applied at: Ingest Time
Scope (Specific Data): _sourceCategory=aws/observability/cloudtrail/logs
Parse Expression. Enter a parse expression to create an “account” field that maps to the alias you set for each sub account. For example, if you used the “dev” alias for an AWS account with ID "528560886094" and the “prod” alias for an AWS account with ID "567680881046", your parse expression would look like:
| json "recipientAccountId"
// Manually map your aws account id with the AWS account alias you setup earlier for individual child account
| "" as account
| if (recipientAccountId = "528560886094",  "dev", account) as account
| if (recipientAccountId = "567680881046",  "prod", account) as account
| fields account
Installing the Amazon ElastiCache app
This section has instructions for installing the Sumo Logic app for Amazon ElastiCache and descriptions of each of the app dashboards along with associated use cases.
Now that you have set up a collection for Amazon ElastiCache, install the Sumo Logic app to use the pre-configured dashboards that provide visibility into your environment for real-time analysis of overall usage.
To install the app:
- Select App Catalog.
- In the 🔎 Search Apps field, run a search for your desired app, then select it.
- Click Install App.
note
Sometimes this button says Add Integration.
- On the next configuration page, under Select Data Source for your App, complete the following fields:
- Data Source. Select one of the following options:
- Choose Source Category and select a source category from the list; or
- Choose Enter a Custom Data Filter, and enter a custom source category beginning with an underscore. For example,
_sourceCategory=MyCategory.
- Folder Name. You can retain the existing name or enter a custom name of your choice for the app.
- All Folders (optional). The default location is the Personal folder in your Library. If desired, you can choose a different location and/or click New Folder to add it to a new folder.
- Data Source. Select one of the following options:
- Click Next.
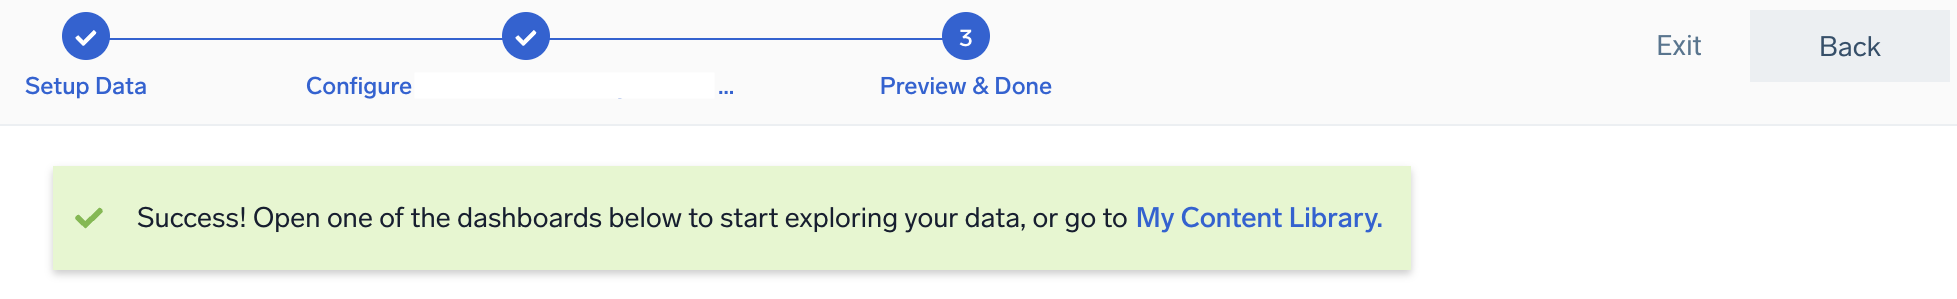
- Look for the dialog confirming that your app was installed successfully.
Post-installation
Once your app is installed, it will appear in your Personal folder or the folder that you specified. From here, you can share it with other users in your organization. Dashboard panels will automatically start to fill with data matching the time range query received since you created the panel. Results won't be available immediately, but within about 20 minutes, you'll see completed graphs and maps.
Viewing Amazon ElastiCache dashboards
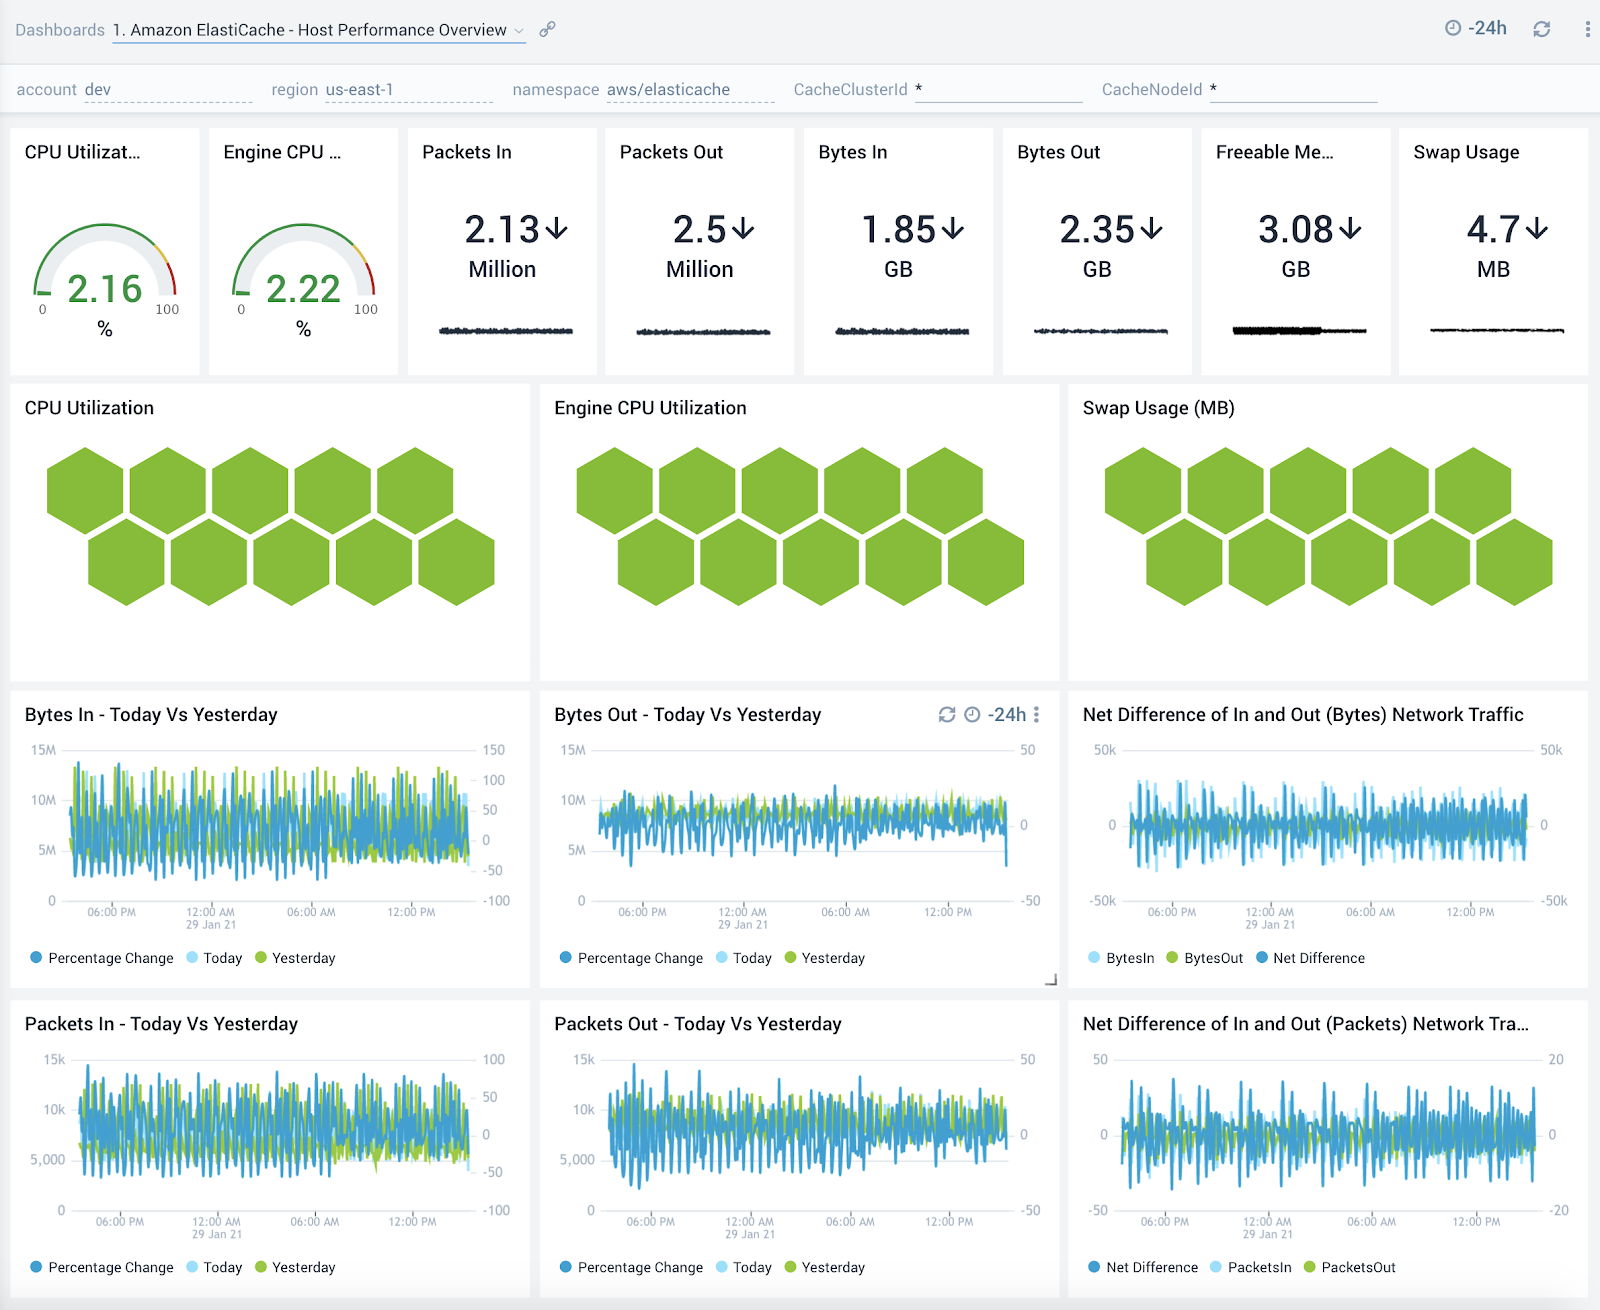
Host Performance Overview
The Amazon ElastiCache - Host Performance Overview dashboard provides detailed insights into CPU, memory and network performance metrics of hosts running your ElastiCache clusters.
Use this dashboard to:
- Get an at-a-glance view of CPU, memory and swap resource utilization of hosts running your ElastiCache clusters.
- CPU, memory or swap space on host and swap usage.
- Monitor network traffic utilization and compare today’s trends of incoming and outgoing bytes and packets vs. yesterday
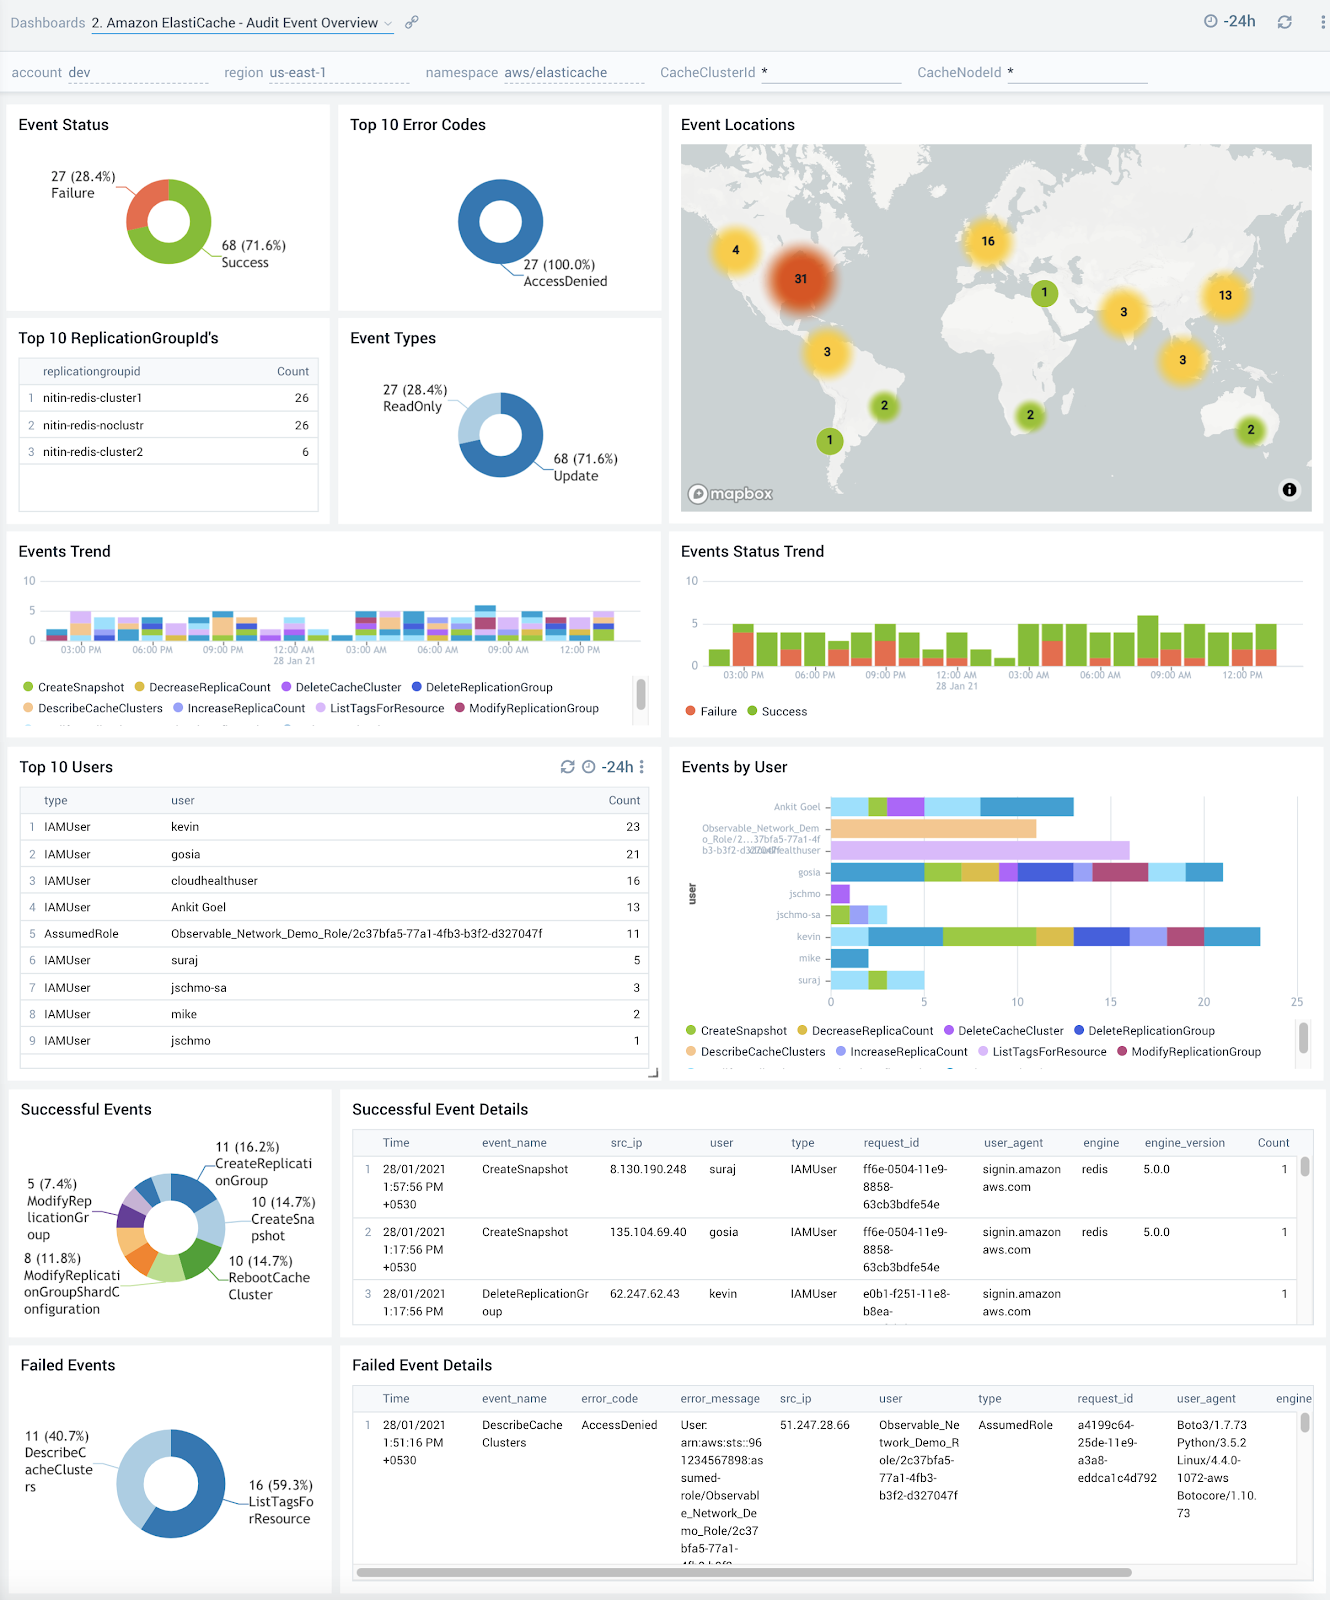
Audit Event Overview
The Amazon ElastiCache - Audit Event Overview dashboard provides detailed insights into all events associated with ElastiCache clusters and specifically helps identify changes, errors, users and replication groups.
Use this dashboard to:
- Monitor all changes being made to ElastiCache clusters
- Monitor the location of incoming user activity, top users, and top replication groupsto ensure they match with expectations
- Quickly identify top error codes to diagnose any outages
- Monitor trends around failed events to identify potential service disruptions that could warrant deeper investigation
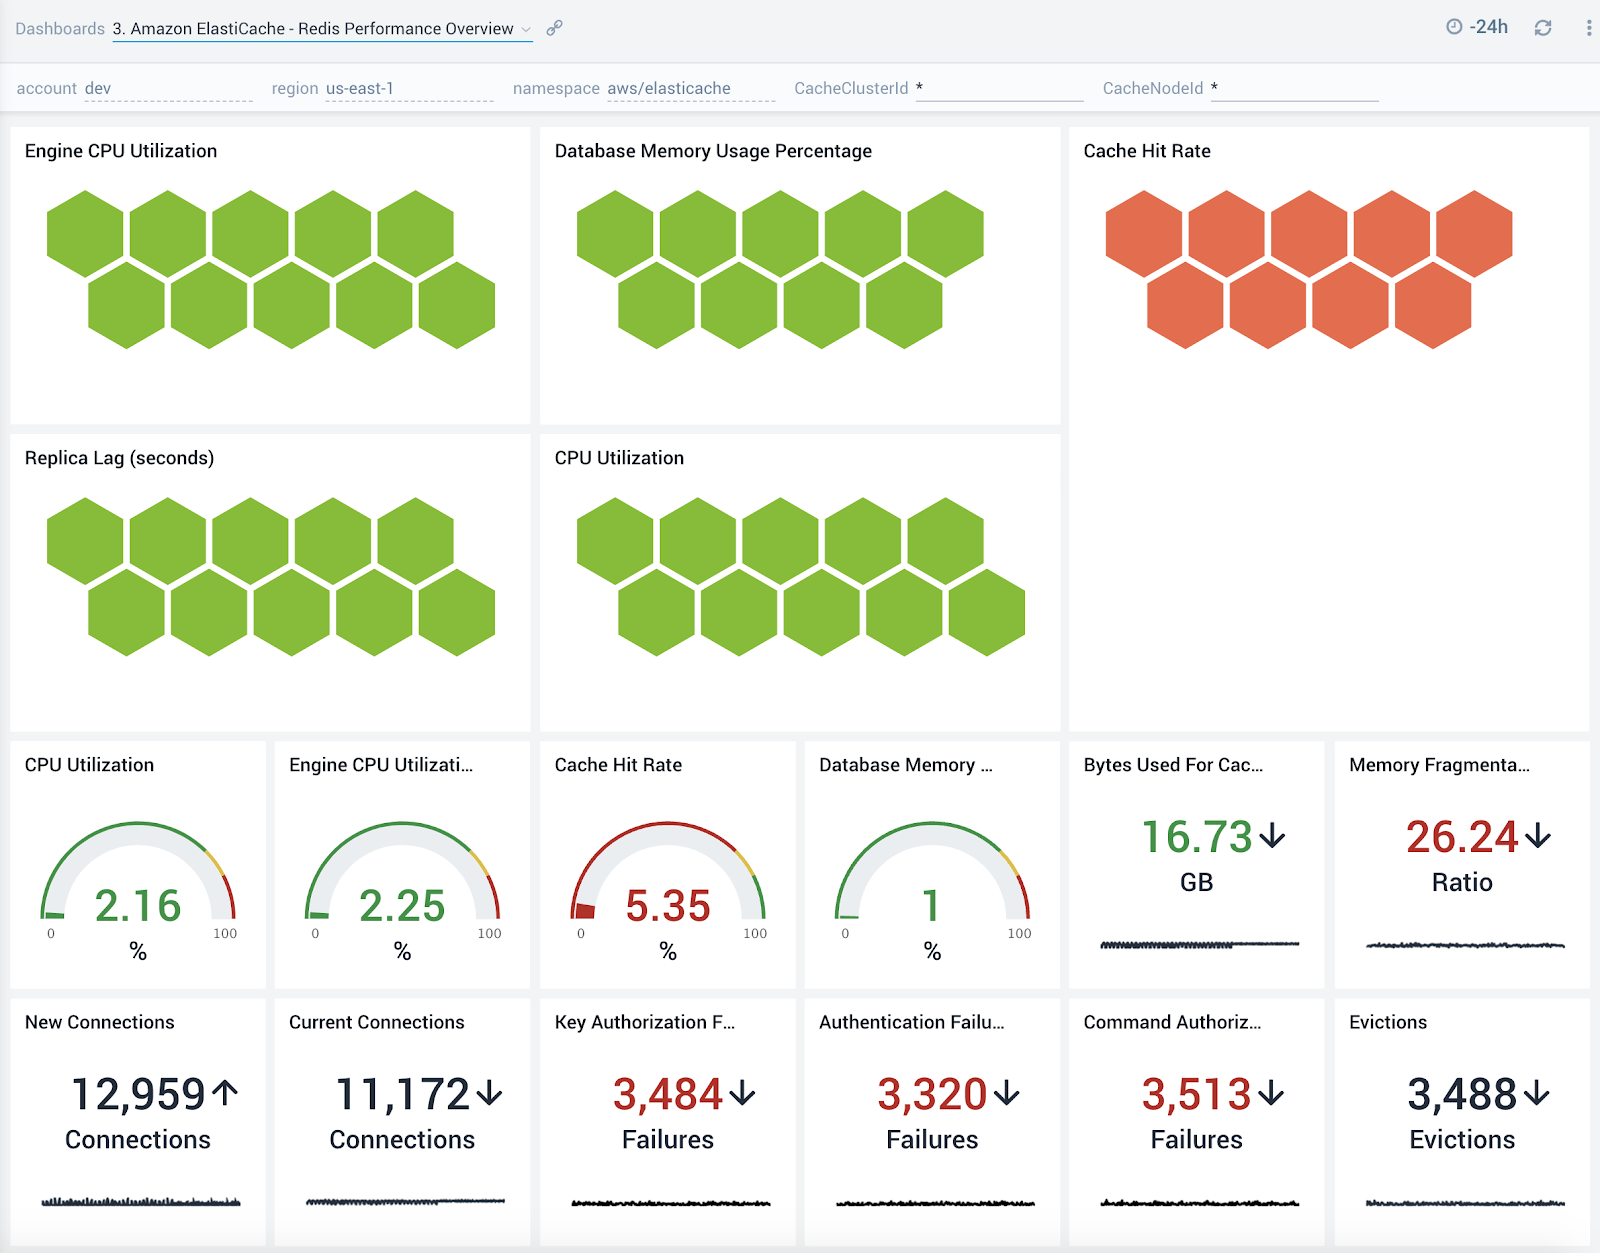
Redis Performance Overview
The Amazon ElastiCache - Redis Performance Overview dashboard provides an overview into performance, evictions and authentication and authorization failures of ElastiCache Redis clusters.
Use this dashboard to:
- Quickly determine if your Redis database is performing as expected
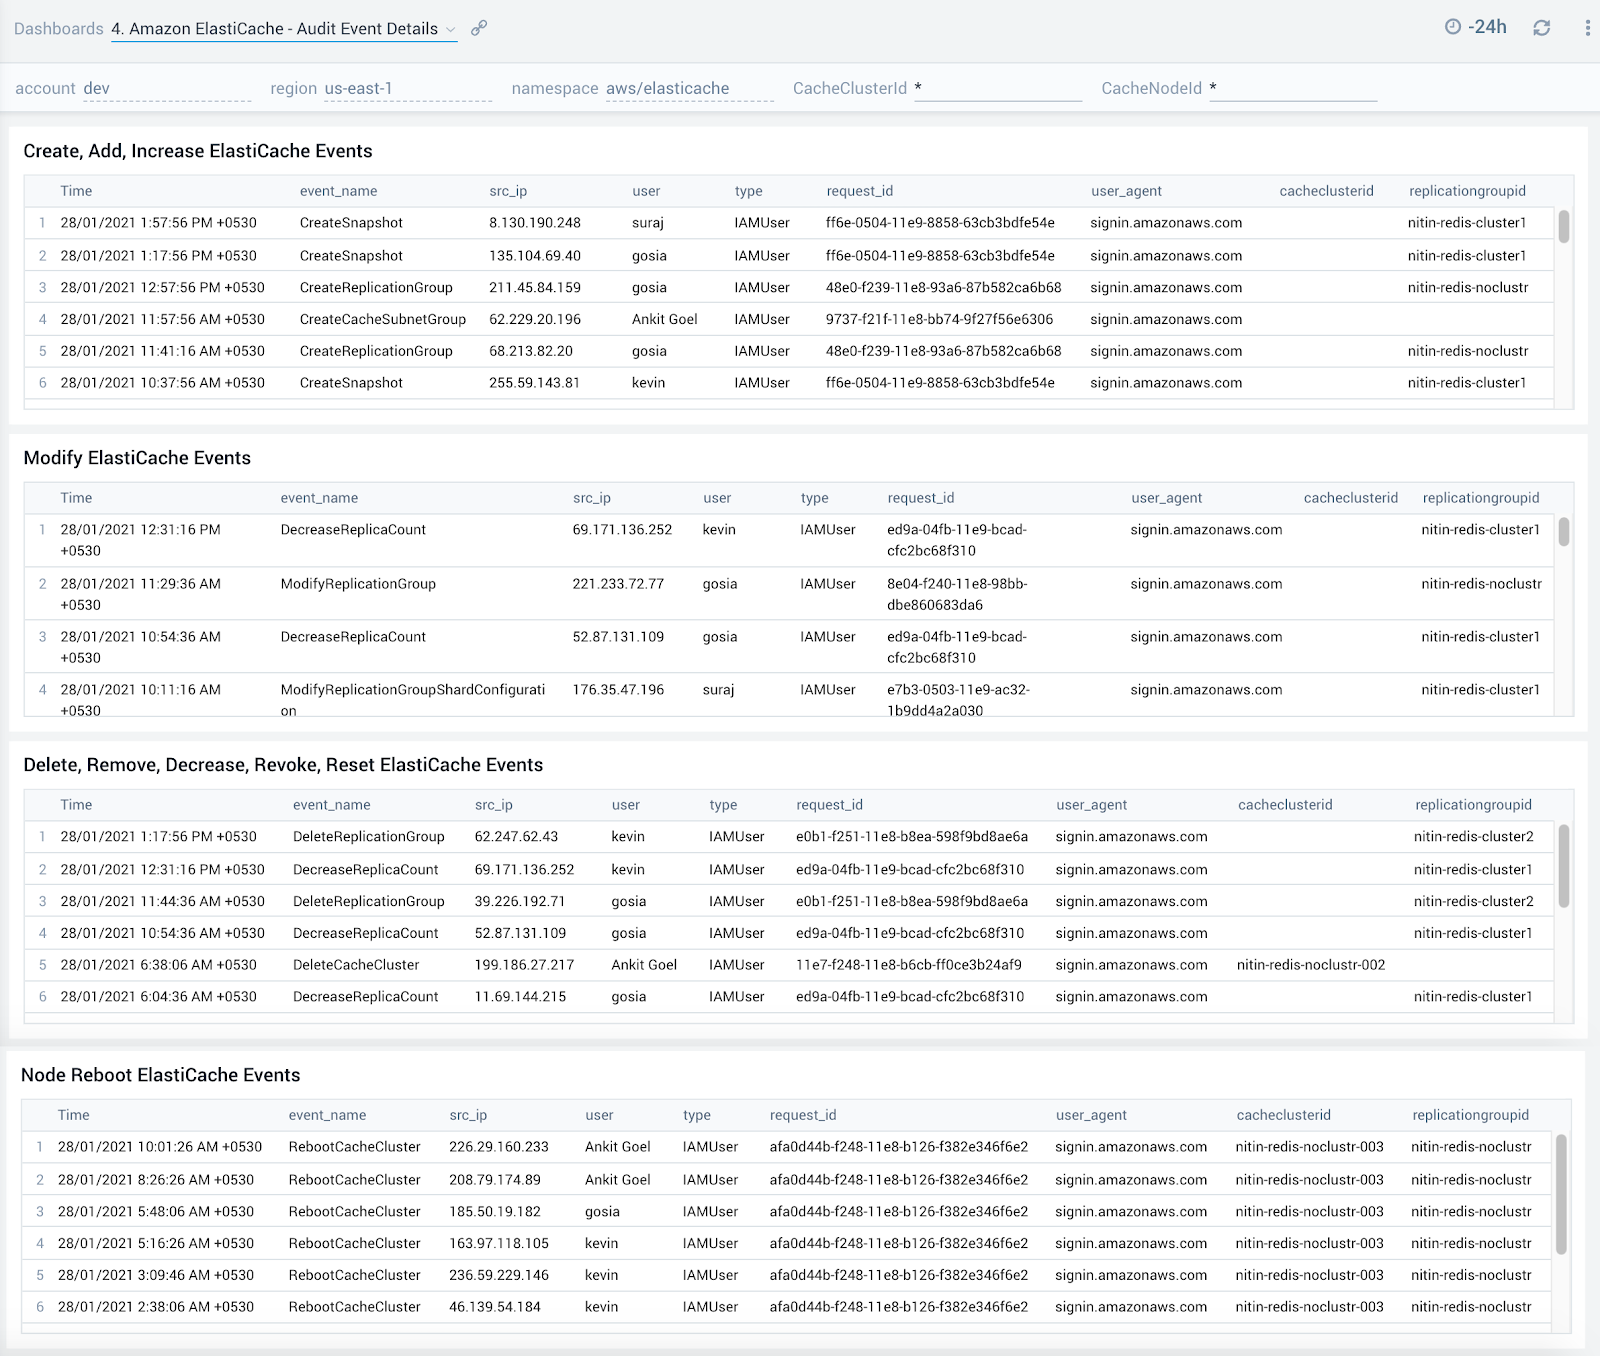
Audit Event Details
The Amazon ElastiCache - Audit Event Details dashboard provides detailed insights into key operations made on your ElastiCache clusters.
Use this dashboard to:
- Quickly determine changes made to your ElastiCache clusters while troubleshooting production outages
- Determine if any nodes hosting your ElastiCache clusters were rebooted
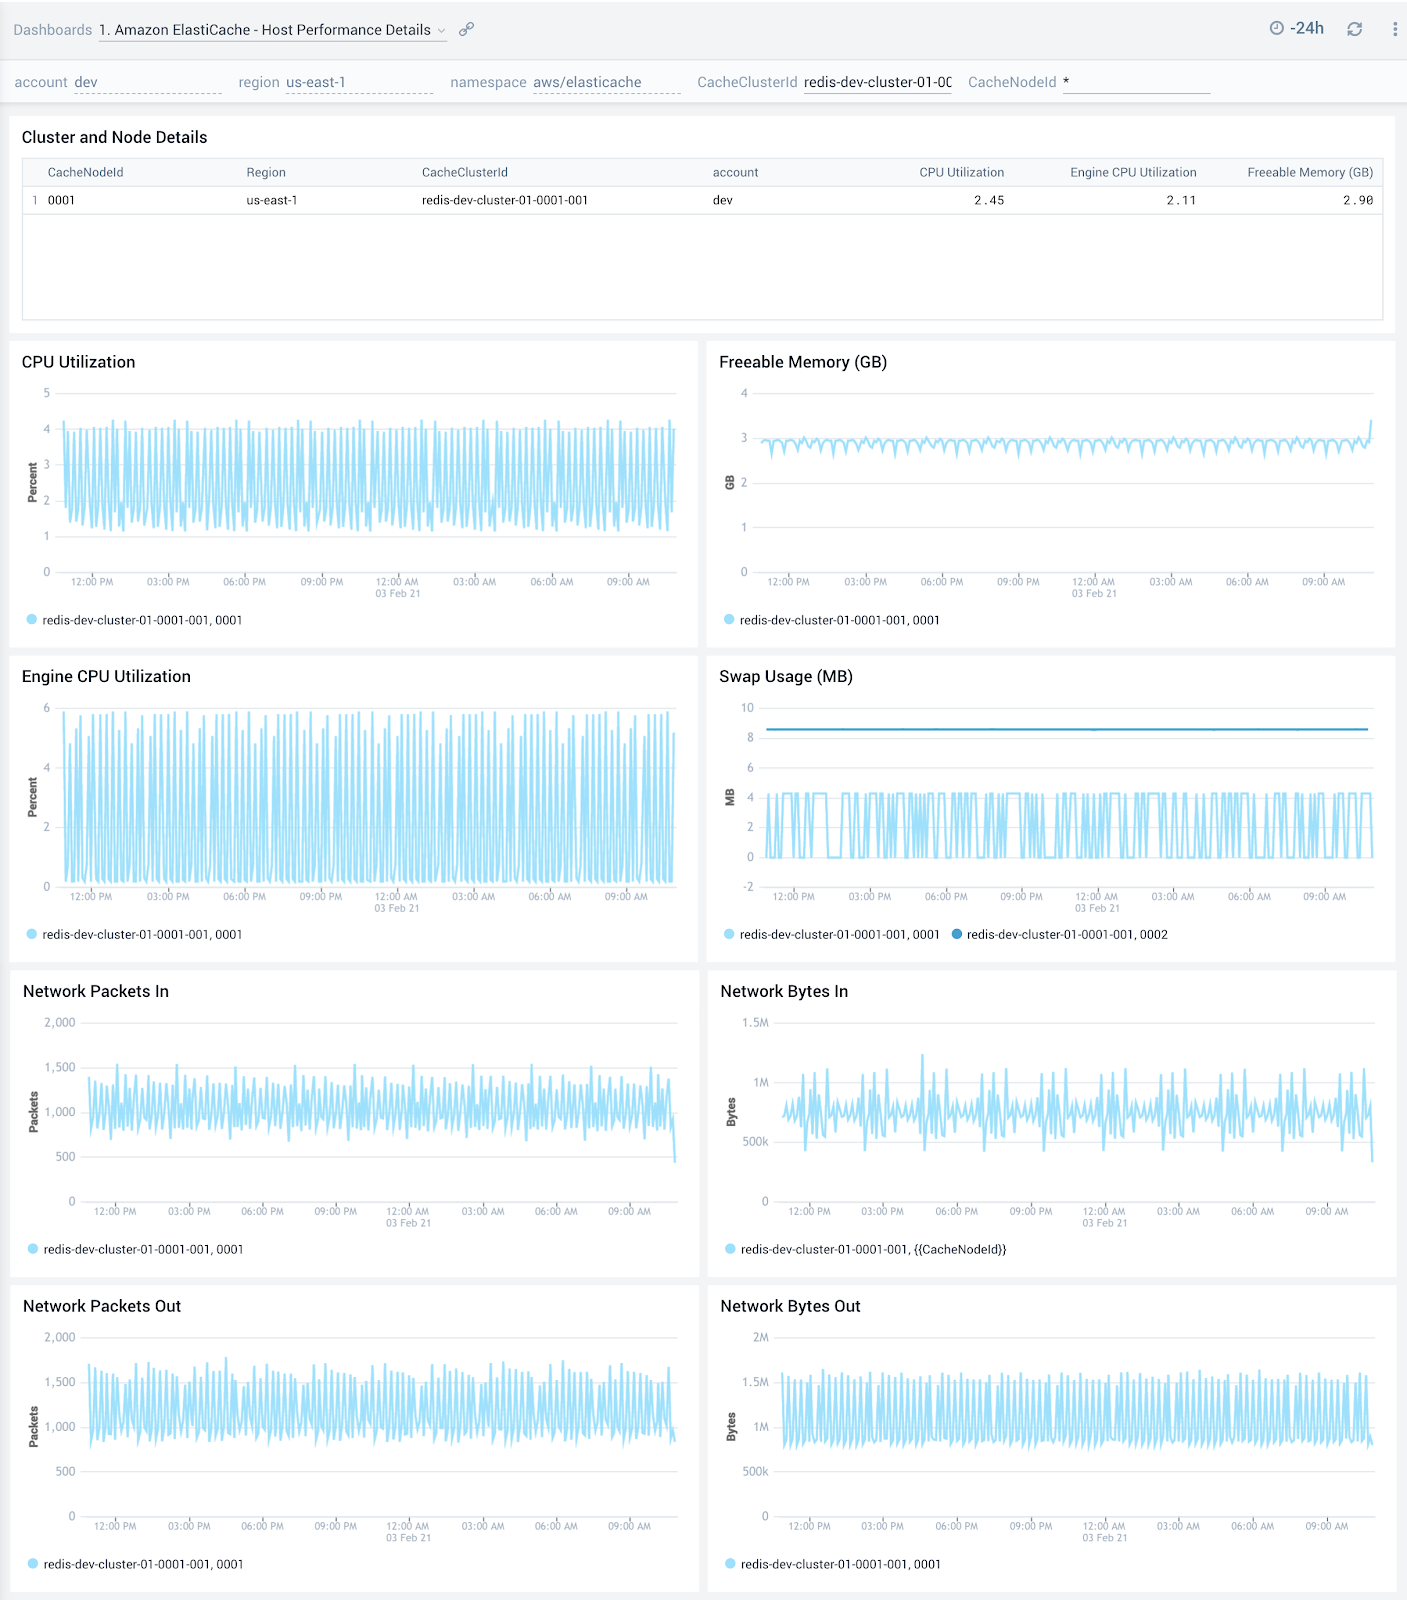
Host Performance Details
The Amazon ElastiCache - Host Performance Details dashboard shows an overview of the resource utilization for a given ElastiCache cluster across its nodes and also showcases trends around CPU, memory, swap usage and network traffic.
Use this dashboard to:
- Get an at-a-glance view of the performance of all nodes within a given ElastiCache cluster
- Determine if CPU, memory, swap memory or network resources need to be scaled up or down for a given cluster or service based on utilization trends
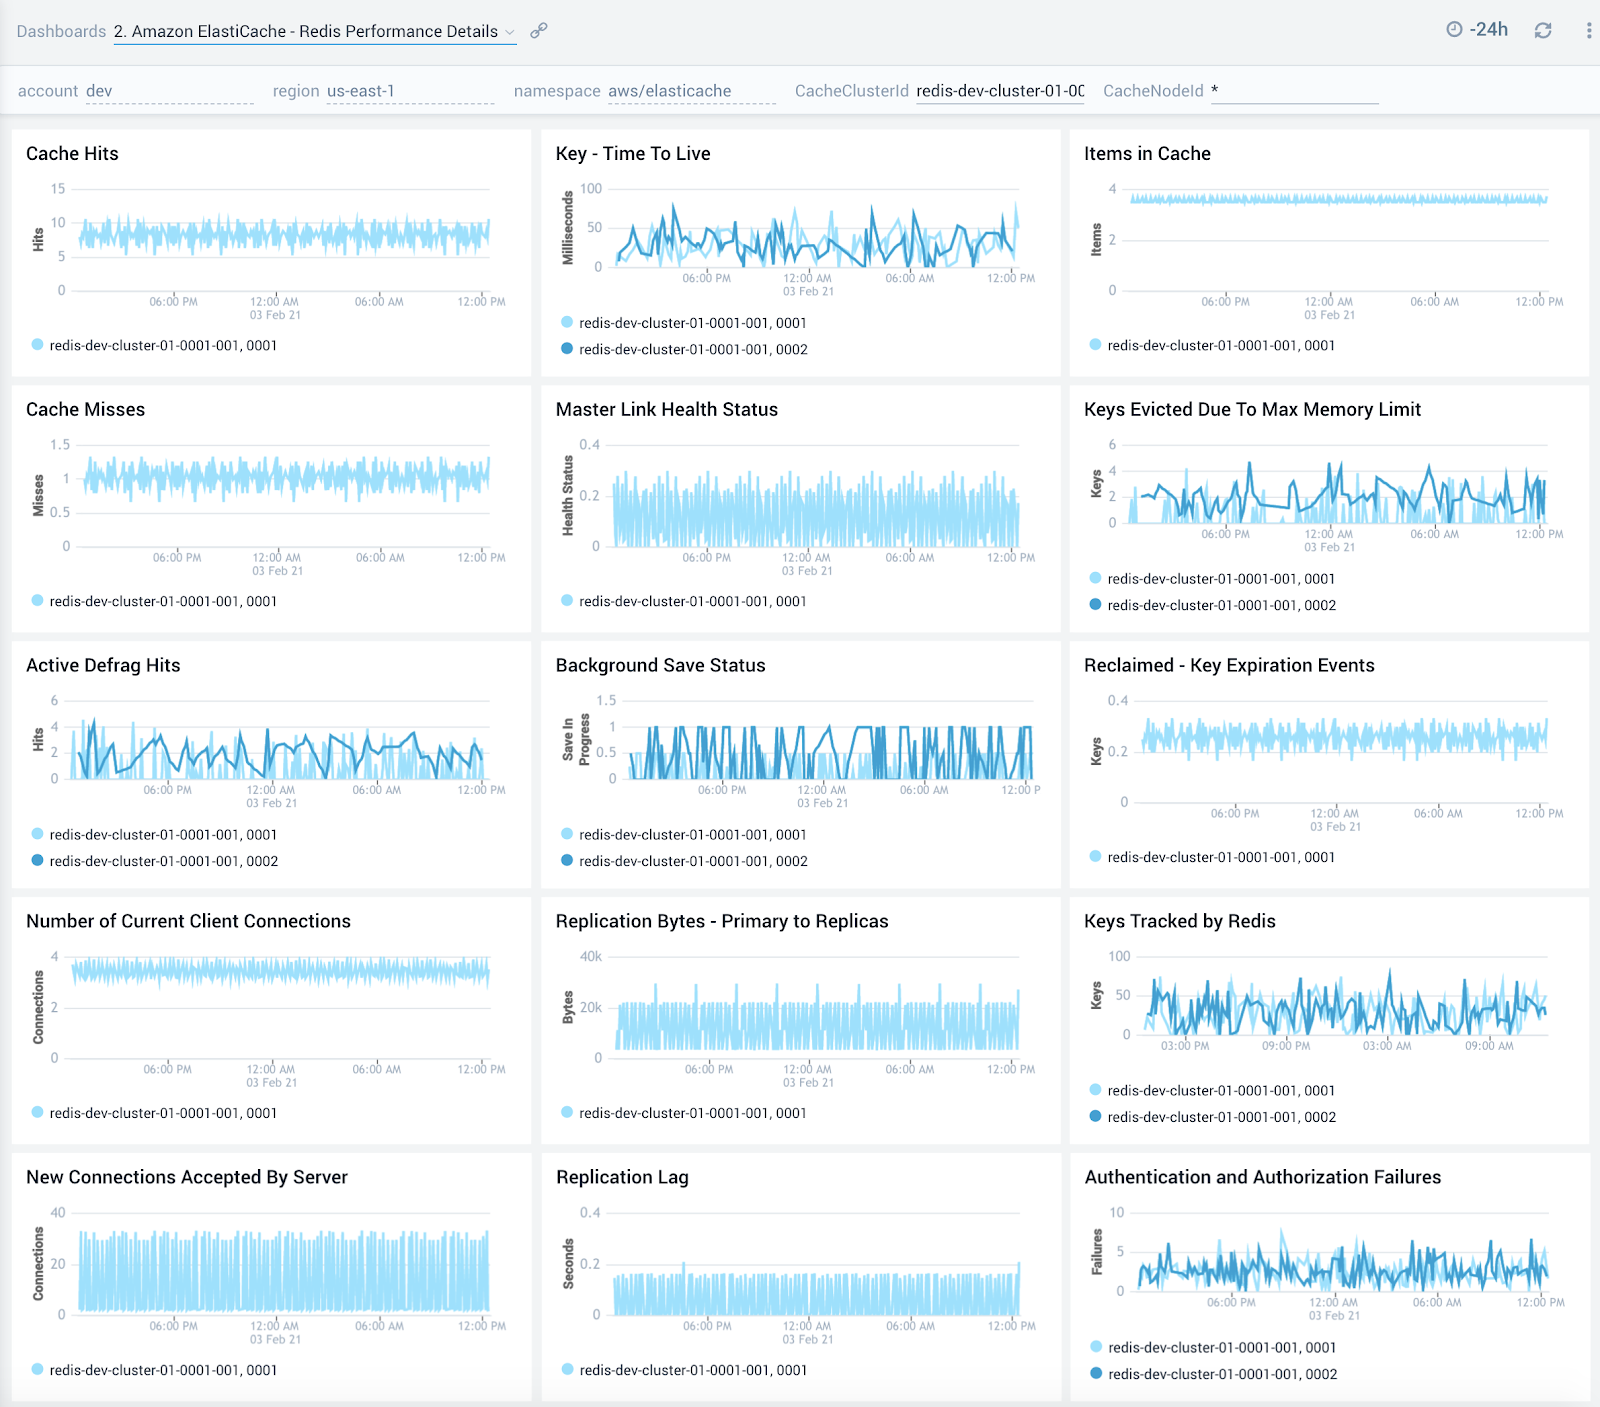
Redis Performance Details
The Amazon ElastiCache - Redis Performance Details dashboard provides detailed insights into cache hits, keys, replication, connections and failures of Redis ElastiCache clusters.
Use this dashboard to:
- Monitor trends around cache hits and misses to determine if Redis clusters need to be tuned
- Review trends around defragmentation, replication lag and bytes replicated to determine optimizations
- Quickly determine any authentication and authorization failures and grant or revoke privileges accordingly
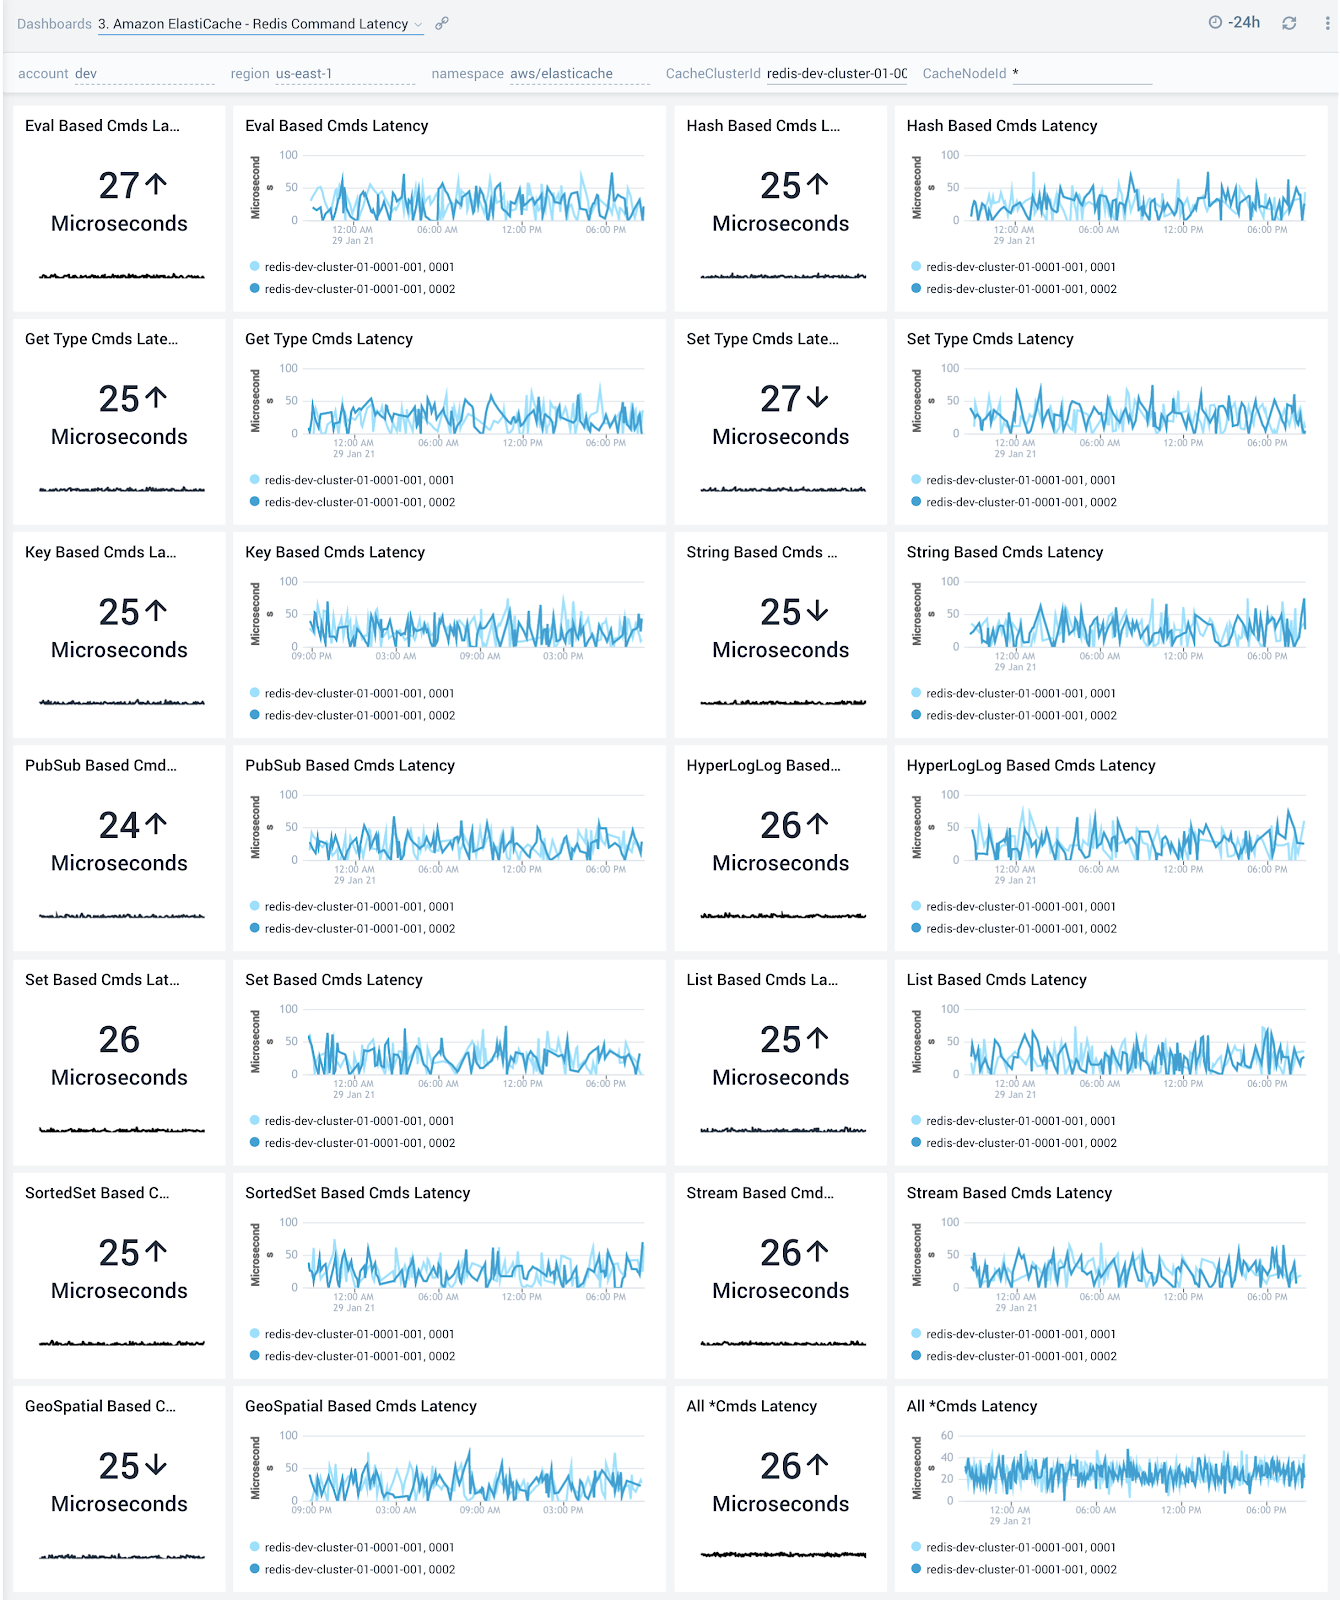
Redis Command Latency
The Amazon ElastiCache - Redis Command Latency dashboard provides detailed insights into latency of various Redis commands.
Use this dashboard to:
- To optimize performance of your Redis clusters by monitoring latency observed across get/set operations. Latency can be high due to high CPU usage, swapping or removing cached items. Performance optimizations can therefore be made either via resource allocation or by optimizing on caching.
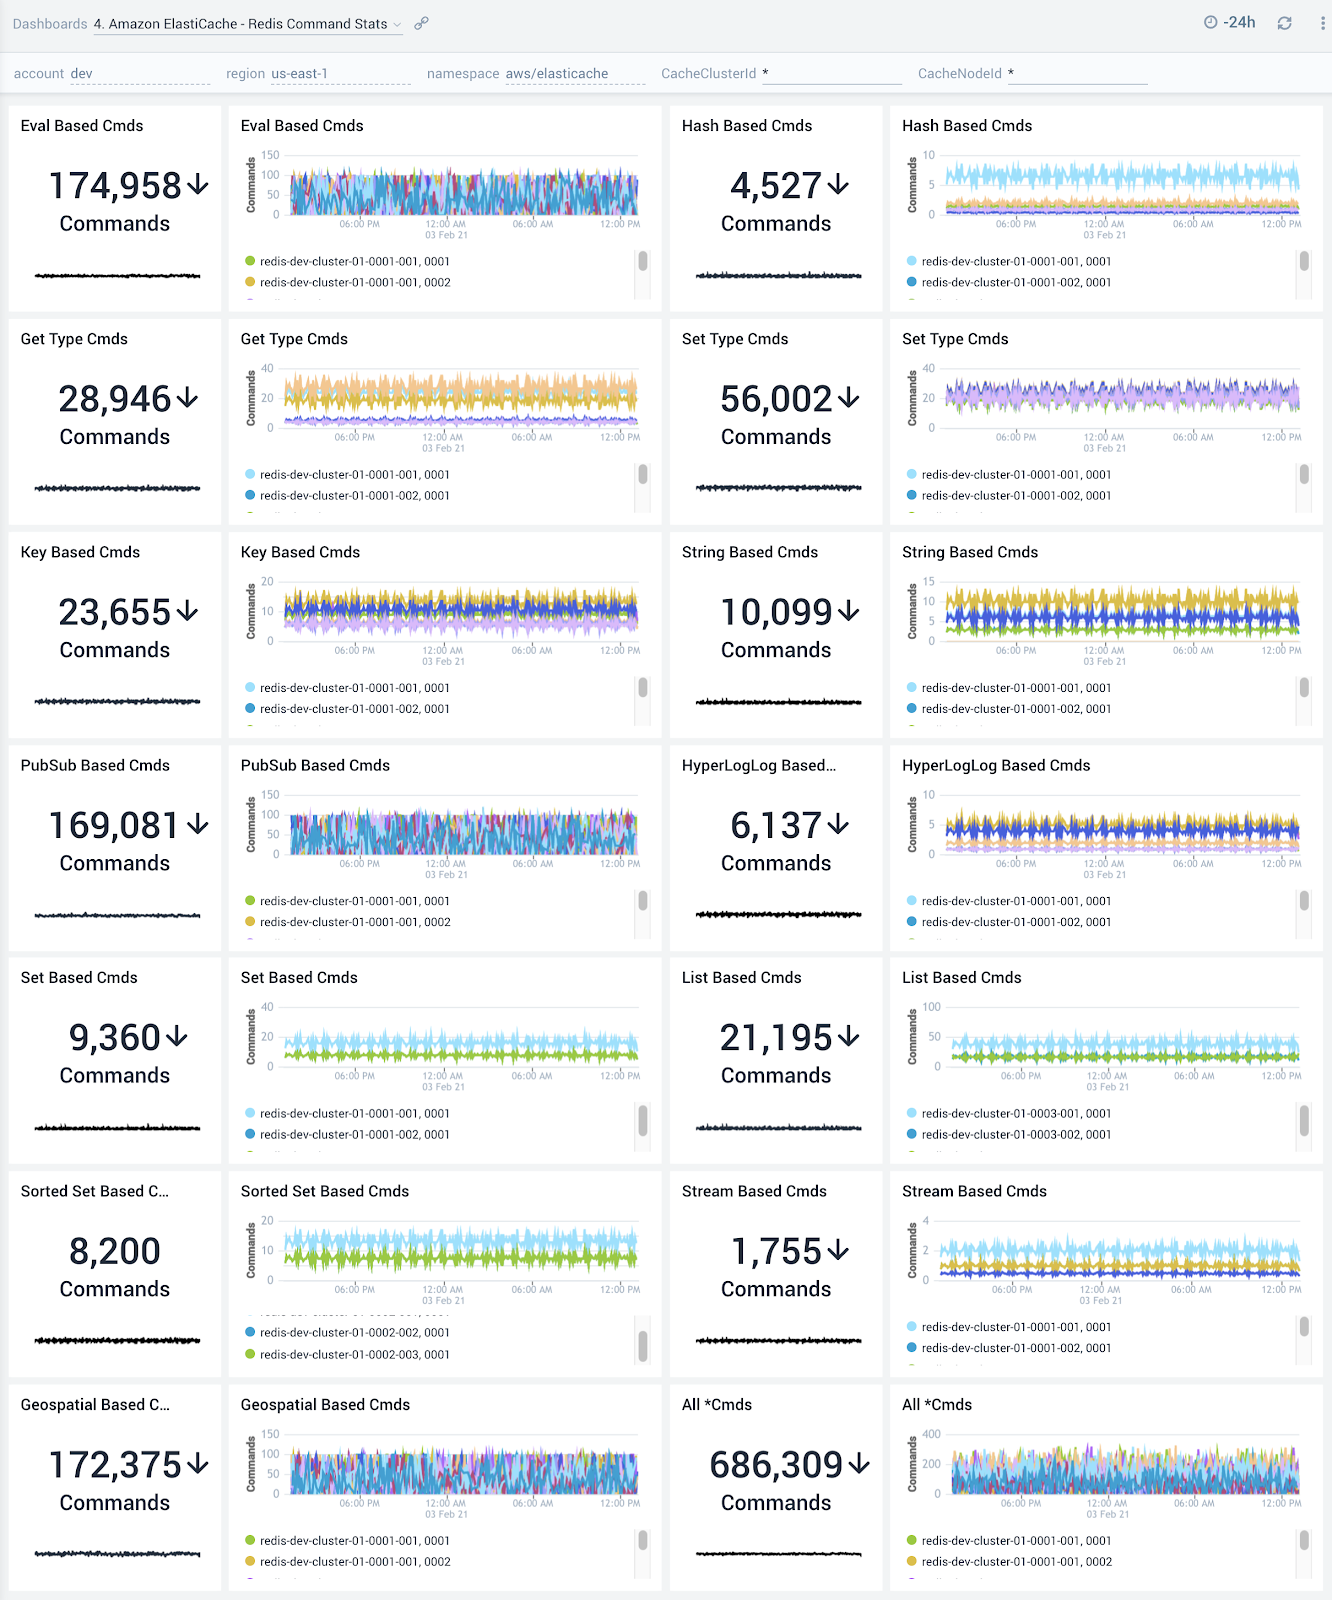
Redis Command Stats
The Amazon ElastiCache - Redis Command Stats dashboard provides detailed insights into the number of commands being performed.
Use this dashboard to:
- Monitor various Get and Set commands received by your ElastiCache clusters and nodes
- Correlate with the Redis Command Latency dashboard to identify most/least frequently used and least performant command types
If high latency commands are not being processed frequently, you will want to look into monitoring and potentially allocating more CPU resources.