Amazon Inspector

Amazon Inspector is an automated vulnerability management service that continually scans Amazon EC2 and container images for software vulnerabilities and network exposures. The Sumo Logic Inspector app helps reveal trends and identify anomalies from these findings.
For information about integrating Amazon Inspector with Security Hub, see Integration with AWS Security Hub in Amazon help.
Collecting findings for the Amazon Inspector app
Sumo Logic provides a serverless solution for creating a CloudWatch events rule and a Lambda function (SecurityHubCollector) to extract findings from AWS Security Hub.
Findings from AWS services (AWS Security Hub) are delivered to CloudWatch Events as events in near real time. The Lambda function parses those events and sends them to an S3 bucket. Sumo Logic then collects the findings data using an S3 bucket source on a Sumo Logic hosted collector. The Lambda function setup is defined using Serverless Application Model (SAM) specifications and is published in AWS Serverless Application Repository.
You can collect Security Hub logs using two methods:
- Method 1: Collect Security Hub logs using Sumo Logic HTTP endpoint
- Method 2: Collect Security Hub logs using Amazon S3 source
You do not have to manually create the AWS resources. Simply deploy the solution, as described in the Step 2: Deploy an AWS Security Hub app collector for HTTP endpoint and Step 2: Deploy an AWS Security Hub app collector for Amazon S3 source.
Method 1: Collect Security Hub logs using Sumo Logic HTTP endpoint
Step 1: Add a hosted collector and Sumo Logic HTTP source
This section demonstrates how to add a hosted Sumo Logic collector and AWS source, to collect events for the AWS Security Hub app.
Prerequisites
An HTTP source must be associated with a Sumo Logic Hosted collector. Before creating the source, identify the Sumo Logic Hosted collector you want to use, or create a new Hosted collector as described in the following task.
To add a hosted collector and HTTP source:
- To create a new Sumo Logic Hosted collector perform the steps in Configure a Hosted Collector and Source.
- Add an HTTP Source to Sumo Logic, and in Advanced Options for Logs, under Timestamp Format, click Specify a format and enter the following:
- Specify Format as
yyyy-MM-dd'T'HH:mm:ss.SSS'Z' - Specify Timestamp locator as
.*"UpdatedAt":"(.*)".* - Click Add.
- Specify Format as
Step 2: Deploy an AWS Security Hub app collector
The AWS Security Hub app collector transforms the received events and sends them to Sumo Logic. The AWS Security Hub app displays the results in pre-defined visual dashboards for you to analyze.
To deploy an AWS Security Hub app collector:
- Open a browser window and enter the following URL: https://serverlessrepo.aws.amazon.com/applications
- In the Serverless Application Repository, search for sumologic.
- Select Show apps that create custom IAM roles or resource policies check box.
- Click the sumologic-securityhub-collector-awsorg link, and then click Deploy.
- In the AWS Lambda > Functions > Application Settings panel, enter the endpoint HTTP endpoint of the source that you configured.
- Scroll to the bottom of the window and click Deploy.
Method 2: Collect Security Hub logs using Amazon S3 source
Step 1: Add a hosted collector and Amazon S3 source
This section demonstrates how to add a hosted Sumo Logic collector and AWS source, to collect events for the AWS Security Hub App.
Prerequisites
An AWS Source must be associated with a Sumo Logic Hosted Collector. Before creating the S3 source, identify the Sumo Logic Hosted Collector you want to use, or create a new Hosted Collector as described in the following task.
To add a hosted collector and Amazon S3 source:
- Grant Access to an Amazon S3 Bucket.
- To create a new Sumo Logic Hosted Collector, perform the steps in Configure a Hosted Collector.
- Add an AWS Source for the S3 Source to Sumo Logic, and in Advanced Options for Logs, under Timestamp Format, click Specify a format and enter the following:
- Specify Format as
yyyy-MM-dd'T'HH:mm:ss.SSS'Z' - Specify Timestamp locator as
.*"UpdatedAt":"(.*)".* - Click Add.
- Specify Format as
Step 2: Deploy an AWS Security Hub app collector
The AWS Security Hub app collector transforms the received events and sends them to Sumo Logic. The AWS Security Hub app displays the results in pre-defined visual dashboards for you to analyze.
To deploy an AWS Security Hub app collector:
- Open a browser window and enter the following URL: https://serverlessrepo.aws.amazon.com/applications
- In the Serverless Application Repository, search for sumologic.
- Select Show apps that create custom IAM roles or resource policies check box.
- Click the sumologic-securityhub-collector link, and then click Deploy.
- In the AWS Lambda > Functions > Application Settings panel, enter the name of the S3SourceBucketName for the bucket you configured (when you defined the S3 source).
- Scroll to the bottom of the window and click Deploy.
Sample log messages
{
  "SchemaVersion": "2018-10-08",
  "ProductArn": "arn:aws:securityhub:us-west- 2:123456789012:provider:private/default",
  "AwsAccountId": "123456789012",
  "Id": "test_finding_123456",
  "GeneratorId": "TestDetector",
  "Types": [
    "Software and Configuration Checks/Vulnerabilities/CVE"
  ],
  "CreatedAt": "2018-11- 06T13:22:13.933Z",
  "UpdatedAt": "2018-11-07T14:22:13.933Z",
  "Severity": {
    "Product": 10,
    "Normalized": 30
  },
  "Title": "Unprotected port 22 found on instance i-01234567890abcefb",
  "Description": "Test finding was found on instance i- 01234567890afbcefa",
  "Resources": [
    {
      "Type": "AwsEc2::Instance",
      "Id": "arn:aws:ec2:us-west-2: 123456789012:instance:i- 01234567890abcefa"
    }
  ],
  "SourceUrl": "http://myfp.com/recommendations/dangerous_things_and_how_to_fix_them",
  "Process": {
    "Name": "My Process",
    "Path": "/Process/Path"
  },
  "RecordState": "ACTIVE",
  "Note": {
    "Text": "User1 will address this finding",
    "UpdatedBy": "User1",
    "UpdatedAt": "2018-11-03T13:22:13.933Z"
  }
}
Sample queries
(_sourceCategory="securityhub_findings" OR _sourceCategory="Labs/AWS/SecurityHub")
| json  "AwsAccountId", "Id", "GeneratorId", "ProductArn", "CreatedAt", "UpdatedAt", "Resources",
 "Severity.Normalized", "SourceUrl",
"Types", "Compliance.Status" as aws_account_id, finding_id, generator_id, product_arn, created_at,
 updated_at, resources, severity_normalized, sourceurl, finding_types, compliance_status nodrop
| parse regex field=finding_types "\"(?<finding_type>.*?)\"" multi
| parse regex field=resources "\"Type\":\"(?<resource_type>.*?)\"" multi
| parse regex field=resources "\"Id\":\"(?<resource_id>.*?)\"" multi
| parse regex field=product_arn "product/(?<finding_provider>.*?)$"
| min(severity_normalized), pct(severity_normalized,25), pct(severity_normalized,50), pct(severity_normalized,75),
  max(severity_normalized) by resource_type
Installing the Amazon Inspector app
Once you've set up ingestion of findings from AWS Security Hub, you can install the Sumo Logic app for Amazon Inspector and use the pre-configured searches and dashboards.
To install the app, do the following:
Next-Gen App: To install or update the app, you must be an account administrator or a user with Manage Apps, Manage Monitors, Manage Fields, Manage Metric Rules, and Manage Collectors capabilities depending upon the different content types part of the app.
- Select App Catalog.
- In the 🔎 Search Apps field, run a search for your desired app, then select it.
- Click Install App.
note
Sometimes this button says Add Integration.
- Click Next in the Setup Data section.
- In the Configure section of your respective app, complete the following fields.
- Field Name. If you already have collectors and sources set up, select the configured metadata field name (eg _sourcecategory) or specify other custom metadata (eg: _collector) along with its metadata Field Value.
- Click Next. You will be redirected to the Preview & Done section.
Post-installation
Once your app is installed, it will appear in your Installed Apps folder, and dashboard panels will start to fill automatically.
Each panel slowly fills with data matching the time range query received since the panel was created. Results will not immediately be available but will be updated with full graphs and charts over time.
Viewing the Amazon Inspector Overview dashboard
All dashboards have a set of filters that you can apply to the entire dashboard. Use these filters to drill down and examine the data to a granular level.
- You can change the time range for a dashboard or panel by selecting a predefined interval from a drop-down list, choosing a recently used time range, or specifying custom dates and times. Learn more.
- You can use template variables to drill down and examine the data on a granular level. For more information, see Filtering Dashboards with Template Variables.
- Most Next-Gen apps allow you to provide the scope at the installation time and are comprised of a key (
_sourceCategoryby default) and a default value for this key. Based on your input, the app dashboards will be parameterized with a dashboard variable, allowing you to change the dataset queried by all panels. This eliminates the need to create multiple copies of the same dashboard with different queries.
The dashboard provides an overview of Security Hub findings broken down by severity.
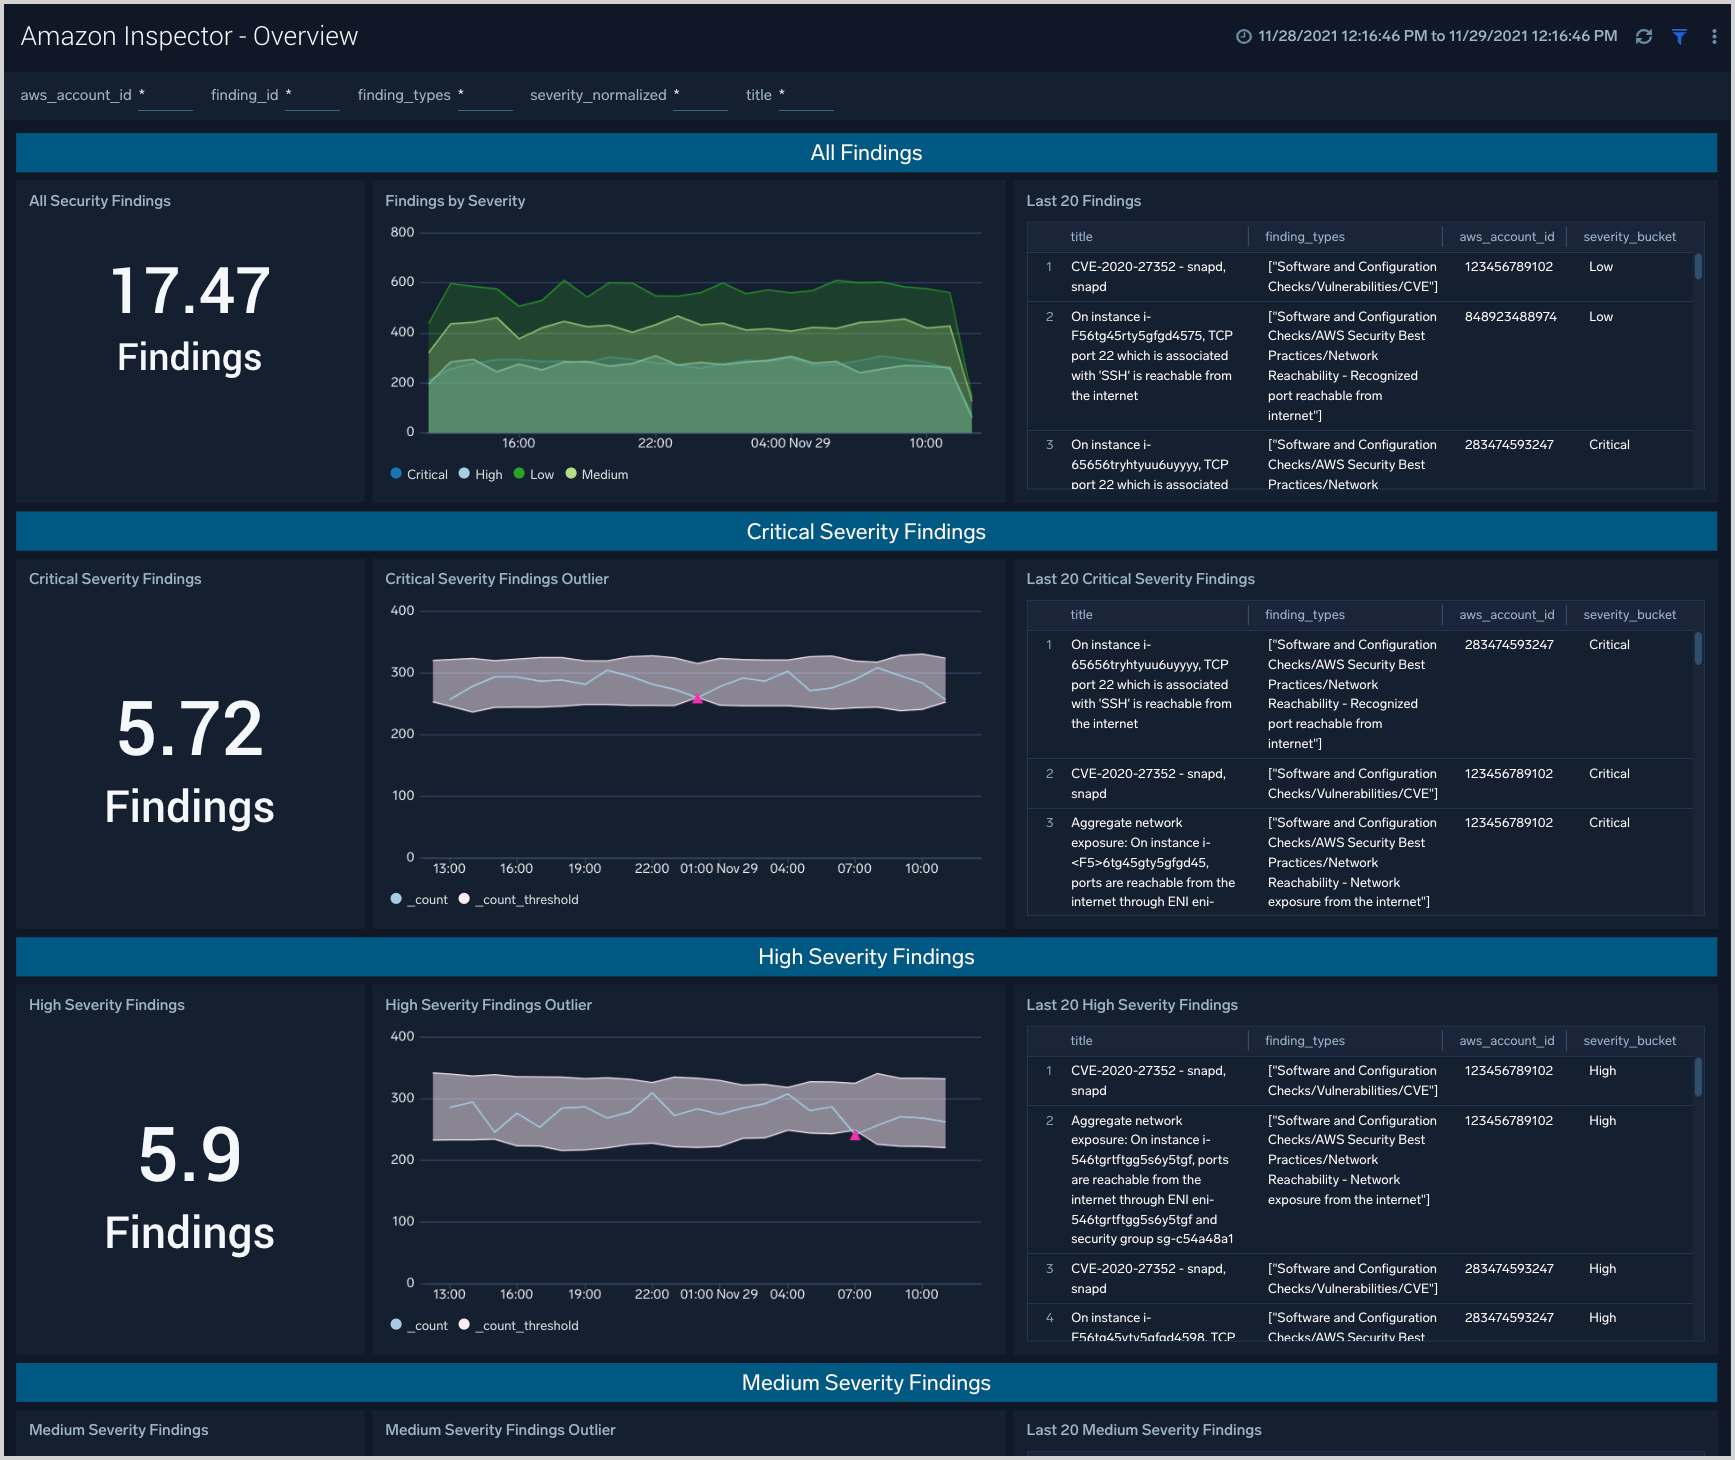
Findings Summary
The top panel of the dashboard presents:
- All Findings. The count of total security findings during the last 24 hours by default, or during the currently selected time range.
- Findings by Severity. A stacked line chart showing the count of findings by severity, during the last 24 hours by default, or during the currently selected time range.
- Last 20 Findings. A table detailing the 20 most recent findings.
Critical, high, medium, low severity findings
The other panels on the dashboard, for Critical, High, Medium, and Low Severity findings, have similar content. The only difference is they each are filtered by the listed severity level.
- Severity Findings. The count of findings at this severity during the last 24 hours by default, or during the currently selected time range.
- Severity Outliers. Shows the trending volume of findings at this severity level during the last 24 hours by default, or during the currently selected time range. The gray shaded area corresponds to 3 standard deviations of the past 10 mean values. Pink triangles show values that exceed that threshold and are likely points of investigation considering the large change in volume of findings.
- Last 20 Severity Findings. A table detailing the 20 most recent findings at this severity level.
Upgrade/Downgrade the Amazon Inspector app (Optional)
To update the app, do the following:
Next-Gen App: To install or update the app, you must be an account administrator or a user with Manage Apps, Manage Monitors, Manage Fields, Manage Metric Rules, and Manage Collectors capabilities depending upon the different content types part of the app.
- Select App Catalog.
- In the Search Apps field, search for and then select your app.
Optionally, you can identify apps that can be upgraded in the Upgrade available section. - To upgrade the app, select Upgrade from the Manage dropdown.
- If the upgrade does not have any configuration or property changes, you will be redirected to the Preview & Done section.
- If the upgrade has any configuration or property changes, you will be redirected to the Setup Data page.
- In the Configure section of your respective app, complete the following fields.
- Field Name. If you already have collectors and sources set up, select the configured metadata field name (eg _sourcecategory) or specify other custom metadata (eg: _collector) along with its metadata Field Value.
- Click Next. You will be redirected to the Preview & Done section.
Post-update
Your upgraded app will be installed in the Installed Apps folder and dashboard panels will start to fill automatically.
See our Release Notes changelog for new updates in the app.
To revert the app to a previous version, do the following:
- Select App Catalog.
- In the Search Apps field, search for and then select your app.
- To version down the app, select Revert to < previous version of your app > from the Manage dropdown.
Uninstalling the Amazon Inspector app (Optional)
To uninstall the app, do the following:
- Select App Catalog.
- In the 🔎 Search Apps field, run a search for your desired app, then select it.
- Click Uninstall.