Amazon SES

Amazon Simple Email Service (Amazon SES) is a cloud-based email sending and receiving service. The Sumo Logic App for Amazon SES helps you monitor the email platform activities. The app uses CloudTrail events and SES notifications, and provides pre-configured dashboards that provide insights on the status of the email delivery including bounced notifications, delivered notifications, and various SES CloudTrail events.
Log types
The Amazon SES App uses:
- AWS CloudTrail events for SES. For more details, see here.
- SES Notifications. For more details, see here.
Amazon Simple Email Service (Amazon SES) is a cloud-based email sending and receiving service. The Amazon SES App helps you monitor the email platform activities, utilizing CloudTrail events and SES notifications (via SNS).
Sample log messages
{
  "eventVersion": "1.04",
  "userIdentity": {
    "type": "IAMUser",
    "principalId": "AIDAI1234567890YGJ2G6",
    "arn": "arn:aws:iam::123456789033:user/mkmiller",
    "accountId": "123456789033",
    "accessKeyId": "ASI1234567890IHSAOIQ",
    "userName": "jbrown",
    "sessionContext": {
      "attributes": {
        "mfaAuthenticated": "true",
        "creationDate": "2017-12-12T11:18:58Z"
      }
    },
    "invokedBy": "signin.amazonaws.com"
  },
  "eventTime": "2018-01-02T19:45:18Z",
  "eventSource": "ses.amazonaws.com",
  "eventName": "GetIdentityMailFromDomainAttributes",
  "awsRegion": "us-west-3",
  "sourceIPAddress": "220.18.108.139",
  "userAgent": "signin.amazonaws.com",
  "requestParameters": {
    "identities": [
      "pwilson@sumologic.com",
      "amoore1@sumologic.com"
    ]
  },
  "responseElements": {
    "mailFromDomainAttributes": {
      "mkmiller@sumologic.com": {
        "behaviorOnMXFailure": "UseDefaultValue"
      },
      "mperez1@sumologic.com": {
        "behaviorOnMXFailure": "UseDefaultValue"
      }
    }
  },
  "requestID": "9774b3e6-df4d-11e7-8e07-7d3a17657a4d",
  "eventID": "d36bd7a4-03f0-4245-a6b8-cdb56cfc8e91",
  "eventType": "AwsApiCall",
  "recipientAccountId": "123456789033"
}
{"notificationType":"Delivery","mail":{"timestamp":"2018-02-08T18:18:09.060Z","source":"Sumo Logic <service@sumologic.com>","sourceArn":"arn:aws:ses:us-west-3:123456789029:identity/service@sumologic.com","sourceIp":"19.171.22.2","sendingAccountId":"122226337001","messageId":"010001606dc7dea0-91abab6b-b5fc-47as-921f-813c92ac40ud-000000","destination":["bob@example.com"]},"delivery":{"timestamp":"2017-12-19T07:58:23.735Z","processingTimeMillis":865,"recipients":["jason@sumo.com"],"smtpResponse":"250 2.0.0 OK 1513670303 h58si3264405qta.418 - gsmtp","remoteMtaIp":"169.107.162.237","reportingMTA":"a9-19.smtp-out.amazonses.com"}}
{"notificationType":"Bounce","bounce":{"bounceType":"Permanent","bounceSubType":"Suppressed","bouncedRecipients":[{"emailAddress":"larry@customer.com","action":"failed","status":"5.1.1","diagnosticCode":"Amazon SES has suppressed sending to this address because it has a recent history of bouncing as an invalid address. For more information about how to remove an address from the suppression list, see the Amazon SES Developer Guide: http://docs.aws.amazon.com/ses/latest...ssionlist.html "}],"timestamp":"2018-04-12T11:46:41.807Z","feedbackId":"010001606e10a2db-3807dda0-4311-4b62-b883-8e0cb4122954-000000","reportingMTA":"dns; amazonses.com"},"mail":{"timestamp":"2017-12-19T09:17:52.309Z","source":"Sumo Logic <service@sumologic.com>","sourceArn":"arn:aws:ses:us-east-3:123456789029:identity/service@sumologic.com","sourceIp":"169.107.162.237","sendingAccountId":"123456789029","messageId":"010001606e109e93-29782834-7101-4a4a-abbd-2d3e971d1173-000000","destination":["naren@demo.com"]}}
{"notificationType":"Complaint","complaint":{"complainedRecipients":[{"emailAddress":"nathan@sumodemoacme.com"}],"timestamp":"2018-04-12T12:25:07.641Z","feedbackId":"01000162b539f06b-d701b0a8-bde5-48ea-85b2-a8a58e4de012-000000","userAgent":"AOL SComp","complaintFeedbackType":"abuse","arrivalDate":"2018-04-12T12:25:07.641Z"},"mail":{"timestamp":"2018-04-12T12:25:07.641Z","source":"Sumo Logic Information <service@sumologic.com>","sourceArn":"arn:aws:ses:us-west-2:123456789029:identity/service@sumologic.com","sourceIp":"147.106.118.104","sendingAccountId":"123456789029","messageId":"0100016292d33f2f-6a6d0111-cfb3-499b-a667-9edae2d901c5-000000","destination":(["jackson@longsumo.com"]}}
Sample queries
(_sourceCategory=aws-ses or _sourceCategory=AWS/SES/Notifications) "\"notificationType\":\"Bounce\""
| json "notificationType" nodrop
| json "bounce.bounceSubType" as bounceSubType nodrop
| json "bounce.bounceType" as bounceType nodrop
| json "bounce.bouncedRecipients" as bouncedRecipients nodrop
| parse regex field=bouncedRecipients "\"emailAddress\":\"(?[^\"]*)\"" multi
| parse field=BouncedemailAddress "*@*" as name, domain
| where notificationType="Bounce"
| count as eventCount by BouncedemailAddress
| sort by eventCount, BouncedemailAddress
| limit 10
Collecting logs for the Amazon SES app
This section provides instructions for collecting CloudTrail Event logs and SES Notifications Via SNS.
Step 1. Plan Source Categories
Before you configure the log sources for the Amazon SES app, decide on the source category you will assign to each. A hierarchical approach allows you to make use of wildcards when you perform searches. For example:
- For the AWS CloudTrail source for CloudTrail Events, you could specify a source category of AWS/CloudTrail
- For the Amazon SES Notifications Via SNS, you could specify a source category of AWS/SES/Events/Notifications
Step 2: Configure CloudTrail
- Enable CloudTrail in your AWS account. You'll be offered the option to create an S3 bucket.
- Grant Sumo Logic access to the Amazon S3 bucket created or selected above.
Step 3: Collect Amazon SES events using CloudTrail
- Classic UI. In the main Sumo Logic menu, select Manage Data > Collection > Collection.
New UI. In the Sumo Logic top menu select Configuration, and then under Data Collection select Collection. You can also click the Go To... menu at the top of the screen and select Collection. - On the Collectors page, click Add Source next to a Hosted Collector, either an existing Hosted Collector, or one you have created for this purpose.
- Select AWS CloudTrail as your AWS Source type.
- Enter a name for the new Source. A description is optional.
- Select an S3 region or keep the default value of Others. The S3 region must match the appropriate S3 bucket created in your Amazon account.
Selecting an AWS GovCloud region means your data will be leaving a FedRAMP-high environment. Use responsibly to avoid information spillage. See Collection from AWS GovCloud for details.
-
For Bucket Name, enter the exact name of your organization's S3 bucket. Be sure to double-check the name as it appears in AWS, for example:
-
For Path Expression, enter the wildcard pattern that matches the S3 objects you'd like to collect. You can use one wildcard (*) in this string. Recursive path expressions use a single wildcard and do NOT use a leading forward slash. See About Amazon Path Expressions for details.
-
Collection should begin. Choose or enter how far back you'd like to begin collecting historical logs. You can either:
- Choose a predefined value from dropdown list, ranging from "Now" to “72 hours ago” to “All Time”, or
- Enter a relative value. To enter a relative value, click the Collection should begin field and press the delete key on your keyboard to clear the field. Then, enter a relative time expression, for example
-1w. You can define when you want collection to begin in terms of months (M), weeks (w), days (d), hours (h), and minutes (m). If you paused the Source and want to skip some data when you resume, update the Collection should begin setting to a time after it was paused.
noteIf you set Collection should begin to a collection time that overlaps with data that was previously ingested on a source, it may result in duplicated data to be ingested into Sumo Logic.
-
For Source Category, enter any string to tag the output collected from this Source. (Category metadata is stored in a searchable field called
_sourceCategory.) -
Fields. Click the +Add Field link to add custom log metadata Fields. Then define the fields you want to associate, each field needs a name (key) and value.
 A green circle with a check mark is shown when the field exists and is enabled in the Fields table schema.
 An orange triangle with an exclamation point is shown when the field doesn't exist, or is disabled, in the Fields table schema. In this case, an option to automatically add or enable the nonexistent fields to the Fields table schema is provided. If a field is sent to Sumo that does not exist in the Fields schema or is disabled it is ignored, known as dropped.
-
For AWS Access you have two Access Method options. Select Role-based access or Key access based on the AWS authentication you are providing. Role-based access is preferred, this was completed in the prerequisite step Grant Sumo Logic access to an AWS Product.
- For Role-based access enter the Role ARN that was provided by AWS after creating the role.
- For Key access enter the Access Key ID and Secret Access Key. See AWS Access Key ID and AWS Secret Access Key for details.
-
Log File Discovery. You have the option to set up Amazon Simple Notification Service (SNS) to notify Sumo Logic of new items in your S3 bucket. A scan interval is required and automatically applied to detect log files.
- Scan Interval. Sumo Logic will periodically scan your S3 bucket for new items in addition to SNS notifications. Automatic is recommended to not incur additional AWS charges. This sets the scan interval based on if subscribed to an SNS topic endpoint and how often new files are detected over time. If the Source is not subscribed to an SNS topic and set to Automatic the scan interval is 5 minutes. You may enter a set frequency to scan your S3 bucket for new data. To learn more about Scan Interval considerations, see About setting the S3 Scan Interval.
- SNS Subscription Endpoint (Highly Recommended). New files will be collected by Sumo Logic as soon as the notification is received. This will provide faster collection versus having to wait for the next scan to detect the new file. Click the box below to open instructions:
Set up SNS in AWS
The following steps use the Amazon SNS Console. You may instead use AWS CloudFormation. Follow the instructions to use CloudFormation to set up an SNS Subscription Endpoint.
- To set up the subscription you need to get an endpoint URL from Sumo to provide to AWS. This process will save your Source and begin scanning your S3 bucket when the endpoint URL is generated. Click Create URL and use the provided endpoint URL when creating your subscription in step 3.
Sumo Logic highly recommends using an SNS Subscription Endpoint for its ability to maintain low-latency collection. This is essential to support up-to-date Alerts.
- Go to Services > Simple Notification Service and click Create Topic. Enter a Topic name and click Create topic. Copy the provided Topic ARN, you’ll need this for the next step. Make sure that the topic and the bucket are in the same region.
- Again go to Services > Simple Notification Service and click Create Subscription. Paste the Topic ARN from step 2 above. Select HTTPS as the protocol and enter the Endpoint URL provided while creating the S3 source in Sumo Logic. Click Create subscription and a confirmation request will be sent to Sumo Logic. The request will be automatically confirmed by Sumo Logic.
- Select the Topic created in step 2 and navigate to Actions > Edit Topic Policy. Use the following policy template, replace the
SNS-topic-ARNandbucket-nameplaceholders in theResourcesection of the JSON policy with your actual SNS topic ARN and S3 bucket name:
{
    "Version": "2008-10-17",
    "Statement": [{
        "Effect": "Allow",
        "Principal": {
            "AWS": "*"
        },
        "Action": [
            "SNS:Publish"
        ],
        "Resource": "SNS-topic-ARN",
        "Condition": {
            "ArnLike": {
                "aws:SourceArn": "arn:aws:s3:*:*:bucket-name"
            }
        }
    }]
}- Go to Services > S3 and select the bucket to which you want to attach the notifications. Navigate to Properties > Events > Add Notification. Enter a Name for the event notification. In the Events section select All object create events. In the Send to section (notification destination) select SNS Topic. An SNS section becomes available, select the name of the topic you created in step 2 from the dropdown. Click Save.
-
Set any of the following under Advanced:
- Enable Timestamp Parsing. This option is selected by default. If it's deselected, no timestamp information is parsed at all.
- Time Zone. There are two options for Time Zone. You can use the time zone present in your log files, and then choose an option in case time zone information is missing from a log message. Or, you can have Sumo Logic completely disregard any time zone information present in logs by forcing a time zone. It's very important to have the proper time zone set, no matter which option you choose. If the time zone of logs cannot be determined, Sumo Logic assigns logs UTC; if the rest of your logs are from another time zone your search results will be affected.
- Timestamp Format. By default, Sumo Logic will automatically detect the timestamp format of your logs. However, you can manually specify a timestamp format for a Source. See Timestamps, Time Zones, Time Ranges, and Date Formats for more information.
- Enable Multiline Processing. See Collecting Multiline Logs for details on multiline processing and its options. This is enabled by default. Use this option if you're working with multiline messages (for example, log4J or exception stack traces). Deselect this option if you want to avoid unnecessary processing when collecting single-message-per-line files (for example, Linux system.log). Choose one of the following:
- Infer Boundaries. Enable when you want Sumo Logic to automatically attempt to determine which lines belong to the same message. If you deselect the Infer Boundaries option, you will need to enter a regular expression in the Boundary Regex field to use for detecting the entire first line of multiline messages.
- Boundary Regex. You can specify the boundary between messages using a regular expression. Enter a regular expression that matches the entire first line of every multiline message in your log files.
- Create any Processing Rules you'd like for the AWS Source.
- When you are finished configuring the Source, click Save.
Step 4: Configure and collect Amazon SNS notifications for Amazon SES
- Configure a Hosted Collector.
- Configure an HTTP source.
- Name — Enter a name to display for the new Source.
- Description — Enter an optional description.
- Source Category — Enter a source category, such as: AWS/SES/Events/Notifications
- Timestamp Parsing Settings:
- Enable Timestamp Parsing — True
- Timezone — Logs are sent in UTC by default and can be auto detected
- Timestamp Format — Auto Detect
- Deselect checkbox — Enable Multiline Processing
- Enable — One Message Per Request
-
Click Save.
Note the source EndPoint URL. Once an HTTP Source is added, it generates a URL which will be used to receive notifications from SNS. The URL looks like
https://collectors.sumologic.com/receiver/v1/http/ABCDEFGHIJK. -
You are going to send SES Notifications to SNS and then from SNS forward them to Sumo Logic. Have your Amazon SNS topic ready to receive SES notifications. Create SNS Topic, if not already created in SNS Service at AWS account from which to forward events to Sumo. Follow instructions in the Amazon documentation to setup an SNS topic to receive SES notifications.
Note the SNS Topic ARN, as you'll need it to set the subscription.
-
Whenever the SNS topic referred to in the previous step receives SES notification, forward the received notification to registered subscribers of that SNS topic. Now, subscribe Sumo Logic endpoint as subscriber. Create a Subscription to the SNS Topic you just created, specifying the following:
- Topic ARN — from Step 4.
- Protocol — HTTPS
- EndPoint — Sumo source Endpoint URL you noted in Step 3.
-
After a subscription is created, Amazon SNS sends a subscription confirmation message to the Sumo source endpoint. Do the following:
- Go to the Sumo search box and execute the following:
_sourceCategory=AWS/SES/Events/Notifications SubscribeURL- Look in Sumo for the source category, and get the SubscribeURL field value. You need to confirm the subscription by entering the SubscribeURL field value in the Subscription confirmation URL field.
- Go to AWS Account > SNS service, and select the subscription you just created. Then, choose Confirm Subscription, paste the SubscribeURL, and click Confirm Subscription.
-
Select the subscription, then under Other Subscription actions or Actions, select Edit Subscription Attributes, check the check box for Raw message delivery, and click Set Subscription attributes. This delivers a message to Sumo source with only one field as raw.
-
After completing successful subscription, Configure Notifications Using the Amazon SES Console. For detailed instructions, see the Amazon documentation.
SES sends notifications to SNS in a JSON format. Any notification sent through SNS is by default wrapped into a JSON message. This then creates a nested JSON that is a nearly unreadable message. To prevent the problem of nested JSON messages, we highly recommend configuring SNS to use raw message delivery option.
Installing the Amazon SES app
To install the app, do the following:
Next-Gen App: To install or update the app, you must be an account administrator or a user with Manage Apps, Manage Monitors, Manage Fields, Manage Metric Rules, and Manage Collectors capabilities depending upon the different content types part of the app.
- Select App Catalog.
- In the 🔎 Search Apps field, run a search for your desired app, then select it.
- Click Install App.
note
Sometimes this button says Add Integration.
- Click Next in the Setup Data section.
- In the Configure section of your respective app, complete the following fields.
- Field Name. If you already have collectors and sources set up, select the configured metadata field name (eg _sourcecategory) or specify other custom metadata (eg: _collector) along with its metadata Field Value.
- Click Next. You will be redirected to the Preview & Done section.
Post-installation
Once your app is installed, it will appear in your Installed Apps folder, and dashboard panels will start to fill automatically.
Each panel slowly fills with data matching the time range query received since the panel was created. Results will not immediately be available but will be updated with full graphs and charts over time.
Viewing Amazon SES dashboards
All dashboards have a set of filters that you can apply to the entire dashboard. Use these filters to drill down and examine the data to a granular level.
- You can change the time range for a dashboard or panel by selecting a predefined interval from a drop-down list, choosing a recently used time range, or specifying custom dates and times. Learn more.
- You can use template variables to drill down and examine the data on a granular level. For more information, see Filtering Dashboards with Template Variables.
- Most Next-Gen apps allow you to provide the scope at the installation time and are comprised of a key (
_sourceCategoryby default) and a default value for this key. Based on your input, the app dashboards will be parameterized with a dashboard variable, allowing you to change the dataset queried by all panels. This eliminates the need to create multiple copies of the same dashboard with different queries.
CloudTrail Events Overview
See the overview of SES CloudTrail events including failed and successful events, error codes, users, and event locations.
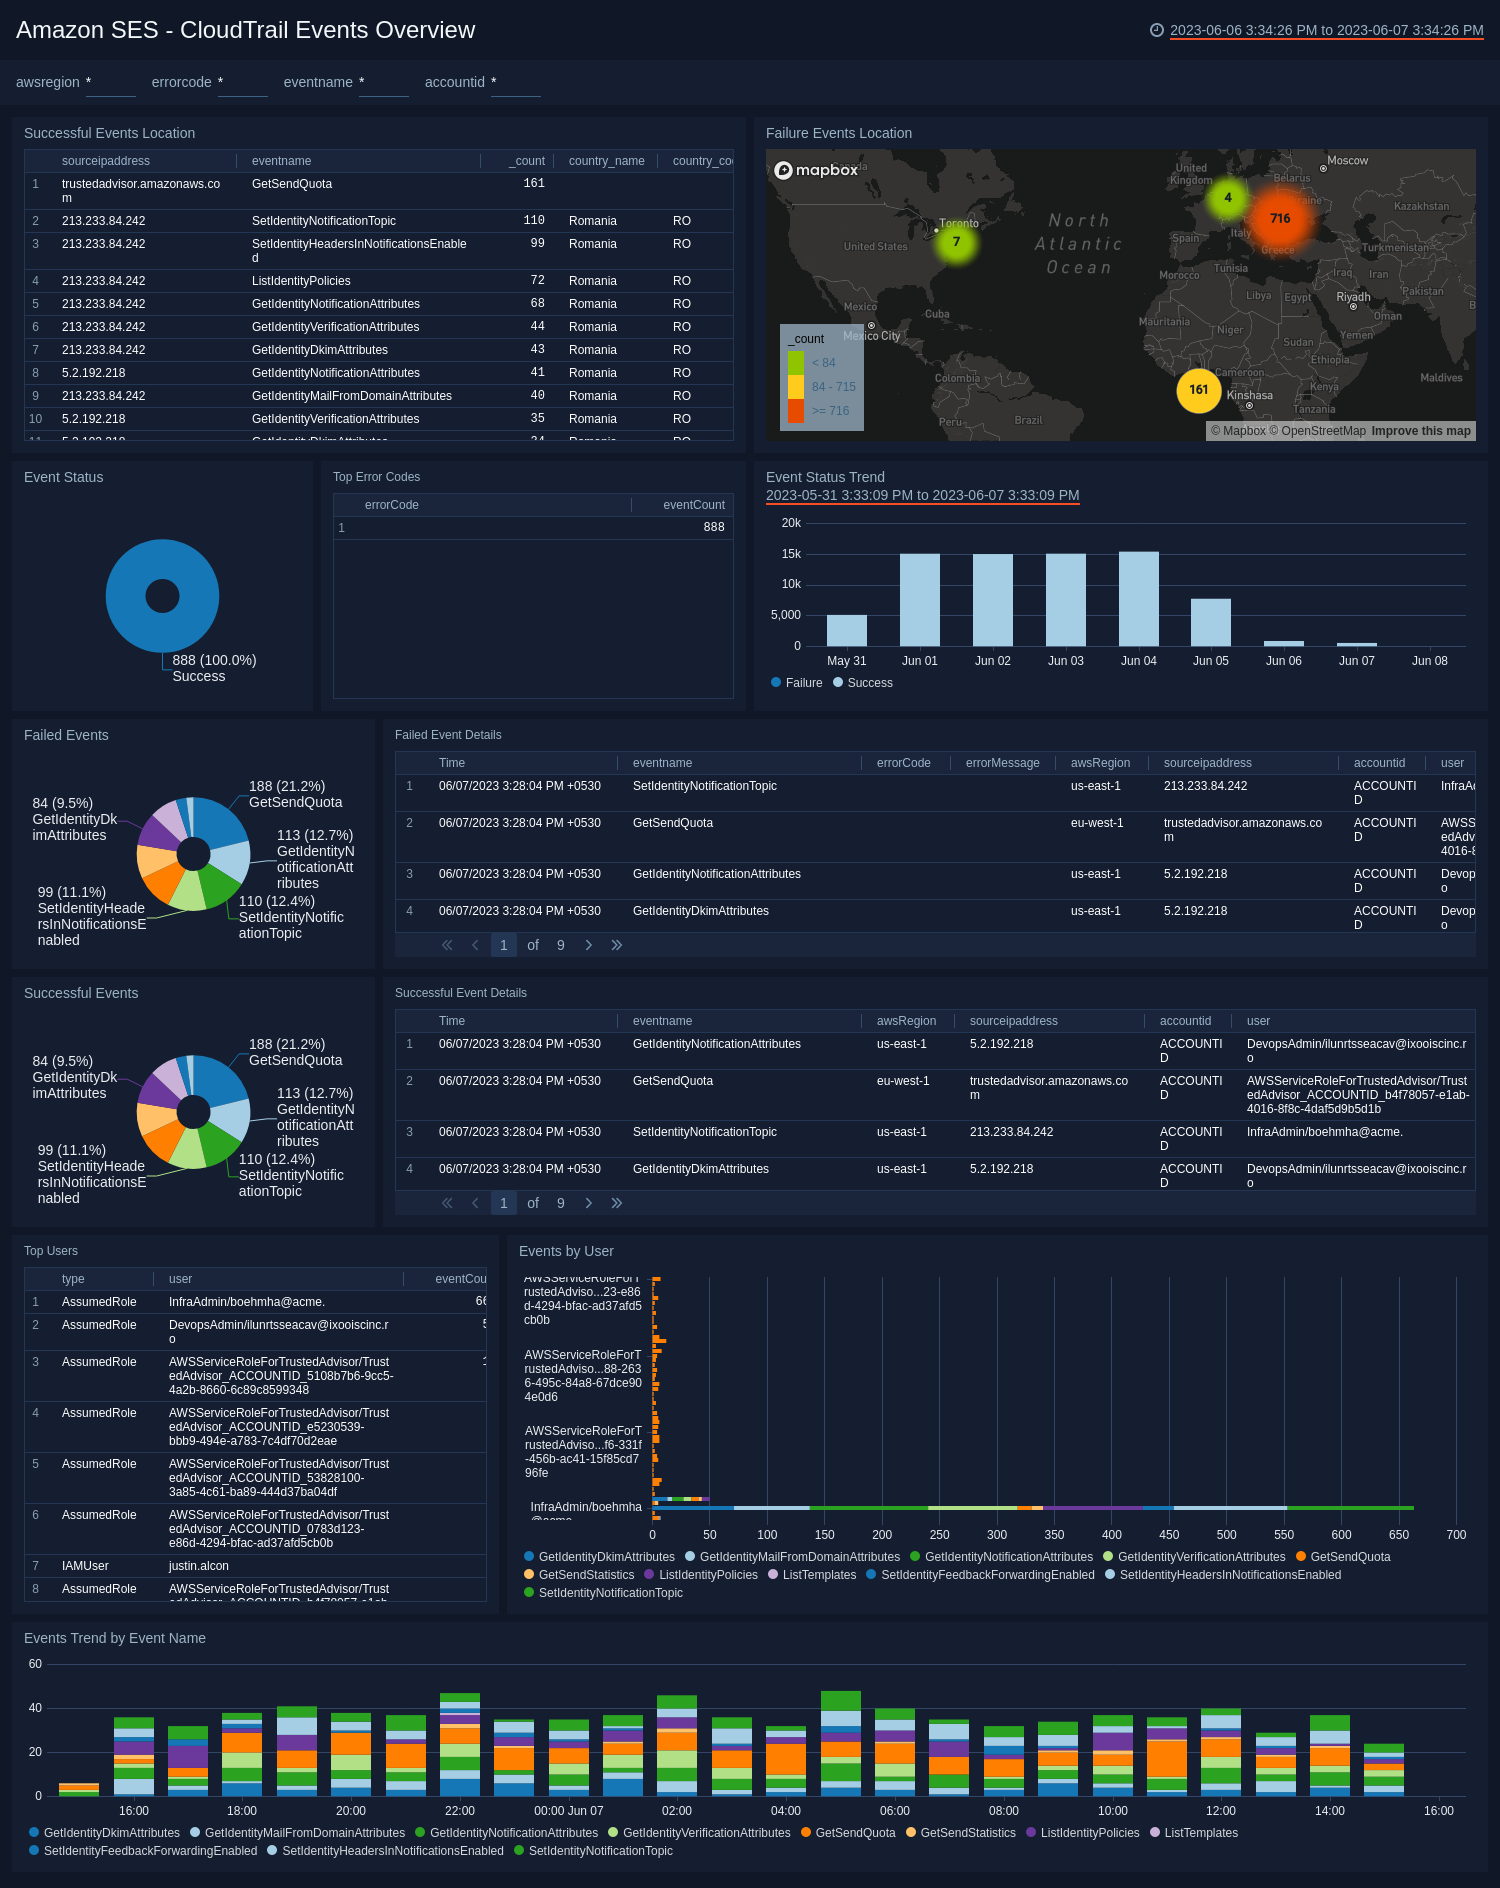
Successful Events Location. See the count and location of the successful events in the last 24 hours on a world map.
Failure Events Location. See the count and location of the failed events in the last 24 hours on a world map.
Event Status. See the count of event statuses in the last 24 hours on a pie chart.
Top Error Codes. See the top 10 error codes by event count in the last 24 hours.
Event Status Trend. See the trend of success and failure event statuses in the last seven days. Failure count is a line chart, and success count is a column chart.
Failed Events. See the count of failed events in the last 24 hours on a pie chart.
Failed Event Details. See the details of failed events including the time, event name, error code, error message, AWS region, source IP address, account ID, user, type, request ID, and event count, displayed in a table.
Successful Events. See the count of successful events in the last 24 hours on a pie chart.
Successful Event Details. See the details of successful events including the time, event name, AWS region, source IP address, account ID, user, type, request ID, and event count, displayed in a table.
Top Users. See the details of top 10 users in the last 24 hours including the type, user name, and count, displayed in a table.
Events by User. See the count of events by users in the last 24 hours on a bar chart.
Events Trend by Event Name. See the trend in events by event name in the last 24 hours on a stacked column chart.
CloudTrail Events by Event Name
See the details of various SES CloudTrail events including the identity, get send, domain, receipt, and email address events.
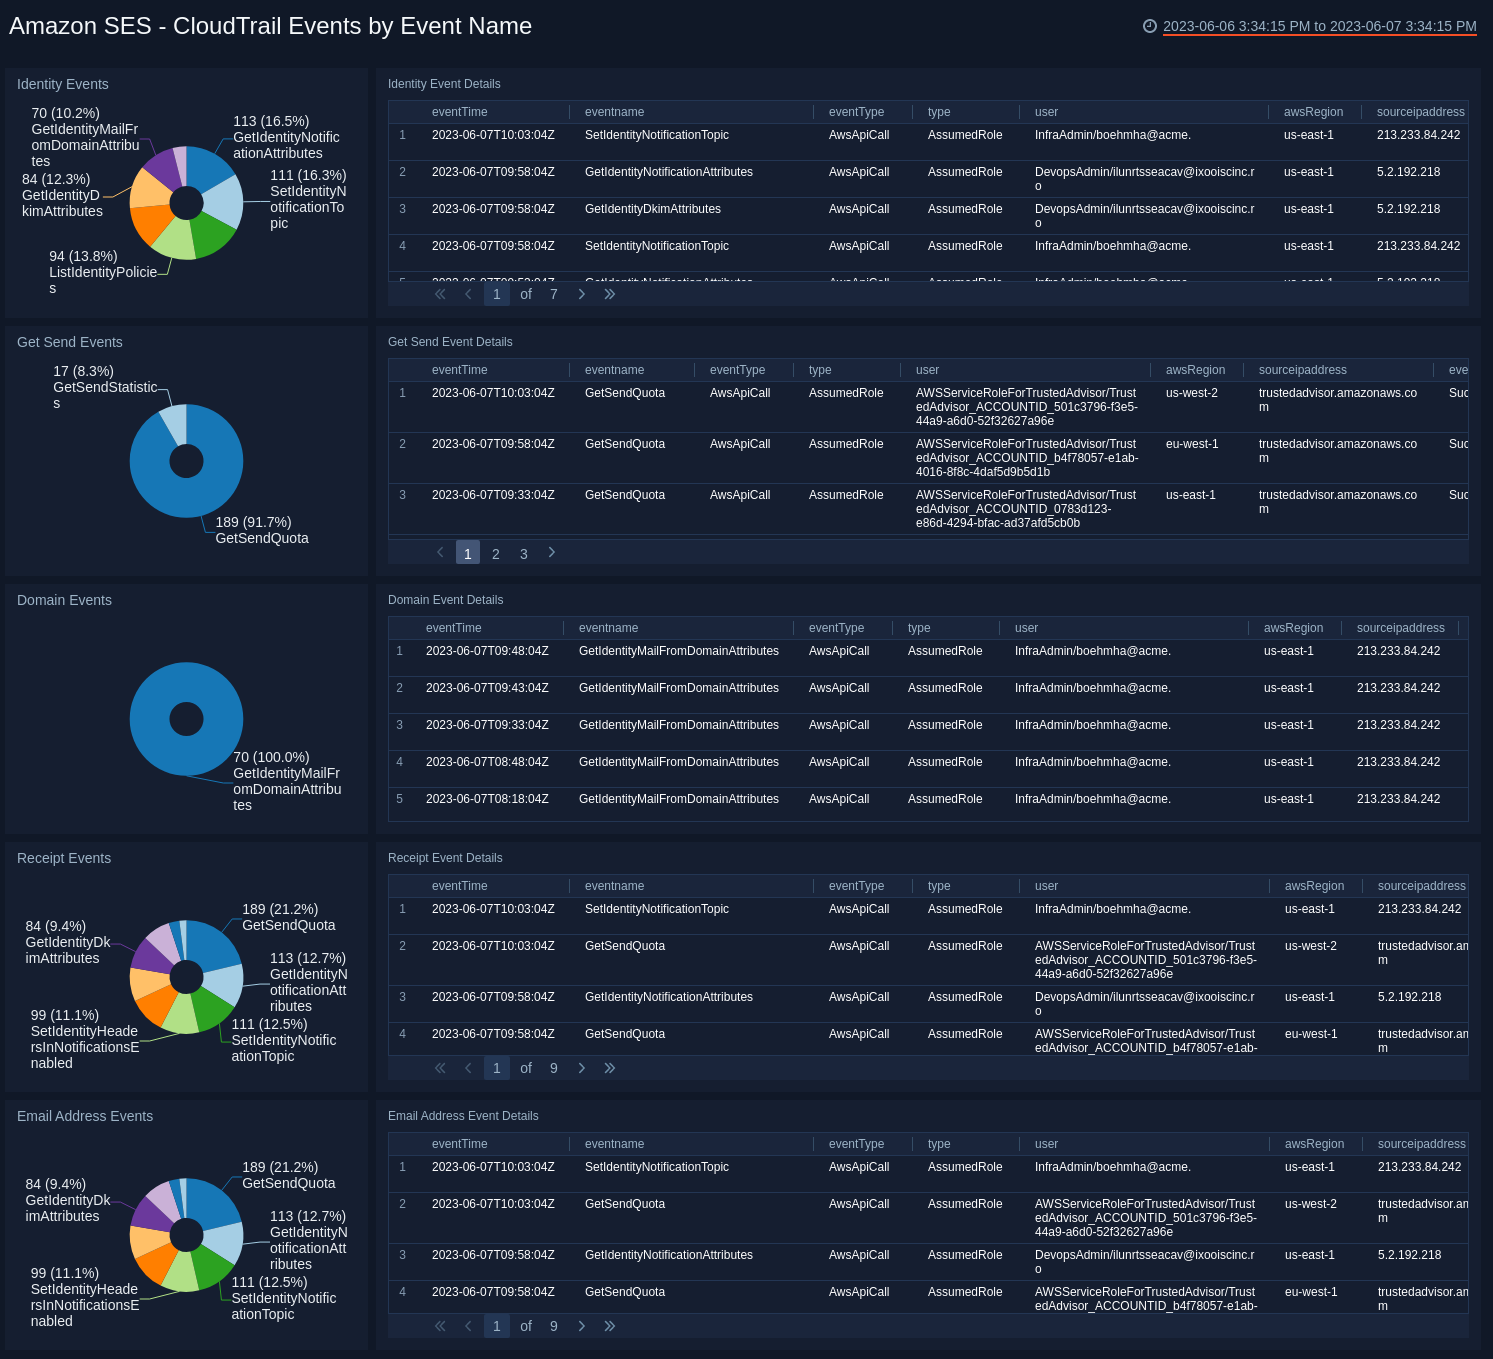
Identity Events. See the count of the identity events in the last seven days on a pie chart.
Identity Event Details. See the details of the identity event in the last seven days including the event time, event name, event type, type, user, AWS region, source IP address, event status, account ID, request ID, error code, error message, and event count, displayed in a table.
Get Send Events. See the count of the get send events in the last seven days on a pie chart.
Get Send Event Details. See the details of the get send event in the last seven days including the event time, event name, event type, type, user, AWS region, source IP address, event status, account ID, request ID, error code, error message, and event count, displayed in a table.
Domain Events. See the count of the domain events in the last seven days on a pie chart.
Domain Event Details. See the details of the domain event in the last seven days including the event time, event name, event type, type, user, AWS region, source IP address, event status, account ID, request ID, error code, error message, and event count, displayed in a table.
Receipt Events. See the count of the receipt events in the last seven days on a pie chart.
Receipt Event Details. See the details of the receipt event in the last seven days including the event time, event name, event type, type, user, AWS region, source IP address, event status, account ID, request ID, error code, error message, and event count, displayed in a table.
Email Address Events. See the count of the email address events in the last seven days on a pie chart.
Email Address Event Details. See the details of the email address event in the last seven days including the event time, event name, event type, type, user, AWS region, source IP address, event status, account ID, request ID, error code, error message, and event count, displayed in a table.
Notification Overview
See the overview of SES notifications including the source IP locations, notification types, mail source, and notification type.
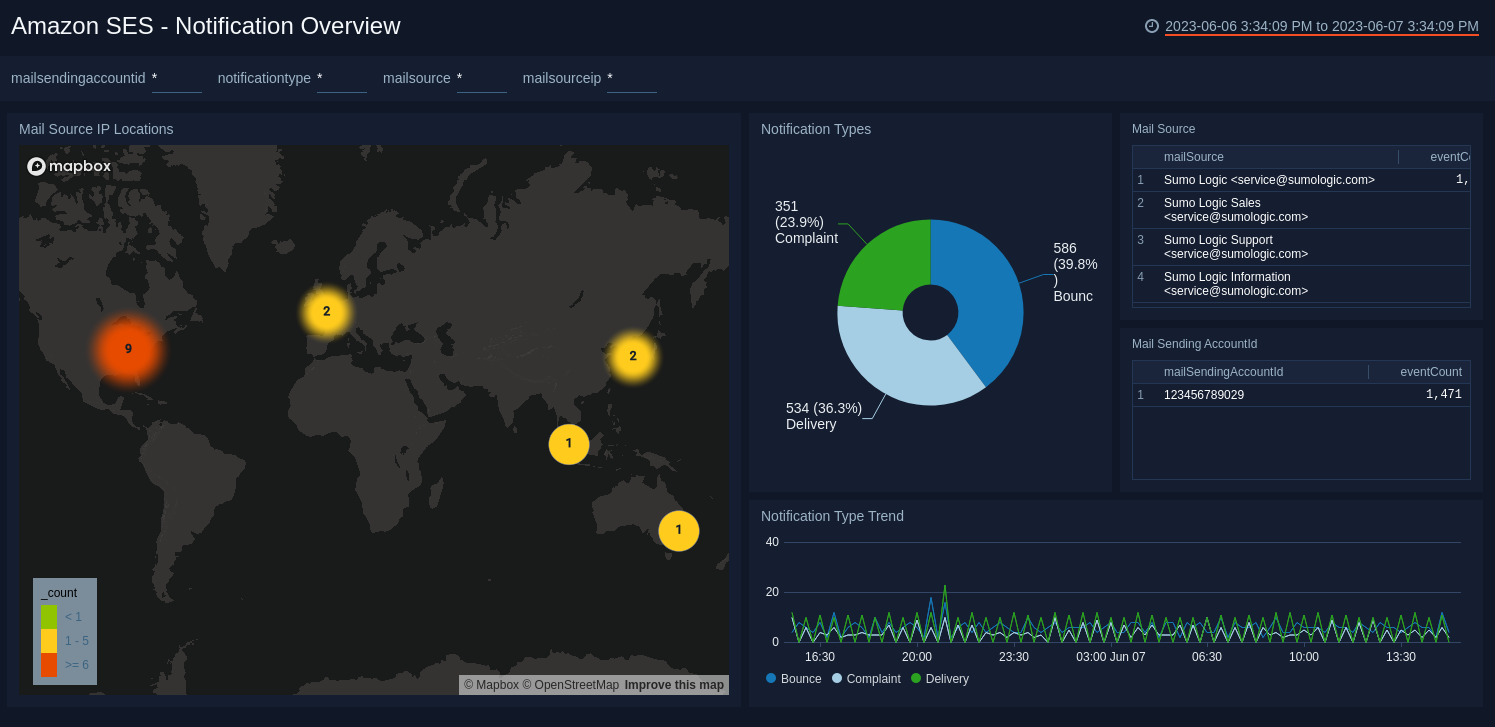
Mail Source IP Locations. See the count and location of the mail source IP addresses in the last 24 hours on a world map.
Notification Types. See the count and percentage of notification types in the last 24 hours on a pie chart.
Mail Source. See the name and count of mail sources in the last 24 hours.
Mail Sending AccountId. See he name and count of mail sending account ID in the last 24 hours.
Notification Type Trend. See the trend in the notification types in the last 24 hours on a line chart.
Delivered Notifications
See the details of delivered notifications including the email destinations, domains, reporting MTA, and delivery processing time.
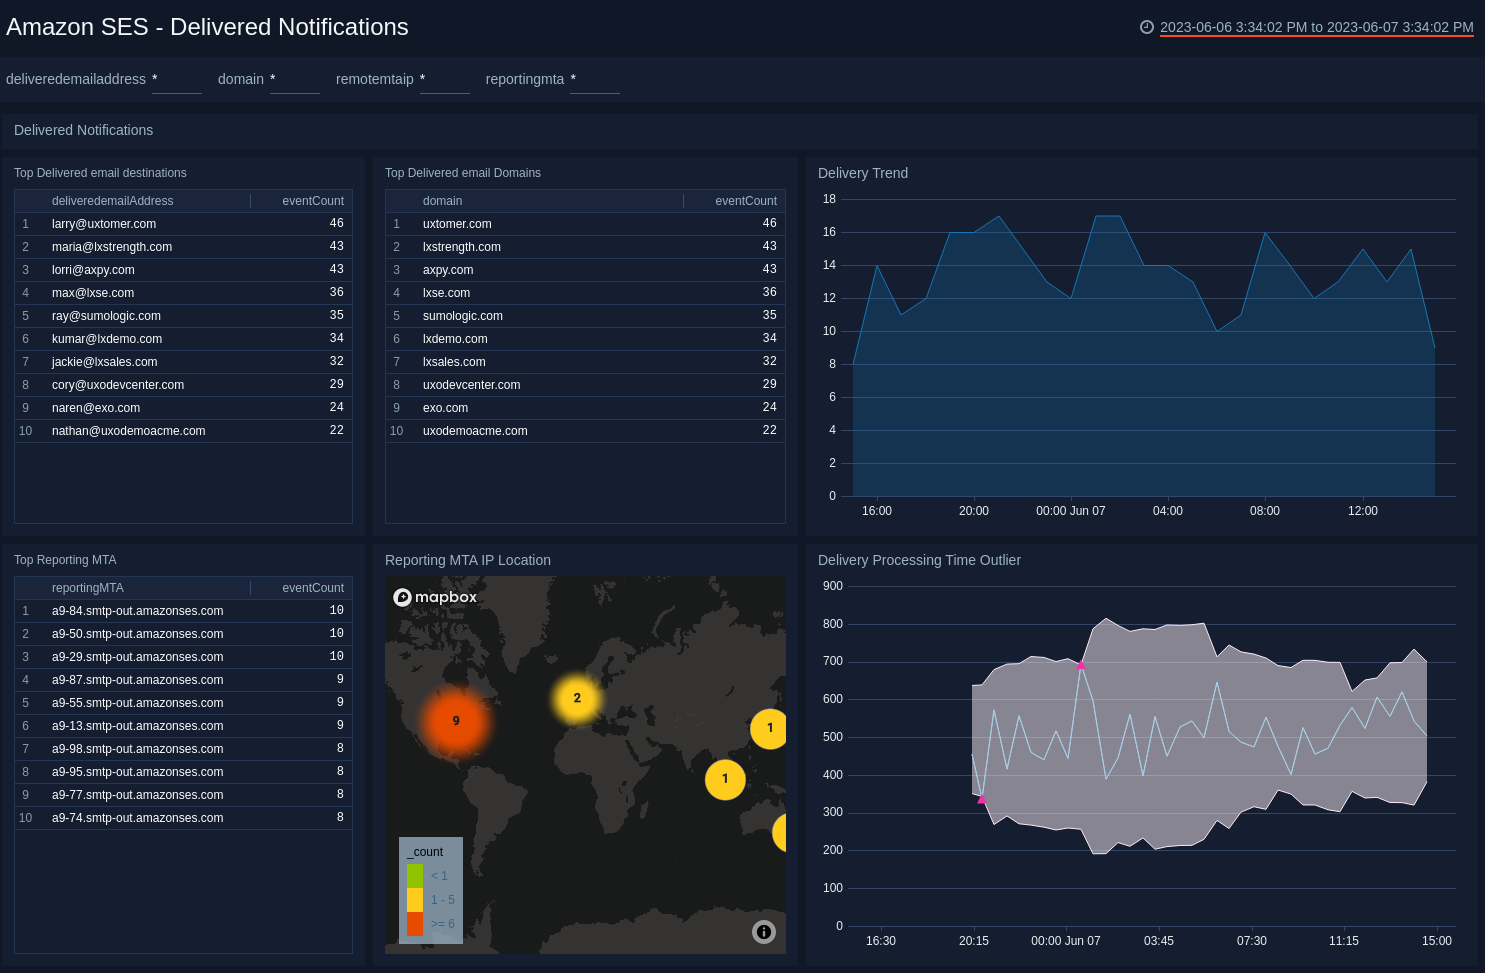
Top Delivered email destinations. See the top 10 delivered email destinations by event count in the last 24 hours.
Top Delivered email Domains. See the top 10 delivered email domains by event count in the last 24 hours.
Delivery Trend. See the trend in the delivered email addresses by count in the last 24 hours on an area chart.
Top Reporting MTA. See the top 10 reporting mail transfer agent (MTA) by count in the last 24 hours.
Reporting MTA IP Location. See the count and location of the reporting MTA IP address in the last 24 hours on a world map.
Delivery Processing Time Outlier. See the outlier in the delivery processing time in the last 24 hours on a line chart.
Bounced Notifications
See the details of bounced notifications by email addresses, domains, bounce types, and bounce subtypes.
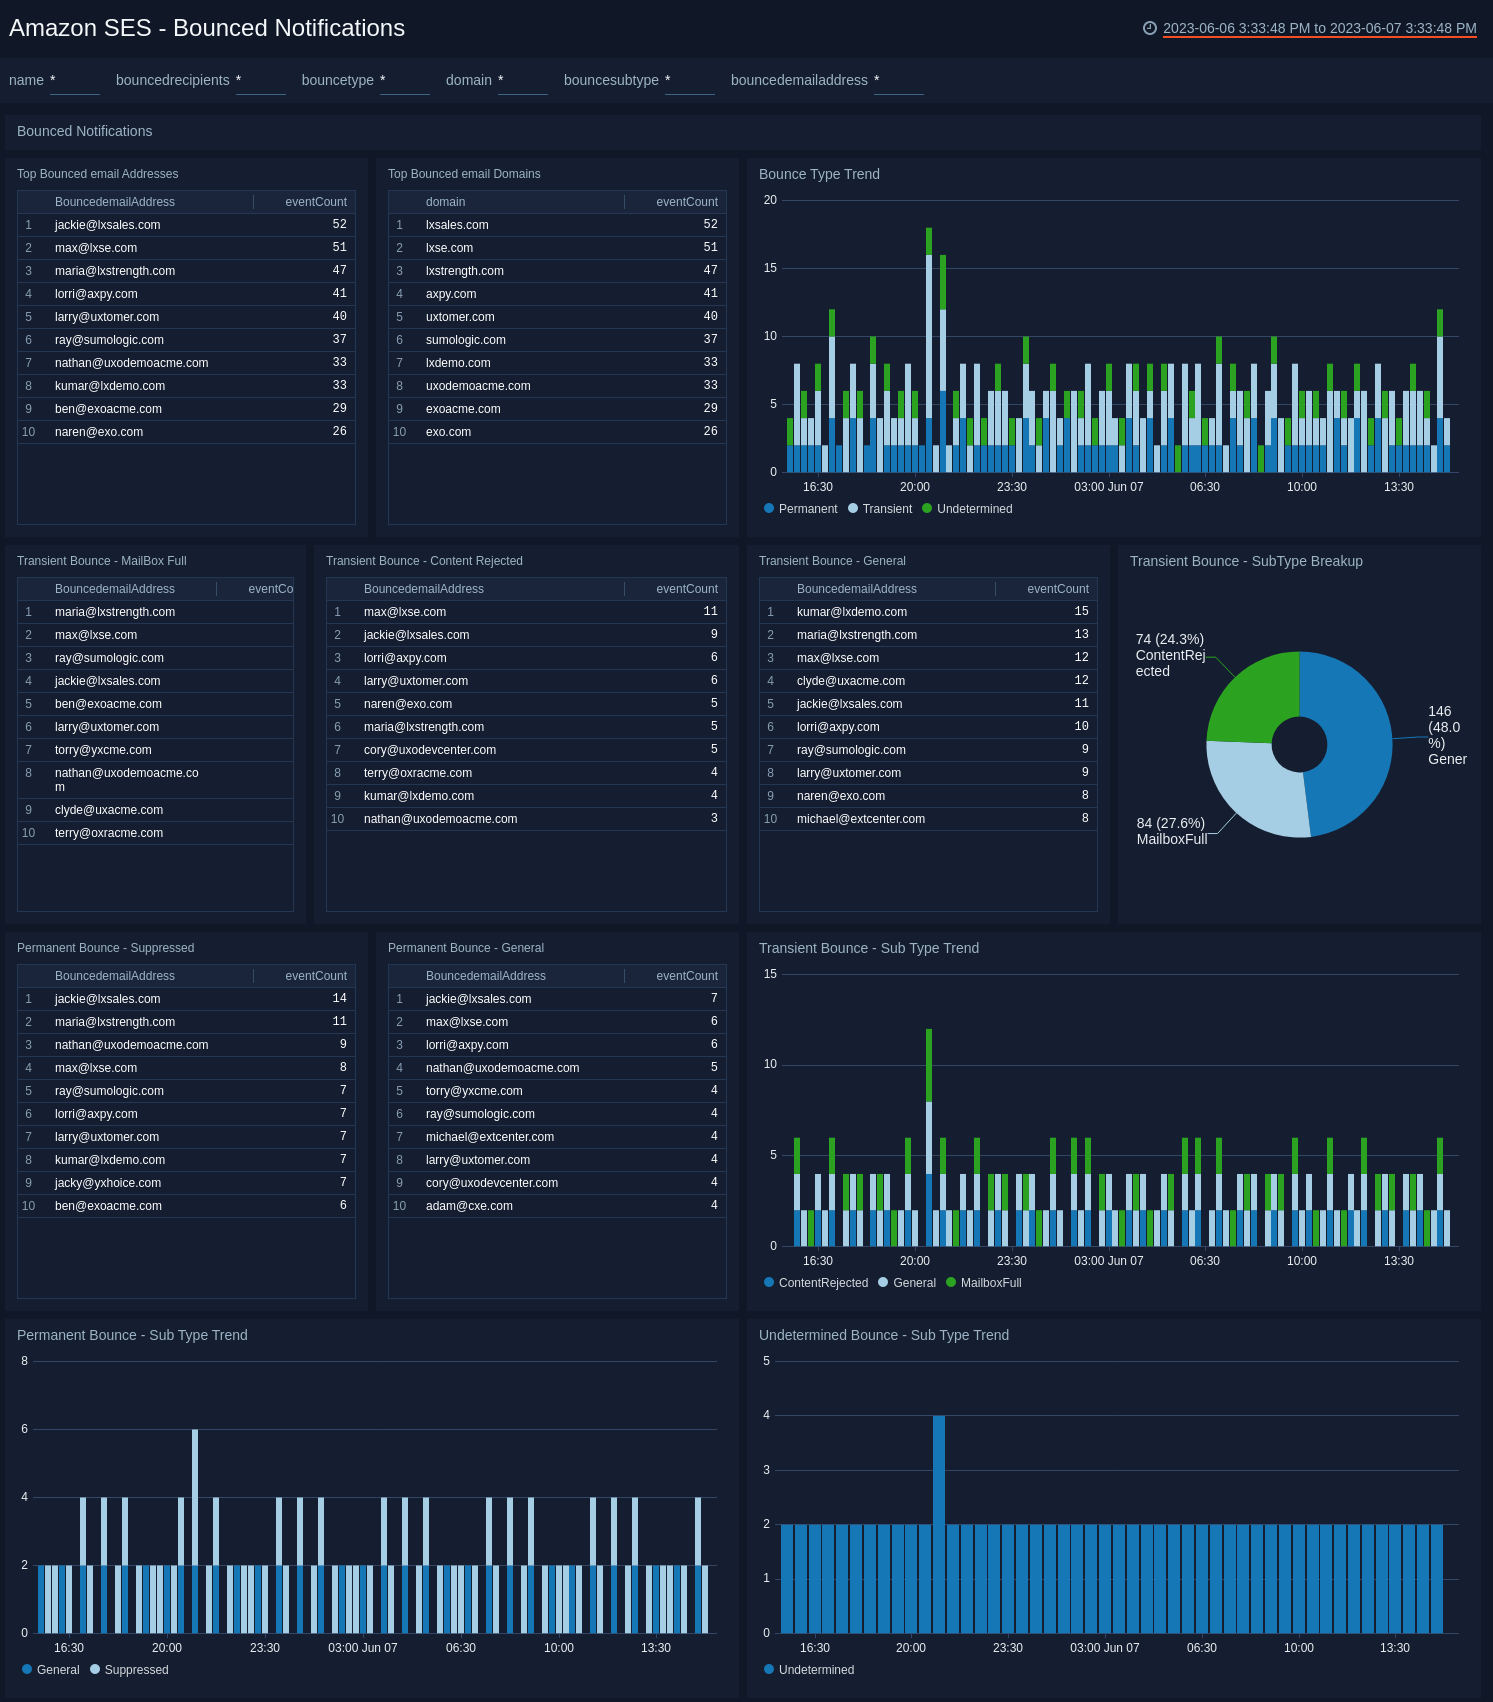
Top Bounced email Addresses. See the top 10 bounced email addresses by count in the last 24 hours.
Top Bounced email Domains. See the top 10 bounced email domains by count in the last 24 hours.
Bounce Type Trend. See the trend in the bounce types in the last 24 hours on a stacked column chart.
Transient Bounce. MailBox Full. See the top 10 bounced email addresses of transient bounce type, and mailbox full bounce subtype, by count in the last 24 hours.
Transient Bounce. Content Rejected. See the top 10 bounced email addresses of transient bounce type, and content rejected bounce subtype, by count in the last 24 hours.
Transient Bounce. General. See the top 10 bounced email addresses of transient bounce type, and general subtype, by count in the last 24 hours.
Transient Bounce. SubType Breakup. See the count of transient bounce type for each subtype in the last 24 hours on a pie chart.
Permanent Bounce. Suppressed. See the top 10 bounced email addresses of permanent bounce type, and suppressed bounce subtype, by count in the last 24 hours.
Permanent Bounce. General. See the top 10 bounced email addresses of permanent bounce type, and general bounce subtype, by count in the last 24 hours.
Transient Bounce. Sub Type Trend. See the trend in the transient bounce type by subtype on a stacked column chart in the last 24 hours.
Permanent Bounce. Sub Type Trend. See the trend in the permanent bounce type by subtype on a stacked column chart in the last 24 hours.
Undetermined Bounce. Sub Type Trend. See the trend in the undetermined bounce type by subtype on a stacked column chart in the last 24 hours.
Complaint Notifications
See information about complaints (a complaint occurs when a recipient reports that he doesn't want to receive an email), including the top email addresses, email domains, and user agents associated with complaints and the sender's AccountId, AWS region, SourceIP, and identity associated with complaints.
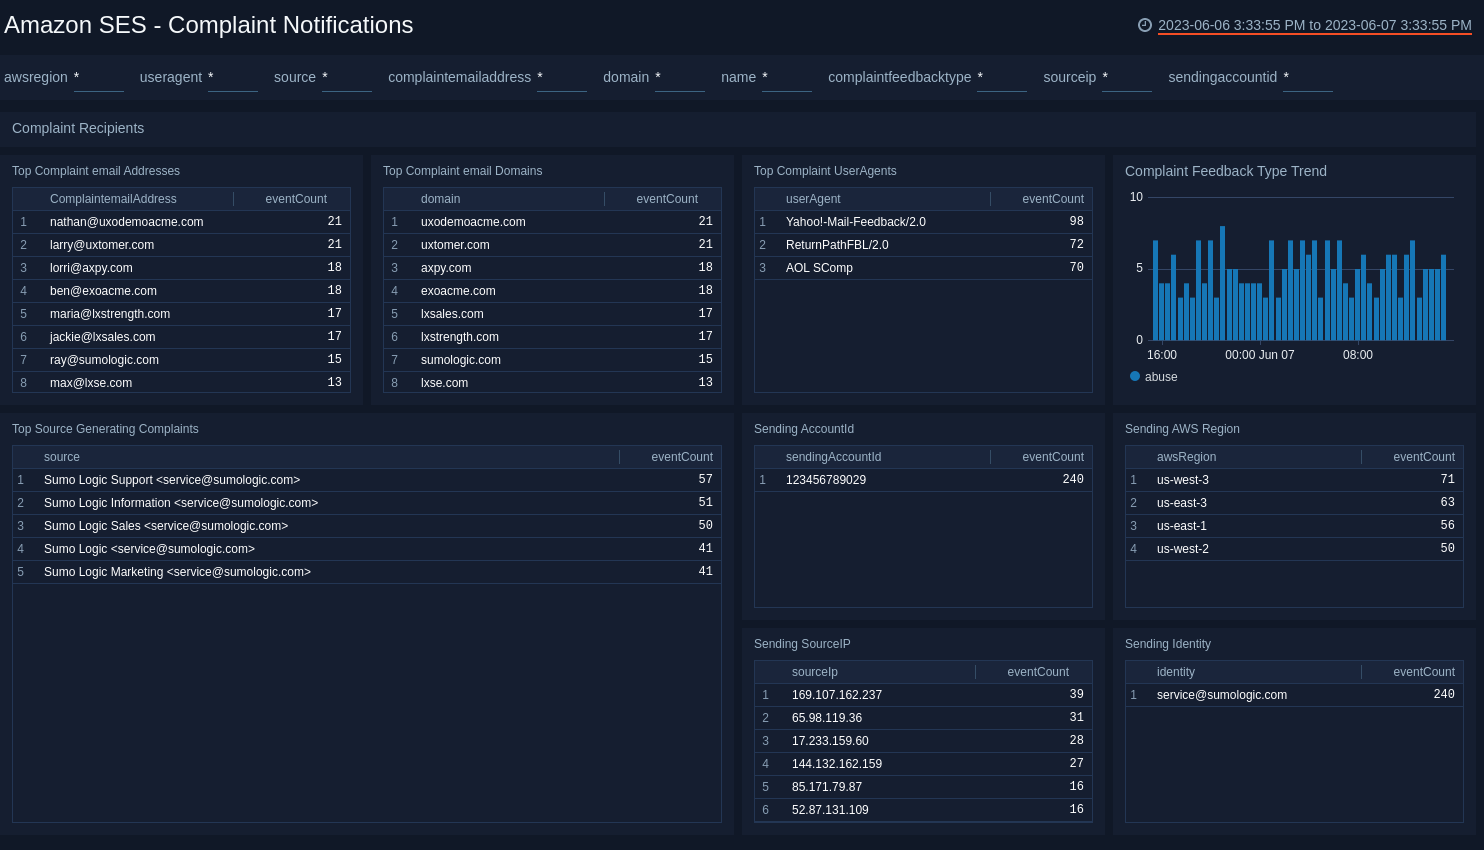
Top Complaint email Addresses. See the top 10 email addresses sending emails generating complaint notifications by count in the last 24 hours.
Top Complaint email Domains. See the top 10 email domains sending emails generating complaint notifications by count in the last 24 hours.
Top Complaint UserAgents. See the top 10 user agents sending emails generating complaint notifications by count in the last 24 hours.
Complaint Feedback Type Trend. See the trend in the complaint feedback types in the last 24 hours on a stacked column chart.
Top Source Generating Complaints. See the top 10 sources generating complaint notifications in the last 24 hours.
Sending AccountId. See the AWS Account Id of the accounts sending emails generating complaint notifications in the last 24 hours.
Sending AWS Region. See the AWS region of the accounts sending emails generating complaint notifications in the last 24 hours.
Sending SourceIP. See the IP addresses of the users sending emails generating complaint notifications in the last 24 hours.
Sending Identity. See the identity of the users sending emails generating complaint notifications in the last 24 hours.
Upgrade/Downgrade the Amazon SES app (Optional)
To update the app, do the following:
Next-Gen App: To install or update the app, you must be an account administrator or a user with Manage Apps, Manage Monitors, Manage Fields, Manage Metric Rules, and Manage Collectors capabilities depending upon the different content types part of the app.
- Select App Catalog.
- In the Search Apps field, search for and then select your app.
Optionally, you can identify apps that can be upgraded in the Upgrade available section. - To upgrade the app, select Upgrade from the Manage dropdown.
- If the upgrade does not have any configuration or property changes, you will be redirected to the Preview & Done section.
- If the upgrade has any configuration or property changes, you will be redirected to the Setup Data page.
- In the Configure section of your respective app, complete the following fields.
- Field Name. If you already have collectors and sources set up, select the configured metadata field name (eg _sourcecategory) or specify other custom metadata (eg: _collector) along with its metadata Field Value.
- Click Next. You will be redirected to the Preview & Done section.
Post-update
Your upgraded app will be installed in the Installed Apps folder and dashboard panels will start to fill automatically.
See our Release Notes changelog for new updates in the app.
To revert the app to a previous version, do the following:
- Select App Catalog.
- In the Search Apps field, search for and then select your app.
- To version down the app, select Revert to < previous version of your app > from the Manage dropdown.
Uninstalling the Amazon SES app (Optional)
To uninstall the app, do the following:
- Select App Catalog.
- In the 🔎 Search Apps field, run a search for your desired app, then select it.
- Click Uninstall.