PCI Compliance for Amazon VPC Flow Logs
The Sumo Logic App for Payment Card Industry (PCI) Compliance for Amazon VPC Flow Logs App offers dashboards to monitor systems, account and users activity to ensure that login activity and privileged users are within the expected ranges. The PCI Compliance for Amazon VPC Flow Logs App covers PCI requirements 01, 02, and 04.
For more information on Amazon VPC Flow Logs, see here.
Collect Logs for the PCI Compliance for Amazon VPC Flow Logs App
VPC Flow Logs can be published to Amazon CloudWatch Logs and Amazon S3. Each method has advantages. Using an Amazon S3 source is more reliable, while using a CloudFormation template allows you to customize your logs by adding more information and filtering unwanted data.
You can use either of the following methods to collect Amazon VPC Flow Logs:
- Collect Amazon VPC Flow Logs using an Amazon S3 source
- Collect Amazon VPC Flow Logs using a CloudFormation template
Field Extraction Rule(s) for VPC Flow logs
Create Field Extraction Rule for VPC Flow Logs.
Rule Name: VPCFlowLogFER
Applied at: Ingest Time
Scope (Specific Data):
_sourceCategory=<Source category for respective VPC flow log source>
Parse Expression:
json "logStream", "logGroup", "message", "direction" as logStream, logGroup, msg, direction nodrop
| if (_raw matches "{*", msg, _raw) as msg
| parse field=msg "* * * * * * * * * * * * * *" as version,accountID,interfaceID,src_ip,dest_ip,src_port,dest_port,Protocol,Packets,bytes,StartSample,EndSample,Action,status nodrop
Installing the PCI Compliance for Amazon VPC Flow Logs app
Now that you have set up collection, install the Sumo Logic app for PCI Compliance For Amazon VPC Flow to use the preconfigured searches and dashboards that provide insight into your data.
To install the app, do the following:
Next-Gen App: To install or update the app, you must be an account administrator or a user with Manage Apps, Manage Monitors, Manage Fields, Manage Metric Rules, and Manage Collectors capabilities depending upon the different content types part of the app.
- Select App Catalog.
- In the 🔎 Search Apps field, run a search for your desired app, then select it.
- Click Install App.
note
Sometimes this button says Add Integration.
- Click Next in the Setup Data section.
- In the Configure section of your respective app, complete the following fields.
- Field Name. If you already have collectors and sources set up, select the configured metadata field name (eg _sourcecategory) or specify other custom metadata (eg: _collector) along with its metadata Field Value.
- Click Next. You will be redirected to the Preview & Done section.
Post-installation
Once your app is installed, it will appear in your Installed Apps folder, and dashboard panels will start to fill automatically.
Each panel slowly fills with data matching the time range query received since the panel was created. Results will not immediately be available but will be updated with full graphs and charts over time.
Viewing the PCI VPC dashboards
All dashboards have a set of filters that you can apply to the entire dashboard. Use these filters to drill down and examine the data to a granular level.
- You can change the time range for a dashboard or panel by selecting a predefined interval from a drop-down list, choosing a recently used time range, or specifying custom dates and times. Learn more.
- You can use template variables to drill down and examine the data on a granular level. For more information, see Filtering Dashboards with Template Variables.
- Most Next-Gen apps allow you to provide the scope at the installation time and are comprised of a key (
_sourceCategoryby default) and a default value for this key. Based on your input, the app dashboards will be parameterized with a dashboard variable, allowing you to change the dataset queried by all panels. This eliminates the need to create multiple copies of the same dashboard with different queries.
The PCI Compliance for Amazon VPC Flow App covers PCI requirements 01, 02, and 04.
PCI Req 01 - Accepted and Rejected Traffic
Monitor accepted and rejected traffic, drill down on accepted network traffic, or drill down on rejected network traffic.
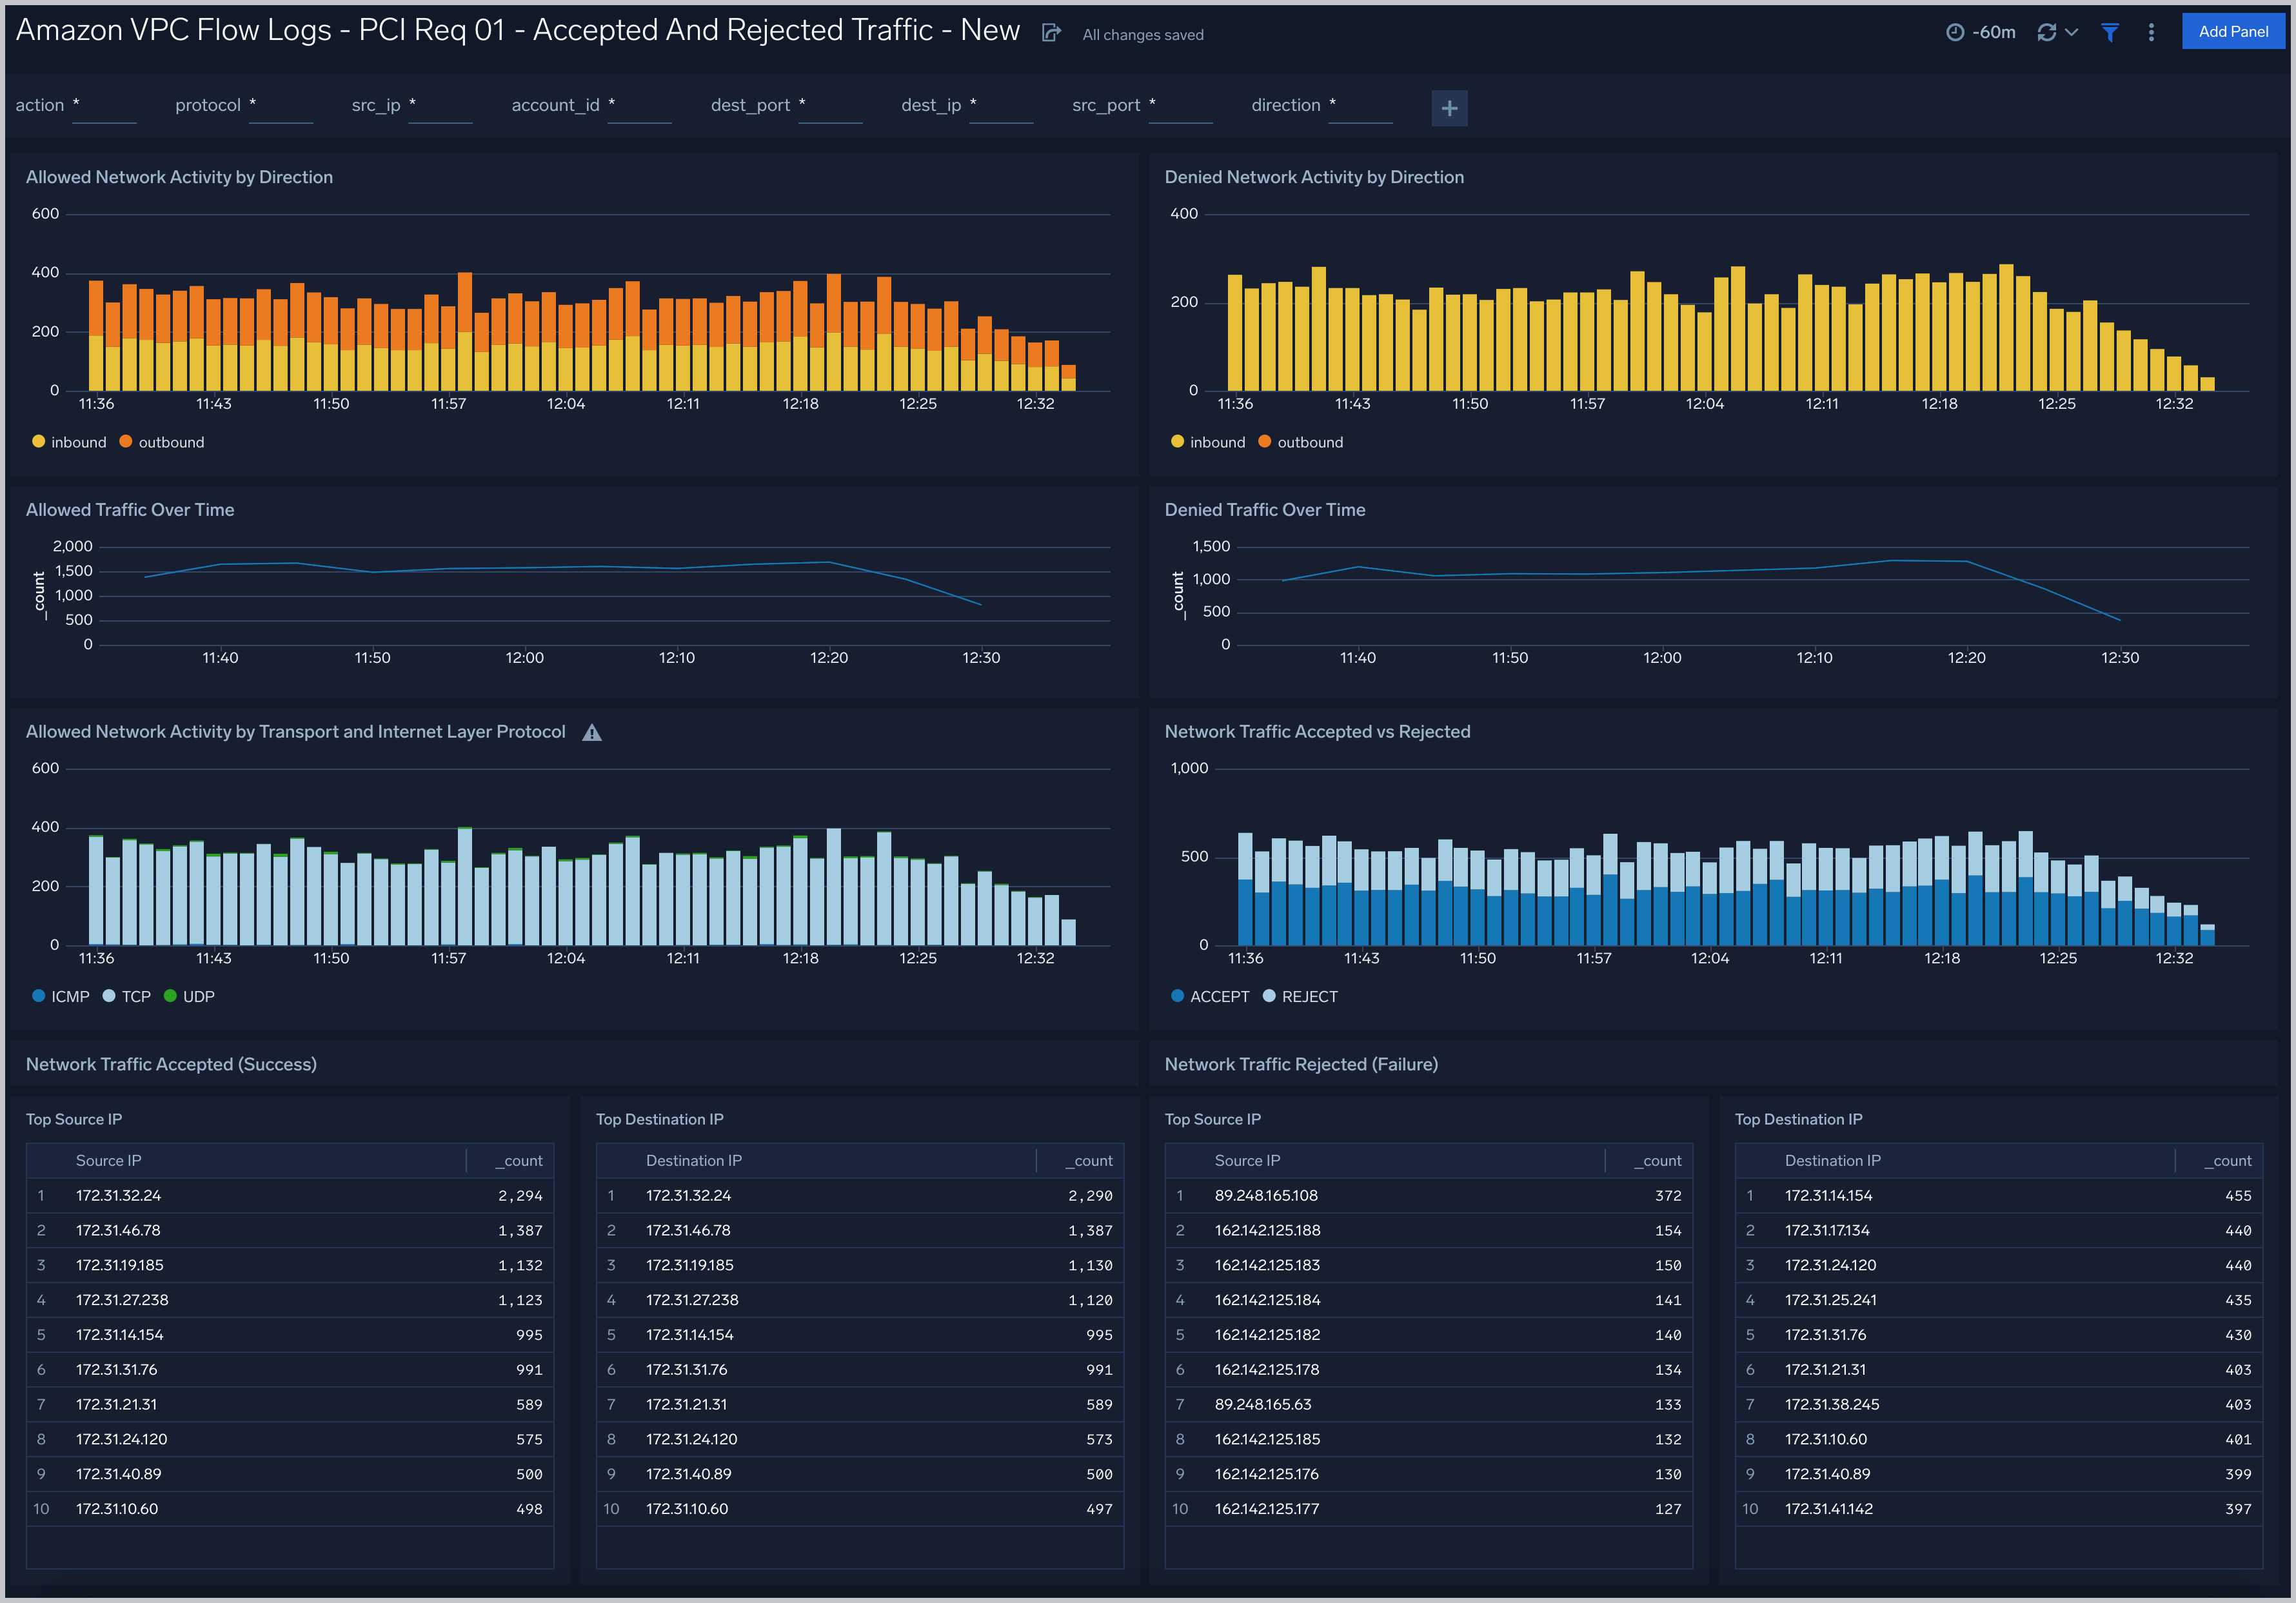
- Allowed Network Activity by Direction. View a comparison between inbound and outbound traffic over the last 60 minutes, timesliced by 1 minute intervals.
- Denied Network Activity by Direction. View a comparison between inbound and outbound traffic over the last 60 minutes, timesliced by 1 minute intervals.
- Allowed Traffic Over Time. View a count of accepted traffic for the last 60 minutes.
- Denied Traffic Over Time. View a count of denied traffic for the last 60 minutes.
- Allowed Network Activity by Transport and Internet Layer Protocol. View a comparison between transport layers (IPV4, IPV6, TCP, SCTP, ICMP, UDP) over the last 60 minutes, timesliced by 1 minute intervals.
- Network Traffic Accepted vs Rejected. View a comparison between accepted and rejected network traffic over the last 60 minutes, timesliced by 1 minute intervals.
- Network Traffic Accepted (Success) Top SrcIP. View a count of the top 10 source IP addresses for accepted network traffic.
- Network Traffic Accepted (Success) Top DestIP. View a count of the top 10 destination IP addresses for accepted network traffic.
- Network Traffic Rejected (Failure) Top SrcIP. View a count of the top 10 source IP addresses for rejected network traffic.
- Network Traffic Accepted (Failure) Top DestIP. View a count of the top 10 destination IP addresses for rejected network traffic.
PCI Req 01 - Traffic Direction Monitoring
Monitor inbound and outbound traffic.
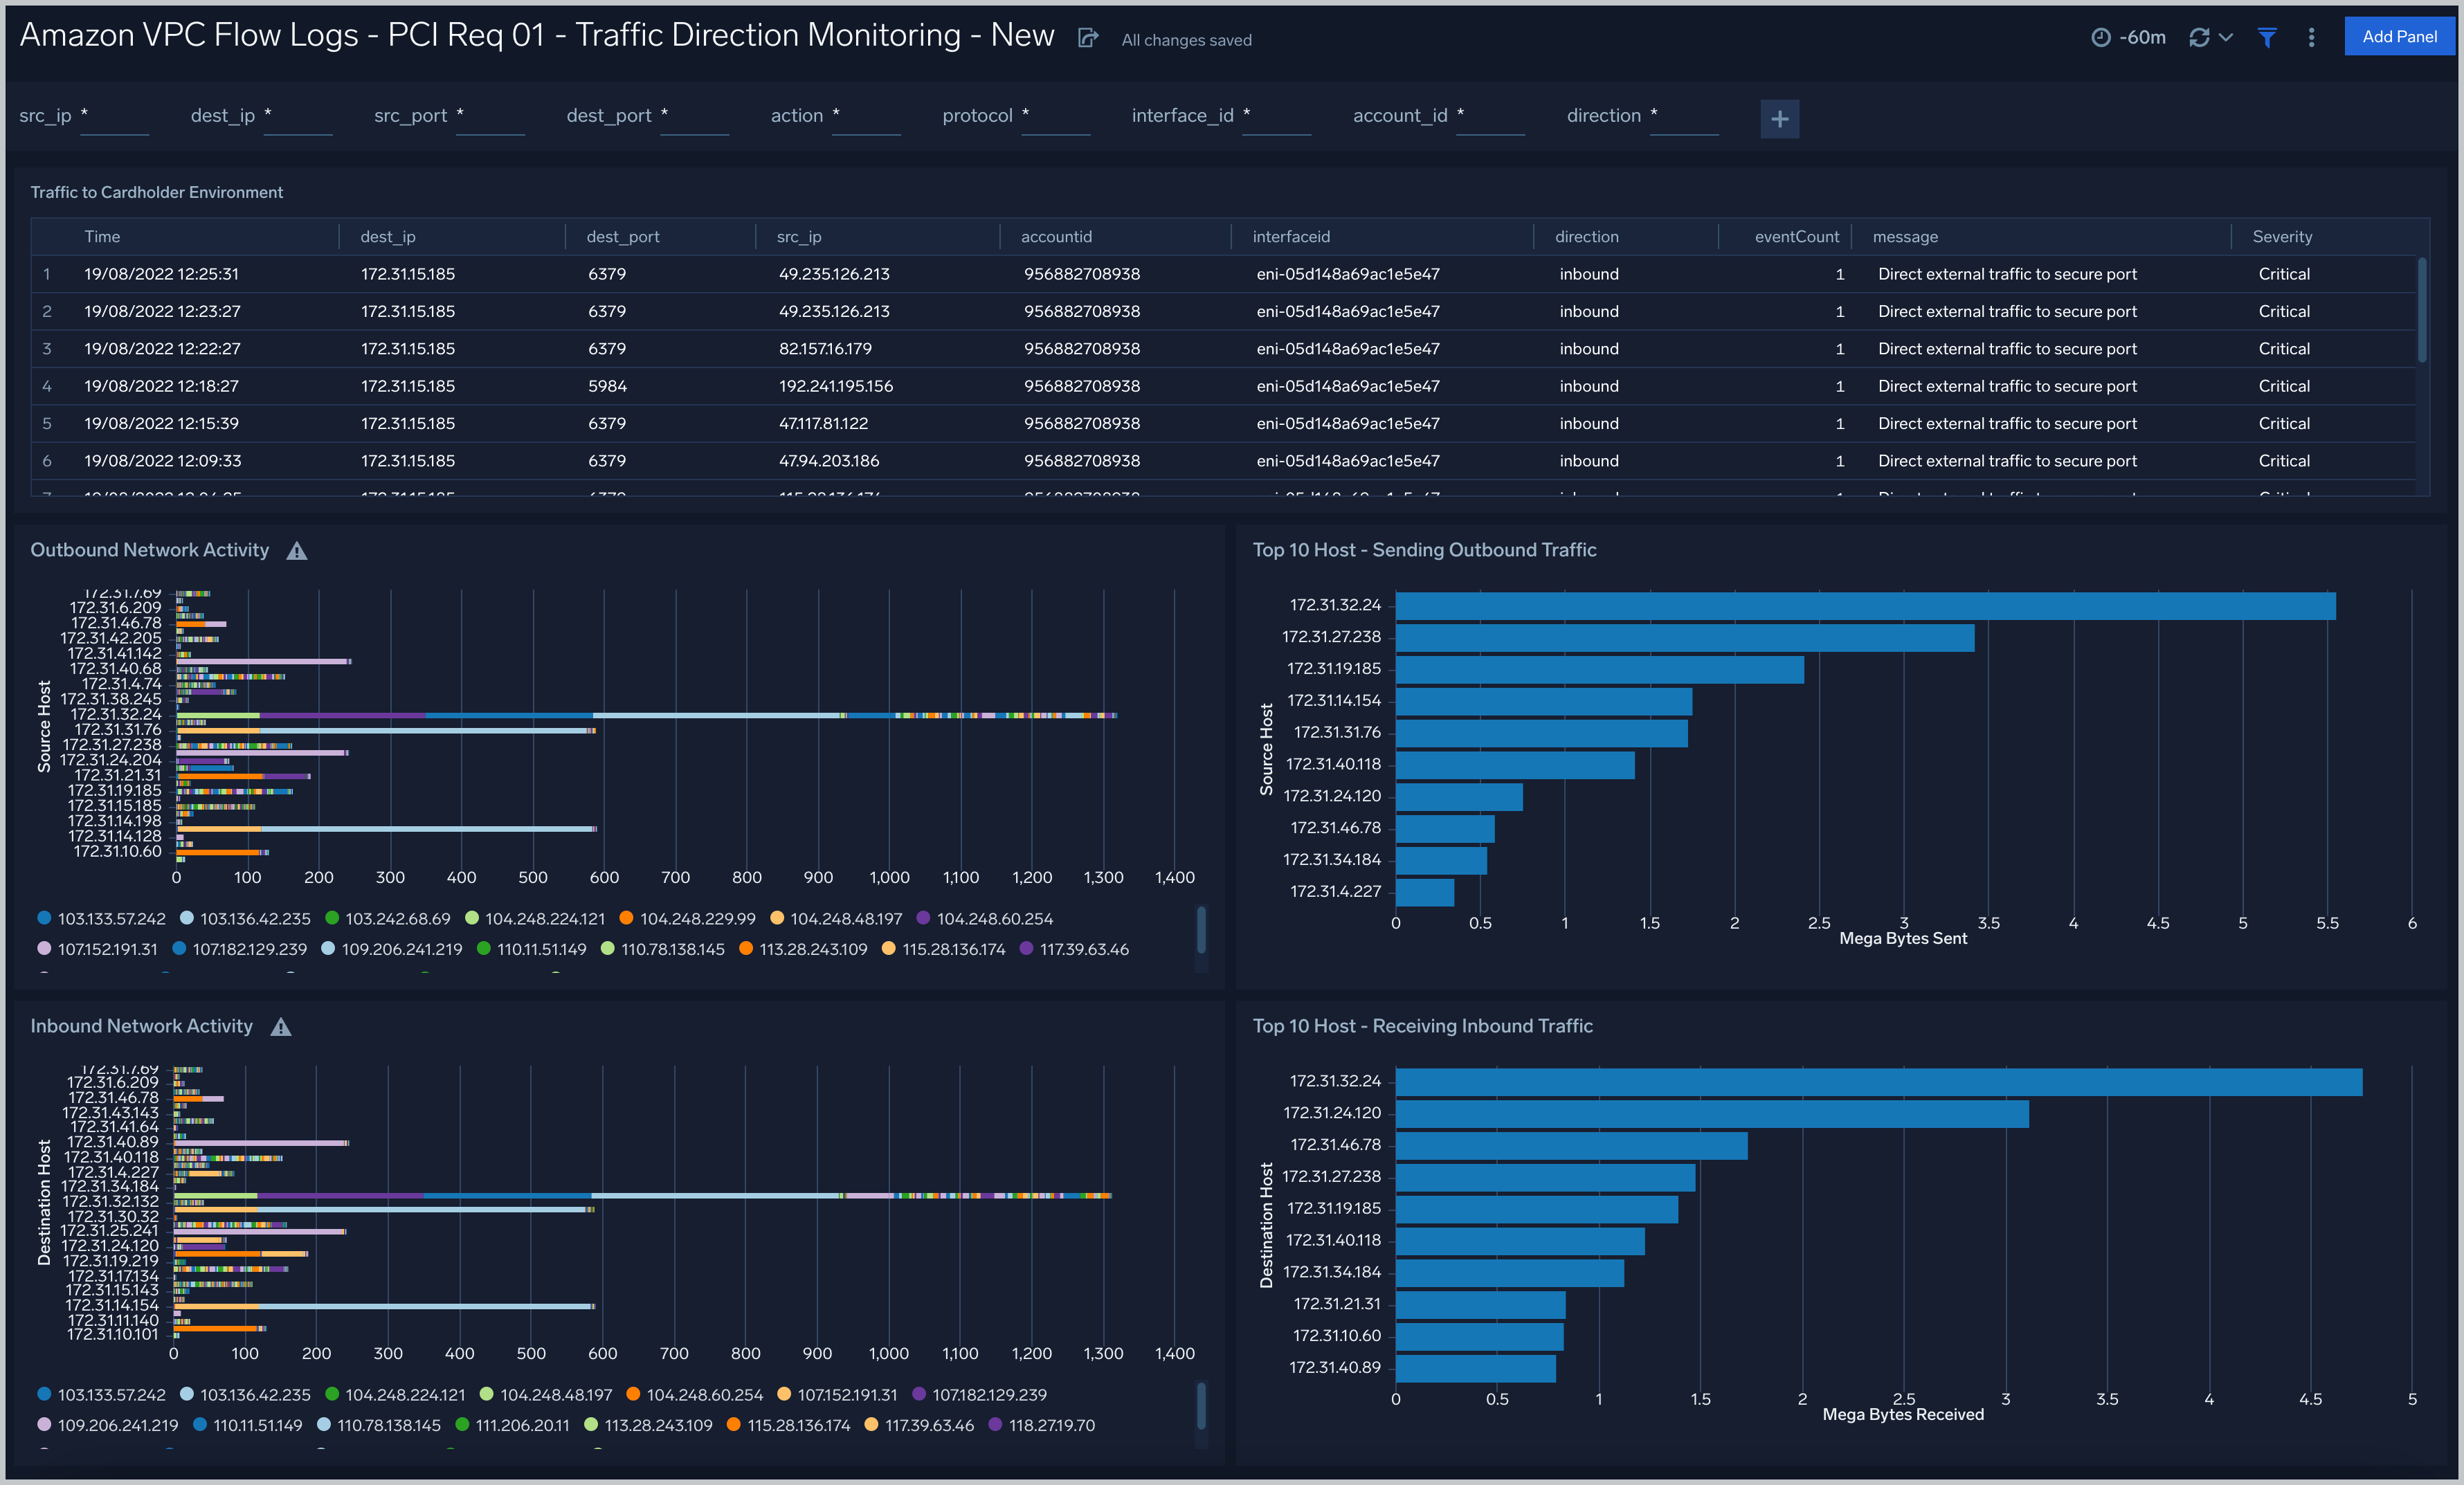
- Traffic to Cardholder Environment. View traffic to cardholder environments by time, destination IP address, destination port, source IP, account ID, interface ID, event count, message, and severity for the last 60 minutes.
- Outbound Network Activity. View the overall outbound network activity by source host IP address for the last 60 minutes.
- Top 10 Host - Sending Outbound Traffic. View sending network activity by the top 10 source host IP addresses for the last 60 minutes.
- Inbound Network Activity. View the overall inbound network activity by source host IP address for the last 60 minutes.
- Top 10 Host - Receiving Inbound Traffic. View the top 10 hosts receiving inbound network traffic by destination host and megabytes received for the last 60 minutes.
PCI Req 01, 02 - Data Access Monitoring
Monitor data access.
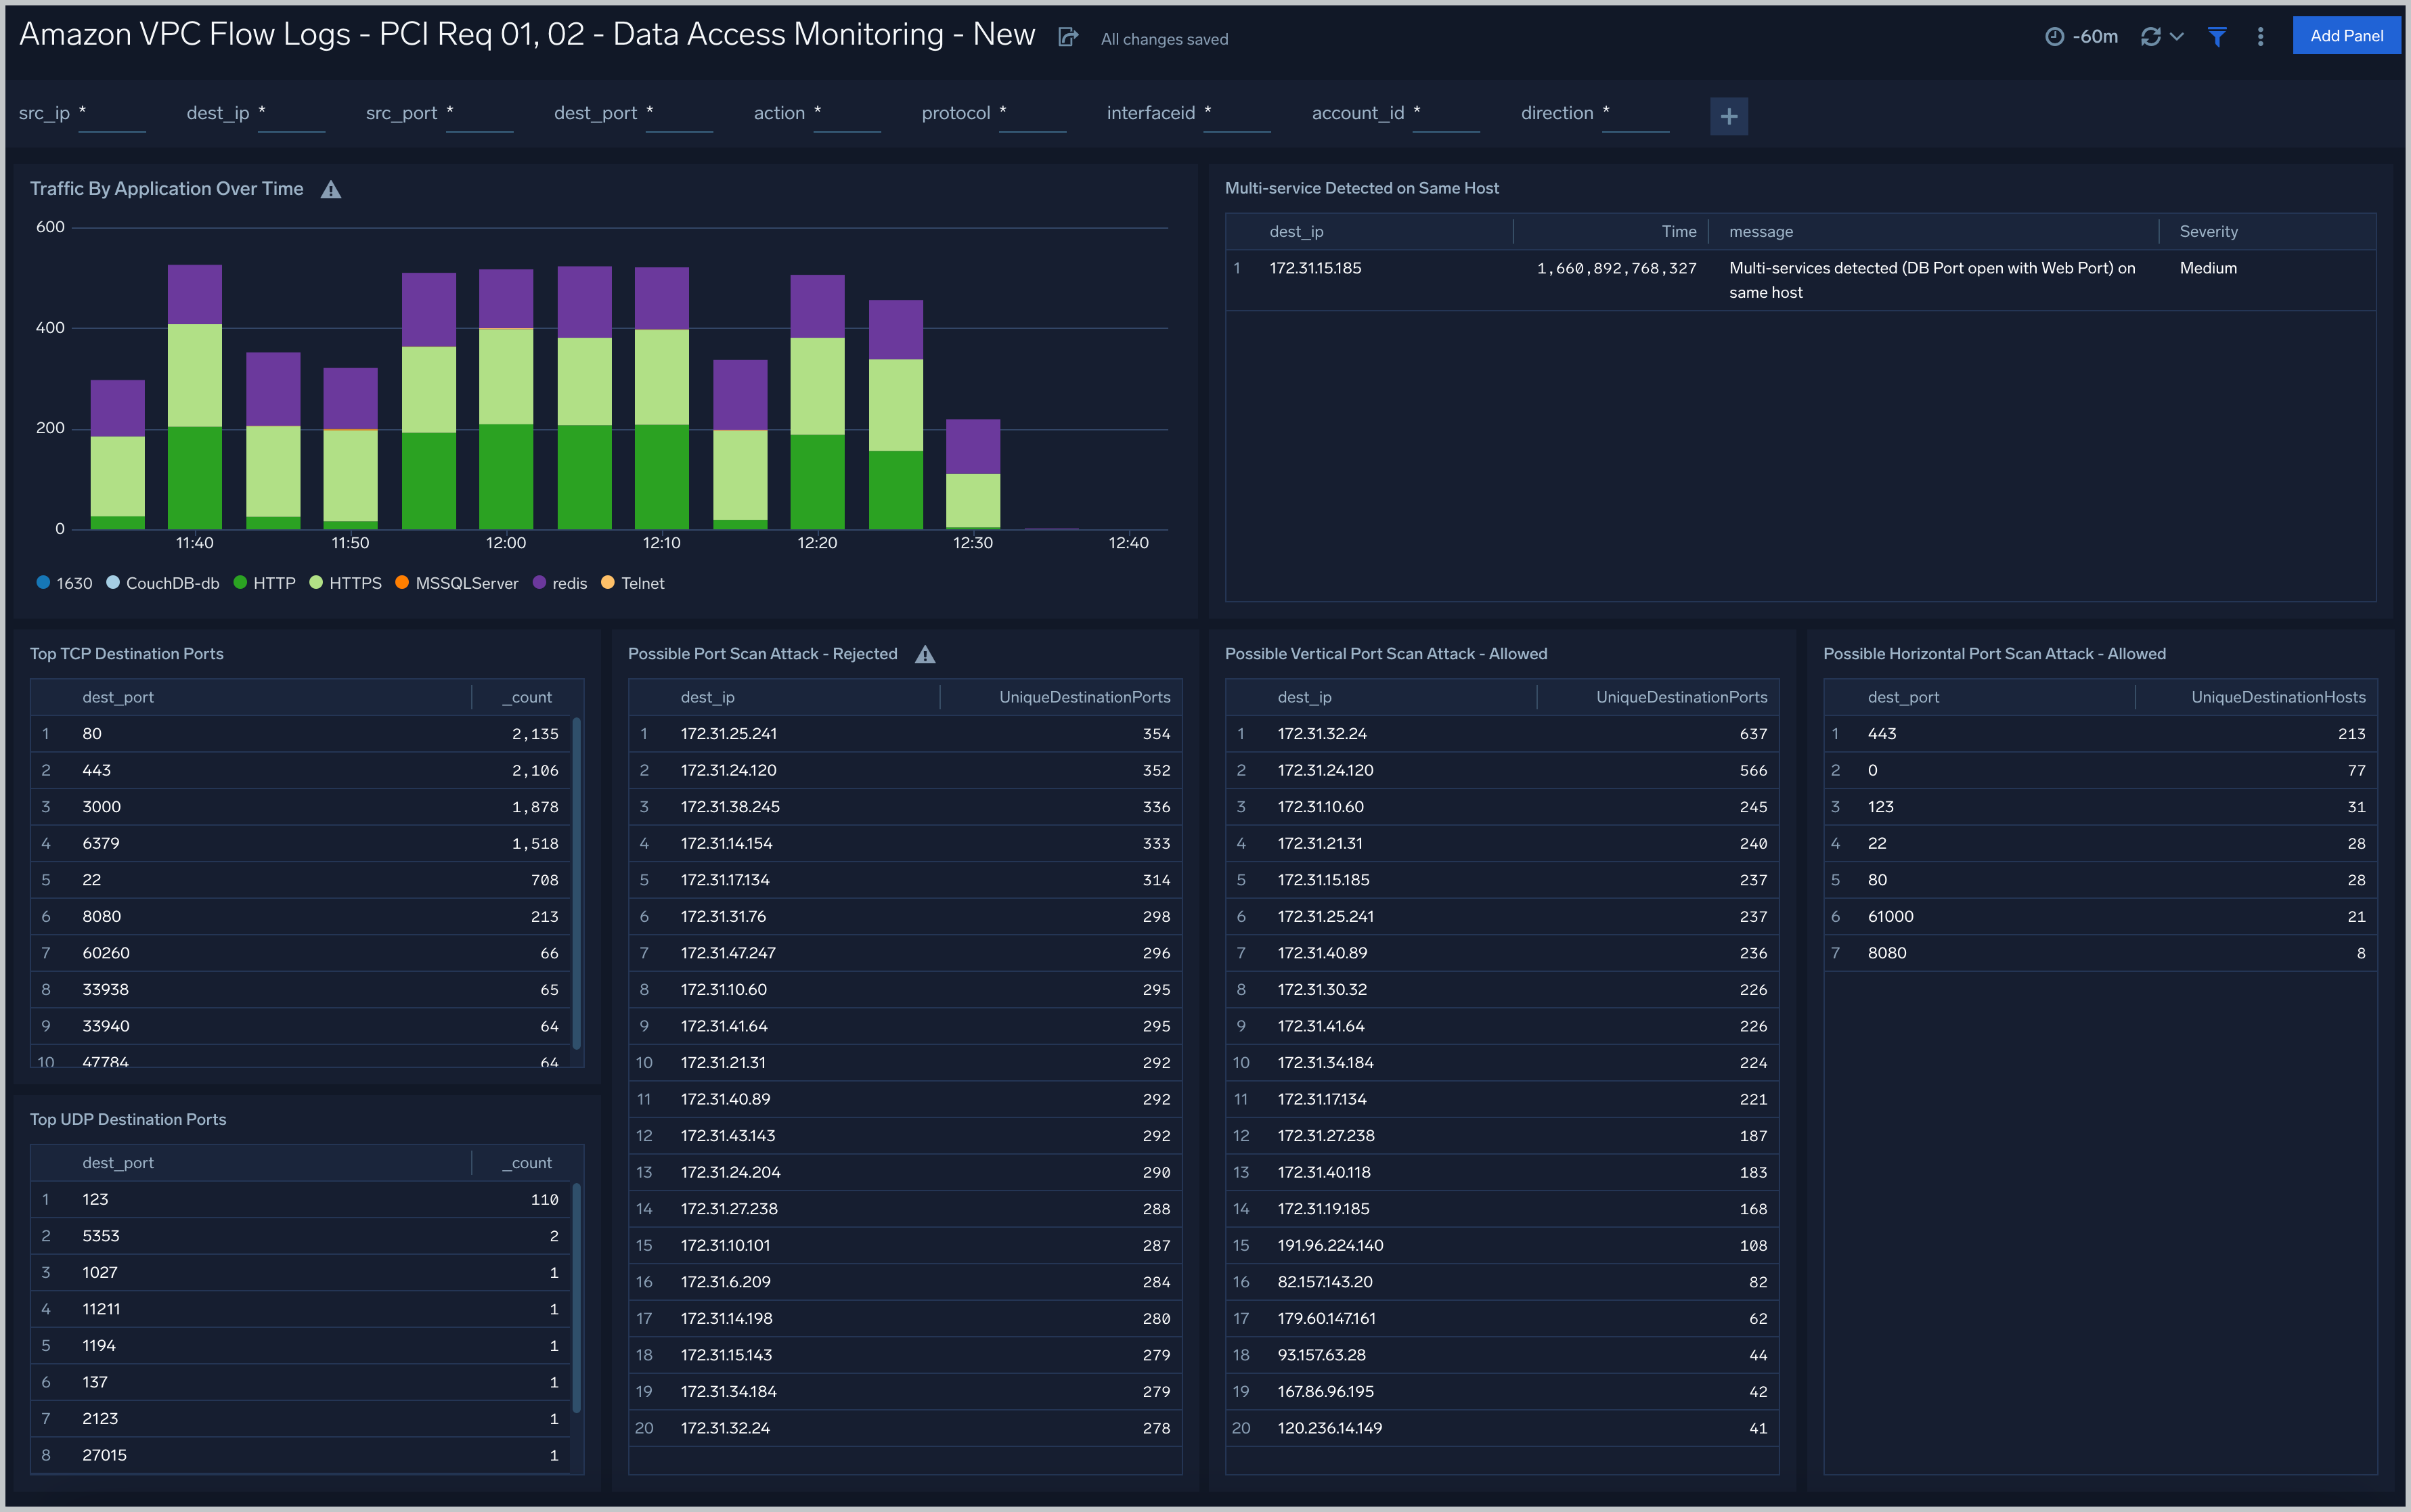
- Traffic By Application Over Time. View a bar chart of accepted network traffic by application for the last 60 minutes, timesliced by every 5 minutes.
- Top TCP Dest Ports. View an aggregation table of the top TCP 10 destination ports and a count of how often they were accessed over the last 60 minutes.
- Multi-service Detected on Same Host. View the an aggregation table of the destination IP address, time, message, and severity when multi-services are detected on the same host during the last 60 minutes.
- Top UDP Dest Ports. View an aggregation table of the top UDP 10 destination ports and a count of how often they were accessed over the last 60 minutes.
PCI Req 02, 04 - Insecure Data In Transit
Monitor cardholder data in transit.
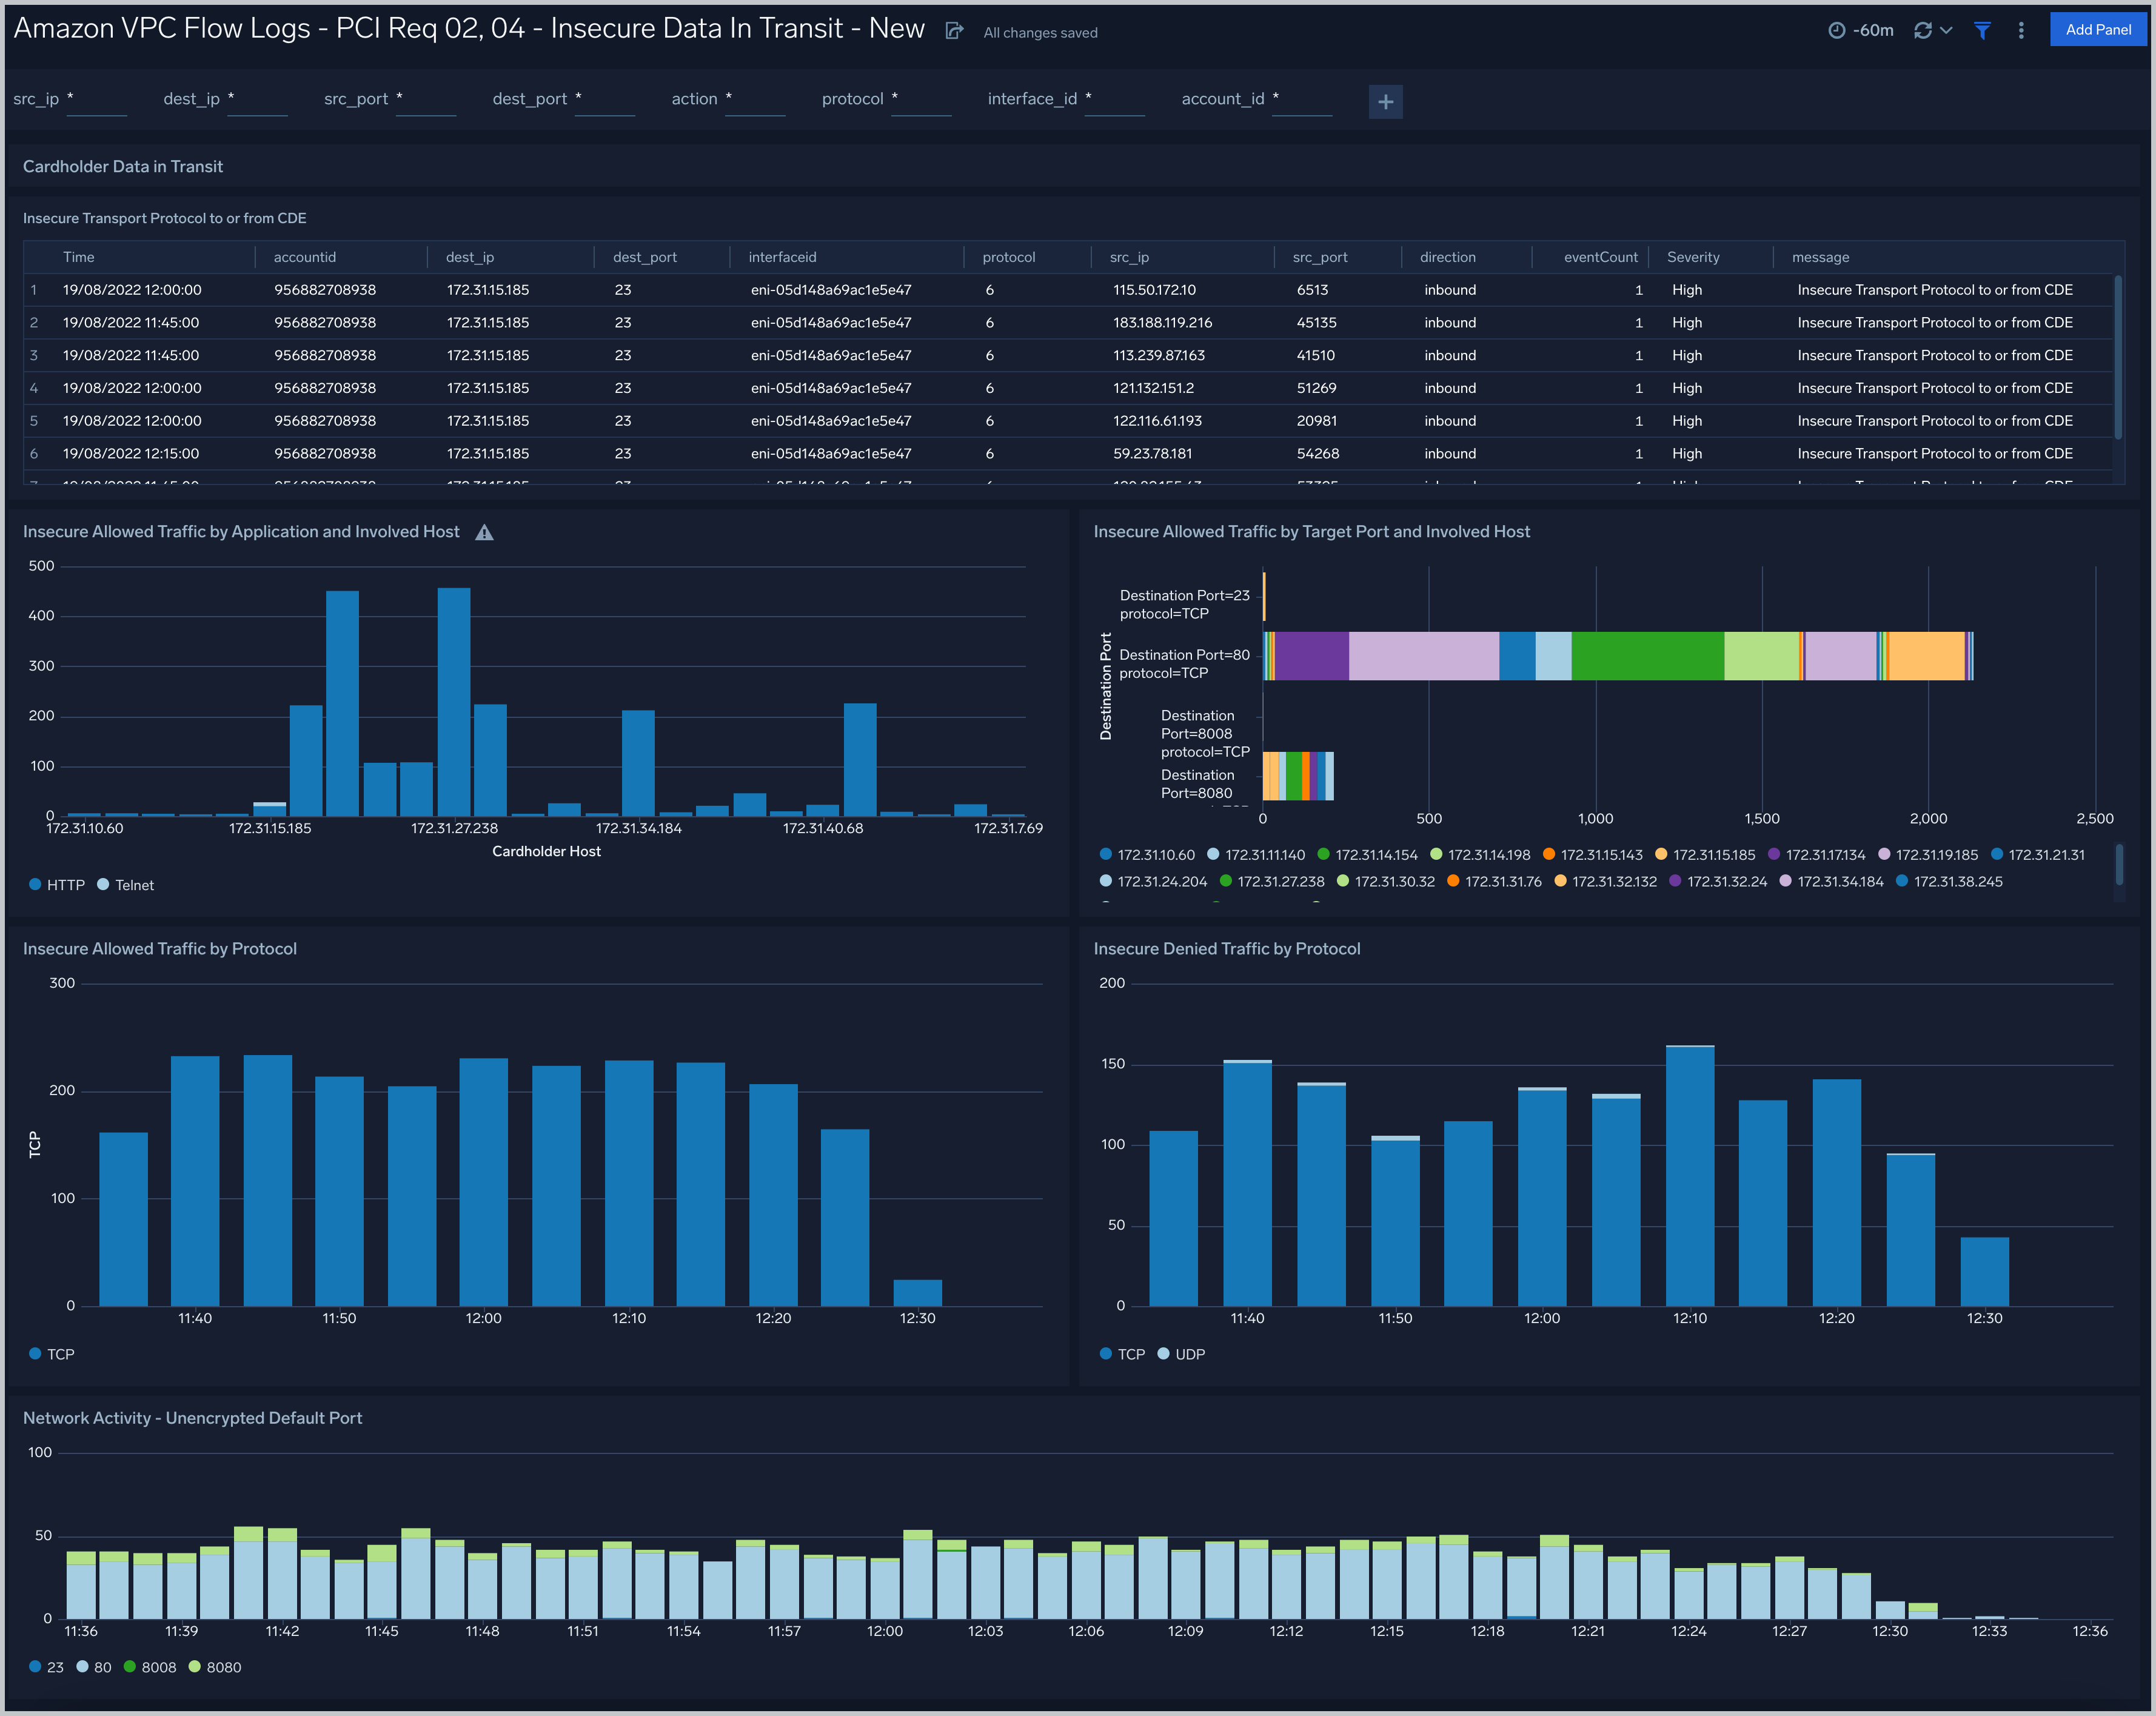
- Insecure Transport Protocol to or from CDE. View an aggregation table of high severity insecure network port activity with the message “Insecure Transport Protocol to or from CDE” during the last 60 minutes. Table includes time, account ID, destination IP, destination port, interface ID, protocol, source IP, source count, event count, severity, and message.
- Insecure Allowed Traffic by Application and Involved Host. See a bar chart of the types of insecure network allowed traffic by each host IP address during the last 60 minutes.
- Insecure Allowed Traffic by Target Port and Involved Host. View the insecure allowed traffic by target port and involved host during the last 60 minutes.
- Insecure Allowed Traffic by Protocol. View the insecure allowed traffic by network protocol as a bar chart timesliced by every 5 minutes for the last 60 minutes.
- Insecure Denied Traffic by Protocol. View the insecure denied traffic by network protocol as a bar chart timesliced by every 5 minutes for the last 60 minutes.
- Network Activity - Unencrypted Default Port. View network activity by unencrypted default port as a bar chart timesliced by every 5 minutes for the last 60 minutes.