Amazon VPC Flow Logs
Amazon Virtual Private Cloud (VPC) Flow Logs log the IP network traffic of your VPC, allowing you to troubleshoot traffic and security issues. The Amazon VPC Flow Logs App leverages this data to provide real-time visibility and analysis of your environment. It consists of predefined searches and Dashboards.
For more information on Amazon VPC Flow Logs, see here.
Collecting Amazon VPC Flow Logs
This section has instructions for collecting VPC Flow Logs using a CloudFormation template.
VPC Flow Logs can be published to Amazon CloudWatch Logs and Amazon S3. You can use either of these methods to collect Amazon VPC Flow Logs:
- Collect Amazon VPC Flow Logs using an Amazon S3 source
- Collect Amazon VPC Flow Logs using a CloudFormation template
Each method has advantages. Using an Amazon S3 source is more reliable, while using a CloudWatch Logs source with the CloudFormation template allows you to optimize your logs. With the CloudWatch Logs source and CloudFormation template, you can customize logs by adding more information and filtering out unwanted data. The Security Groups dashboard utilizes customized logs that are generated from the Lambda function and created with the CloudFormation template from logs sent to CloudWatch Logs.
Collecting Amazon VPC Flow Logs from CloudWatch using CloudFormation
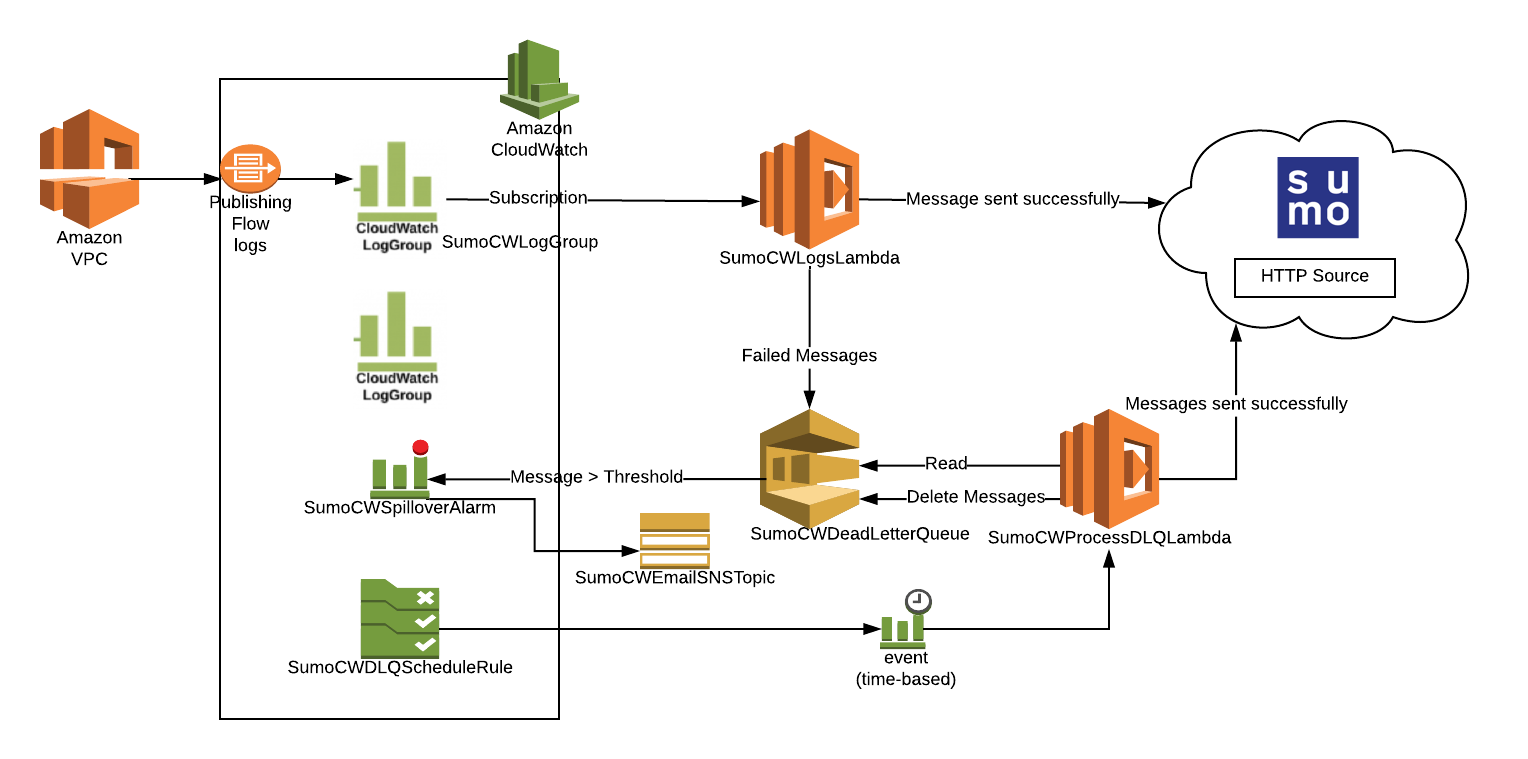
This section has instructions for collecting VPC Flow Logs using a CloudFormation template. The diagram below illustrates the collection process for Amazon VPC Flow Logs. VPC is enabled to send logs to Amazon CloudWatch. A Lambda function subscribes to a CloudWatch Log Group to obtain the flow logs, and then sends the data on to a Sumo Logic HTTP Source on a hosted collector. The AWS resources are created by a Sumo-provided CloudFormation template.
Step 1: Enable Amazon VPC Flow Logs
You can enable Amazon Virtual Private Cloud (VPC) Flow Logs from the Amazon Web Services (AWS) Management Console, the AWS Command Line Interface (CLI), or by making calls to the Elastic Compute Cloud (EC2) API.
To enable Amazon Virtual Private Cloud (VPC) Flow Logs from the AWS console:
- Go to VPC management, and go to the VPC list.
- Select the VPC.
- Click Actions > Create Flow Log.
- On the Create Flow Log page, select a Role to use Flow logs.
- If you haven't set up IAM permissions, click Set Up Permissions.
- From the new tab, VPC Flow Logs is requesting permissions to use resources in your account:
- From the IAM Role, select Create a new IAM Role.
- Add a Role Name that describes your logs, for example, VPC-Flow-Logs.
- Click Allow.
- Back in Create Flow Log, enter the new role you created in Role.
- In Destination Log Group enter a descriptive name such as VPCFlowLogs.
- Click Create Flow Log. It can take up to an hour for the log group to show up in CloudWatch Logs.
Step 2: Configure hosted collector and HTTP source
- Configure a Hosted Collector in Sumo Logic.
- Configure an HTTP Source in Sumo Logic. When configuring the source:
- Under Advanced Options for Logs, for Timestamp Format, click Specify a format.
- Format. Enter:
epoch - Timestamp locator. Enter:
\s(\d{10,13})\s\d{10,13}
- Click Save.
Step 3: Create AWS functions and resources
Follow the steps on Amazon CloudWatch Logs, starting with the Download the CloudFormation template step and ending with the Dealing with alarms step. As you perform the procedure note the additional instructions below, regarding log format and optional environment variables.
Configure LogFormat correctly (Required)
When you Create a stack on the AWS CloudFormation console, in step 5, make sure you select either VPC-JSON or VPC-RAW in the LogFormat field in the Specify Details window.
Environment variables for VPC flow log collection (Optional)
When you Configure environment variables for Lambda functions, in addition to the variables listed, you can optionally also define the following environment variables.
If you define the environment variables below, do it for both of the Lambda functions created by the CloudFormation template.
| Environment variable | Description |
INCLUDE_SECURITY_GROUP_INFO | This option is supported only if you set LogFormat to VPC-JSON
Set to vpc-id subnet-id aws-region security-group-ids direction If you set the value to |
VPC_CIDR_PREFIX | Comma-separated list of IP prefixes for filtering out internal traffic. For example vpcCIDRprefix= 10.8.0.0,10.9.0.0 filters out logs whose destinationIP and sourceIP matches any of the two prefixes 10.8.0.0 and 10.9.0.0.
|
Grant Lambda permissions (Optional)
This step is supported only if INCLUDE_SECURITY_GROUP_INFO is set to true.
The Lambda function fetches list of Elastic Network Interfaces using the describeNetworkInterfaces API. You need to grant permission to Lambda by adding the following inline policy in the SumoCWLambdaExecutionRole role. See the instructions on Creating Policies on the JSON Tab in AWS help.
Paste the JSON below, after adding the ARN of the Lambda functions.
{
    "Version": "2012-10-17",
    "Statement": [
        {
            "Sid": "DescribeENILambdaPerms",
            "Effect": "Allow",
            "Action": "ec2:DescribeNetworkInterfaces",
            "Resource": "*"
        }
    ]
}
Step 4: Subscribe the Lambda function to the VPC Flow Log group
- Select the VPC Flow Log group in the CloudWatch Logs management panel. This is the Log Group created in the first part (VPCFlowLogs was used).
- Click Actions and select Stream to Lambda Function.
- Select the Lambda function created by the CloudFormation template. Its name starts with "SumoCWLogsLambda".
- Click Next.
- Select JSON for Log Format.
- Click Next.
- Click Start Streaming. Wait a few minutes, and check to make sure your logs are flowing into Sumo.
Collecting Amazon VPC Flow Logs using an Amazon S3 Source
This section has instructions for collecting Amazon VPC Flow Logs using an Amazon S3 source. If you prefer to collect VPC logs using a CloudFormation template, see Collect Amazon VPC Flow Logs using a CloudFormation Template.
Step 1: Enable Amazon VPC Flow Logs
- You can use an existing S3 bucket, or create a new one, as described in Create a S3 bucket in AWS help.
- Create flow logs for your VPCs, subnets, or network interfaces. For instructions, see Creating a Flow Log that Publishes to Amazon S3 in AWS help.
- Confirm that logs are being delivered to the S3 bucket. Log files are saved to the bucket using following folder structure:
bucket_ARN/optional_folder/AWSLogs/aws_account_id/vpcflowlogs/region/year/month/day/log_file_name.log.gz.
Step 2: Configure Amazon S3 source
- Grant Access to an Amazon S3 Bucket.
- Enable logging using the AWS Management Console.
- When you create an AWS Source, you associate it with a Hosted Collector. Before creating the Source, identify the Hosted Collector you want to use, or create a new Hosted Collector. For instructions, see Configure a Hosted Collector.
- Add an AWS Source for the S3 Source to Sumo Logic. When you configure the S3 source:
- In the Advanced Options for Logs section, uncheck the Detect messages spanning multiple lines option.
- In the Processing Rules for Logs section, add an Exclude messages that match processing rule to ignore the following file header lines:
version account-id interface-id srcaddr dstaddr srcport dstport protocol packets bytes start end action log-status.
noteIf you have Cloud SIEM installed and you want to forward log data to Cloud SIEM:
- Click the +Add Field link and add a field whose name is
_siemForwardand value is true. This will ensure all logs for this source are forwarded to Cloud SIEM. - Also add another field named
_parserand enter the value/Parsers/System/AWS/AWS VPC Flow.
Field Extraction Rule(s) for VPC Flow logs
Create Field Extraction Rule for VPC Flow Logs.
Rule Name: VPCFlowLogFER
Applied at: Ingest Time
Scope (Specific Data):
_sourceCategory=<Source category for respective VPC flow log source>
Parse Expression:
json "message" as _rawvpc nodrop
| if (_raw matches "{*", _rawvpc,_raw) as message
| parse field=message "* * * * * * * * * * * * * *" as version,accountID,interfaceID,src_ip,dest_ip,src_port,dest_port,Protocol,Packets,bytes,StartSample,EndSample,Action,status
| fields interfaceid,src_ip,dest_ip,src_port,dest_port,protocol,packets,bytes,action,status
Installing the Amazon VPC Flow Logs App
Now that you have configured Amazon VPC Flow Logs, install the Sumo Logic App for Amazon VPC Flow Logs to take advantage of the preconfigured searches and dashboards to analyze your data.
To install the app, do the following:
Next-Gen App: To install or update the app, you must be an account administrator or a user with Manage Apps, Manage Monitors, Manage Fields, Manage Metric Rules, and Manage Collectors capabilities depending upon the different content types part of the app.
- Select App Catalog.
- In the 🔎 Search Apps field, run a search for your desired app, then select it.
- Click Install App.
note
Sometimes this button says Add Integration.
- Click Next in the Setup Data section.
- In the Configure section of your respective app, complete the following fields.
- Field Name. If you already have collectors and sources set up, select the configured metadata field name (eg _sourcecategory) or specify other custom metadata (eg: _collector) along with its metadata Field Value.
- Click Next. You will be redirected to the Preview & Done section.
Post-installation
Once your app is installed, it will appear in your Installed Apps folder, and dashboard panels will start to fill automatically.
Each panel slowly fills with data matching the time range query received since the panel was created. Results will not immediately be available but will be updated with full graphs and charts over time.
Viewing Amazon VPC Flow Logs dashboards
All dashboards have a set of filters that you can apply to the entire dashboard. Use these filters to drill down and examine the data to a granular level.
- You can change the time range for a dashboard or panel by selecting a predefined interval from a drop-down list, choosing a recently used time range, or specifying custom dates and times. Learn more.
- You can use template variables to drill down and examine the data on a granular level. For more information, see Filtering Dashboards with Template Variables.
- Most Next-Gen apps allow you to provide the scope at the installation time and are comprised of a key (
_sourceCategoryby default) and a default value for this key. Based on your input, the app dashboards will be parameterized with a dashboard variable, allowing you to change the dataset queried by all panels. This eliminates the need to create multiple copies of the same dashboard with different queries.
Overview
The Amazon VPC Flow Logs - Overview dashboard provides an overview of IP traffic going to and from network interfaces in your VPC, including the geolocation of source addresses, the top 10 sources and destinations by MB, rejections per minute, and a breakdown of accepted vs. rejected connections.
Use case: Use this dashboard for an overview of traffic flowing through your network. It gives a list of top source and destination addresses, protocols and network interfaces which can be helpful in narrowing the ranges to only those IP addresses or protocols required for the application.
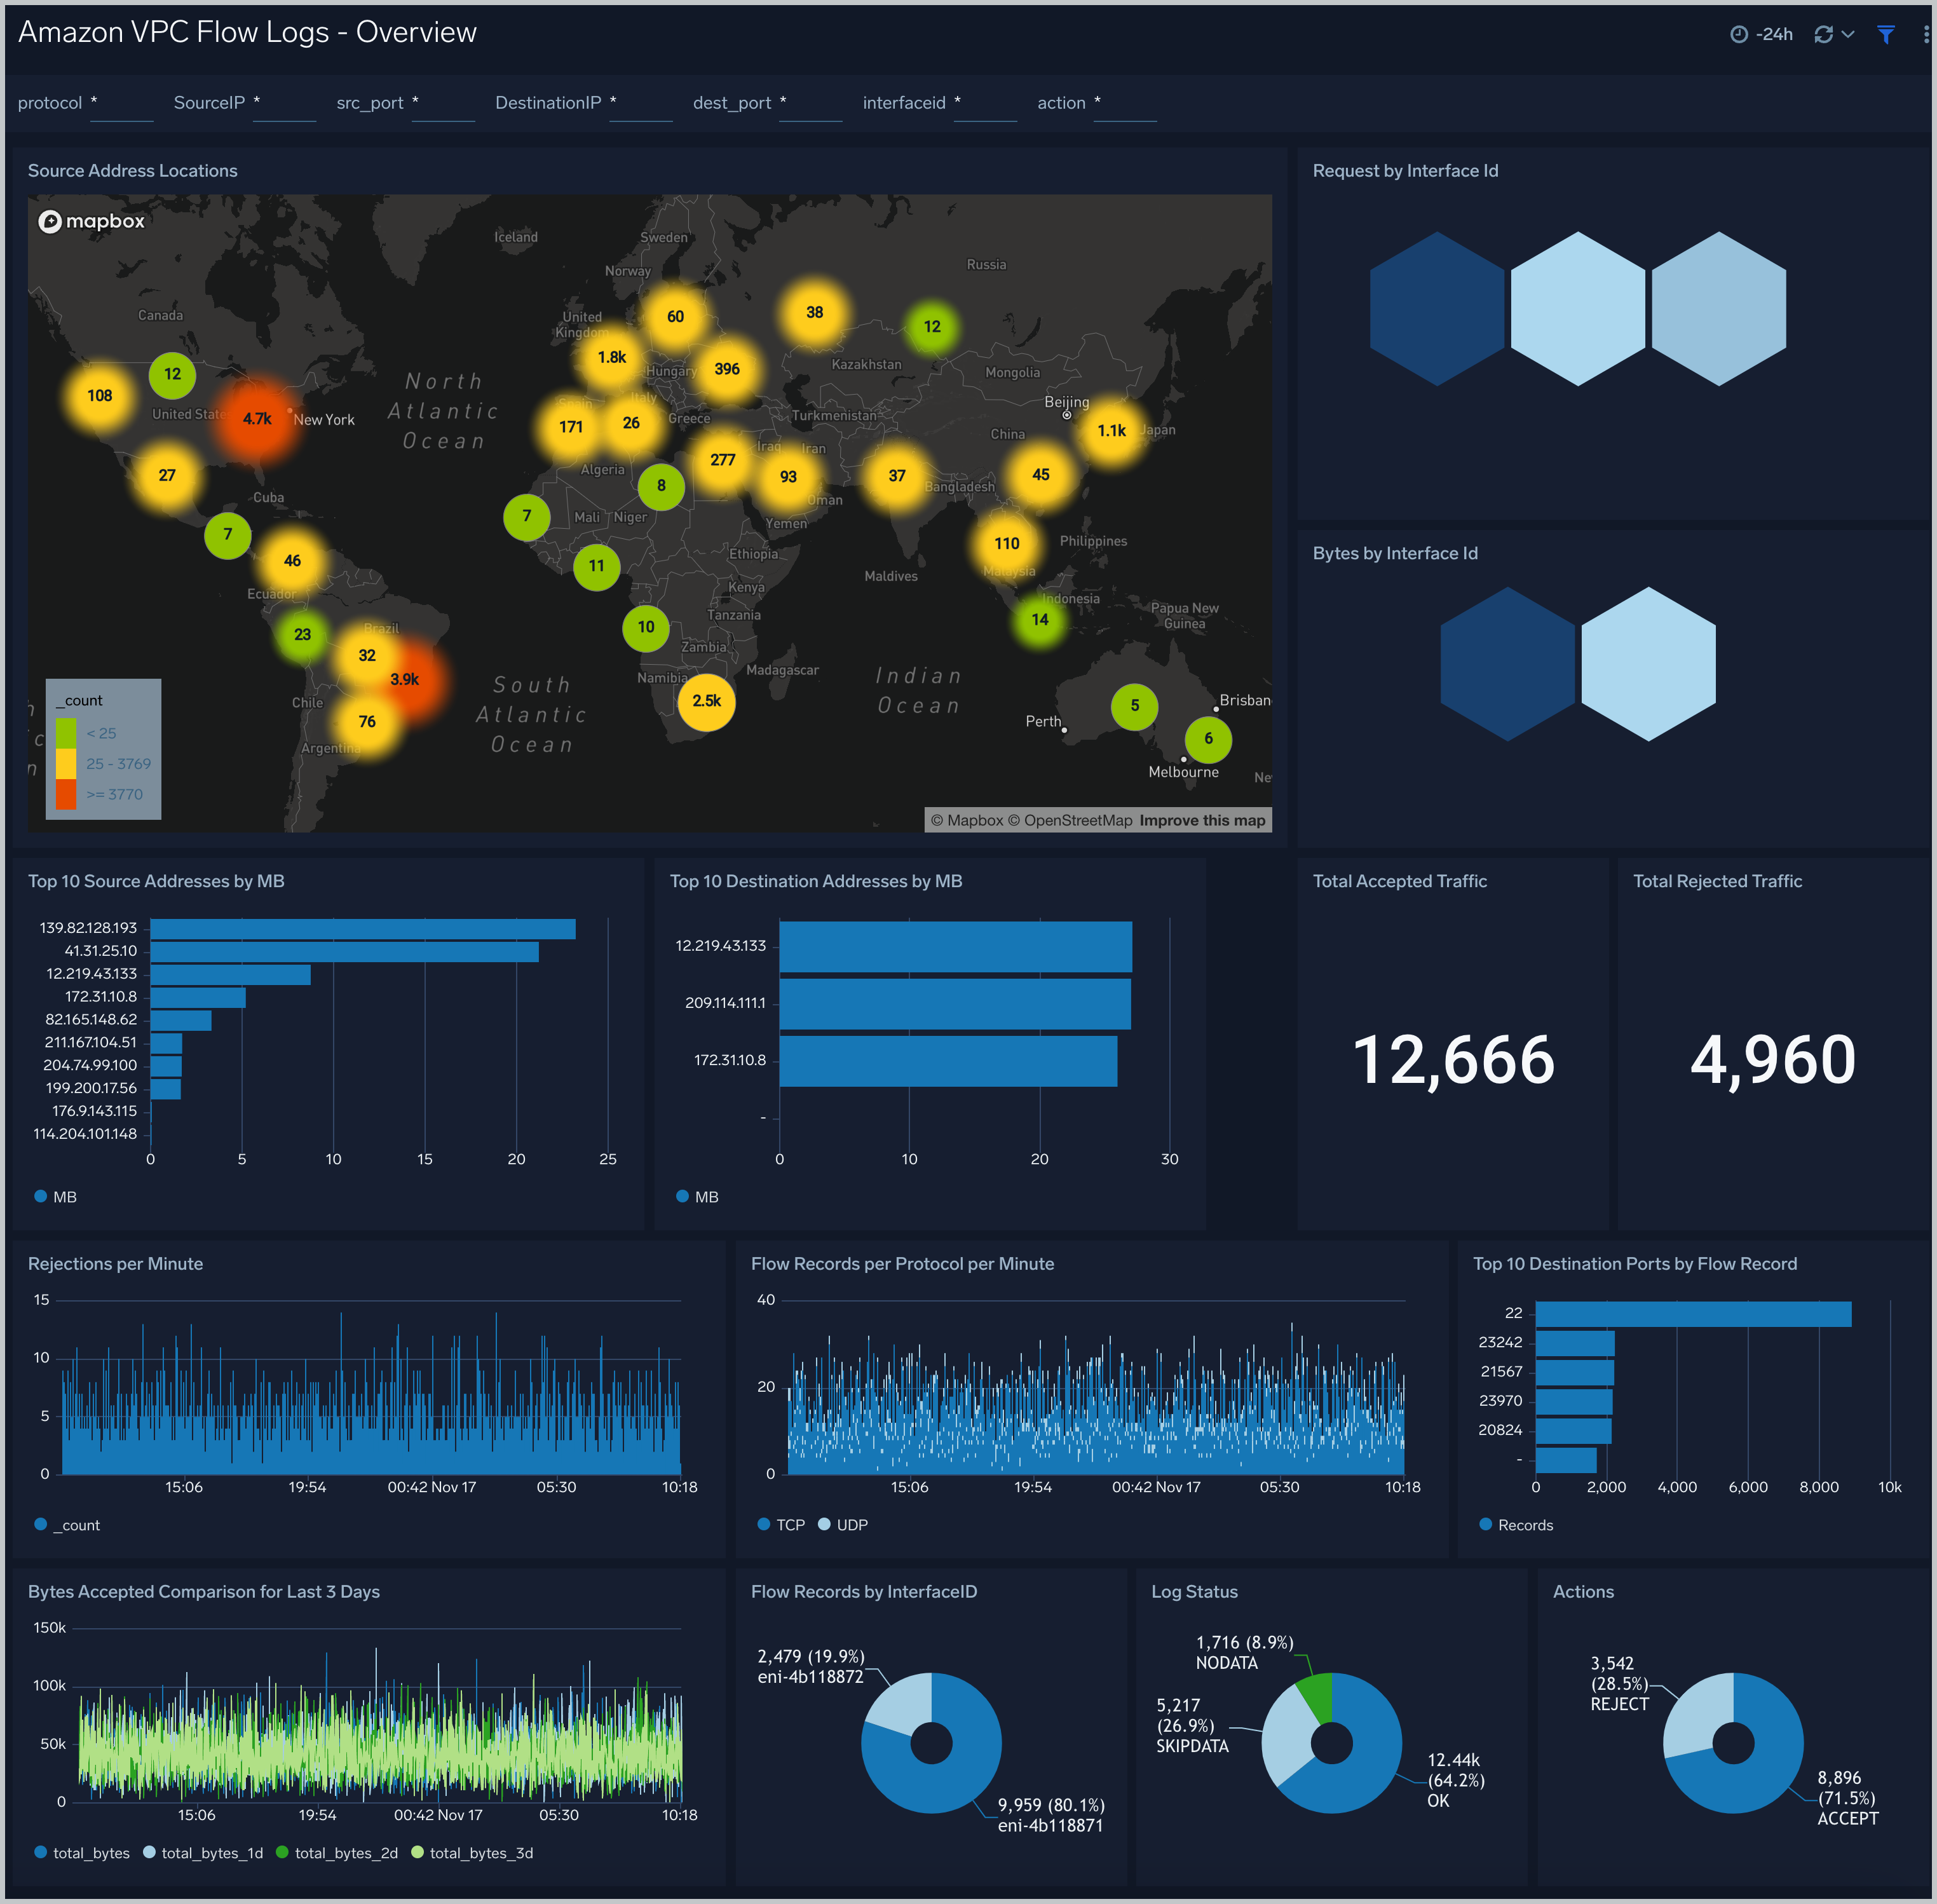
Filtering the Overview dashboard
You can filter the Overview dashboard by any combination of DestinationIP, SourceIP, action, dest_port, interfaceid, protocol, and src_port.
Accepts
Amazon VPC Flow Logs - Accepts dashboard provides information about accepted connections, including the geolocation of source addresses for accepted connections, the top 10 accepts by Interface ID and protocol, and the top 10 destination addresses.
Use case: Use this dashboard to track requests that are permitted by Security Groups and Network ACLs.One can compare bytes and packets received per minute with yesterday and last week. Similarly one can also track abnormal activity and volume spikes.
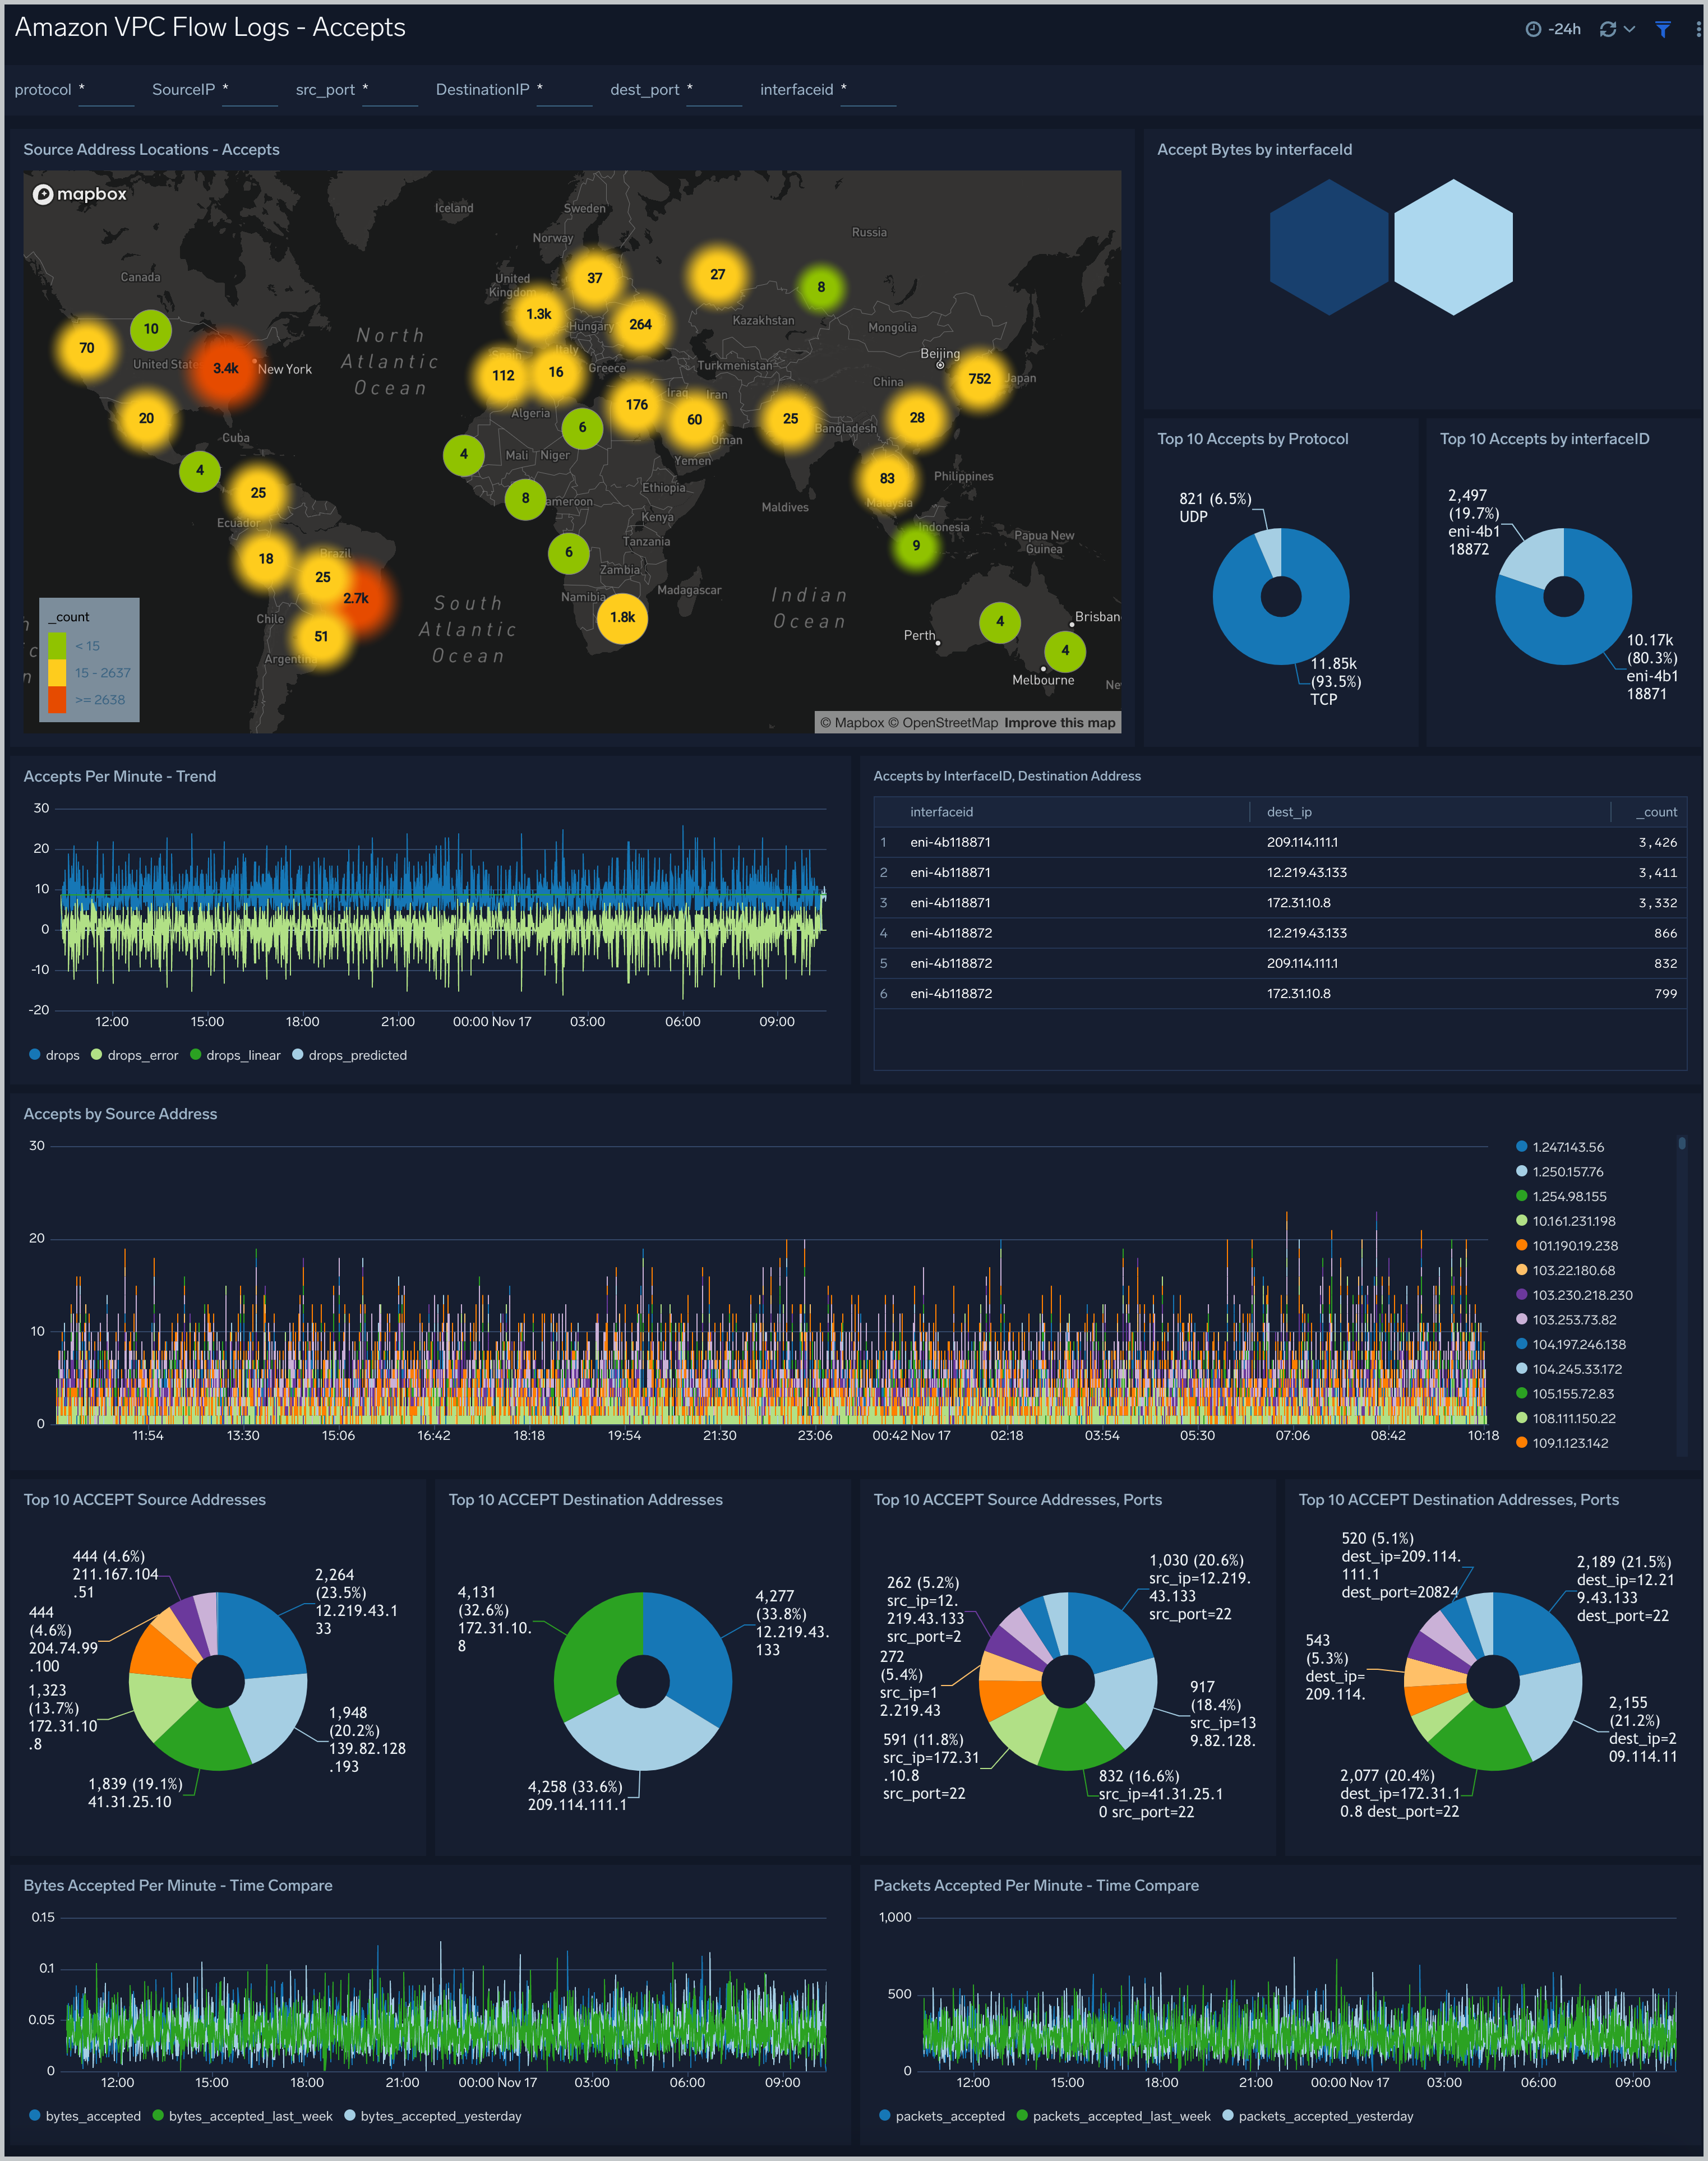
Filtering the Accepts dashboard
In the filters pane, you can can configure these parameters for the outlier analysis performed by the "Accepts by Minute - Outlier" panel: Consecutive, Threshold, Window, and Timeslice.
You can also filter Accepts dashboard by any combination of DestinationIP, SourceIP, dest_port, interfaceid, protocol, and src_port.
Rejects
Amazon VPC Flow Logs - Rejects dashboard provides information about rejected connections, including the geolocation of source addresses for rejected connections, the top 10 rejects by Interface ID and protocol, and the top 10 destination addresses.
Use case: Use this dashboard to track requests that are not permitted by Security Groups and Network ACLs.One can compare bytes and packets rejected per minute with yesterday and last week. One can monitor top source IP's and ports from where the requests are rejected.
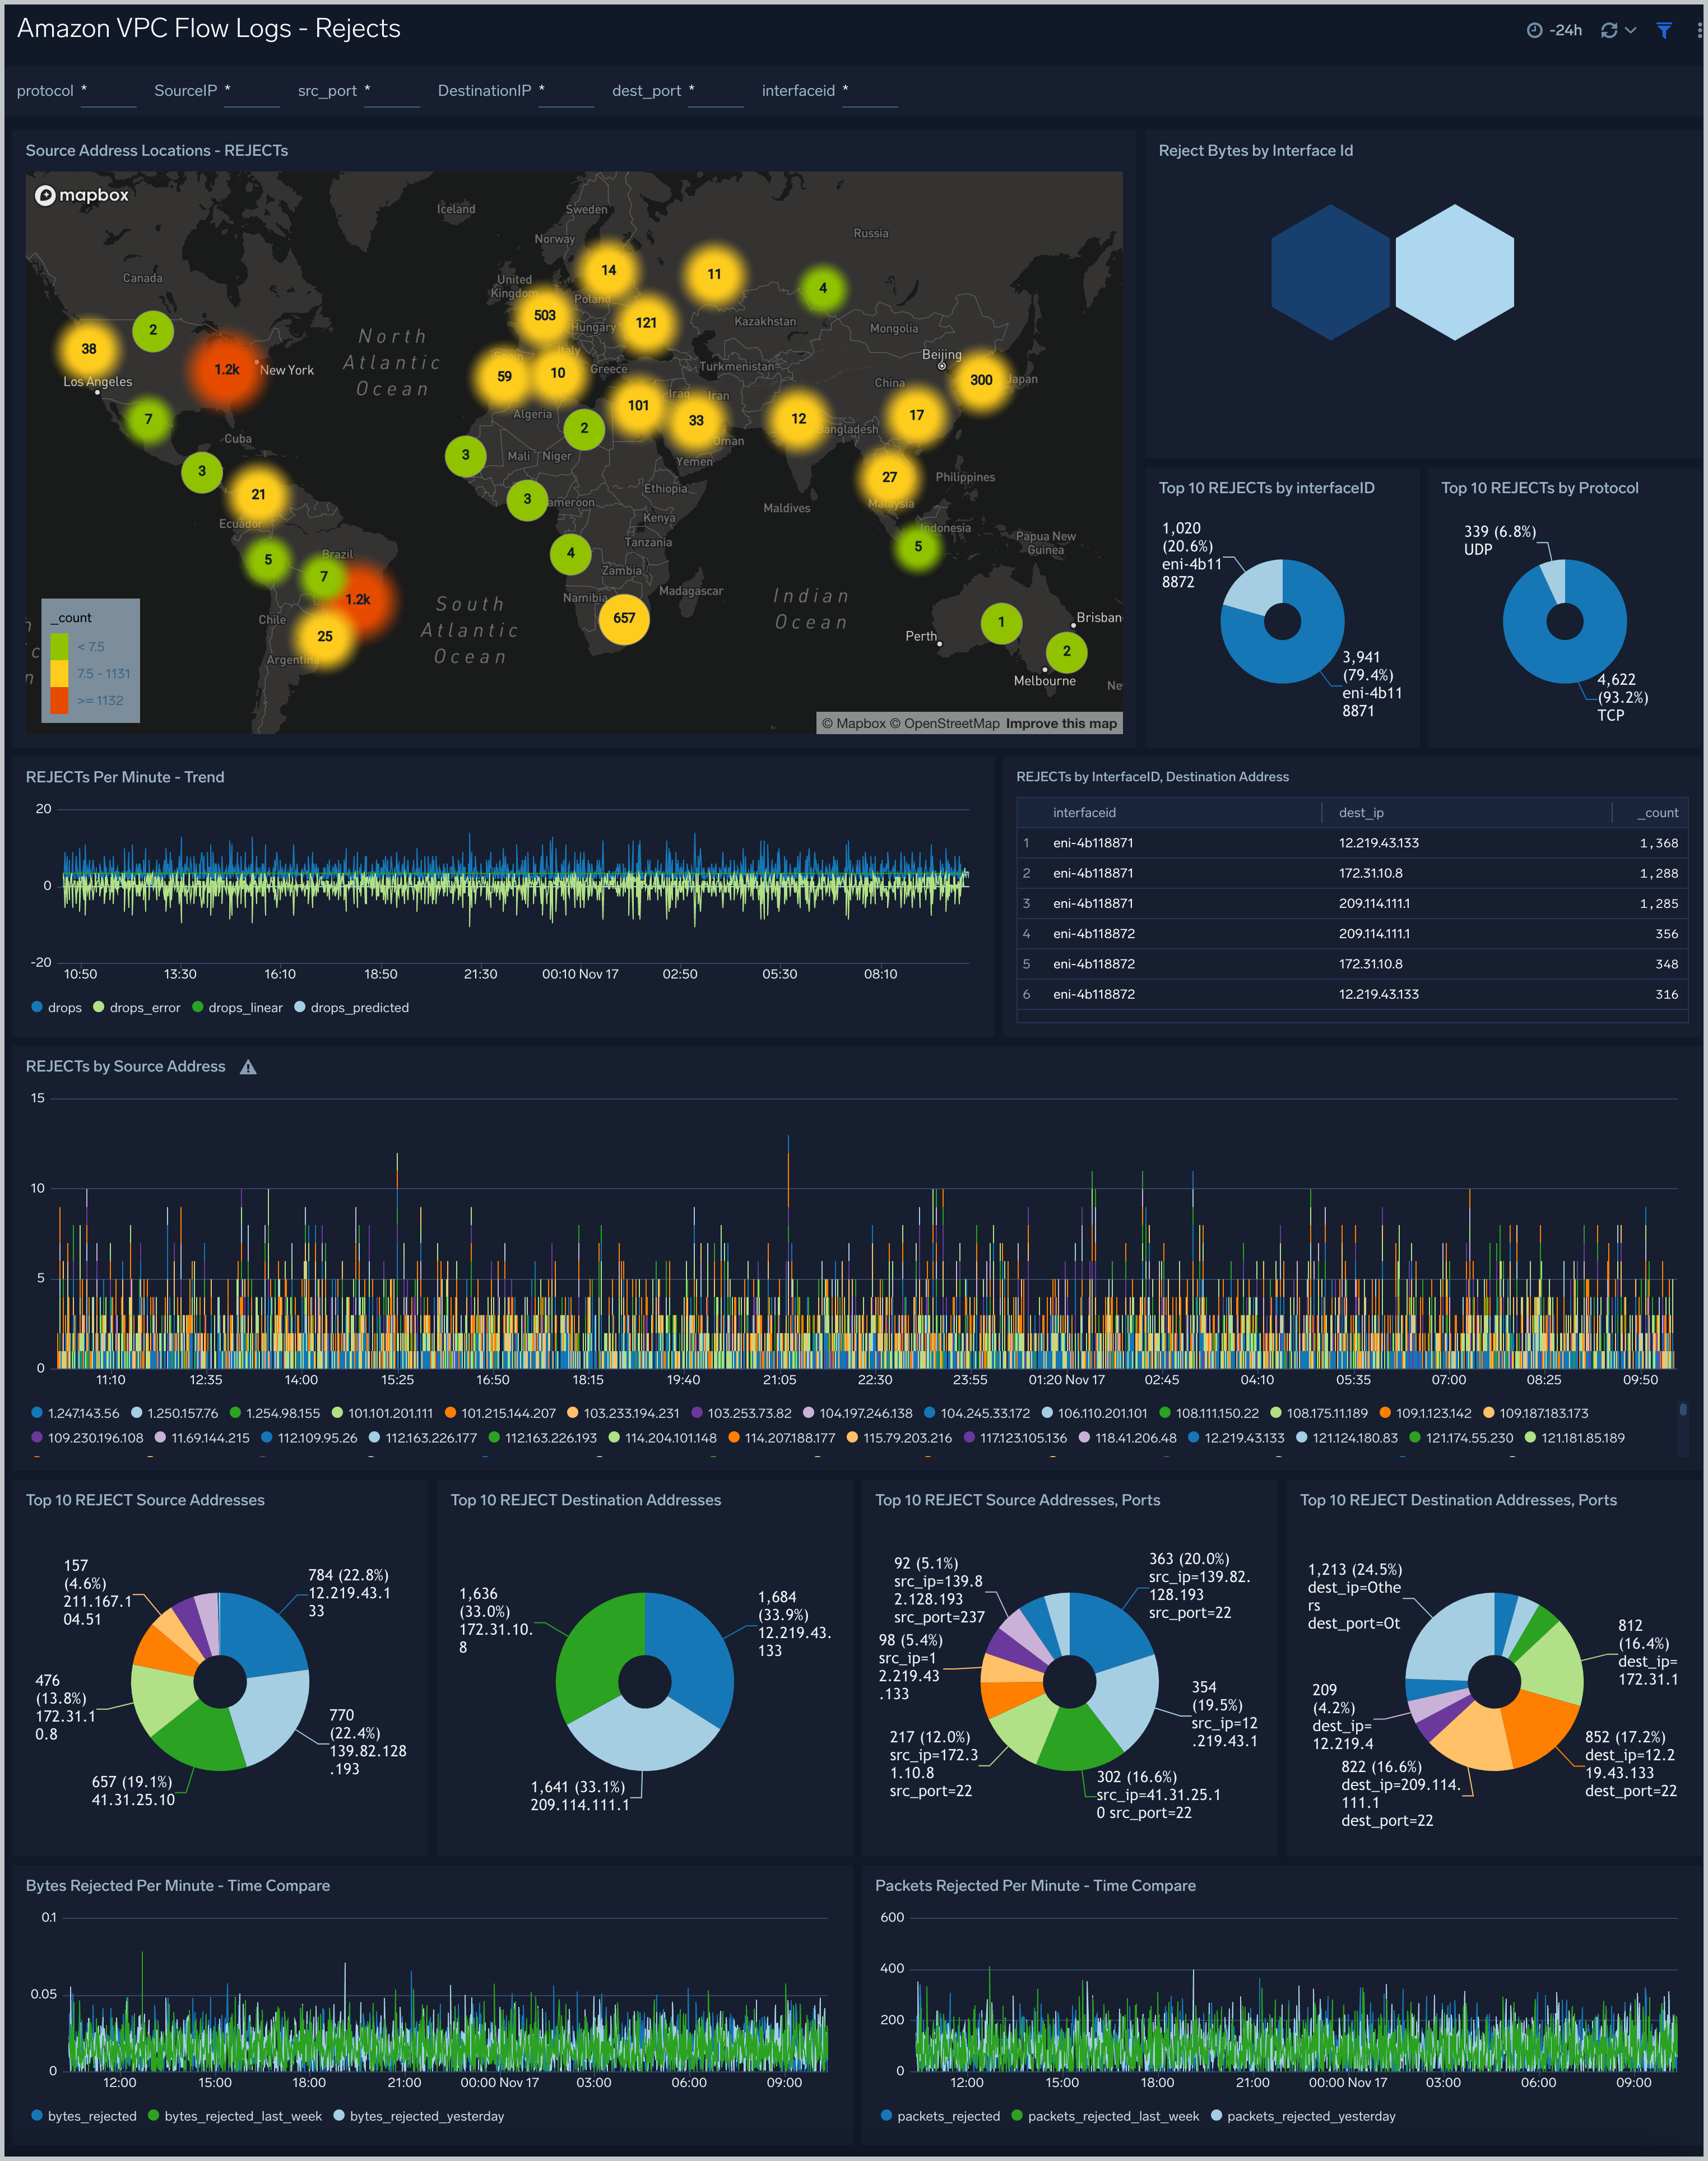
Filtering the Rejects dashboard
In the filters pane, you can can configure these parameters for the outlier analysis performed by the "Rejects by Minute - Outlier" panel: Consecutive, Threshold, Window, and Timeslice.
You can also filter the Rejects dashboard by any combination of DestinationIP, SourceIP, dest_port, interfaceid, protocol, and src_port.
Traffic
Amazon VPC Flow Logs - Traffic dashboard provides traffic details, including the counts of unique traffic sources and destinations, the total accepted and rejected traffic, the top 10 source and destination ports, and analyzes of bytes and packets transmitted.
Use case description: Use this dashboard for comparing the permissive and non permissive traffic based on ports, protocols and network interfaces. Also one can monitor abnormal behavior, current and future trends based on total packets and bytes flowing across the network. One can filter by Action to filter out data for permissive and non permissive traffic. Similarly one can filter by interfaceid, src_ip, dest_ip, src_port, dest_port to further filter out the traffic for analysis.
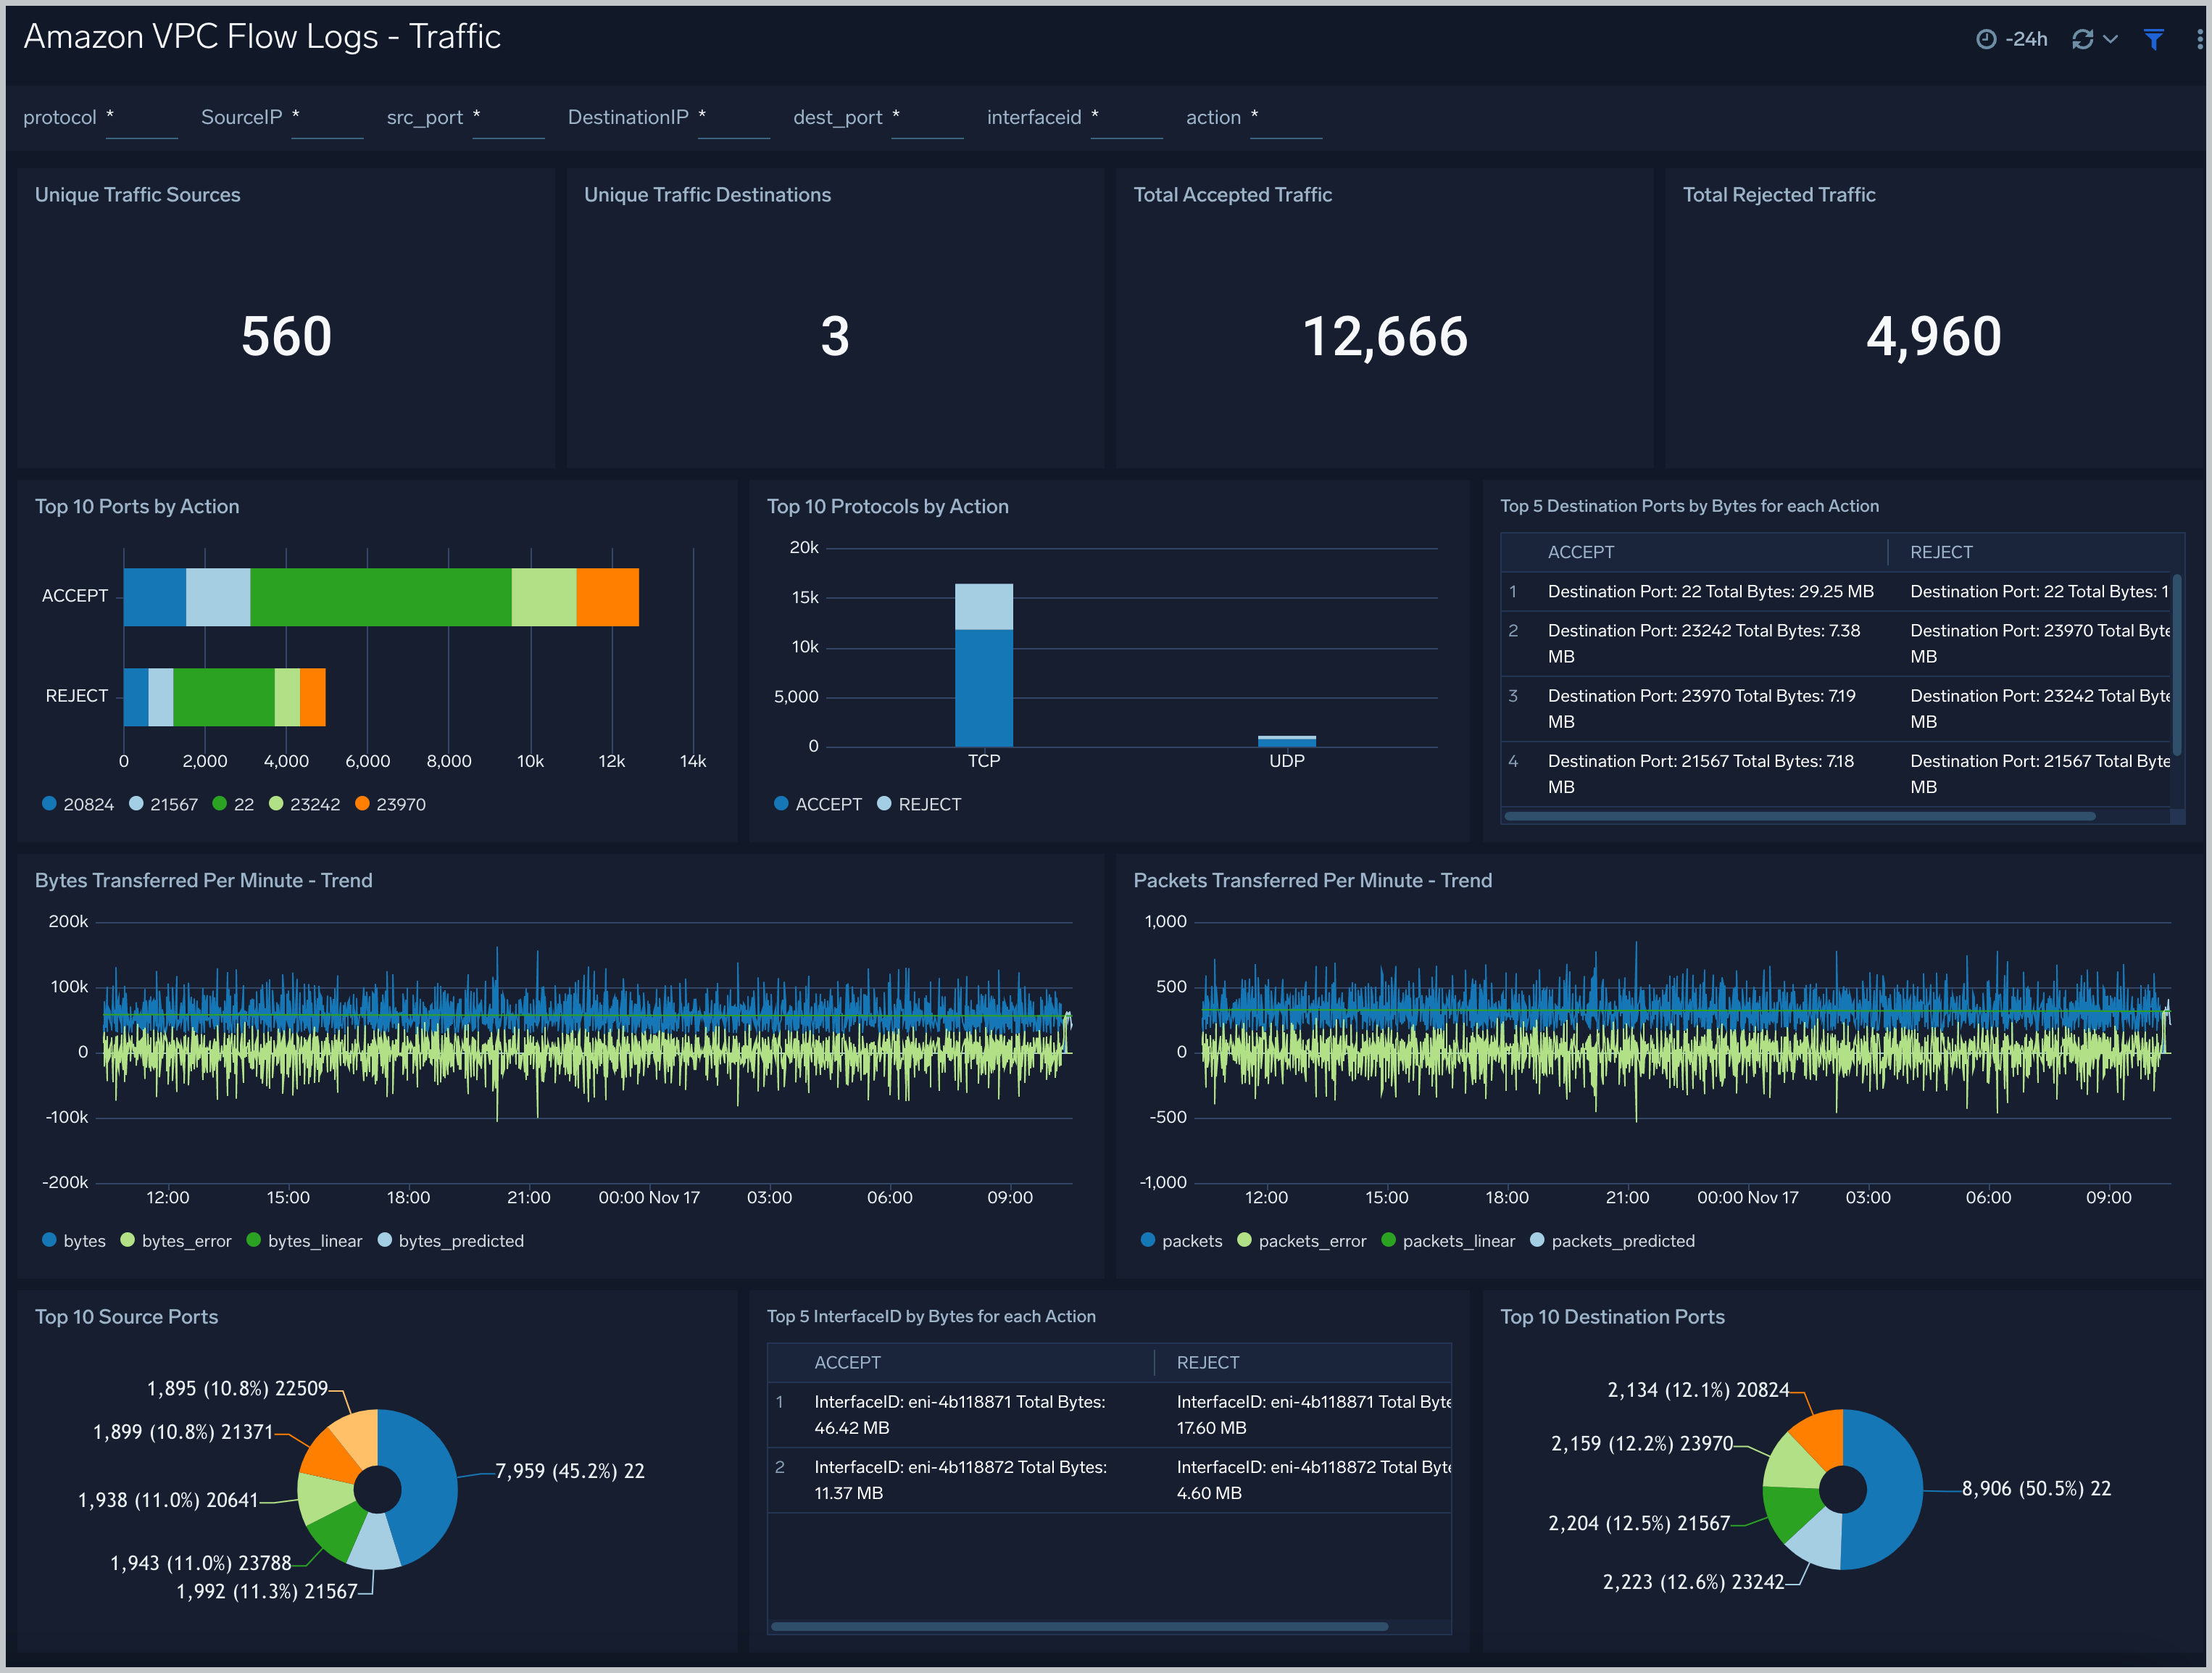
Filtering the Traffic dashboard
In the filters pane, you can can configure these parameters for the outlier analysis performed by several panels: Consecutive, Threshold, Window, and Timelice.
You can also filter the Traffic dashboard by any combination of DestinationIP, SourceIP, action, dest_port, interfaceid, protocol, and src_port.
Security Groups
Amazon VPC Flow Logs - Security Groups dashboard provides information about security groups, subnet and vpc along with flow direction inbound/outbound including the top vpc,subnet by bytes flow, top 5 security groups by packets, number of unique vpc,subnet and security group and destination port distribution by security group.
Key facts about this dashboard:
- This dashboard is populated only if you chose VPC-JSON option for LogFormat when you deployed the CloudFormation template.
- If your network interface has multiple IPv4 addresses and traffic is sent to a secondary private IPv4 address, the flow log displays the primary private IPv4 address in the destination IP address field.
- The Direction field has three values:
- internal. The SourceIP and DestinationIP both are from same subnet,
- inbound. The DestinationIP matches the ENI's private IP address.
- outbound. iThe SourceIP matches the ENI’s private IP address.
Use case: Use this dashboard for monitoring the traffic direction. Also use this dashboard for identifying over permissive and restrictive security groups.One can also use this to identify unused security groups and inbound rules by comparing the traffic associated with the security group to the security group rules in EC2 console.
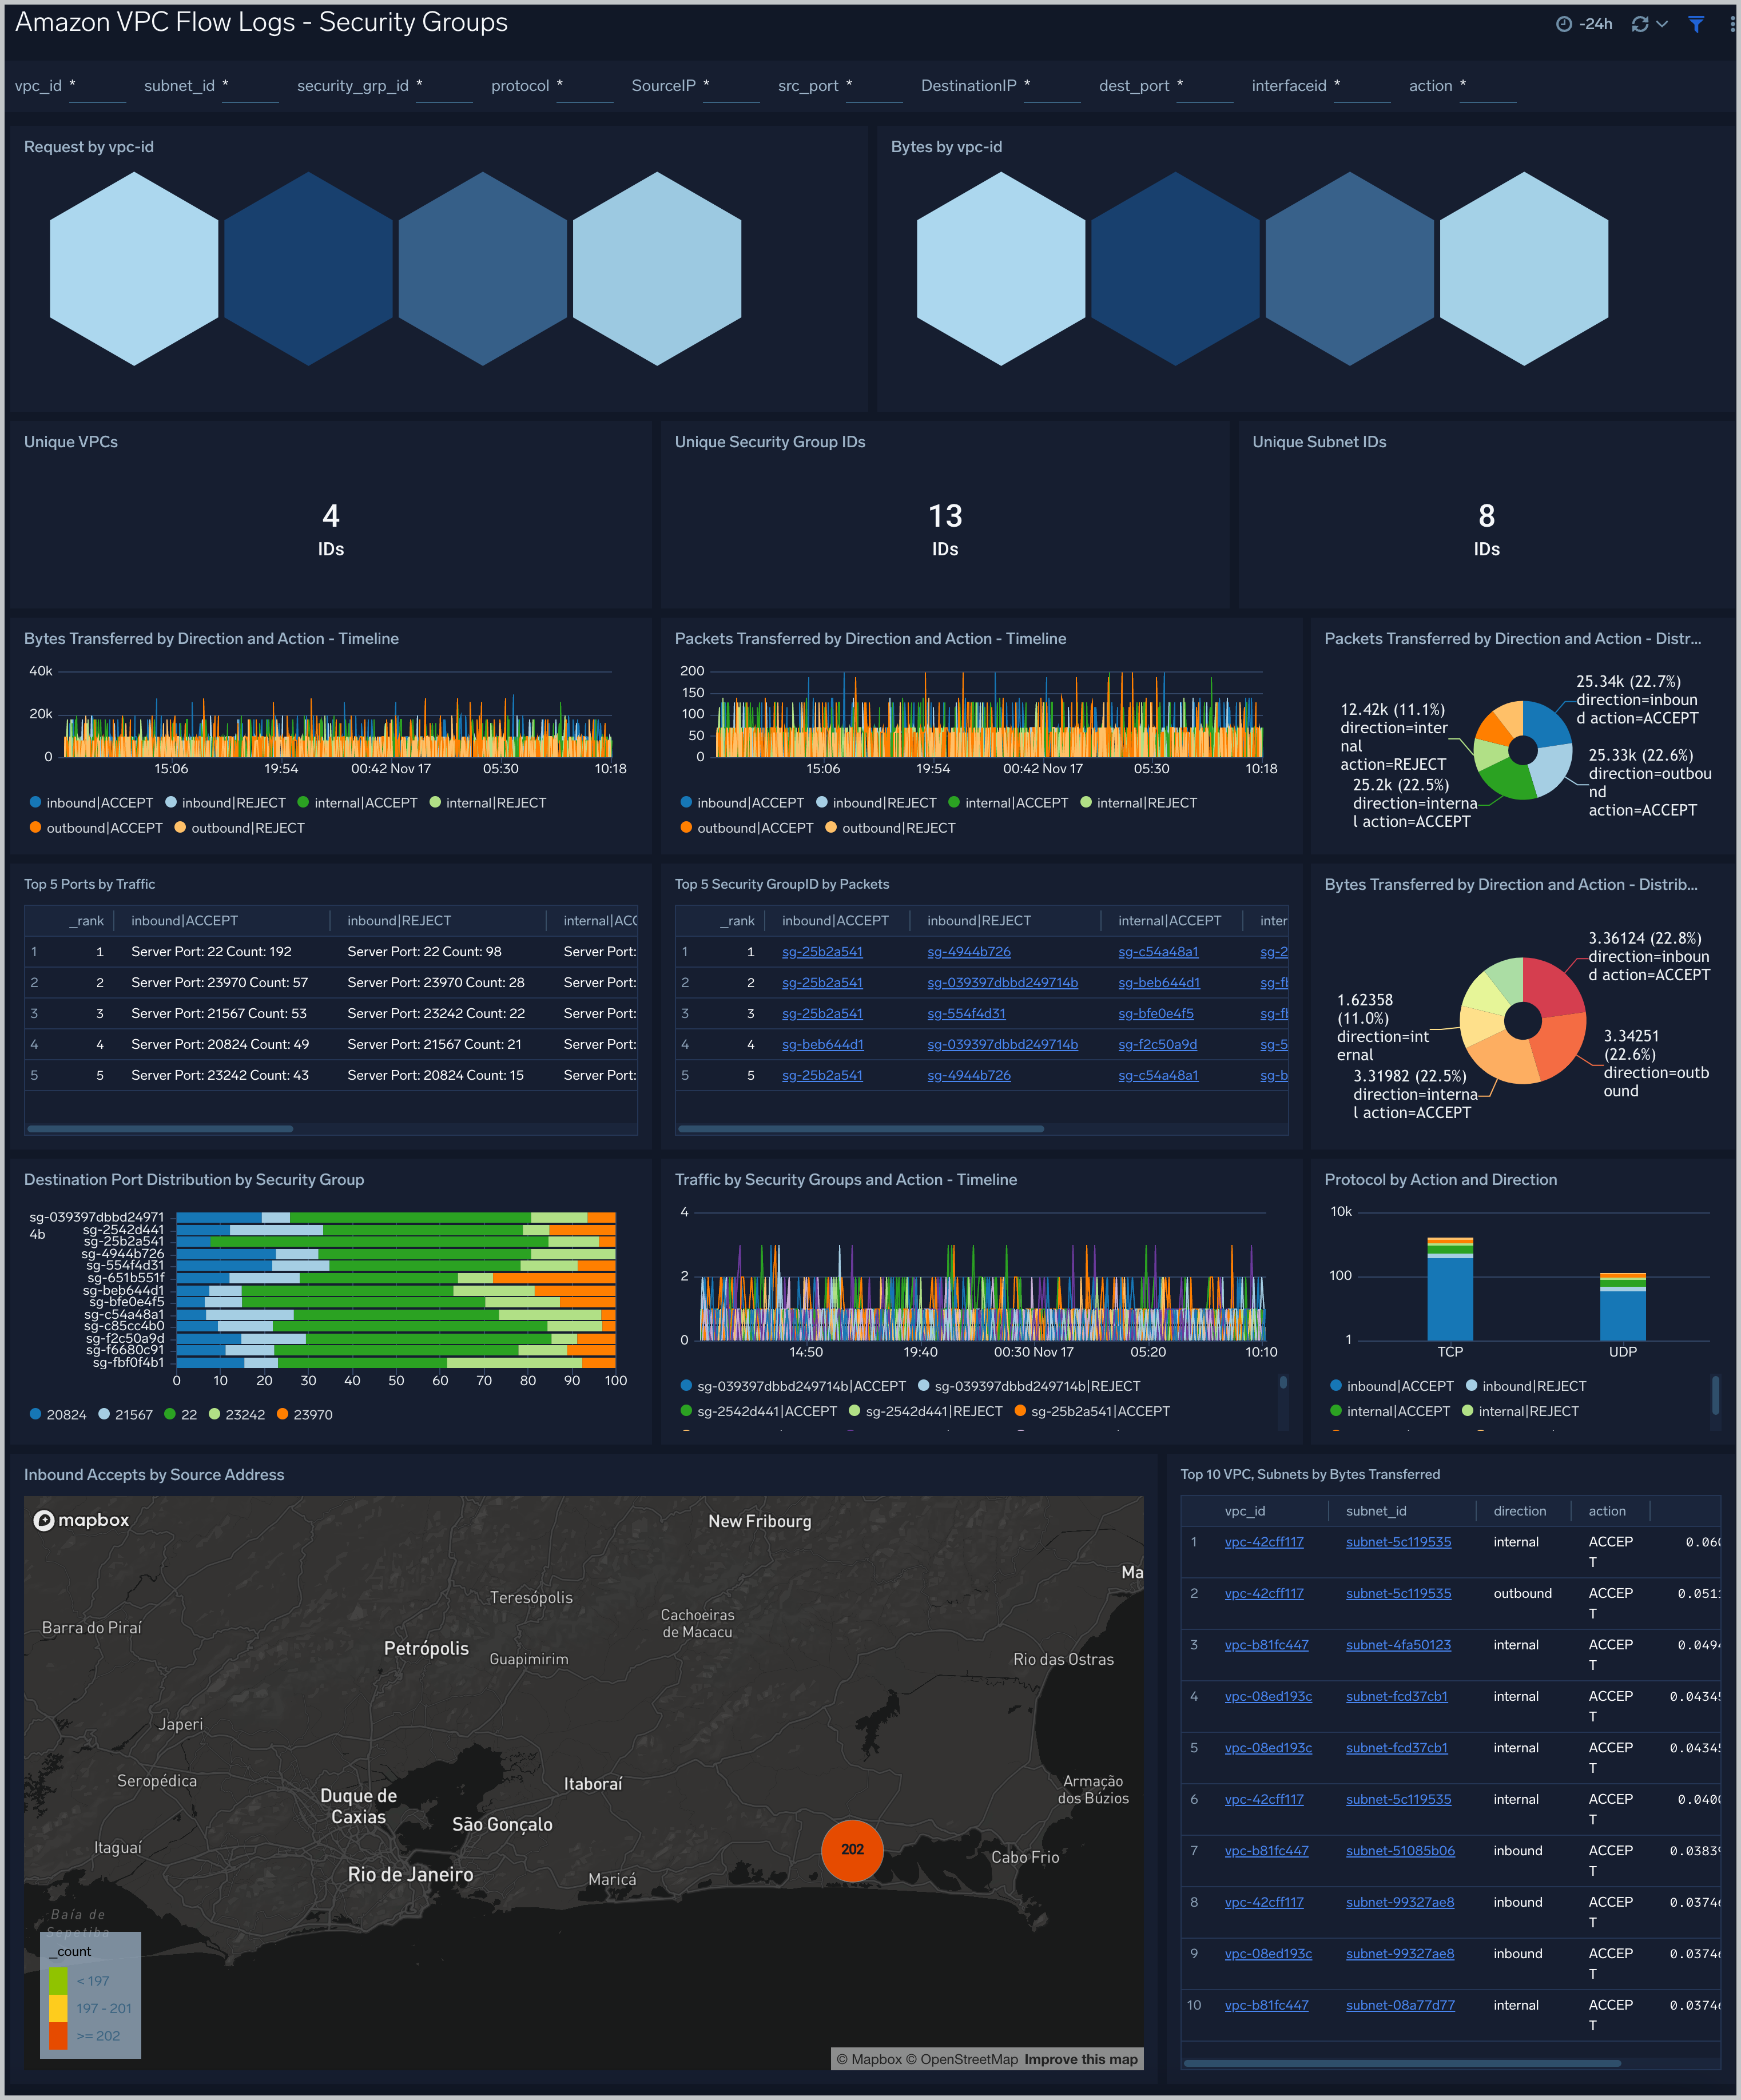
Filtering the Security Groups dashboard
In the filters pane, you can can configure these parameters for the outlier analysis performed by several panels: Consecutive, Threshold, Window, and Timeslice.
You can also filter the Security Groups dashboard by any combination of DestinationIP, SourceIP, action, dest_port, interfaceid, protocol, security_grp_id, src_port, subnet_id, and vpc_id.
Outliers
Amazon VPC Flow Logs - Outliers dashboard provides panels which show any outliers around Bytes, Packets and Accepted/Rejected traffic. In addition to this there is a separate section “Security Group” which has panels for outliers with respect to inbound and outbound traffic. This dashboard is populated only if you chose VPC-JSON option for LogFormat when you deployed the CloudFormation template.
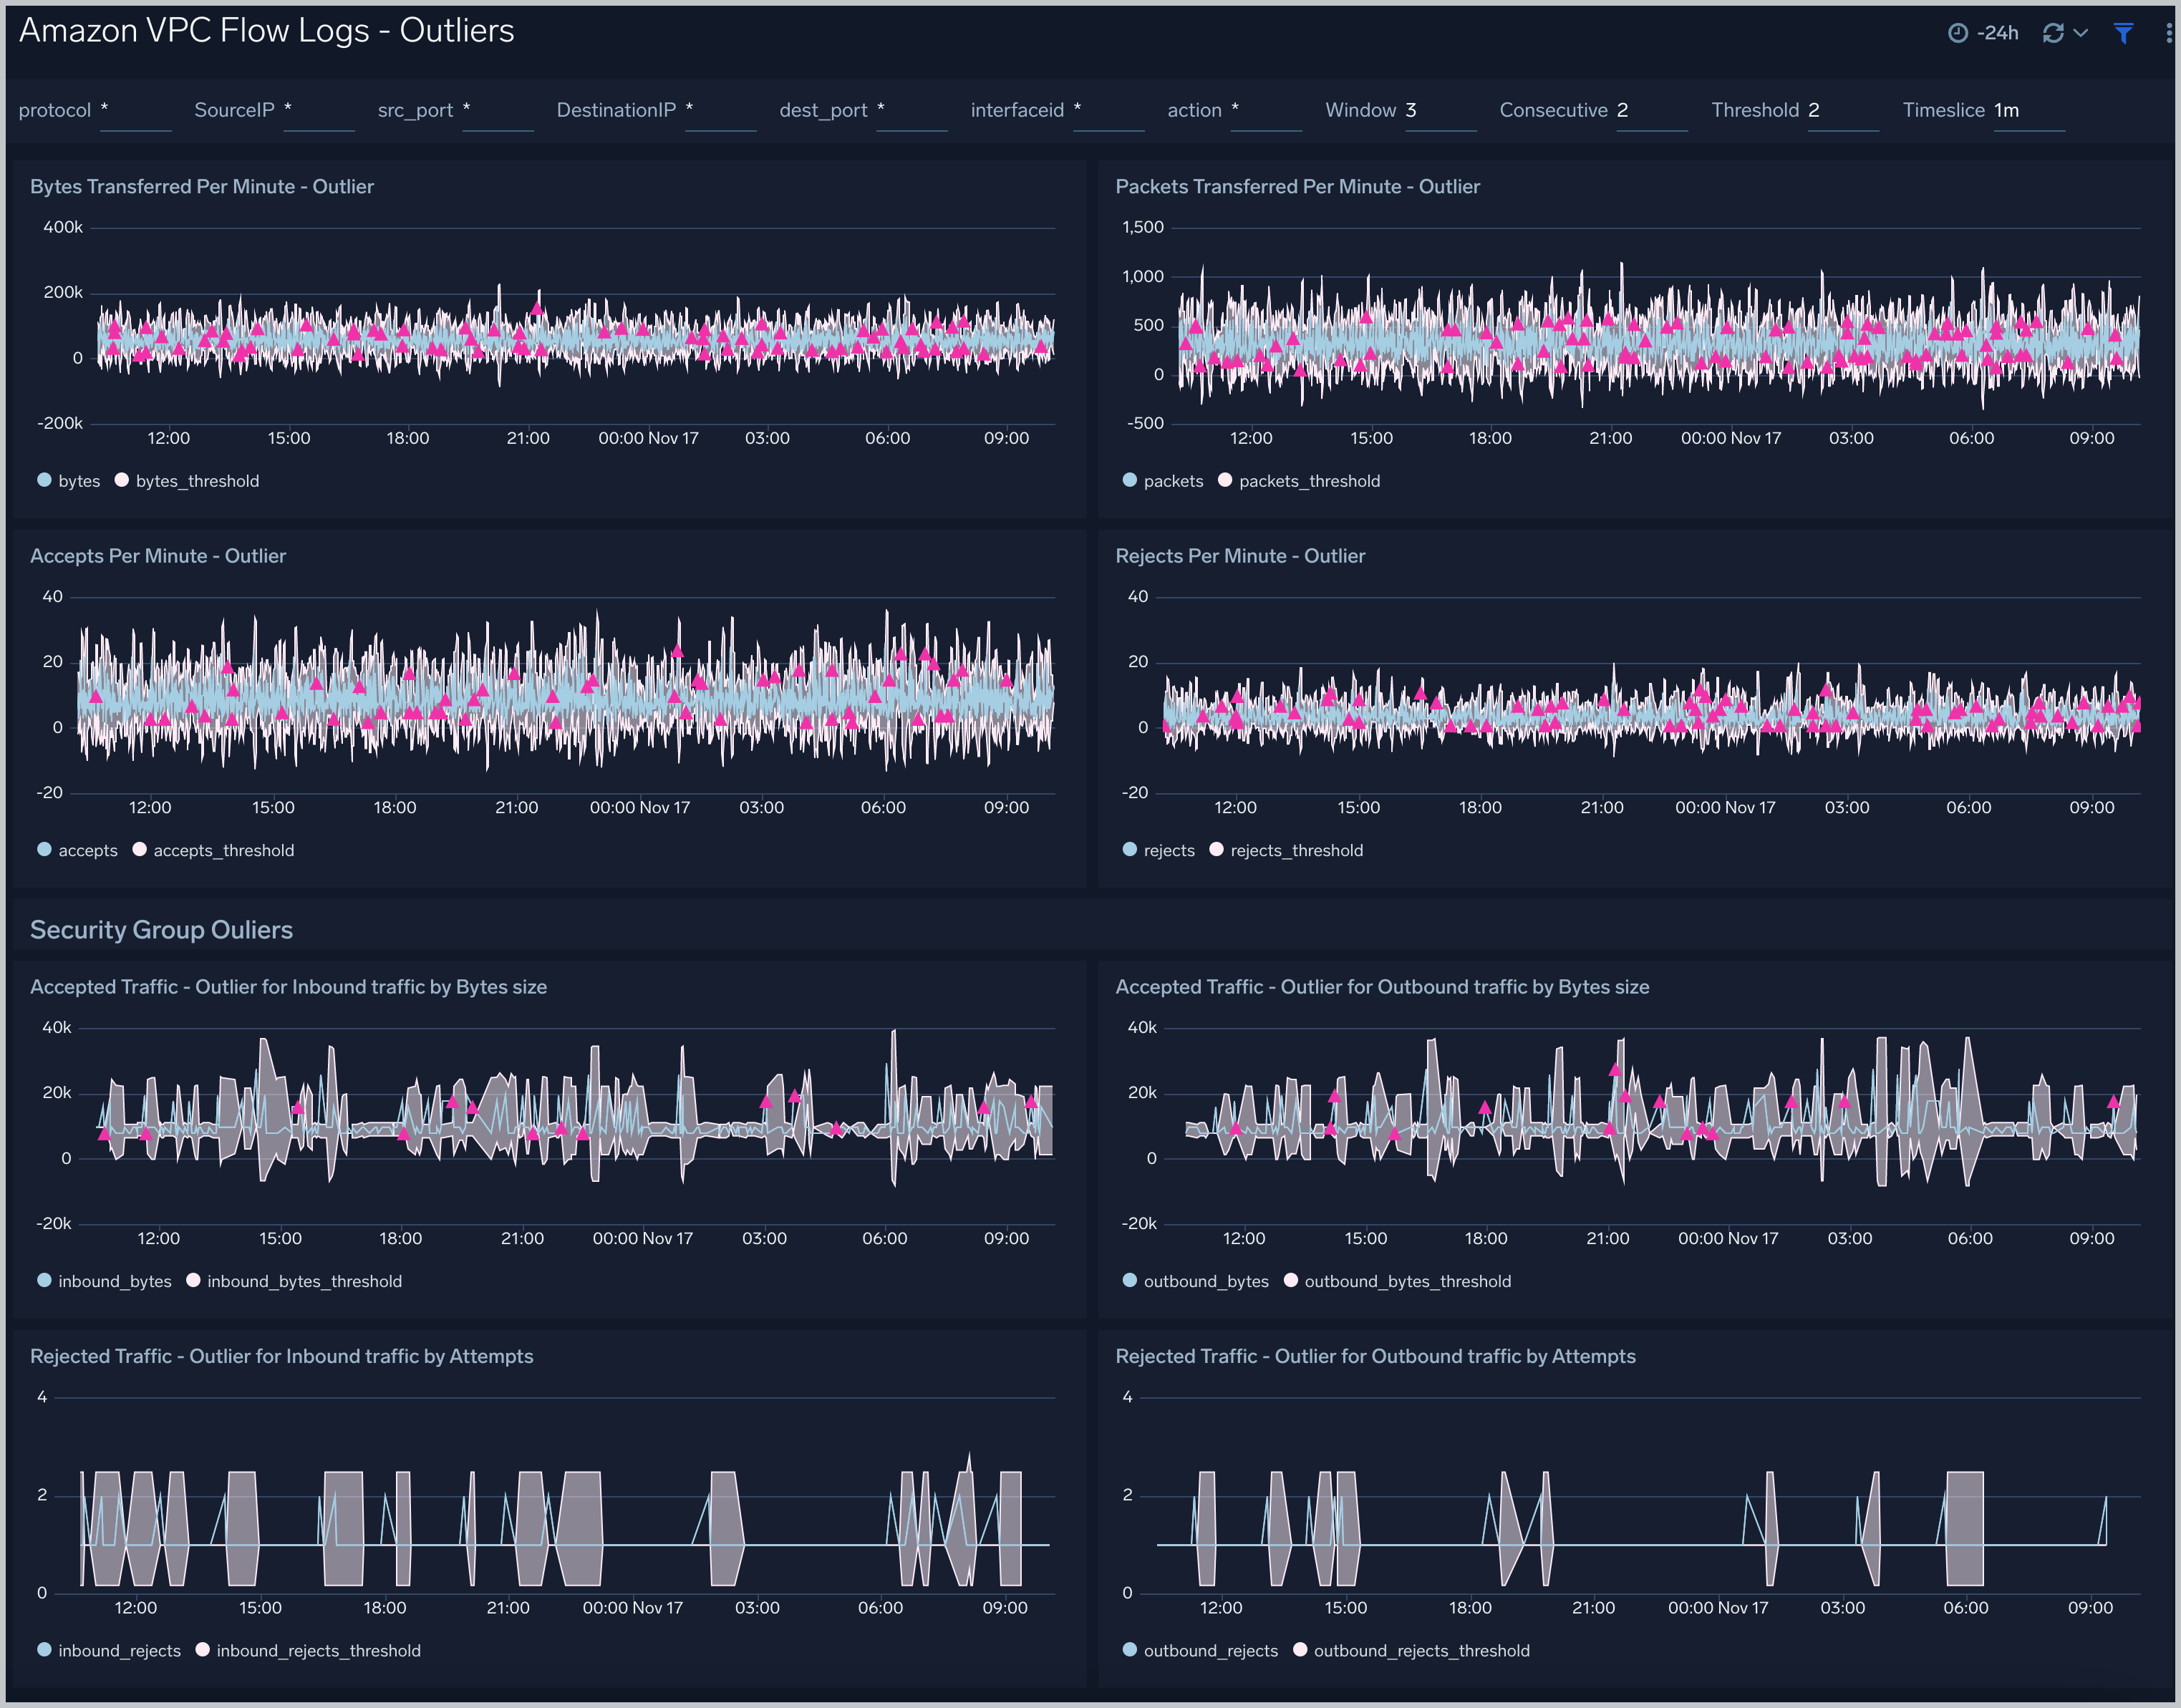
Filtering the Outlier dashboard
In the filters panel, you can configure these parameters for the outlier analysis performed by several panels: Consecutive, Threshold, Window, and Timeslice.