GitHub

The Sumo Logic App for GitHub connects to your GitHub repository at the Organization or Repository level, and ingests GitHub events through a webhook. These events populate the pre-configured Dashboards to give you a complete overview of your GitHub’s branch, issues, pull requests, user activity, and security events.
If you want to collect audit logs for GitHub Enterprise:
- Follow the instructions on how to stream GitHub Enterprise Audit Logs to an Amazon S3 bucket or Azure Event Hubs.
- Use an Amazon S3 source or Event Hubs Source to send those logs to Sumo Logic. This app will work with global webhook for Github enterprise, organization webhook or repository webhook.
Make sure not to select the same webhook event type at multiple levels (i.e., enterprise, organization, or repository) to avoid ingesting duplicate data.
This app includes dashboards for GHAS, but to be able to ingest GHAS events you must have a separate GHAS license.
Event types
The Sumo Logic App for GitHub ingests GitHub events via a webhook. Sumo Logic ingests all events, but only uses the following events in the Dashboards:
- Fork
- Issues
- Membership
- Public
- Pull
- Pull_request
- Push
- Repository
- Team_add
For the GitHub Advanced Security dashboards Sumo Logic App for GitHub uses these types events, but not limited to:
- Code Scanning Alerts
- Pushes
- Secret Scanning Alerts
- Security and analysis
- Repository Vulnerability alerts.
For information on GitHub events, see the GitHub documentation.
If you're just getting started with GitHub Events, see the Sumo Logic DevOps blog, "A Beginner's Guide to GitHub Events."
Log types
The Sumo Logic App for GitHub gathers statistics and events from the GitHub Remote API on each host.
First, configure a Collector and Source in Sumo Logic, then configure a GitHub Webhook using the HTTP Source Address created in Sumo Logic.
Sample log messages
GitHub sends all fields in the payload, documented according to Event Type.
{
  "action": "opened",
  "issue": {
    "url": "https://api.github.com/repos/octocat/Hello-World/issues/1347",
    "number": 1347,
    ...
  },
  "repository" : {
    "id": 1296269,
    "full_name": "octocat/Hello-World",
    "owner": {
      "login": "octocat",
      "id": 1,
      ...
    },
    ...
  },
  "sender": {
    "login": "octocat",
    "id": 1,
    ...
  }
}
Sample queries
"commits" "https://api.github.com/repos"
| json "commits[*].id[*]", "repository.name", "pusher.name" as commit_size, repo_name, user
| where commit_size != "[]"
| replace(commit_size, ",","") as Ccommit_size
| (length(commit_size) - length(Ccommit_size) + 1) as num_commits
| timeslice 1d
| count by _timeslice
| json "action", "scope", "member.login", "member.id", "member.type", "team.name", "team.permission", "organization.login" as action, scope, member_name, member_id, member_type, team_name, team_permission, org_login
| count by member_id, action, team_name, org_login, member_name, team_permission
| order by action, member_id
| fields member_name, action, team_name, org_login, team_permission
| json "action", "issue.id", "issue.number", "issue.title" , "issue.state", "issue.created_at", "issue.updated_at", "issue.closed_at", "issue.body", "issue.user.login", "issue.url", "repository.name", "repository.open_issues_count" as axn, issue_ID, issue_num, issue_title, state, createdAt, updatedAt, closedAt, body, user, url, repo_name, repoOpenIssueCnt
| withtime repoOpenIssueCnt
| most_recent (repoopenissuecnt_withtime) as number_issues by repo_name
| number (number_issues)
Collecting logs for GitHub
The Sumo Logic App for GitHub connects to your GitHub repository at the Organization or Repository level and ingests GitHub events via a webhook. These events populate the preconfigured dashboards to give you a complete overview of your GitHub’s branch, issues, pull requests, user activity, and security events.
Configure Hosted Collector to Receive GitHub Events
In this step, you configure a Hosted Collector to receive Webhook Events from GitHub and set up an HTTP Source on it.
- Configure a Hosted Collector, or select an existing hosted collector for the HTTP Source.
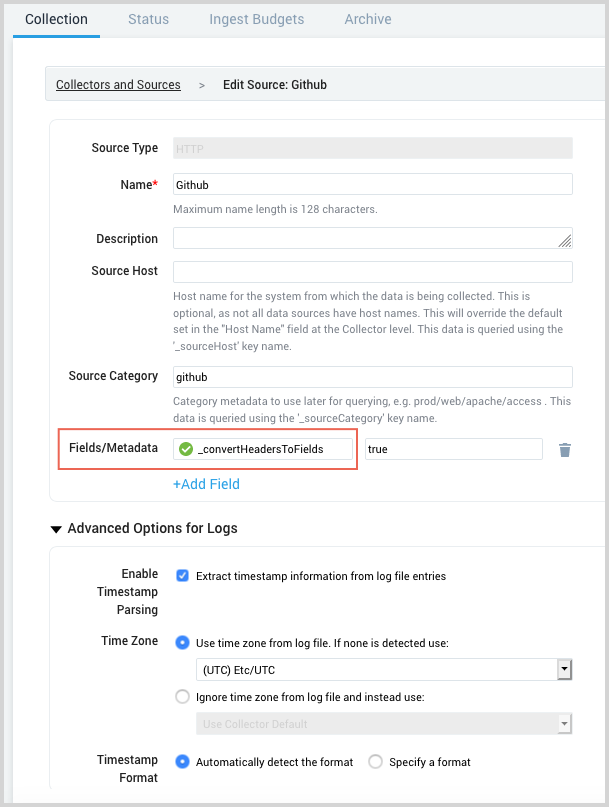
- Configure an HTTP Source on the Hosted Collector.
- For Source Category, enter any string to tag the output collected from this Source, such as
GitHub. - Click +Add Field and provide the following:
- Field Name.
_convertHeadersToFields - Value.
true
- Field Name.
- Expand the Advanced Options for Logs (Optional) section.
- In the Enable Timestamp Parsing section, check Extract timestamp information from log file entries.
- Click Save and make note of the HTTP address for the Source. You will supply it when you configure the GitHub Webhook in the next section.
- For Source Category, enter any string to tag the output collected from this Source, such as
Configure a GitHub Webhook
In GitHub, configure a Webhook to connect to your Sumo Logic HTTP Source. You can configure the Webhook at the Organization or Repository level. Once configured, it will be triggered each time one or more subscribed events occur in that Organization or Repository.
You can create up to 20 Webhooks for each event on each specific organization or repository.
To configure a GitHub Webhook:
- Sign in to your GitHub account.
- Go to your Organization.
- Go to Settings > Webhooks.
- Click Add Webhook. The Add Webhook form appears.
- Enter Webhook form data as follows:
- Payload URL. Enter the Sumo Logic HTTP Source Address from the source setup step.
- Content type. Select application/json.
- Secret. Leave blank.
- Which events would you like to trigger this Webhook? Select Send me everything.
- Active. Check the box.
- Click Add Webhook.
GitHub Event tagging at Sumo Logic
To properly identify the event type for incoming events (for example, repo:push events), Sumo Logic automatically adds the x-github-event event type to the Fields during app installation.
Installing the GitHub App
To install the app, do the following:
Next-Gen App: To install or update the app, you must be an account administrator or a user with Manage Apps, Manage Monitors, Manage Fields, Manage Metric Rules, and Manage Collectors capabilities depending upon the different content types part of the app.
- Select App Catalog.
- In the 🔎 Search Apps field, run a search for your desired app, then select it.
- Click Install App.
note
Sometimes this button says Add Integration.
- Click Next in the Setup Data section.
- In the Configure section of your respective app, complete the following fields.
- Field Name. If you already have collectors and sources set up, select the configured metadata field name (eg _sourcecategory) or specify other custom metadata (eg: _collector) along with its metadata Field Value.
- Click Next. You will be redirected to the Preview & Done section.
Post-installation
Once your app is installed, it will appear in your Installed Apps folder, and dashboard panels will start to fill automatically.
Each panel slowly fills with data matching the time range query received since the panel was created. Results will not immediately be available but will be updated with full graphs and charts over time.
Troubleshooting
If you are getting the following error after installing the app - Field x-github-event not found, please check the spelling and try again - do the following to resolve:
- Classic UI. In the main Sumo Logic menu, select Manage Data > Logs > Fields.
New UI. In the top menu select Configuration, and then under Logs select Fields. You can also click the Go To... menu at the top of the screen and select Fields. - Delete your x-github-event.
- Add it again using the Dropped Fields option.
Viewing GitHub Dashboards
All dashboards have a set of filters that you can apply to the entire dashboard. Use these filters to drill down and examine the data to a granular level.
- You can change the time range for a dashboard or panel by selecting a predefined interval from a drop-down list, choosing a recently used time range, or specifying custom dates and times. Learn more.
- You can use template variables to drill down and examine the data on a granular level. For more information, see Filtering Dashboards with Template Variables.
- Most Next-Gen apps allow you to provide the scope at the installation time and are comprised of a key (
_sourceCategoryby default) and a default value for this key. Based on your input, the app dashboards will be parameterized with a dashboard variable, allowing you to change the dataset queried by all panels. This eliminates the need to create multiple copies of the same dashboard with different queries.
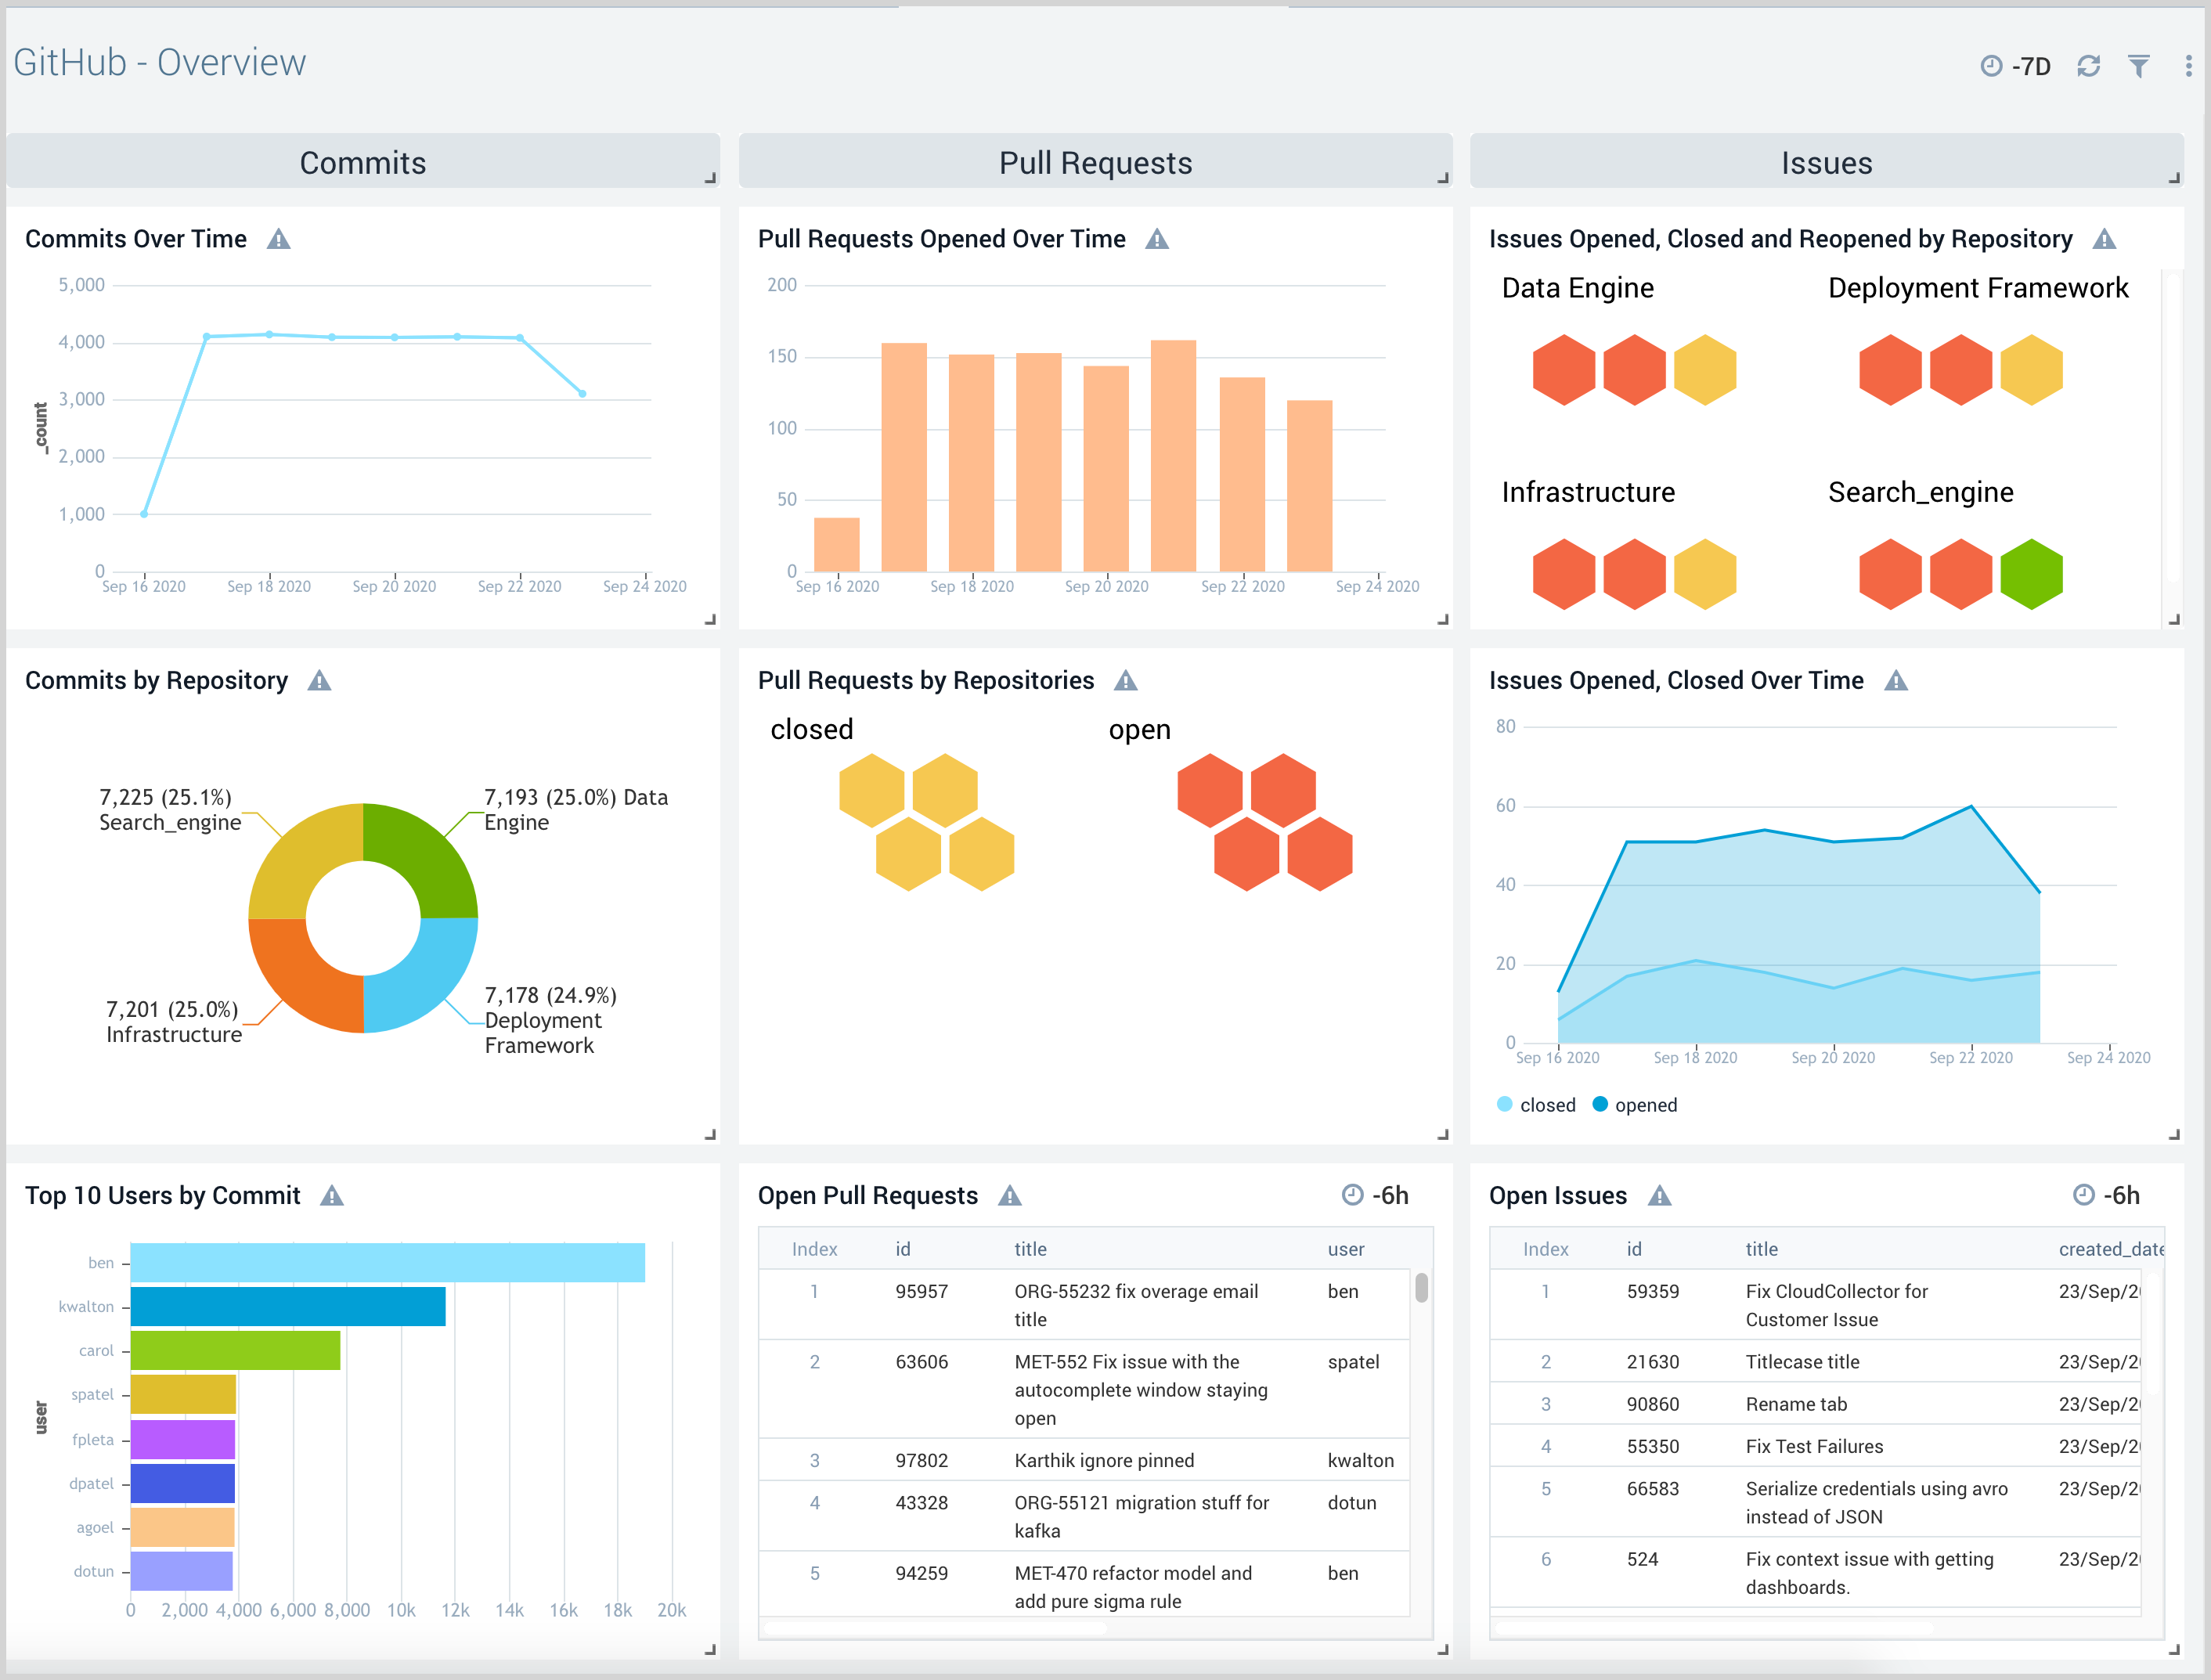
Overview
The GitHub - Overview dashboard provides an at-a-glance view of your GitHub issues, pull requests, and the commits over time.
Use this dashboard to:
- Get an overview of GitHub commits, Pull Requests, and Issues.
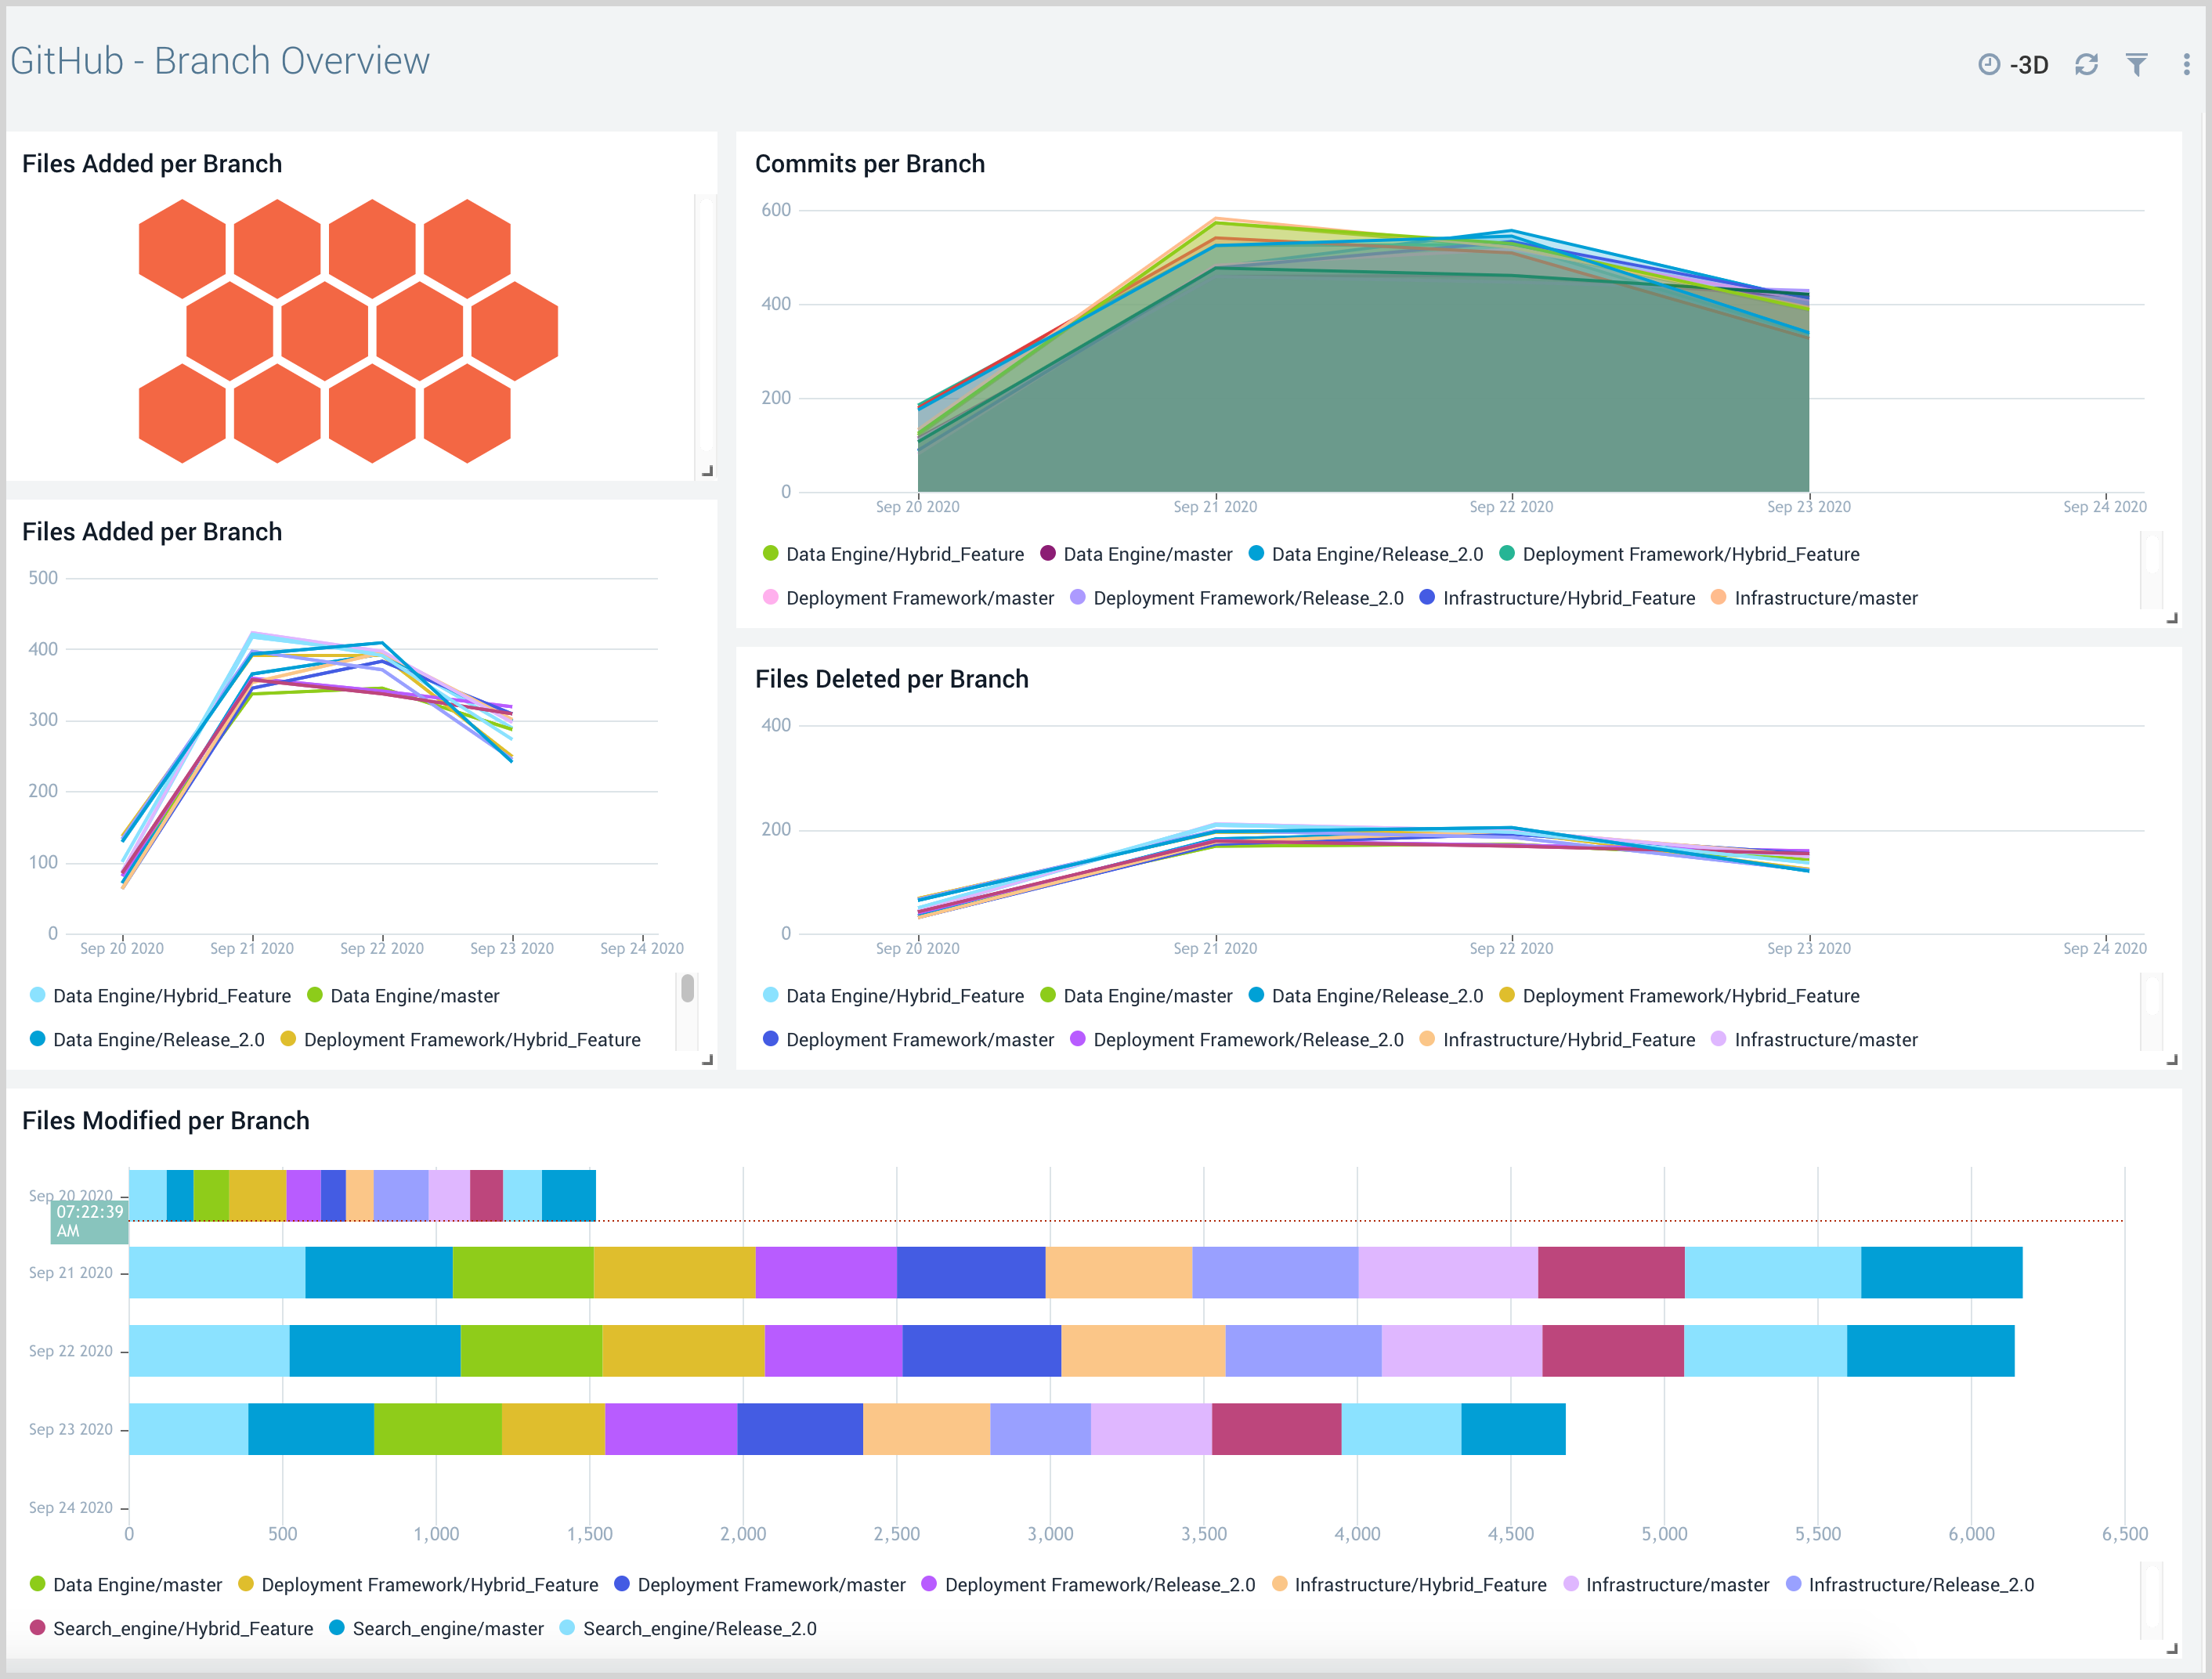
Branch Overview
The GitHub - Branch Overview dashboard provides information about the commits, file operations like addition, deletion, and modifications per branch.
Use this dashboard to:
- Review branch-specific details.
- Identify the type of files being added, deleted, or modified.
- Review the commit details.
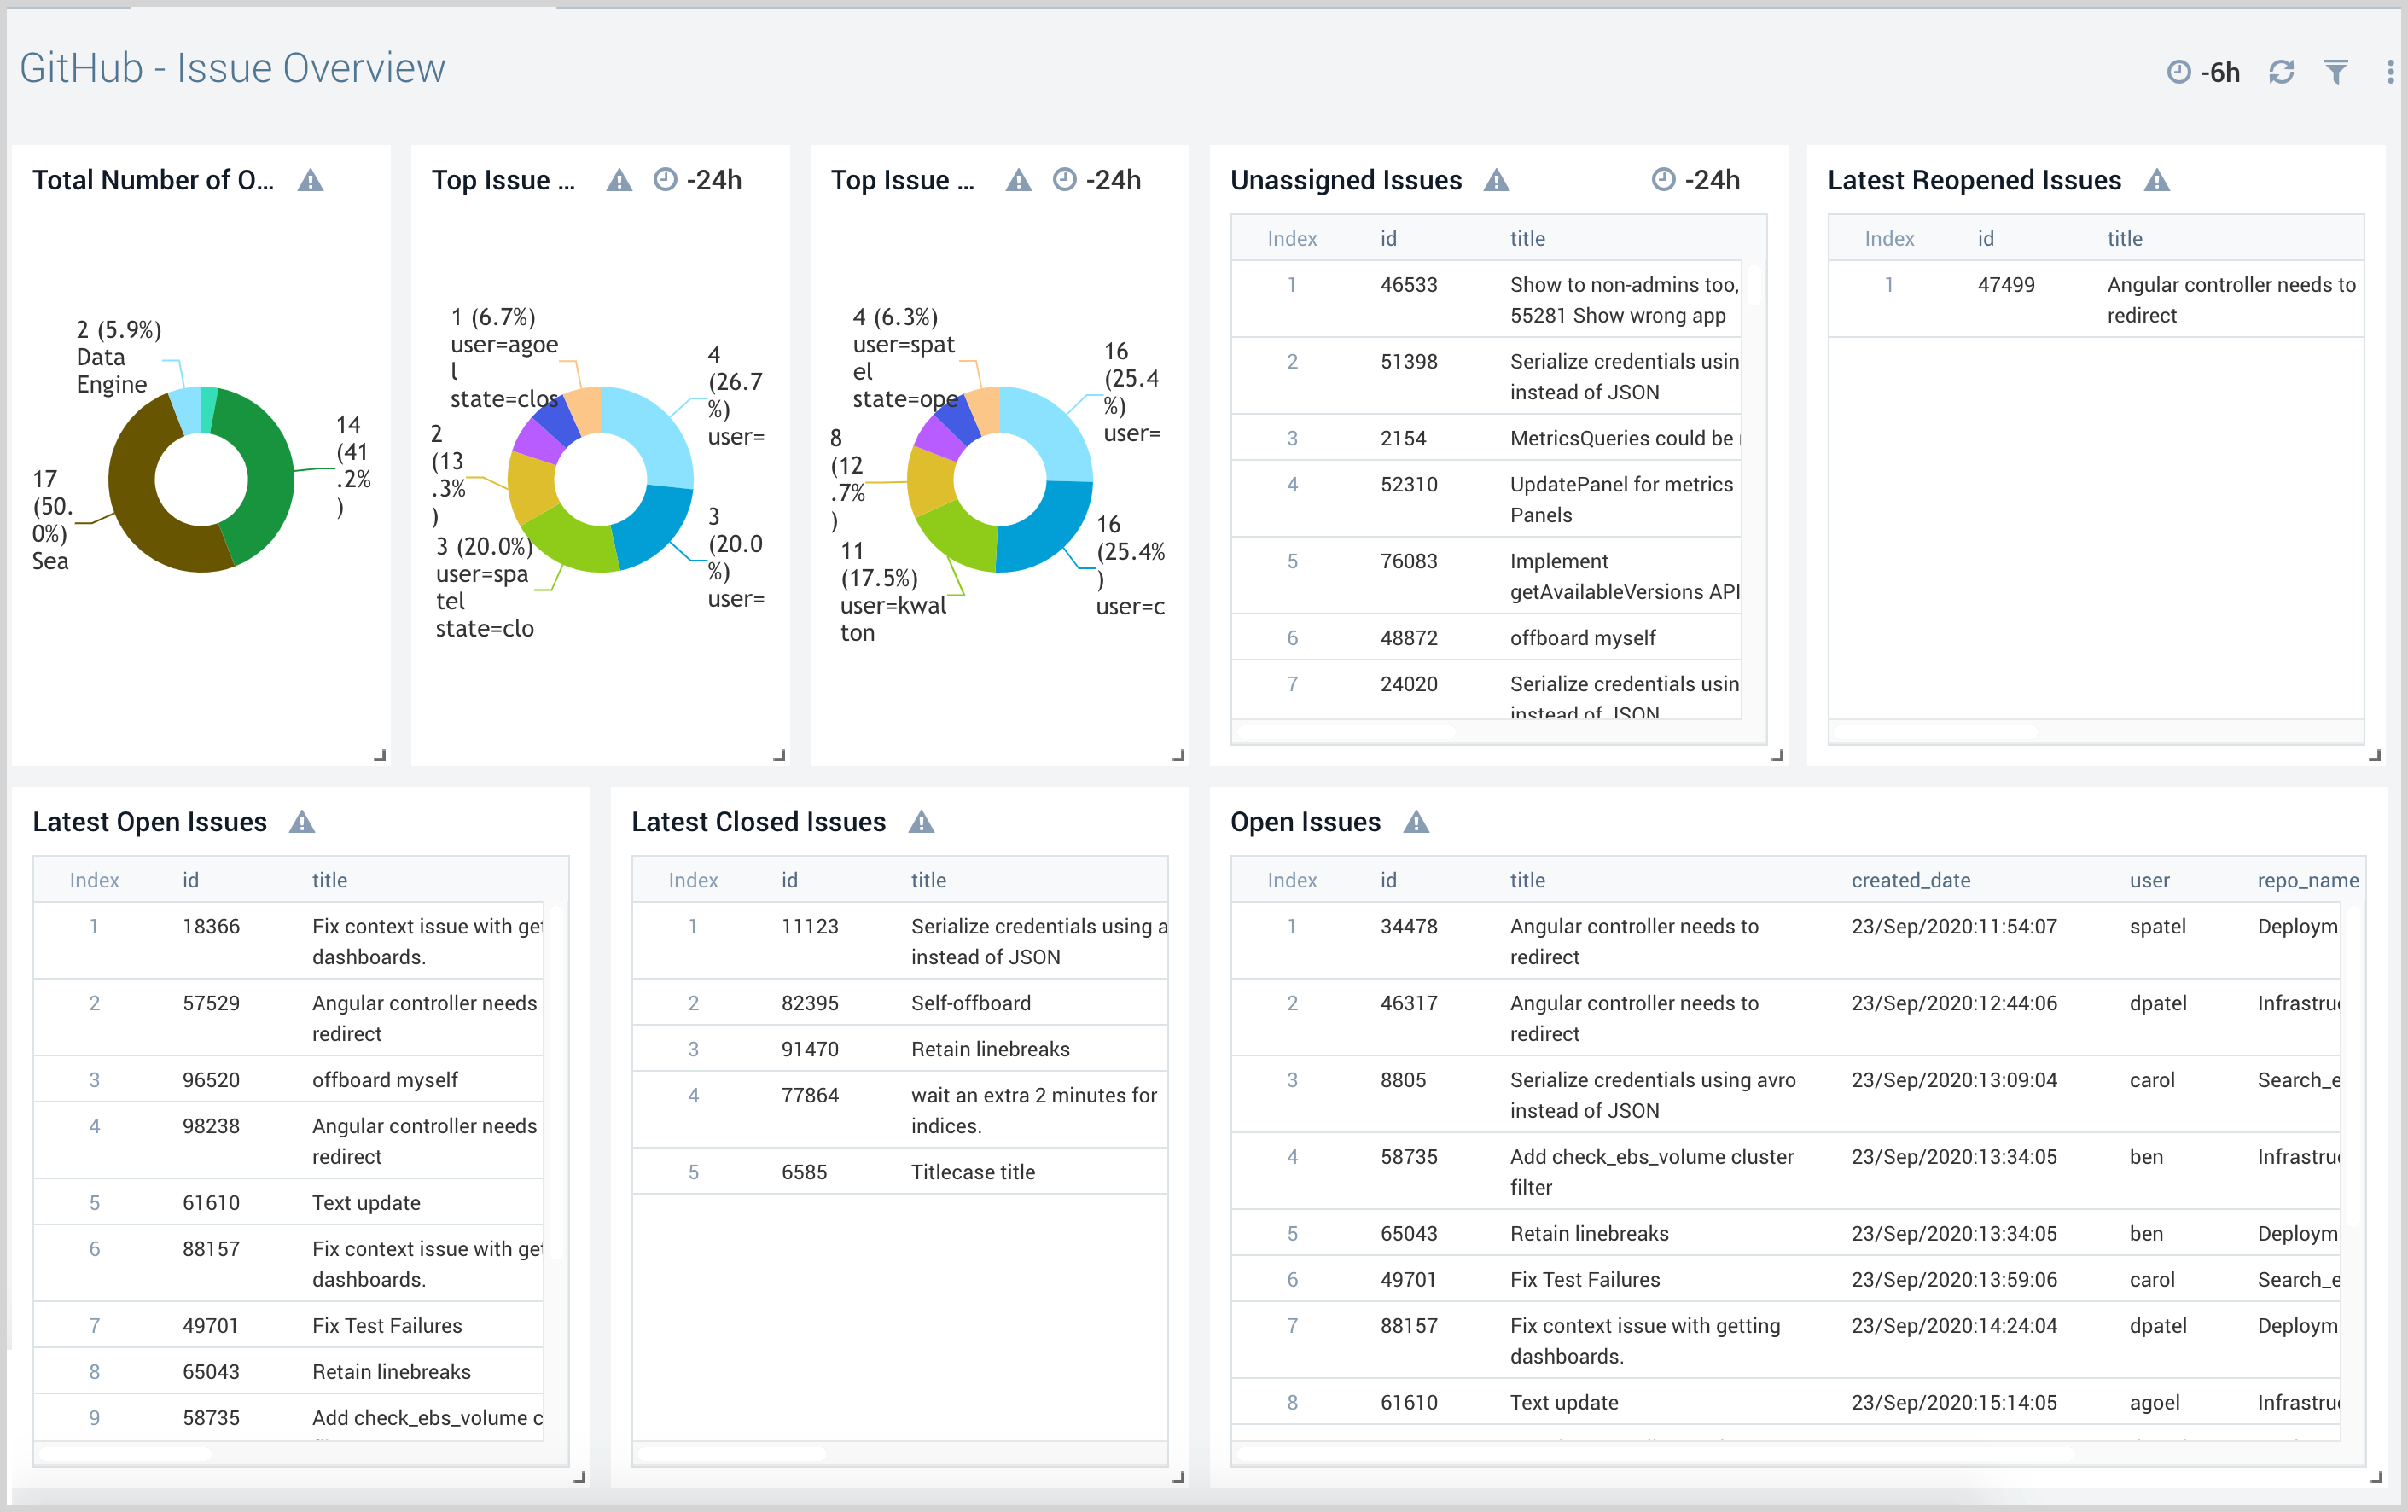
Issue Overview
The GitHub - Issue Overview dashboard provides detailed information about the issues opened, closed, and unassigned issues.
Use this dashboard to:
- Review issue status including unassigned, open, and closed issues.
- Quickly review the issue details and take action accordingly.
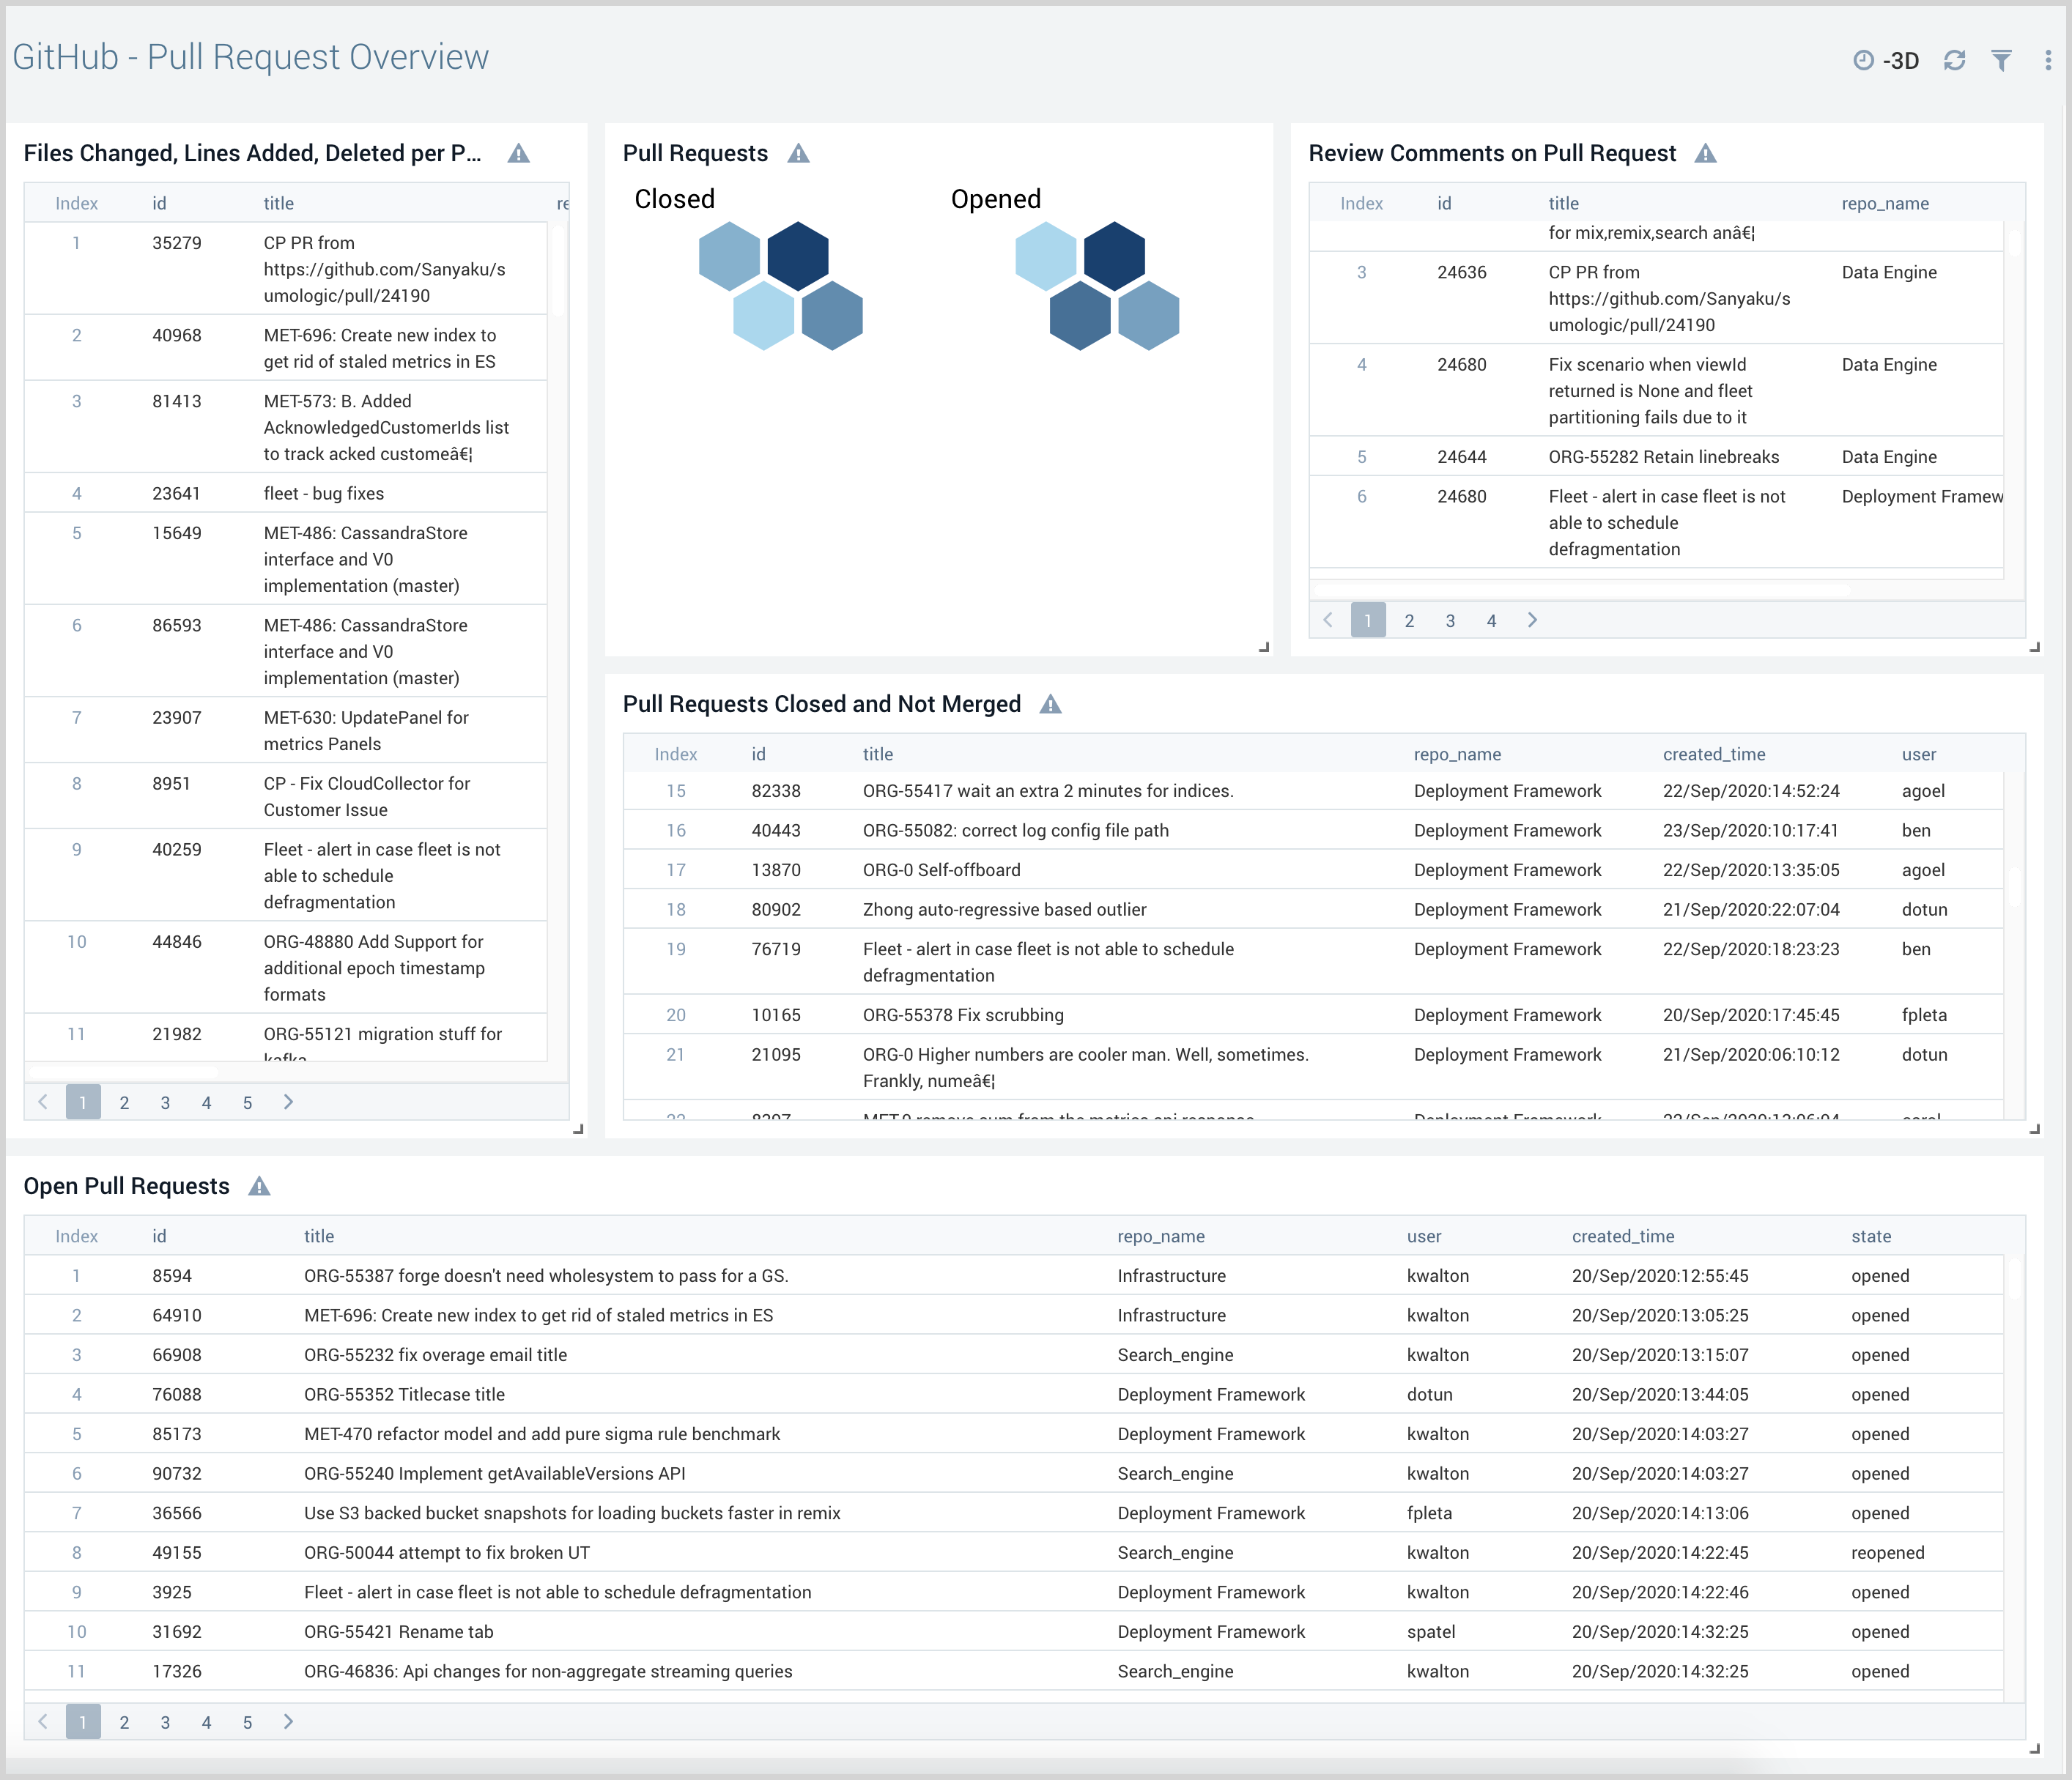
Pull Request Overview
The GitHub - Pull Request Overview dashboard gives the view of pull requests by the target branch. It also provides a detailed view of the pull requests in comparison to created, merged, and declined.
Use this dashboard to:
- View and review pull requests.
- Review comments on pull requests.
- Identify open and not merged critical pull requests.
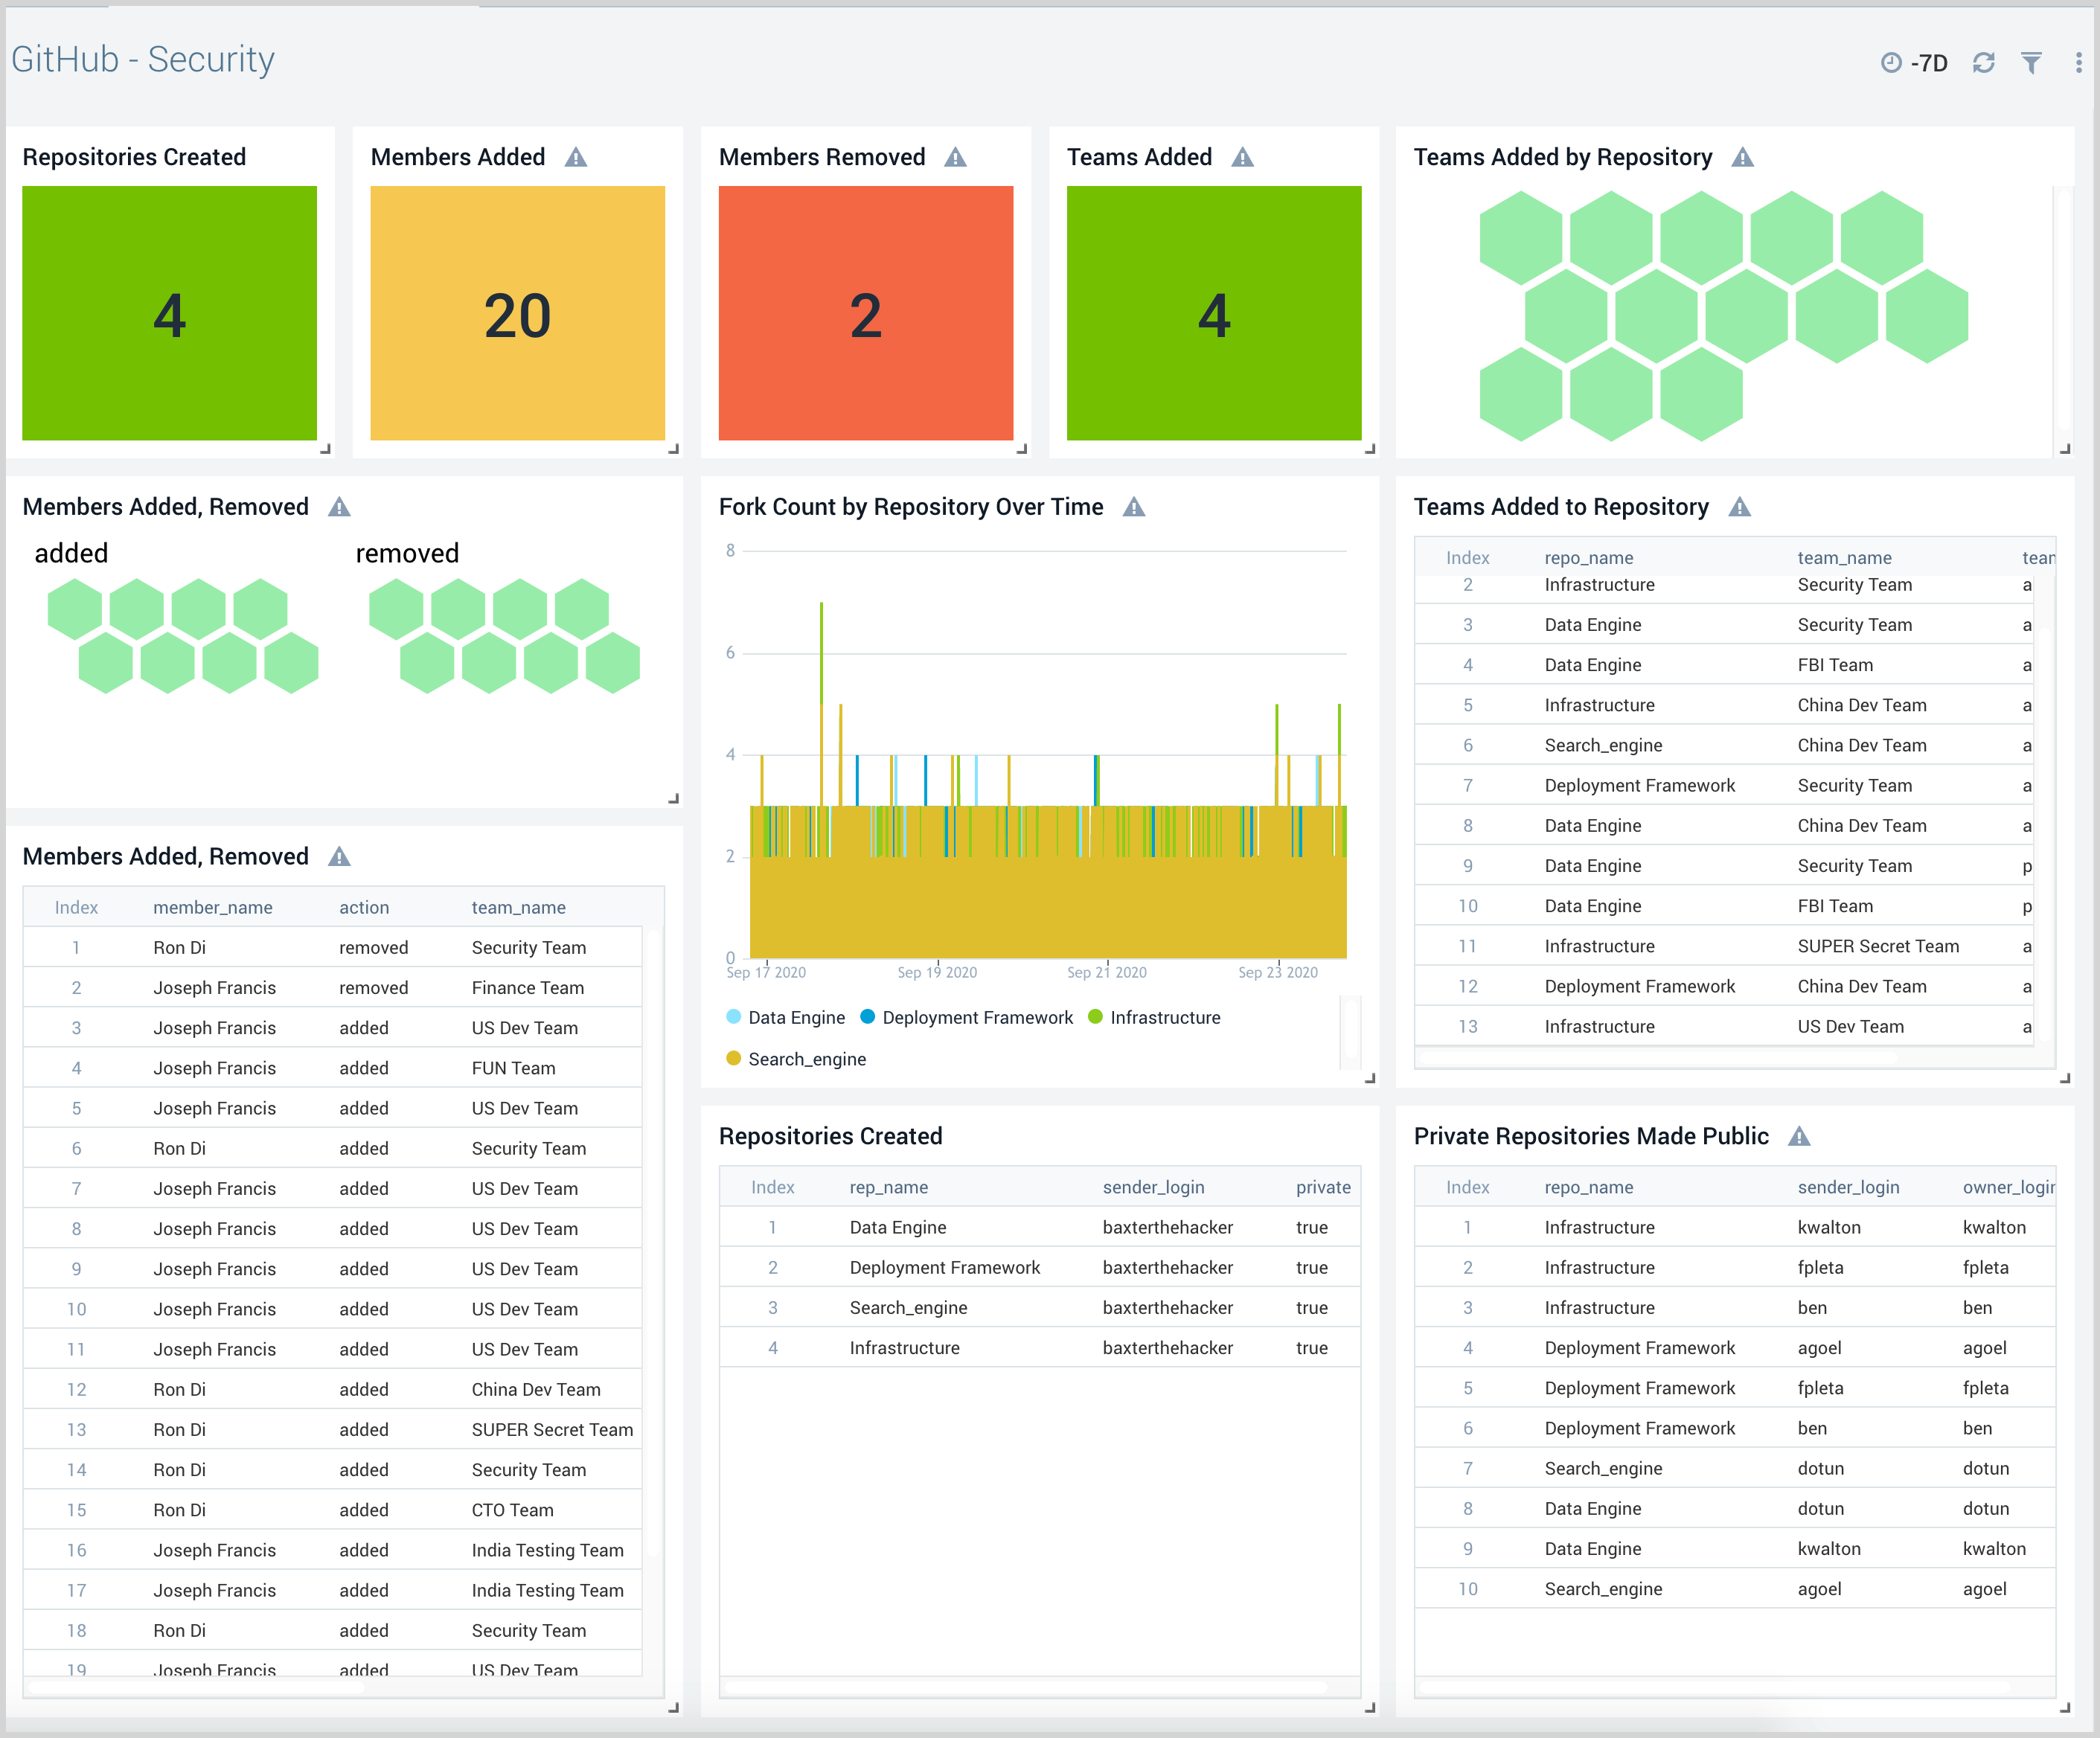
Security
The GitHub - Security dashboard provides detailed information on the security events and repositories.
Use this dashboard to:
- Manage users.
- Review and manage repositories.
- View and manage teams.
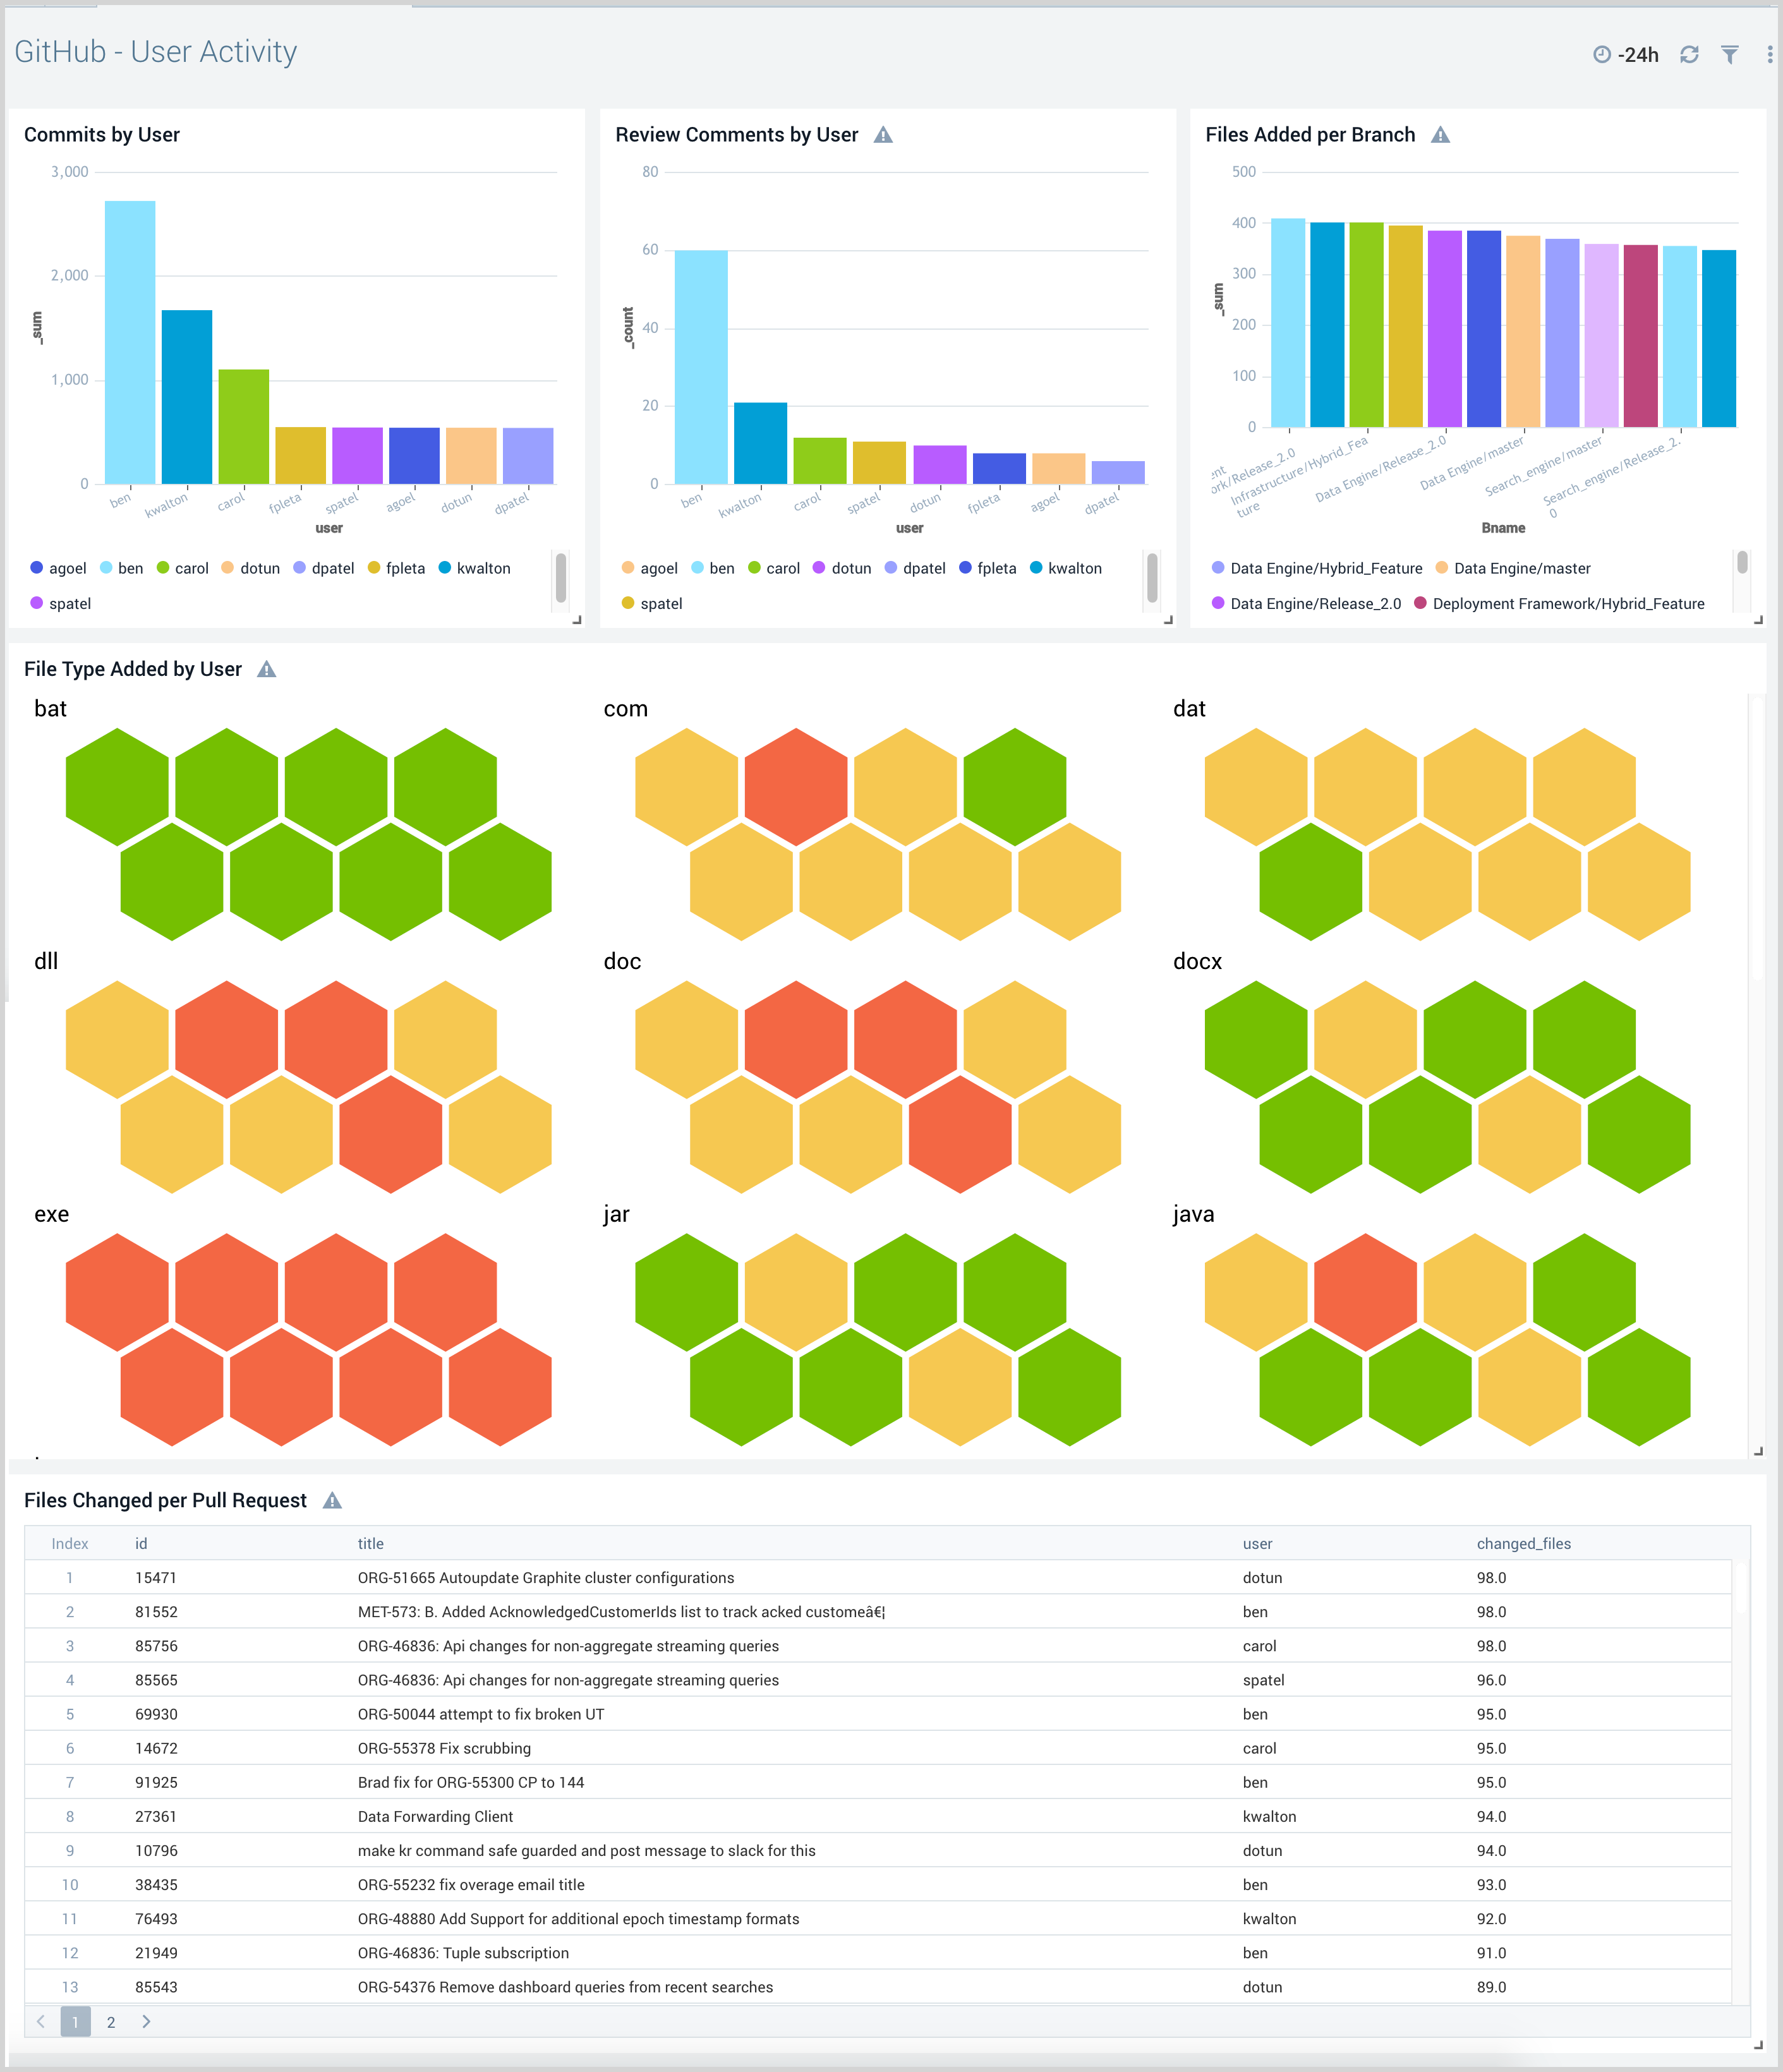
User Activity
The GitHub - User Activity dashboard provides detailed insight into all user activity and potential suspicious activities.
Use this dashboard to:
- Review and manage user activity.
- Determine files added, removed, and modified by users.
- Identify any harmful file types added by users.
GHAS - Advanced Security Overview
The GHAS - Advanced Security Overview dashboard provides an overview of GHAS metrics across Dependabot, secret scanning, and code scanning alerts.
Use this dashboard to:
- Monitor open alerts
- Monitor alerts by severity
- Review recently closed alerts

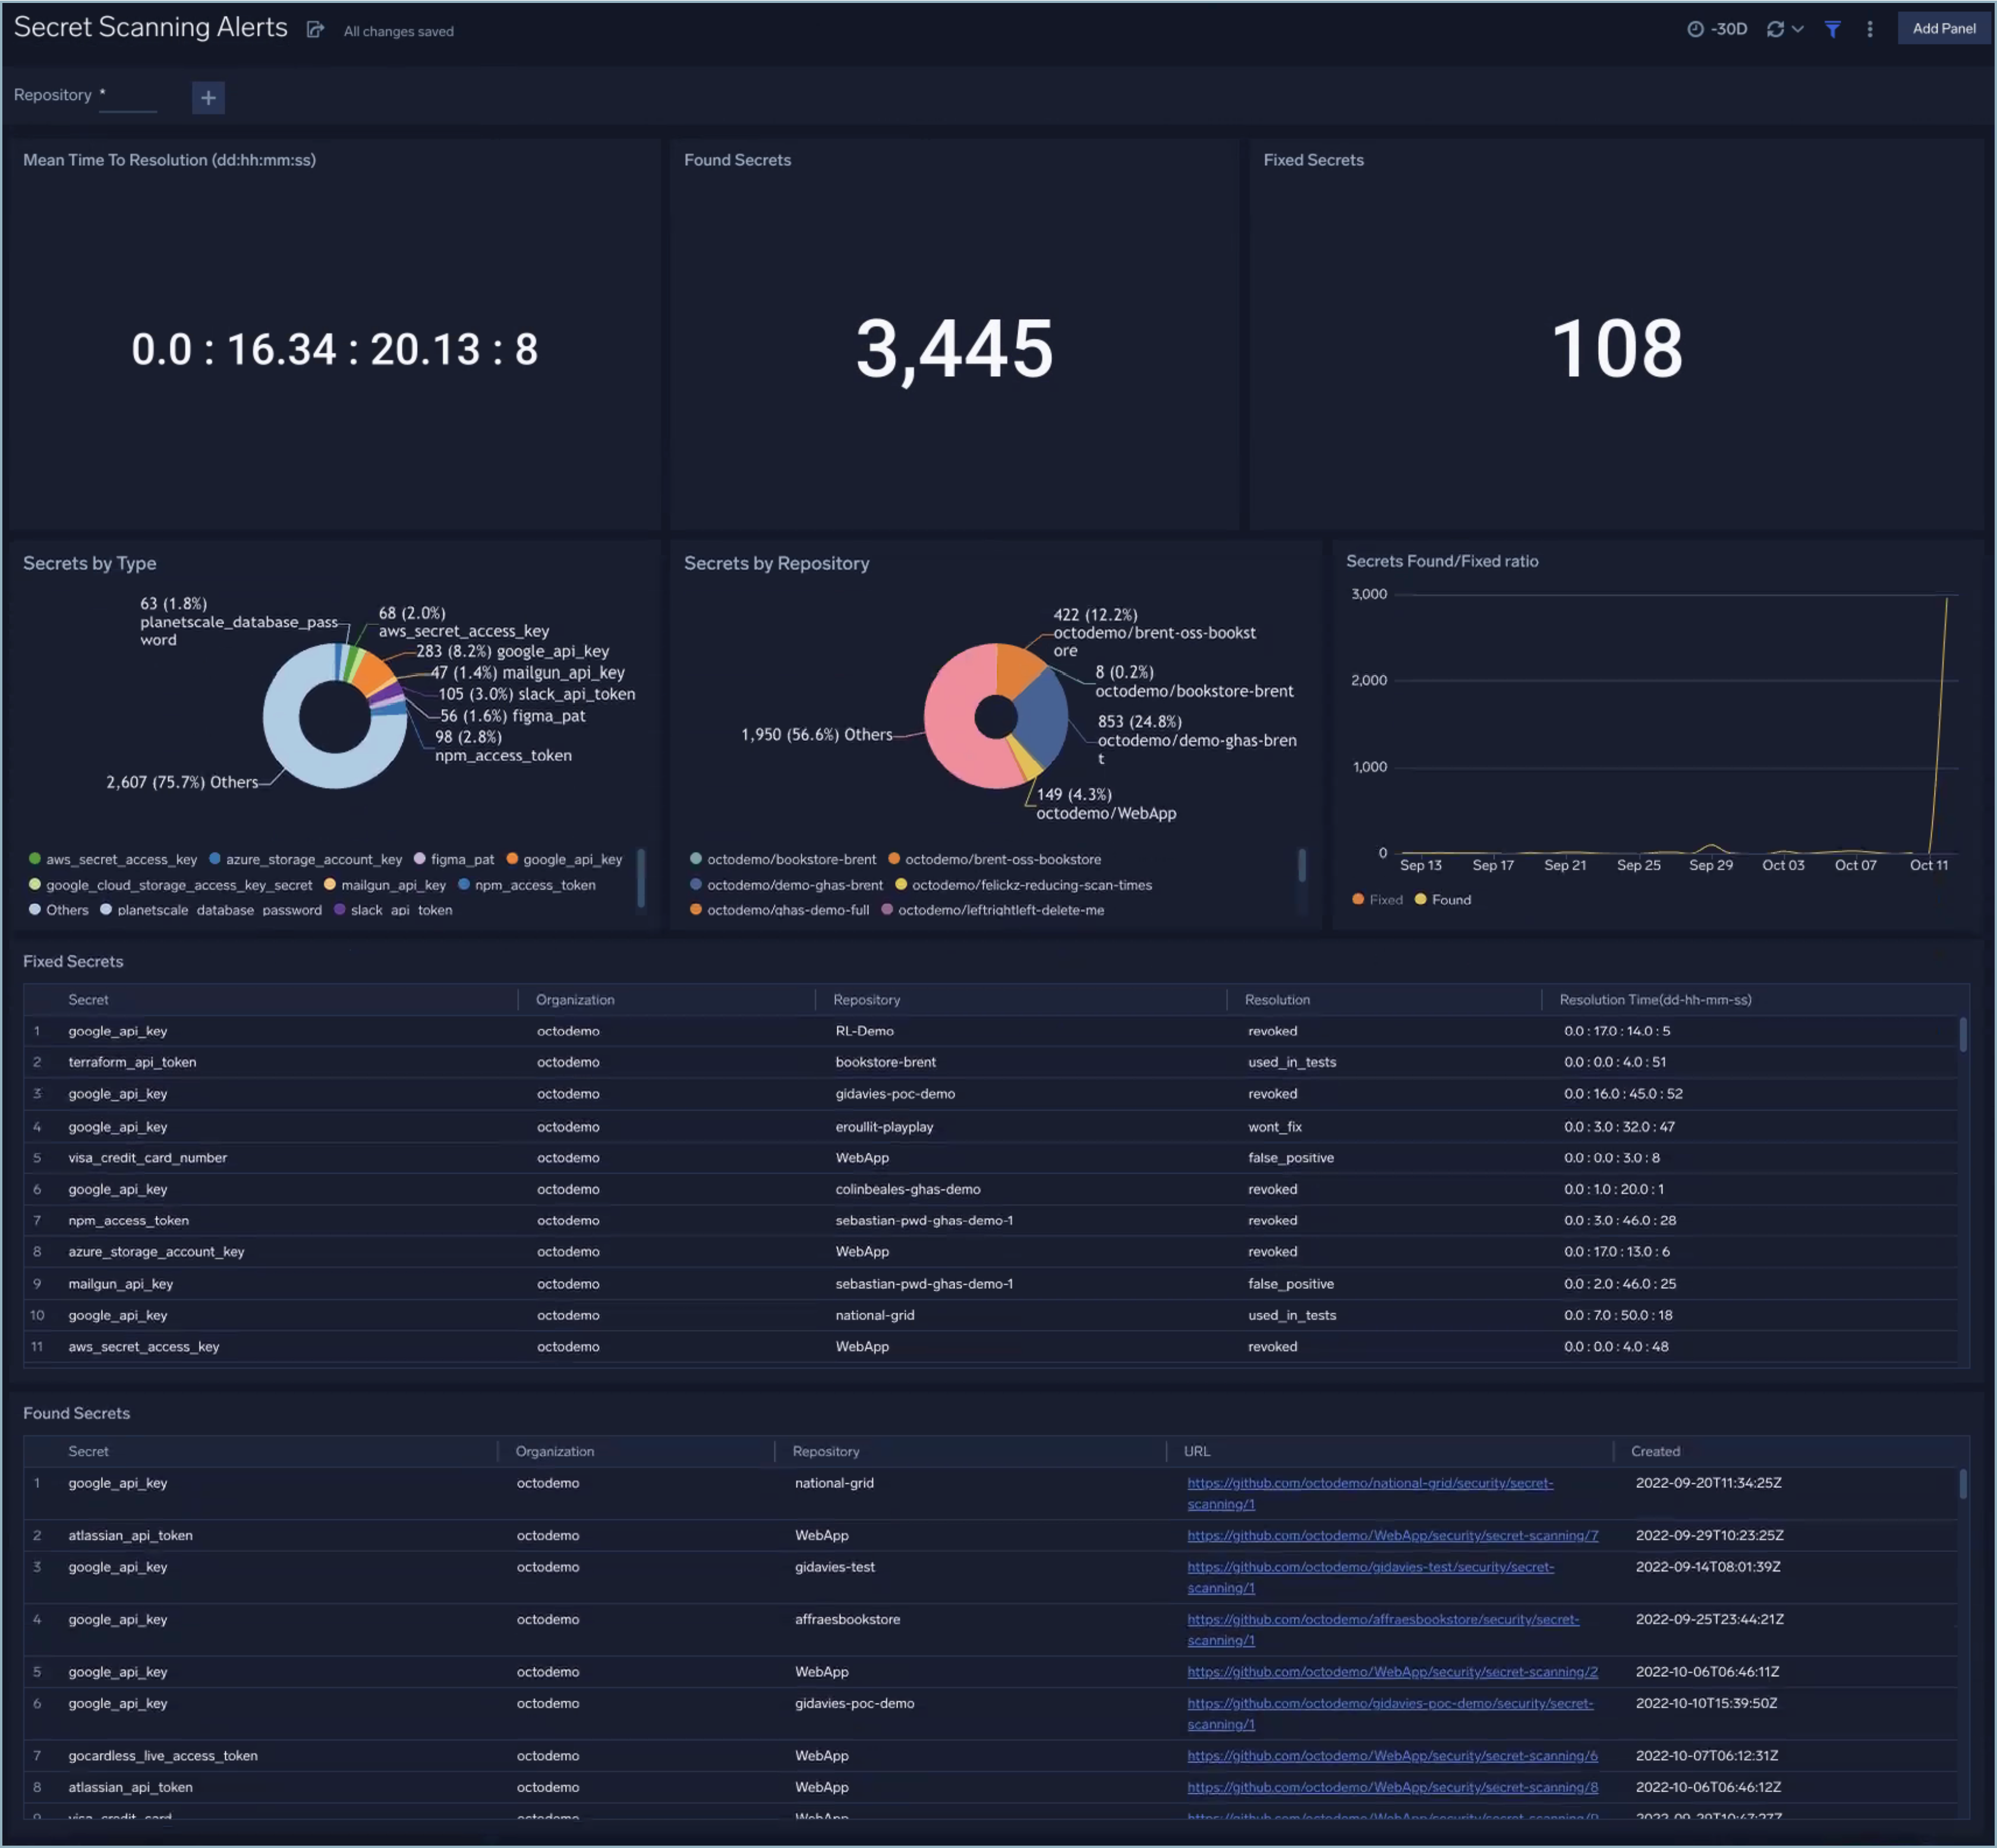
GHAS - Secret Scanning Alerts
Use this dashboard to:
- Monitor MTTR
- Quantify secrets found and fixed
- Check secrets by type and repository
- Compare secrets and found to secrets in fixed ratios
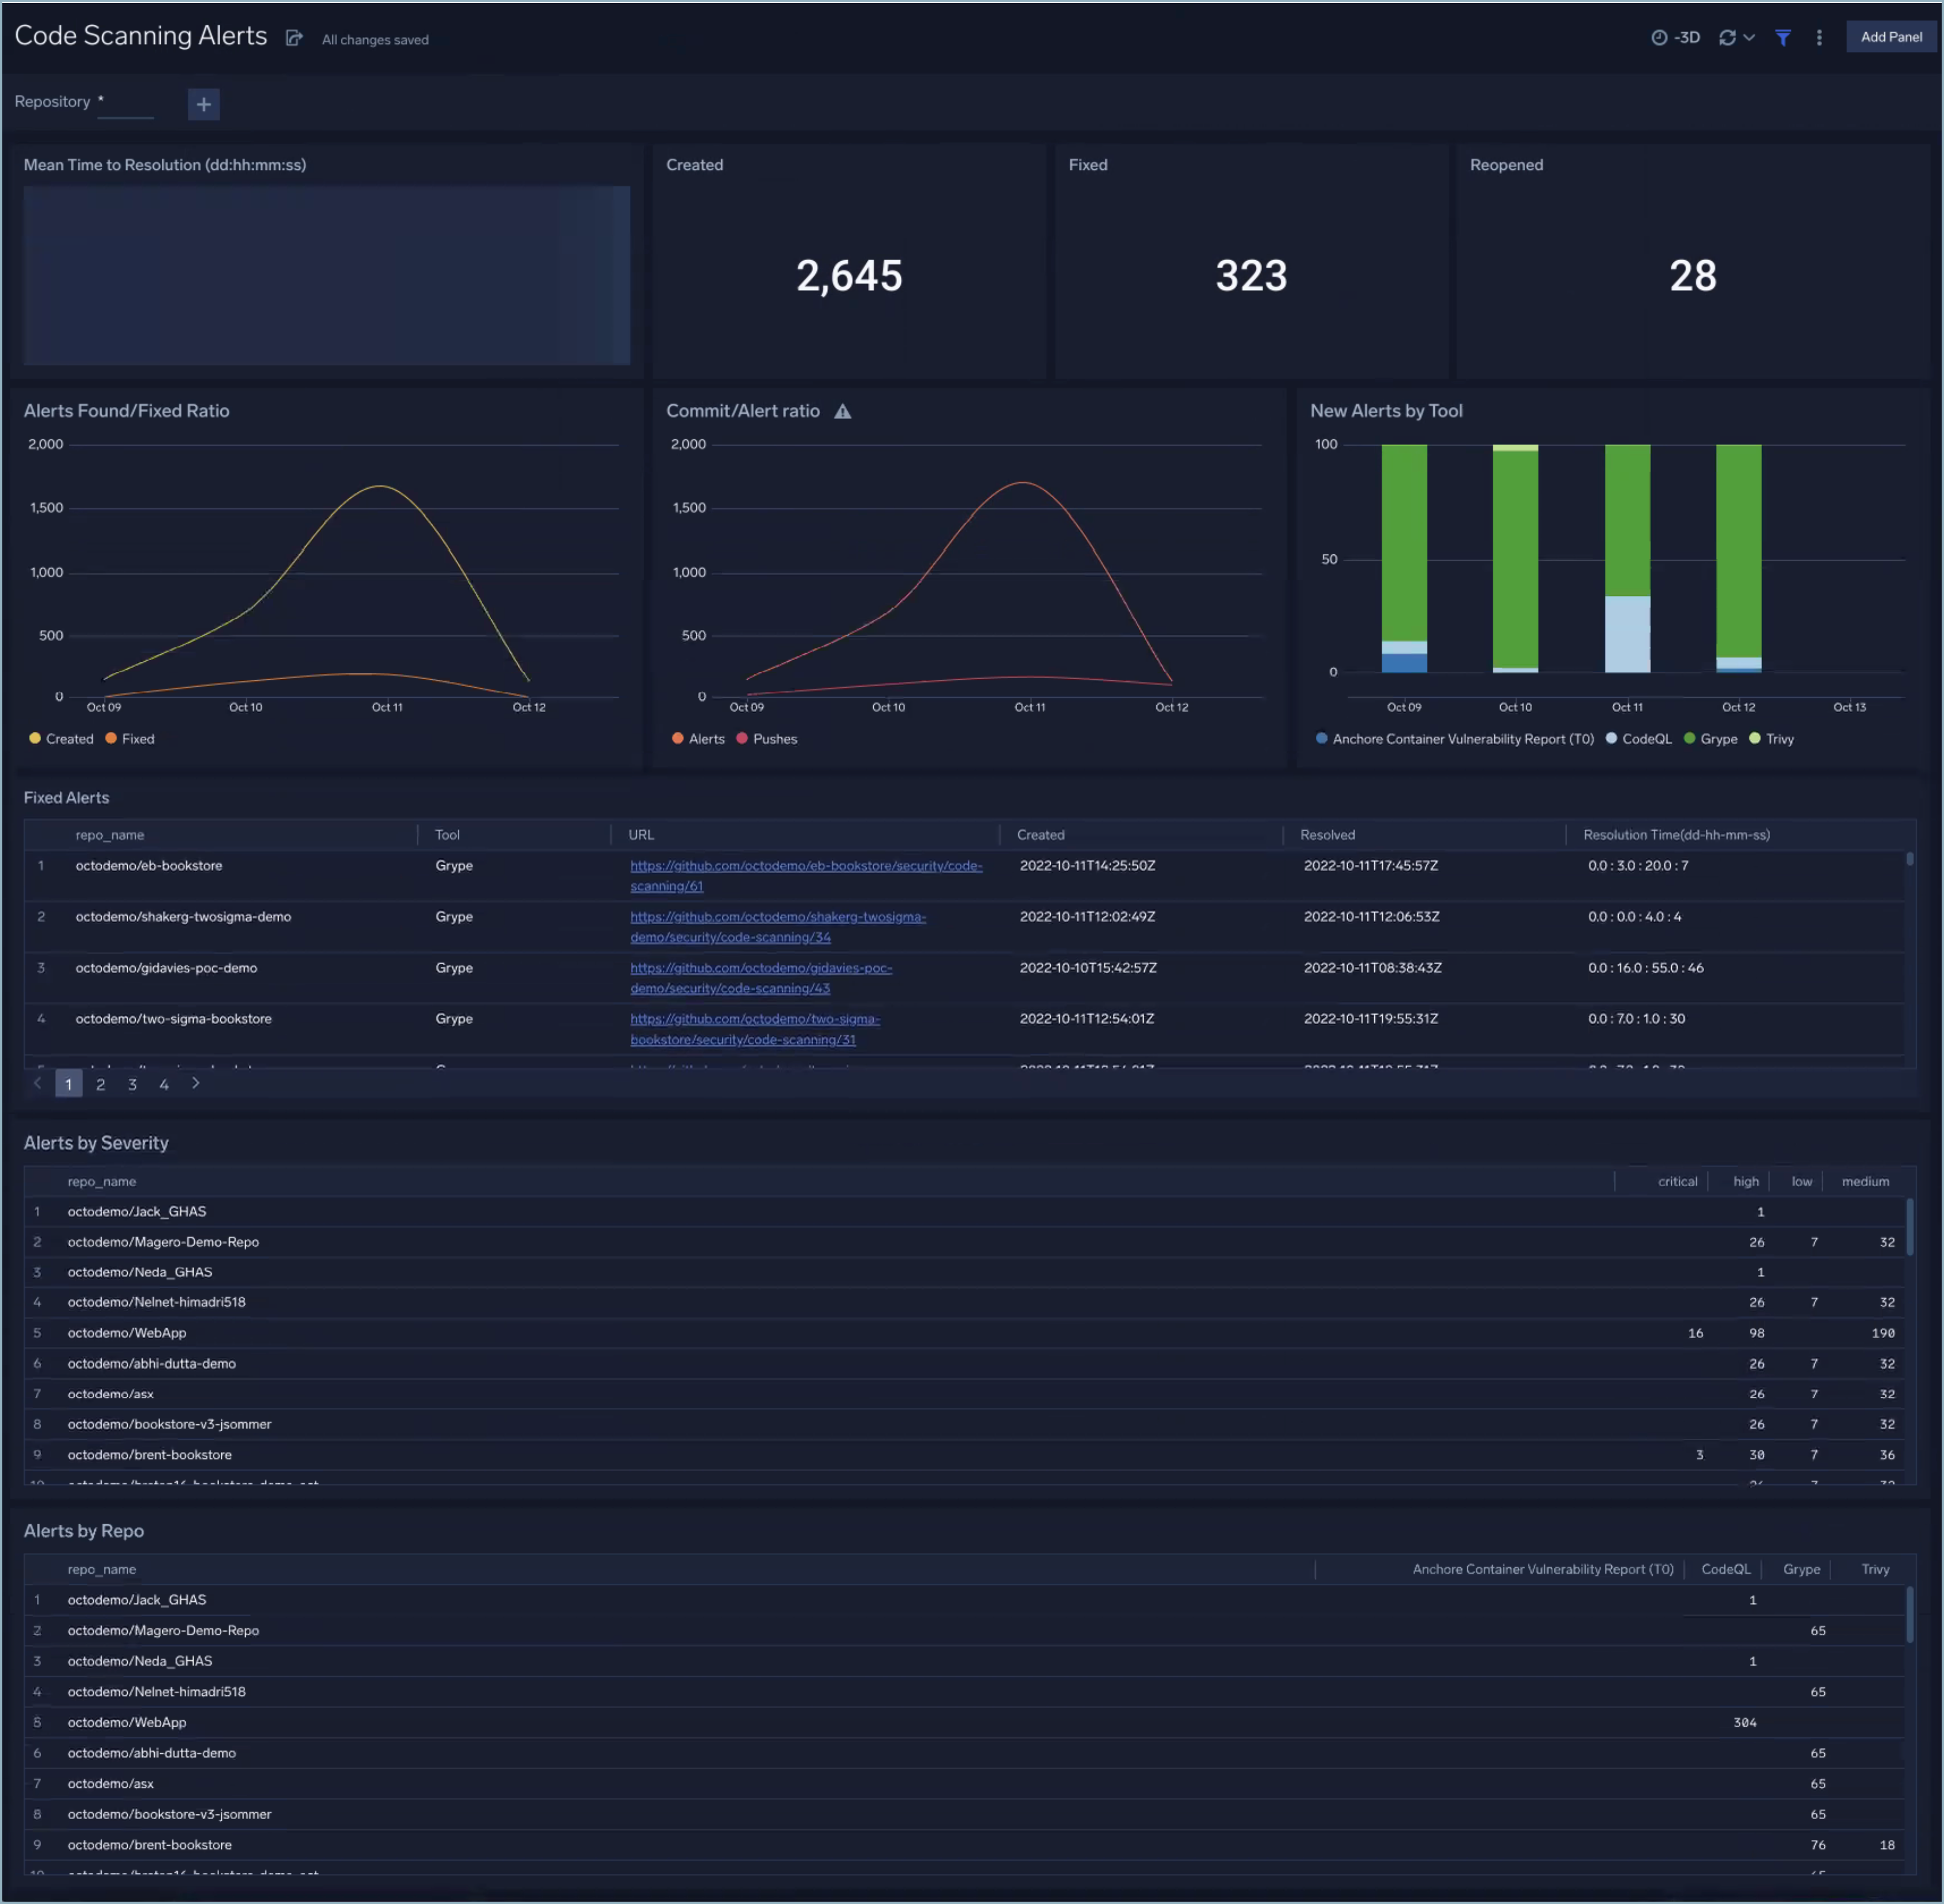
GHAS - Code Scanning Alerts
The GHAS - Code Scanning Alerts dashboard provides a granular overview of the code scanning alerts.
Use this dashboard to display:
- Mean Time to Resolution (average aggregate resolution time)
- Alerts created, fixed, and reopened
- Alerts found/fixed ratio
- Commit/alert ratio
- Alerts by tool, severity, or repo
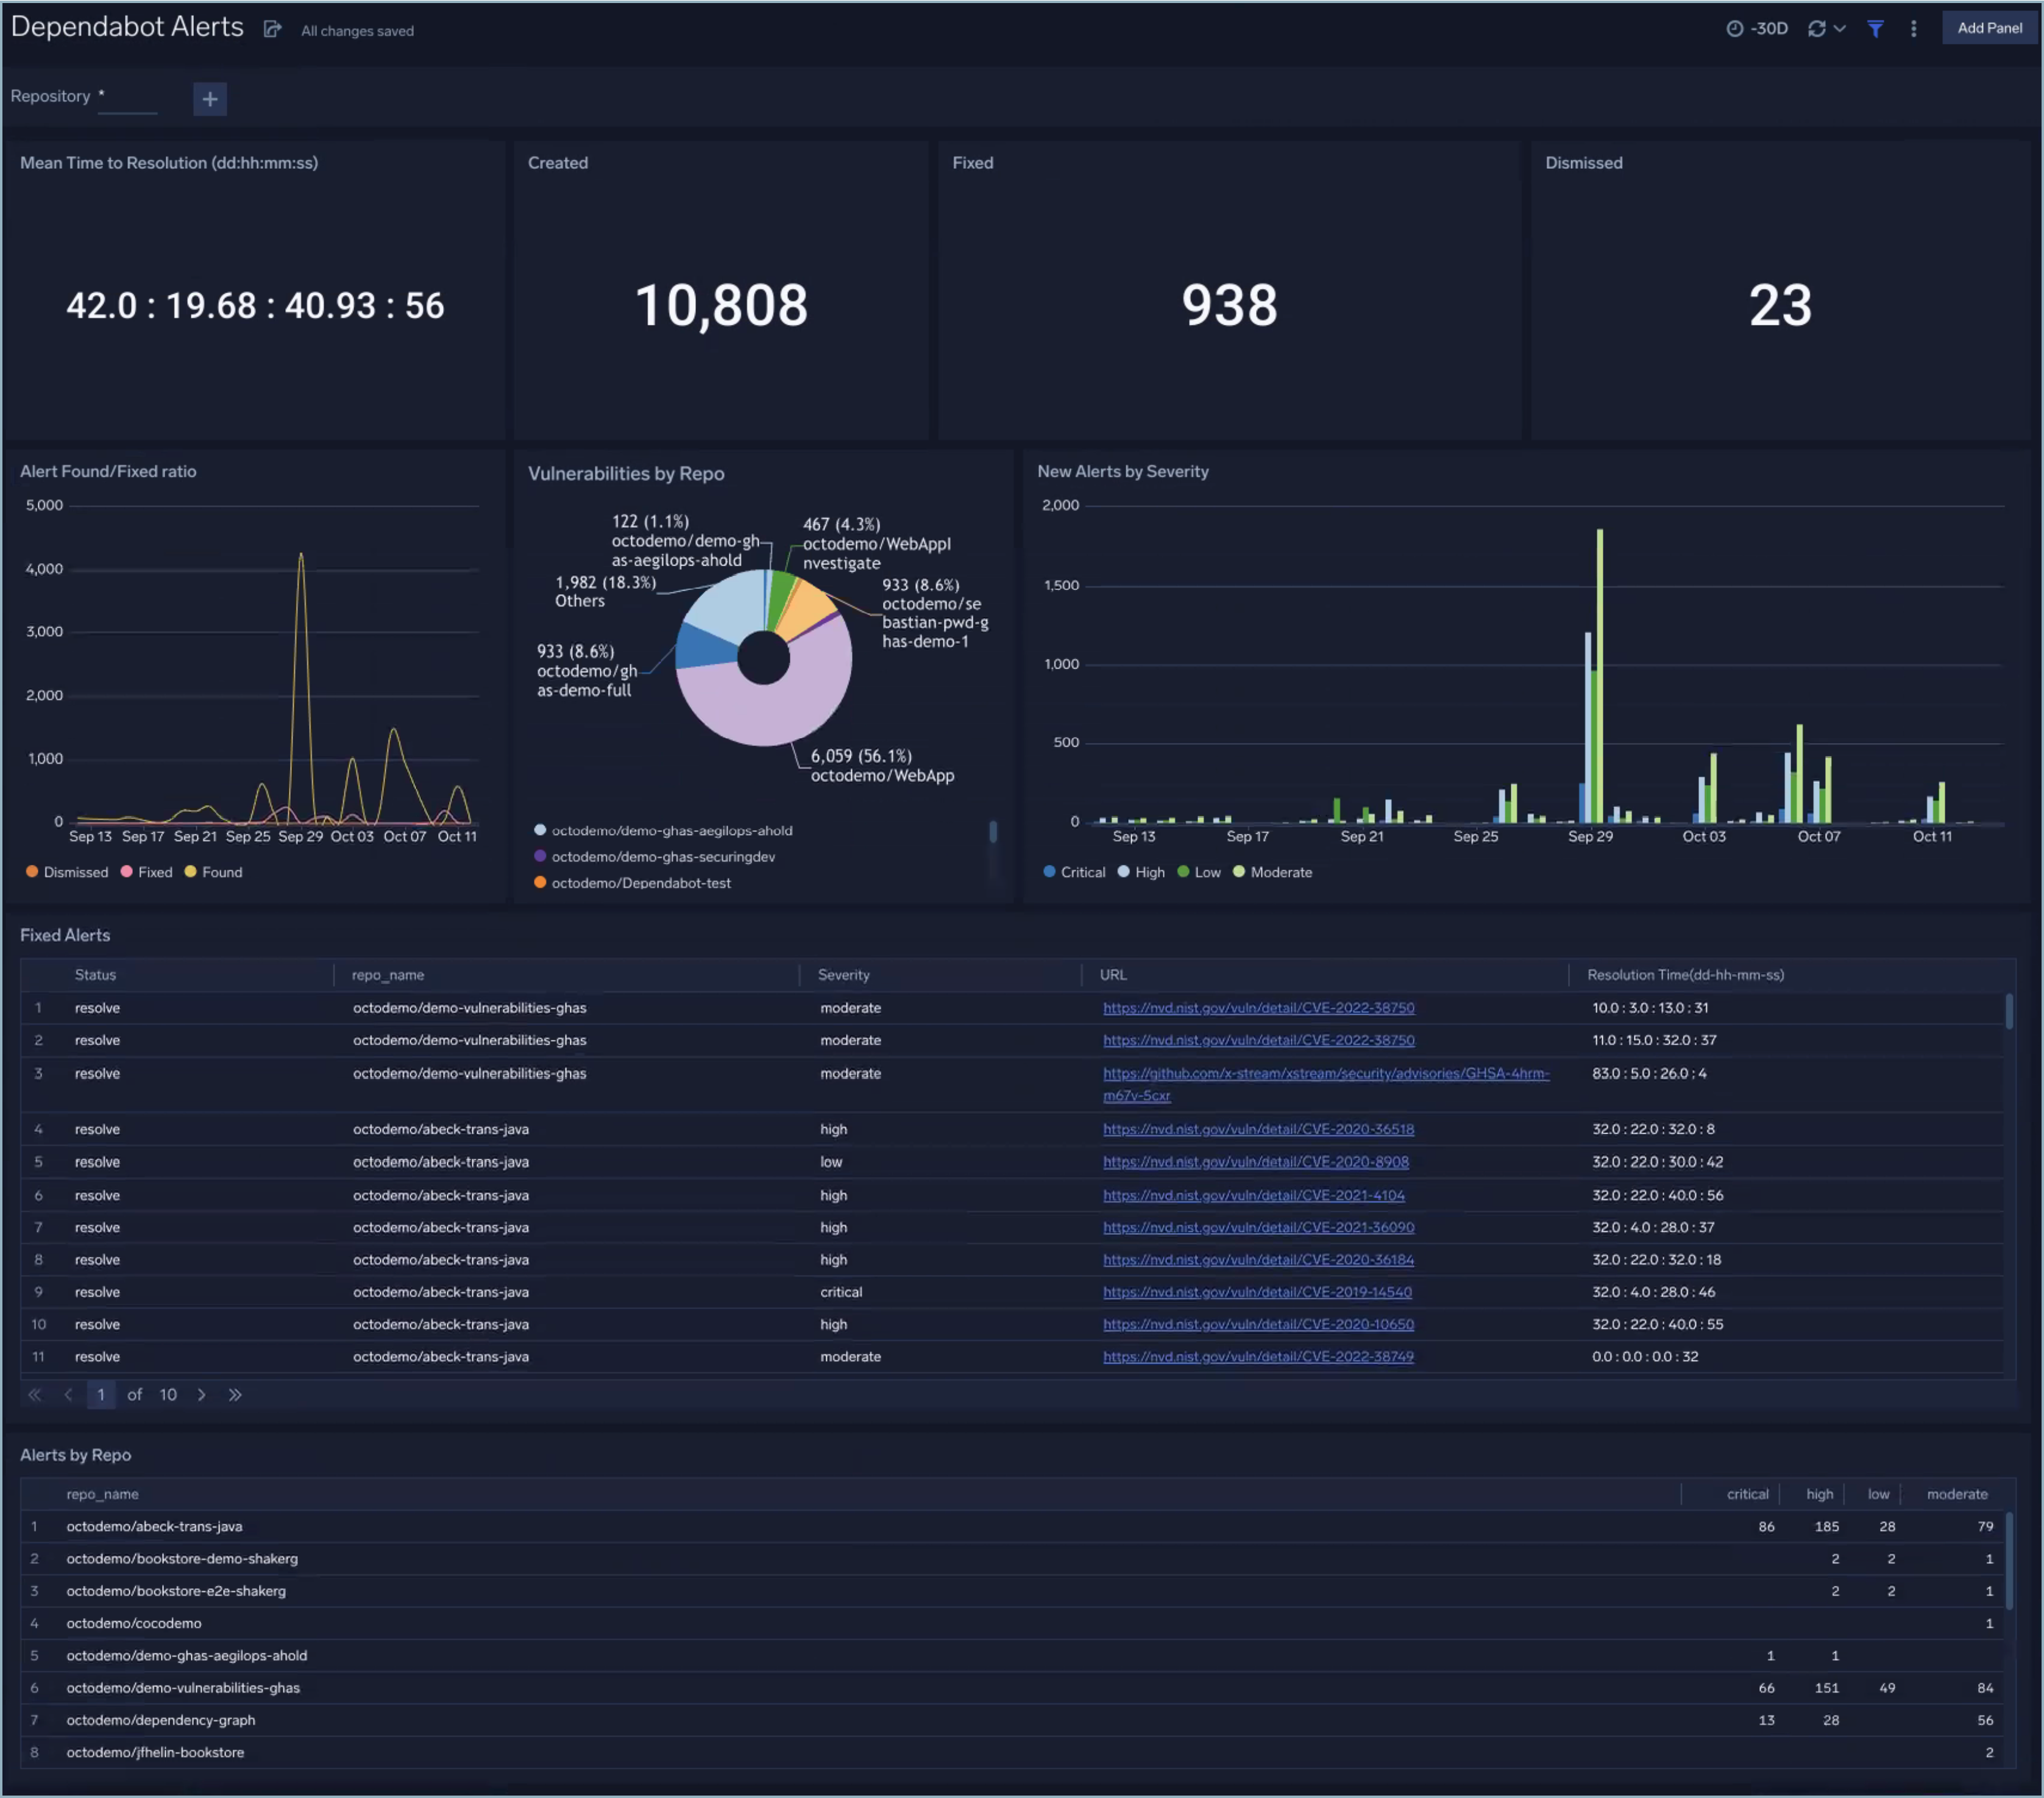
GHAS - Dependabot Alerts
The GHAS - Code Scanning Alerts dashboard provides a granular overview of the Dependabot alerts
Use this dashboard to display:
- Mean Time to Resolution (average aggregate resolution time)
- Alerts created, fixed, and dismissed
- Alerts found/fixed ratio
- Vulnerabilities by repo
- New alerts by repo