Jenkins

Jenkins is an open source automation server that provides a simple way to set up a continuous integration or delivery environment for building and testing software. The Sumo Logic App for Jenkins helps you monitor your build processes and Jenkins master and server health via pre-configured dashboards.
The Jenkins App allows you to monitor multiple Jenkins master nodes from a single-pane of glass. The app supports freestyle and pipeline jobs as well as pipeline, maven and multi-branch pipeline projects.
Sumo Logic Jenkins plugin is compatible with Jenkins version 2.361.1. For more information refer Sumo Logic Jenkins Plugin WIKI page.
Log and metric types
All logs are JSON based, with the exception of job console logs. Graphite format metrics are generated.
The Jenkins app uses the following log types:
- Audit Logs. Log events related to user authentication, Jenkins system and job configuration changes and Jenkins job run events.
- Metric Data. Log events related to metric information of Jenkins Master.
- Periodic Logs. Log events related to Jenkins nodes, master shutdown events, jobs in progress and in queue.
- SCM Log. Log events related to Source Control Management systems like the github repository.
- Job Status Logs. Log events related to Jenkins jobs, test results and pipeline stages.
- Job Console Logs. Log events related to job console logs.
Sample log messages
Click to expand. See sample log messages for log types, such as Authentication, Configuration Change, Shutdown, and Job Status.
{
  "userName": "Sourabh Jain",
  "auditEventType": "User_Login",
  "userId": "sourabh",
  "message": "sourabh Logged in.",
  "logType": "Audit_Event",
  "eventTime": "2019-06-06 05:55:38,609 +00:00"
}
{
  "userName": "demoexample@sumologic.com",
  "auditEventType": "Config_Change",
  "userId": "demoexample@sumologic.com",
  "message": "demoexample@sumologic.com changed configuration for the file jobs/demoexample-gradle-dep-check/config.xml.",
  "fileDetails": {
    "Old_File_Data": "PD94bWwgdmVyc2lvbj0nMS4xJyBlbmNvZGluZz0nVVRGLTgnPz4KPGZsb3ctZGVmaW5pdGlvbiBwbHVnaW49IndvcmtmbG93LWpvYkAyLjMyIj4KICA8YWN0aW9ucz4KICAgIDxvcmcuamVua2luc2NpLnBsdWdpbnMucGlwZWxpbmUubW9kZWxkZWZpbml0aW9uLmFjdGlvbnMuRGVjbGFyYXRpdmVKb2DwvYXV0aFRva2VuPgogIDxkaXNhYmxlZD5mYWxzZTwvZGlzYWJsZWQ+demoexamplefile==",
    "Current_File_Data": "PD94bWwgdmVyc2lvbj0nMS4xJyBlbmNvZGluZz0nVVRGLTgnPz4KPGZsb3ctZGVmaW5pdGlvbiBwbHVnaW49IndvcmtmbG93LWpvYkAyLjMyIj4KICA8YWN0aW9ucz4KICAgIDxvcmcuamVua2luc2NpLnBsdWdpbnMucGlwZWxpbmUubW9kZWxkZWZpbml0aW9uLmFjdGlvbnMuRGVjbGFyYXRpdnZ2Vycy8+CiAgPGF1dGhUb2tlbj5zd29yZGZpc2g8L2F1dGhUb2tlbj4KICA8ZGlzYWJsZWQ+ZmFsc2U8L2Rpc2FibGVkdemoexamplefile="
  },
  "logType": "Audit_Event",
  "eventTime": "2019-06-05 15:17:28,237 +00:00"
}
{
  "logType": "Slave_Event",
  "eventTime": "2019-06-05 11:00:12,256 +00:00",
  "eventSource": "Shutdown"
}
{
  "threadId": 33675,
  "logType": "Jenkins_Log",
  "logLevel": "INFO",
  "logMessage": "Finished Sumo Logic Periodic Data Publisher. 102 ms",
  "logSource": "com.sumologic.jenkins.jenkinssumologicplugin.sender.SumoPeriodicPublisher",
  "eventTime": "2019-06-06 07:08:06,908 +00:00"
}
{
  "numberOfSlaves": 0,
  "numberOfExecutors": 4,
  "numberOfFreeExecutors": 2,
  "nodeName": "build-jenkins-executor (i-07e3500c4cda1f30b)",
  "nodeLabel": "gradle docker",
  "nodeStatus": "updated",
  "isIdle": false,
  "isOnline": true,
  "isRemoved": false,
  "isConnecting": false,
  "nodeURL": "https://localhost:8080/computer/build...00c4cda1f30b)/",
  "eventSource": "Periodic_Update",
  "monitorData": {
    "SwapSpaceMonitor": "Memory:48519/63624MB  Swap:0/0MB",
    "ClockMonitor": "In sync",
    "DiskSpaceMonitor": "85.71 GB",
    "ResponseTimeMonitor": "13ms",
    "ArchitectureMonitor": "Linux (amd64)",
    "TemporarySpaceMonitor": "85.71 GB"

  },
  "logType": "Slave_Event",
  "eventTime": "2019-06-06 07:05:06,702 +00:00"
}
{
  "numItemsInQueue": 0,
  "numBlockedItemsInQueue": 0,
  "maxWaitingTime": 0,
  "averageWaitingTime": 0,
  "queueId": 3060904,
  "queueTime": 56.093,
  "isBlocked": true,
  "reasonForBlock": "All nodes of label ‘docker’ are offline",
  "isConcurrentBuild": false,
  "jobName": "part of Module ITs: vault #142",
  "jobURL": "https://localhost:8080/job/module-it-vault/142/",
  "logType": "Queue_Event",
  "eventTime": "2019-06-06 06:50:06,668 +00:00"
}
{
  "name": "TestComplexPipeline",
  "result": "In_Progress",
  "number": 11,
  "start_time": 0,
  "duration": 0,
  "jobStartTime": "2019-06-04 03:39:57,790 +00:00",
  "jobRunDuration": 13.175,
  "jobBuildURL": "http://localhost:8080/job/TestComplexPipeline/11/",
  "label": "Master",
  "nodeName": "master"
}
{
  "buildNumber": 3,
  "jobName": "master",
  "scmType": "hudson.plugins.git.GitSCM",
  "scmURLs": "git https://github.com/SumoSourabh/build...ne-project.git",
  "revision": "7bb6c1d7b1e3d7d65a39bade4f2ad68196322b2c",
  "branches": "master ",
  "changeLog": [
    "1559619601000 commit:aa058c84927345885838c17bb7db448910885c6b author:Sourabh Jain message:commit",
    "1559621063000 commit:7bb6c1d7b1e3d7d65a39bade4f2ad68196322b2c author:Sourabh Jain message:commit"
  ],
  "logType": "Scm_Status",
  "eventTime": "2019-06-04 04:05:15,723 +00:00"
}
{
  "name": "MyTest",
  "hudsonVersion": "2.174",
  "result": "UNSTABLE",
  "description": "This is a testPlease . alsncns",
  "number": 35,
  "start_time": 1560239332099,
  "duration": 17401,
  "logType": "Job_Status",
  "user": "sourabh",
  "jobStartTime": "2019-06-11 07:48:52,096 +00:00",
  "jobType": "Maven project",
  "jobRunDuration": 17.401,
  "jobBuildURL": "http://ec2-13-234-181-219.ap-south-1...job/MyTest/35/",
  "upstreamJobURL": "",
  "triggerCauses": "Started by user Sourabh Jain",
  "label": "Master",
  "nodeName": "master",
  "jobMetaData": {
    "NODES": "1,2,3",
    "ENV": "qa",
    "APPS": "app01,app02"
  },
  "testResult": {
    "failures": 24,
    "passes": 238,
    "skips": 59,
    "total": 321,
    "totalDuration": 0.10700000333599746
  }
}
[2019-06-04 09:02:37,386 +00:00] channel stopped
{
  "logType": "Test_Result",
  "number": 35,
  "name": "MyTest",
  "testResult": [
    {
      "className": "TwentyTwoTest",
      "testName": "test4",
      "errorStackTrace": "java.lang.AssertionError: oops\n\tat org.junit.Assert.fail(Assert.java:88)\n\tat Base.BaseTestClassMethod(Base.java:14)\n\tat TwentyTwoTest.test4(TwentyTwoTest.java:21)\n",
      "errorDetails": "oops",
      "status": "Failed",
      "duration": 0
    },
    {
      "className": "TwentyTwoTest",
      "testName": "test5",
      "status": "Passed",
      "duration": 0
    }
  ]
}
{
  "logType": "Pipeline_Stages",
  "number": 23,
  "name": "TestComplexPipeline",
  "stages": [
    {
      "id": 1,
      "stageId": "10",
      "name": "parallel stage",
      "status": "SUCCESS",
      "startTime": "2019-06-11 07:55:50,240 +00:00",
      "duration": 0.174,
      "pauseDuration": 0
    },
    {
      "id": 2,
      "stageId": "14",
      "name": "build",
      "status": "SUCCESS",
      "startTime": "2019-06-11 07:55:50,414 +00:00",
      "duration": 0.056,
      "pauseDuration": 0,
      "steps": [
        "StepName - Print Message,StepStatus - SUCCESS,StepDuration - 0.005,StepArguments - Building the app [app01] on node [1],StepExecutedOn - (master)"
      ]
    },
    {
      "id": 3,
      "stageId": "19",
      "name": "deploy",
      "status": "SUCCESS",
      "startTime": "2019-06-11 07:55:50,492 +00:00",
      "duration": 0.052,
      "pauseDuration": 0,
      "steps": [
        "StepName - Print Message,StepStatus - SUCCESS,StepDuration - 0.005,StepArguments - Deploying the app app01] on node [1],StepExecutedOn - (master)"
      ]
    }
  ]
}
Sample queries
This sample query is from the Jobs in Progress panel of the Jenkins - Job Overview dashboard.
_sourceCategory=Labs/Jenkins/Sourabh/Logs In_Progress
| json "name", "result", "number" as Job_Name, Result, Job_Number
| where Result = "In_Progress"
| first(_raw) by Job_Name, Job_Number
| json field=_first "jobBuildURL", "label", "nodeName", "jobStartTime", "jobRunDuration" as Job_URL, Job_Label, Node_Name, Job_Start_Time, Job_Run_Duration nodrop
| where ![subquery : _sourceCategory=Labs/Jenkins/Sourabh/Logs Job_Status
| json "name", "number" as Job_Name, Job_Number
| count by Job_Name, Job_Number
| compose Job_Number, Job_Name]
| tourl(Job_URL, Job_Name) as Job_URL
| count by Job_Name, Job_URL, Job_Label, Node_Name, Job_Start_Time, Job_Run_Duration, Job_Number
| fields Job_Name, Job_URL, Job_Label, Node_Name, Job_Start_Time, Job_Run_Duration, Job_Number
Collecting logs and metrics for Jenkins
This section provides instructions for configuring log and metric collection for the Sumo Logic App for Jenkins.
Sumo Logic Jenkins plugin is compatible with Jenkins version 2.60.1 and above. For more information refer Sumo Logic Jenkins Plugin WIKI page.
Step 1: Configure a Collector
To create a new Sumo Logic hosted collector, perform the steps in the Configure a Hosted Collector section of the Sumo Logic documentation.
Step 2: Configure an HTTP Log and Metric Source
To create a new HTTP logs and metric source:
- Create a new HTTP Logs and Metrics Source in the hosted collector created above by following these instructions.
- Make a note of HTTP Source URL and Source Category, as you will need them later in the configuration process.
Step 3: Install the Jenkins Plugin
You must have Admin privileges to perform any of the following installation procedures. This section walks you through the ways in which you can install the Jenkins plugin.
Beginning with Jenkins 2.357 (released on June 28, 2022) and the forthcoming 2.361.1 LTS release, Jenkins requires Java 11 or newer. The latest Sumo Logic Jenkins plugin works with Jenkins versions greater than 2.261.1 and Java 11. To install the plugin with Java 8 and older version of Jenkins, use the old release (2.2.1) of Sumo Logic plugin.
Updating the Jenkins plugin: use this method if the Jenkins plugin is already installed on your system and you want to update the version.
This section shows you how to update the version of the Jenkins plugin you have running on your system.
- In the Jenkins console, go to Manage Jenkins > Manage Plugins.
- Click the Updates tab > Check now.
- Select "Sumologic Publisher".
- Click Download now and install after restart. You may need to restart Jenkins for the plugin to show up.
Installing with the sumologic publisher: use this method if you're using the sumologic publisher for the first time.
This section shows you how to install the Jenkins plugin, if this is your first time using sumologic publisher.
To perform a first time installation, do the following:
- In the Jenkins console, go to Manage Jenkins > Manage Plugins.
- Click the Available tab.
- Search for "Sumologic Publisher".
- Click "Sumologic Publisher".
- Click Download now and install after restart. You may need to restart Jenkins for the plugin to show up.
Manually installing the Jenkins plugin: use this method if there's a restriction on installing the plugin directly through the Jenkins plugin update center.
This section shows you how to manually install the Jenkins plugin.
- Download the Jenkins plugin HPI file from this link.
- In the Jenkins console, go to Manage Jenkins > Manage Plugins.
- Go to Advanced > Upload Plugin and click Choose File.
- Select the downloaded Sumologic-publisher.hpi file from your machine and click Upload. A page similar to the following appears once the plugin is installed.
- Select Restart Jenkins when installation is complete and no jobs are running. You may need to restart Jenkins for the plugin to appear.
The plugin is available on Jenkins plugin center. Ignore the version mentioned in the Jenkins Plugin update center.
Step 4: Configure Jenkins Plugin
This task walks you through configuring the Jenkins Plugin for Sumo Logic.
To configure the Jenkins Plugin, do the following:
- Go to Jenkins > Manage Jenkins and select Configure System.
- Search for the Sumo Logic Jenkins Plugin.
- In the Sumo Logic Jenkins Plugin dialog, specify the following:
- SumoLogic Portal Name - This is the domain name of the hosted collector. For example,
service.sumologic.comorservice.us2.sumologic.com. - Metric Data Prefix: Enter the name of the Jenkins Master on which plugin is installed.
- HTTP Source URL: HTTP Source URL from step 2. The HTTP source URL will look something like this:
https://sumologic_url/receiver/v1/http/SECRET_STRING. - Source Category: This is the Source Category you defined for the source.
- Keep Old Configuration for Jobs: Enable this option to send old configuration for jobs.
- SumoLogic Portal Name - This is the domain name of the hosted collector. For example,
- Specify the types of data you want to send to Sumo Logic:
- Metric Data - Sends metric information.
- Audit Logs - Sends audit information like login, logouts, login failures, configuration changes to jobs and the Jenkins servers.
- Periodic Logs - Sends periodic information like node information, master information, shutdown events, Jenkins system logs.
- SCM logs - Send Source Control Management logs related to builds.
- Specify the following:
- Job Status Information: Select to send status for all jobs
- Console Logs Information: Select to send console logs for all jobs
- Jenkins plugin can be configured with an HTTP proxy. Once this is configured all the logs which are being sent from the Jenkins plugin will go through the proxy before getting ingested in sumo logic. Following are the parameters which are introduced to support the same:
- Enable Proxy Setting (checkbox): Check to Enable proxy setting
- Proxy Host: User to input the proxy server host-name here.
- Proxy port: Specify the port of the proxy server.
- Enable Proxy Authentication(checkbox): Check to enable Authentication for the proxy. This can be used if the proxy is configured with authentication.
- Username: Username to be used for the proxy Authentication.
- Password: Password to be used for proxy authentication.
- Click Apply, and then click Save.
Step 5: Optional - Advanced Configuration
This section provides instructions for configuring Sumo Logic Jenkins Plugin for specific projects using Jenkins configuration as code. For more information, see configuration as code.
To configure Sumo Logic Jenkins Plugin for specific projects using configuration as code, do the following:
- The plugin can be configured using configuration as code provided by Jenkins as detailed in this document.
- In case of specific jobs, do the following:
- For freestyle and maven Projects, go to Job Configuration and in the Post-build Actions, select Sumo Logic Build Logger.
- For Pipeline projects, do the following:
- In the pipeline configuration, for normal script make the following as the top level.
SumoPipelineLogCollection {
// your script- Then, in the pipeline configuration, for declarative pipeline script update the option.
options {
  SumoPipelineLogCollection()
 }
- Click Apply, and then click Save.
Installing the Jenkins app
To install the app, do the following:
Next-Gen App: To install or update the app, you must be an account administrator or a user with Manage Apps, Manage Monitors, Manage Fields, Manage Metric Rules, and Manage Collectors capabilities depending upon the different content types part of the app.
- Select App Catalog.
- In the 🔎 Search Apps field, run a search for your desired app, then select it.
- Click Install App.
note
Sometimes this button says Add Integration.
- Click Next in the Setup Data section.
- In the Configure section of your respective app, complete the following fields.
- Field Name. If you already have collectors and sources set up, select the configured metadata field name (eg _sourcecategory) or specify other custom metadata (eg: _collector) along with its metadata Field Value.
- Click Next. You will be redirected to the Preview & Done section.
Post-installation
Once your app is installed, it will appear in your Installed Apps folder, and dashboard panels will start to fill automatically.
Each panel slowly fills with data matching the time range query received since the panel was created. Results will not immediately be available but will be updated with full graphs and charts over time.
Viewing Jenkins dashboards
All dashboards have a set of filters that you can apply to the entire dashboard. Use these filters to drill down and examine the data to a granular level.
- You can change the time range for a dashboard or panel by selecting a predefined interval from a drop-down list, choosing a recently used time range, or specifying custom dates and times. Learn more.
- You can use template variables to drill down and examine the data on a granular level. For more information, see Filtering Dashboards with Template Variables.
- Most Next-Gen apps allow you to provide the scope at the installation time and are comprised of a key (
_sourceCategoryby default) and a default value for this key. Based on your input, the app dashboards will be parameterized with a dashboard variable, allowing you to change the dataset queried by all panels. This eliminates the need to create multiple copies of the same dashboard with different queries.
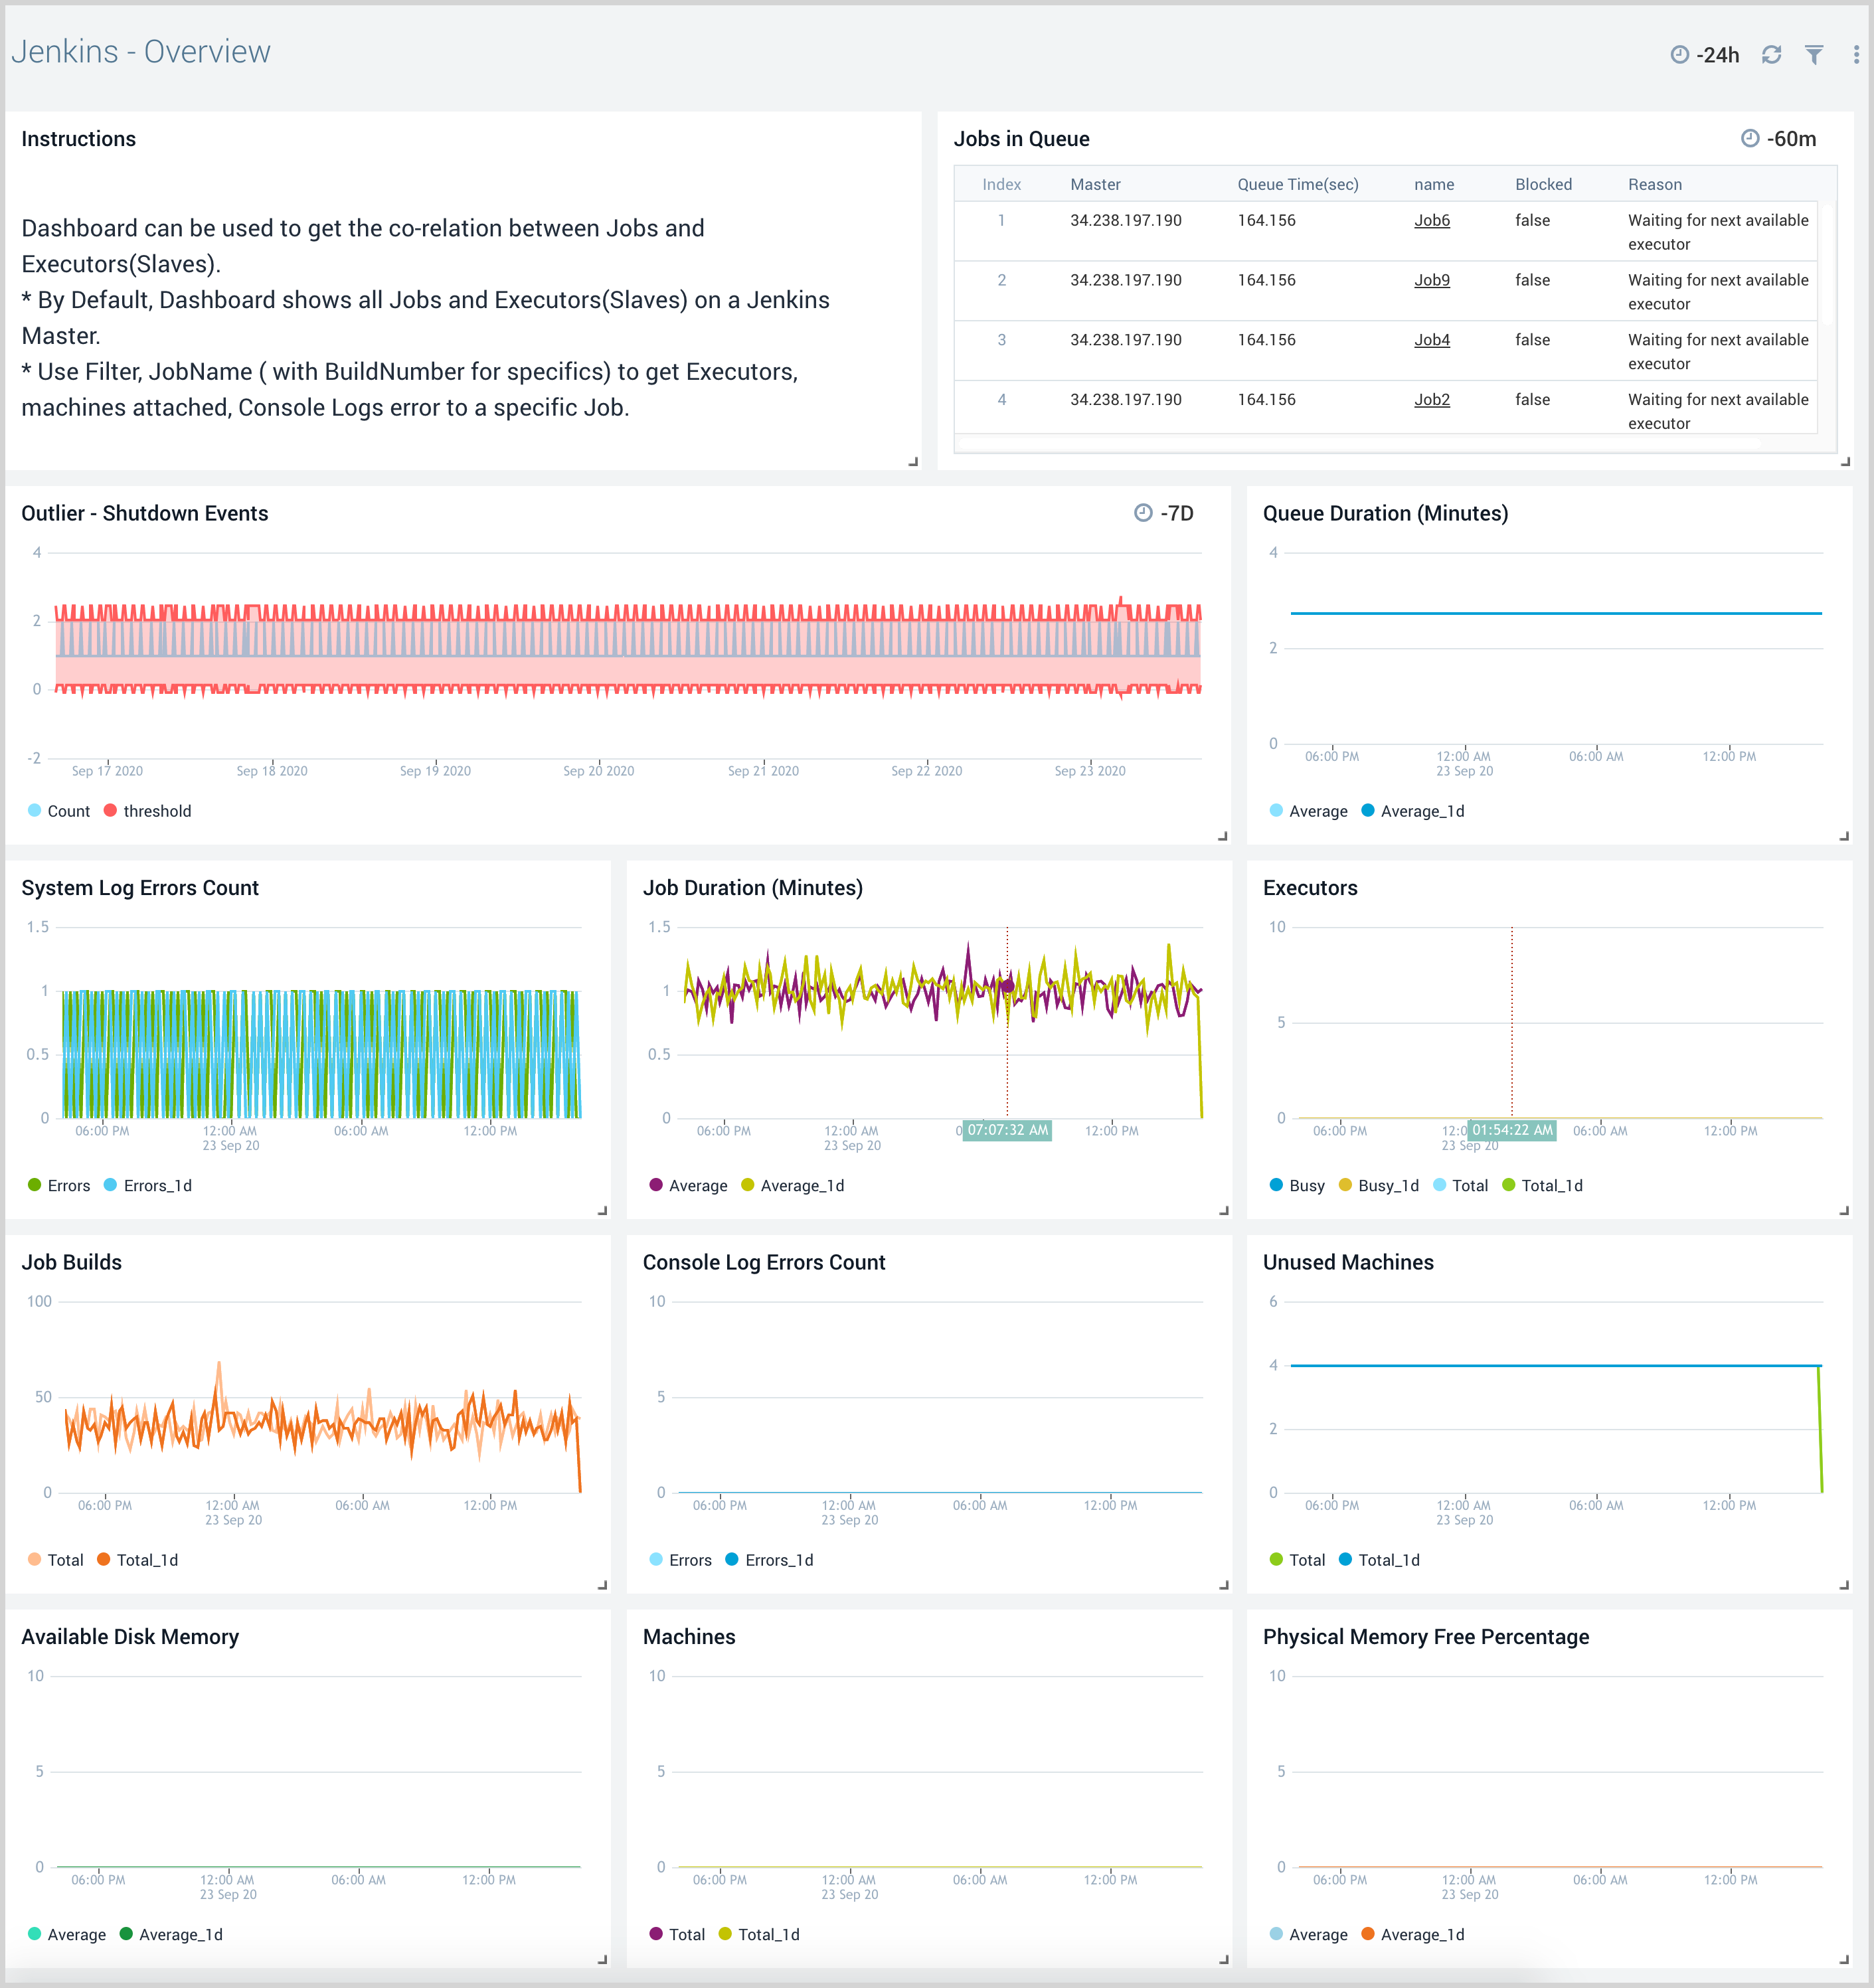
Overview
The Jenkins - Overview dashboard shows relationships between jobs and executors (worker nodes) on a Jenkins master. This dashboard provides insights into job run durations, status, physical memory, disk memory, and unused machines.
Use this dashboard to:
- Correlate job builds with Jenkins executors (worker nodes), physical memory utilization, disk space utilization, console logs, the number of executors used by jobs, and the number of unused (free) worker nodes.
- Identify worker nodes not used by Jenkins master jobs to understand worker node usage.
- Analyze job health by filtering data for a specific job to identify the console log errors, system errors, number of executors used, disk space utilization, physical memory utilization.
- Identify Jenkins master shutdown events.
- Analyze the jobs in the queue with job queue duration, reason, job URL.
- Generate alerts based on shutdown events, job run duration, physical memory utilization, disk space utilization, and more.
System Monitoring
The Jenkins - System Monitoring dashboards provides information on system activities related to master node metrics, job metrics, worker nodes, and audit activities. System Monitoring dashboards help you to monitor changes related to the Jenkins configuration, job configuration, the health of the Jenkins master, performance of the job queue and run duration, as well as the health of all worker nodes available to the Jenkins master node.
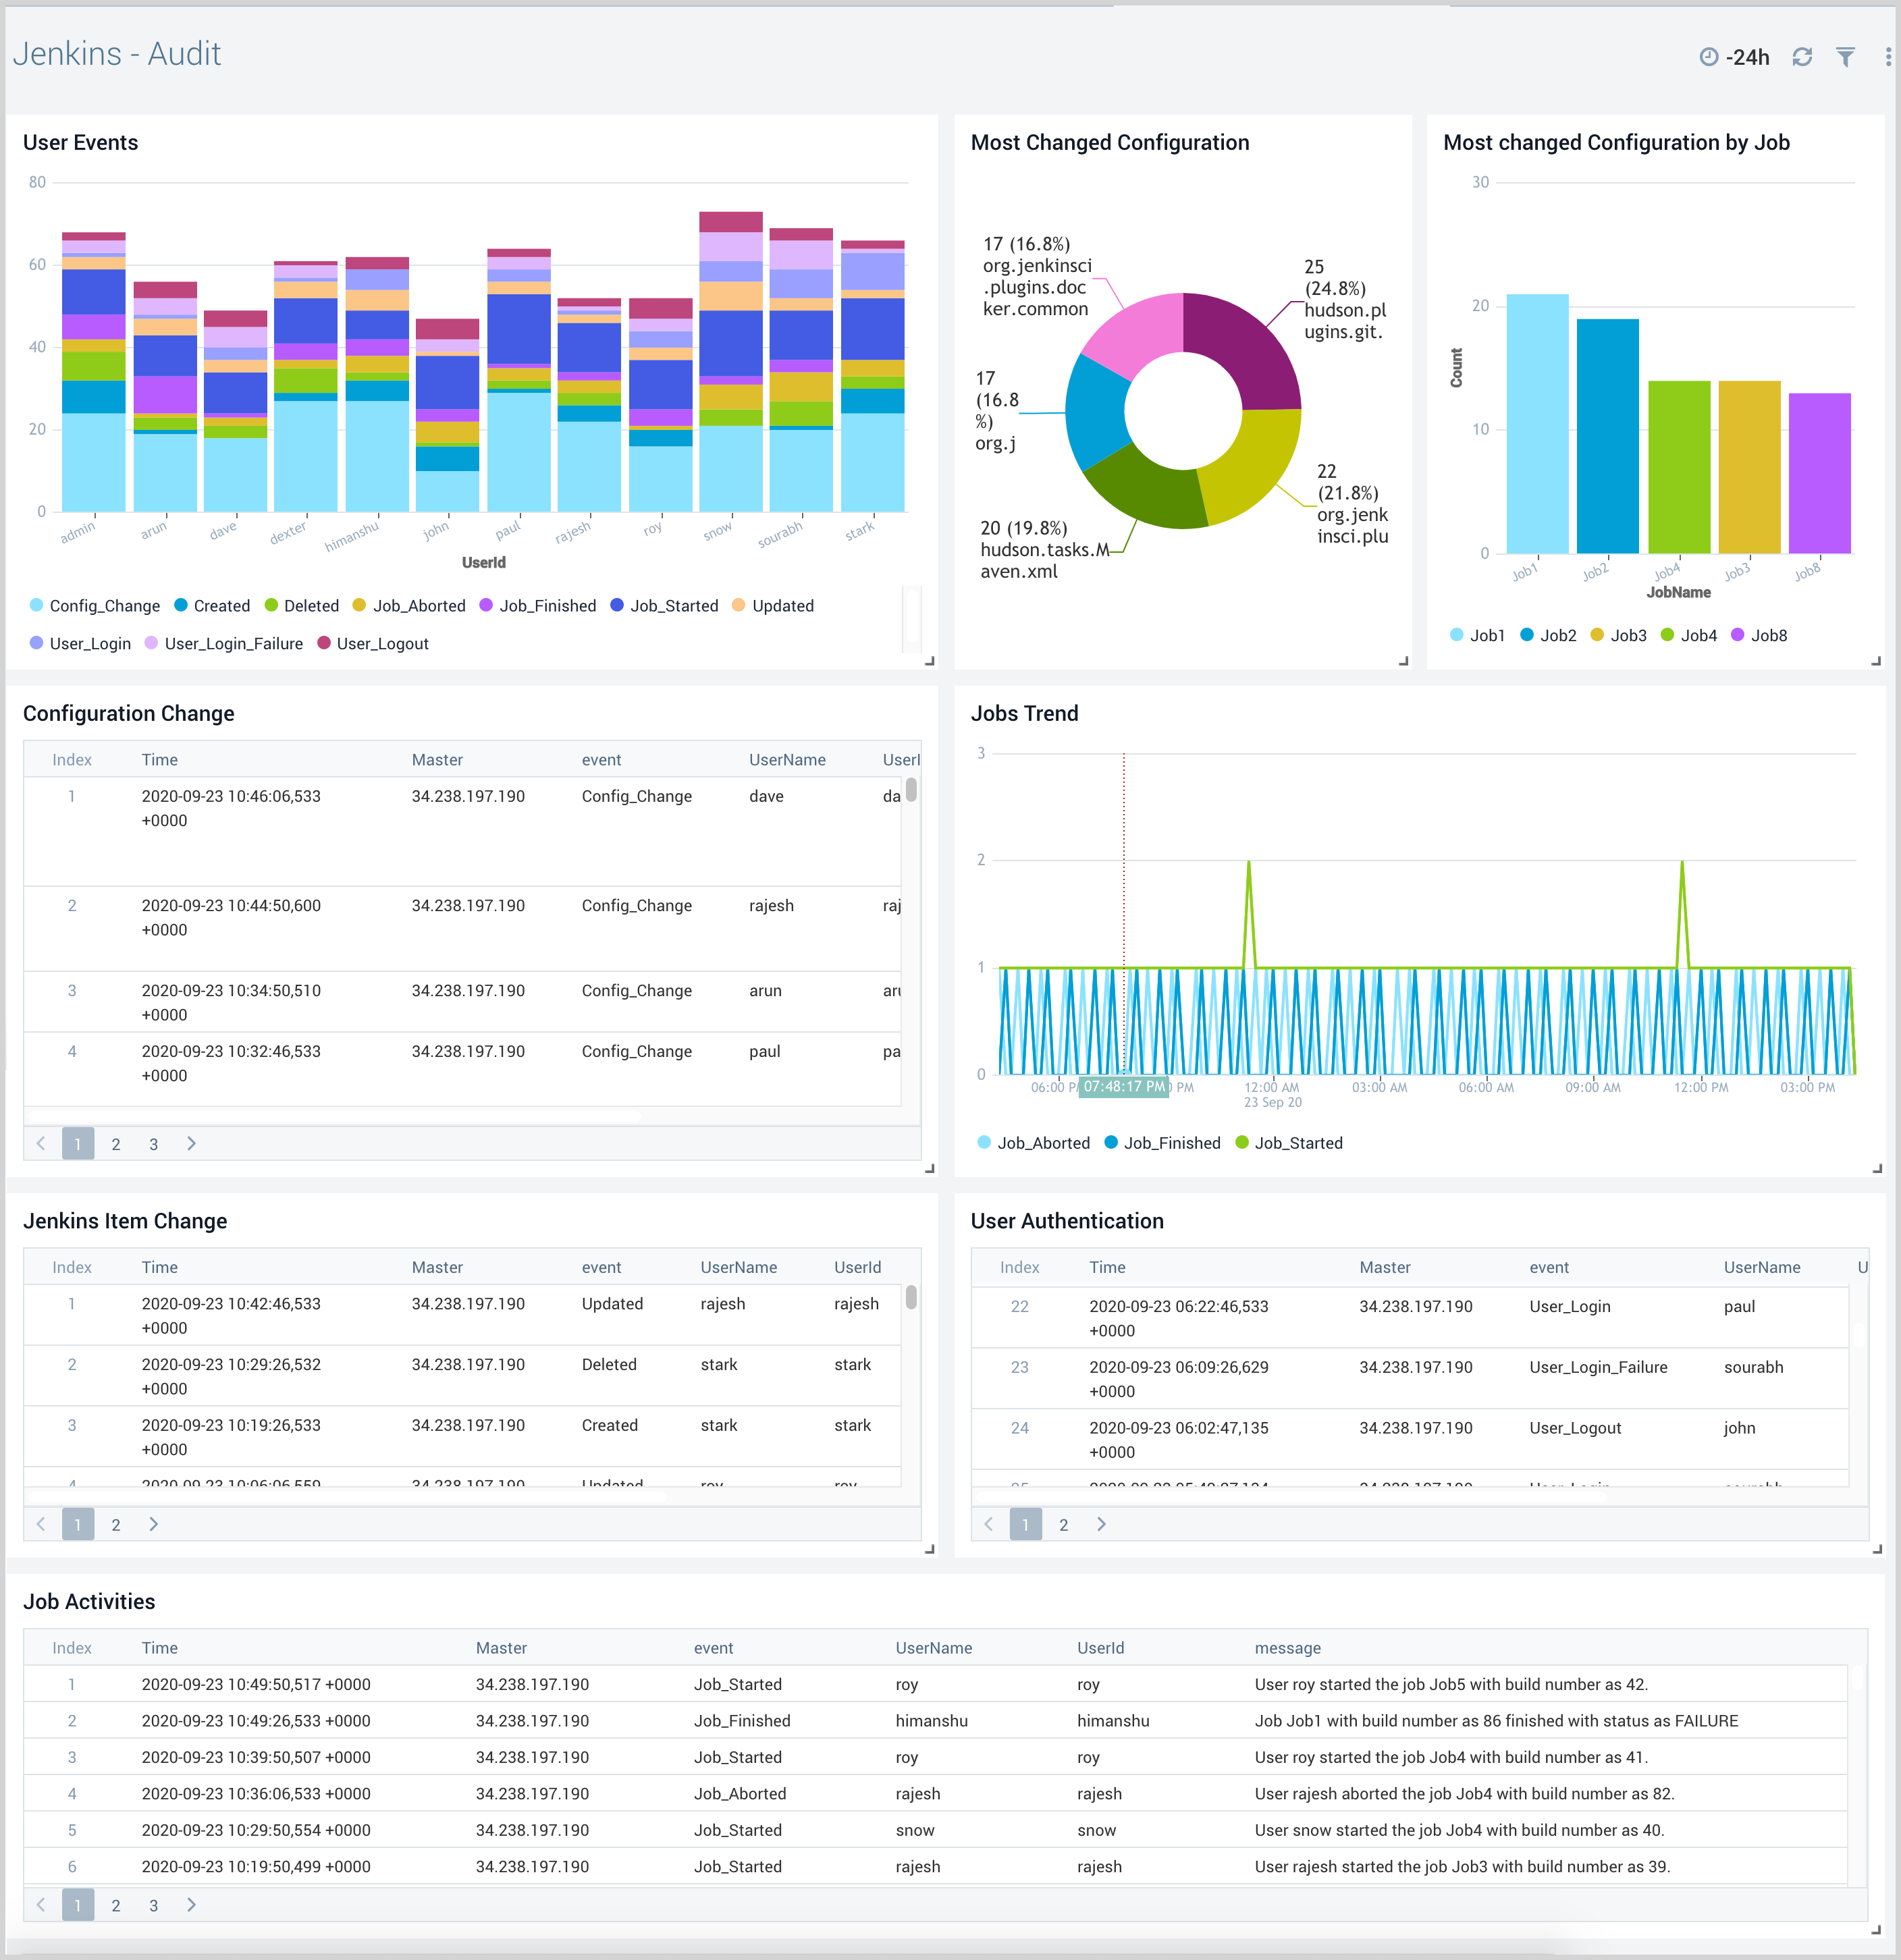
Audit
The Jenkins - Audit dashboard provides insight into user events, including configuration changes, authentication events, and job activities.
Use this dashboard to:
- Ensure only authorized users are accessing the Jenkins System and are modifying Jenkins system and job configurations.
- Keep track of the job configuration changes.
- Compare old and new Jenkins system and job configuration settings.
- View trends for Jenkins job start and finish events.
Master Health
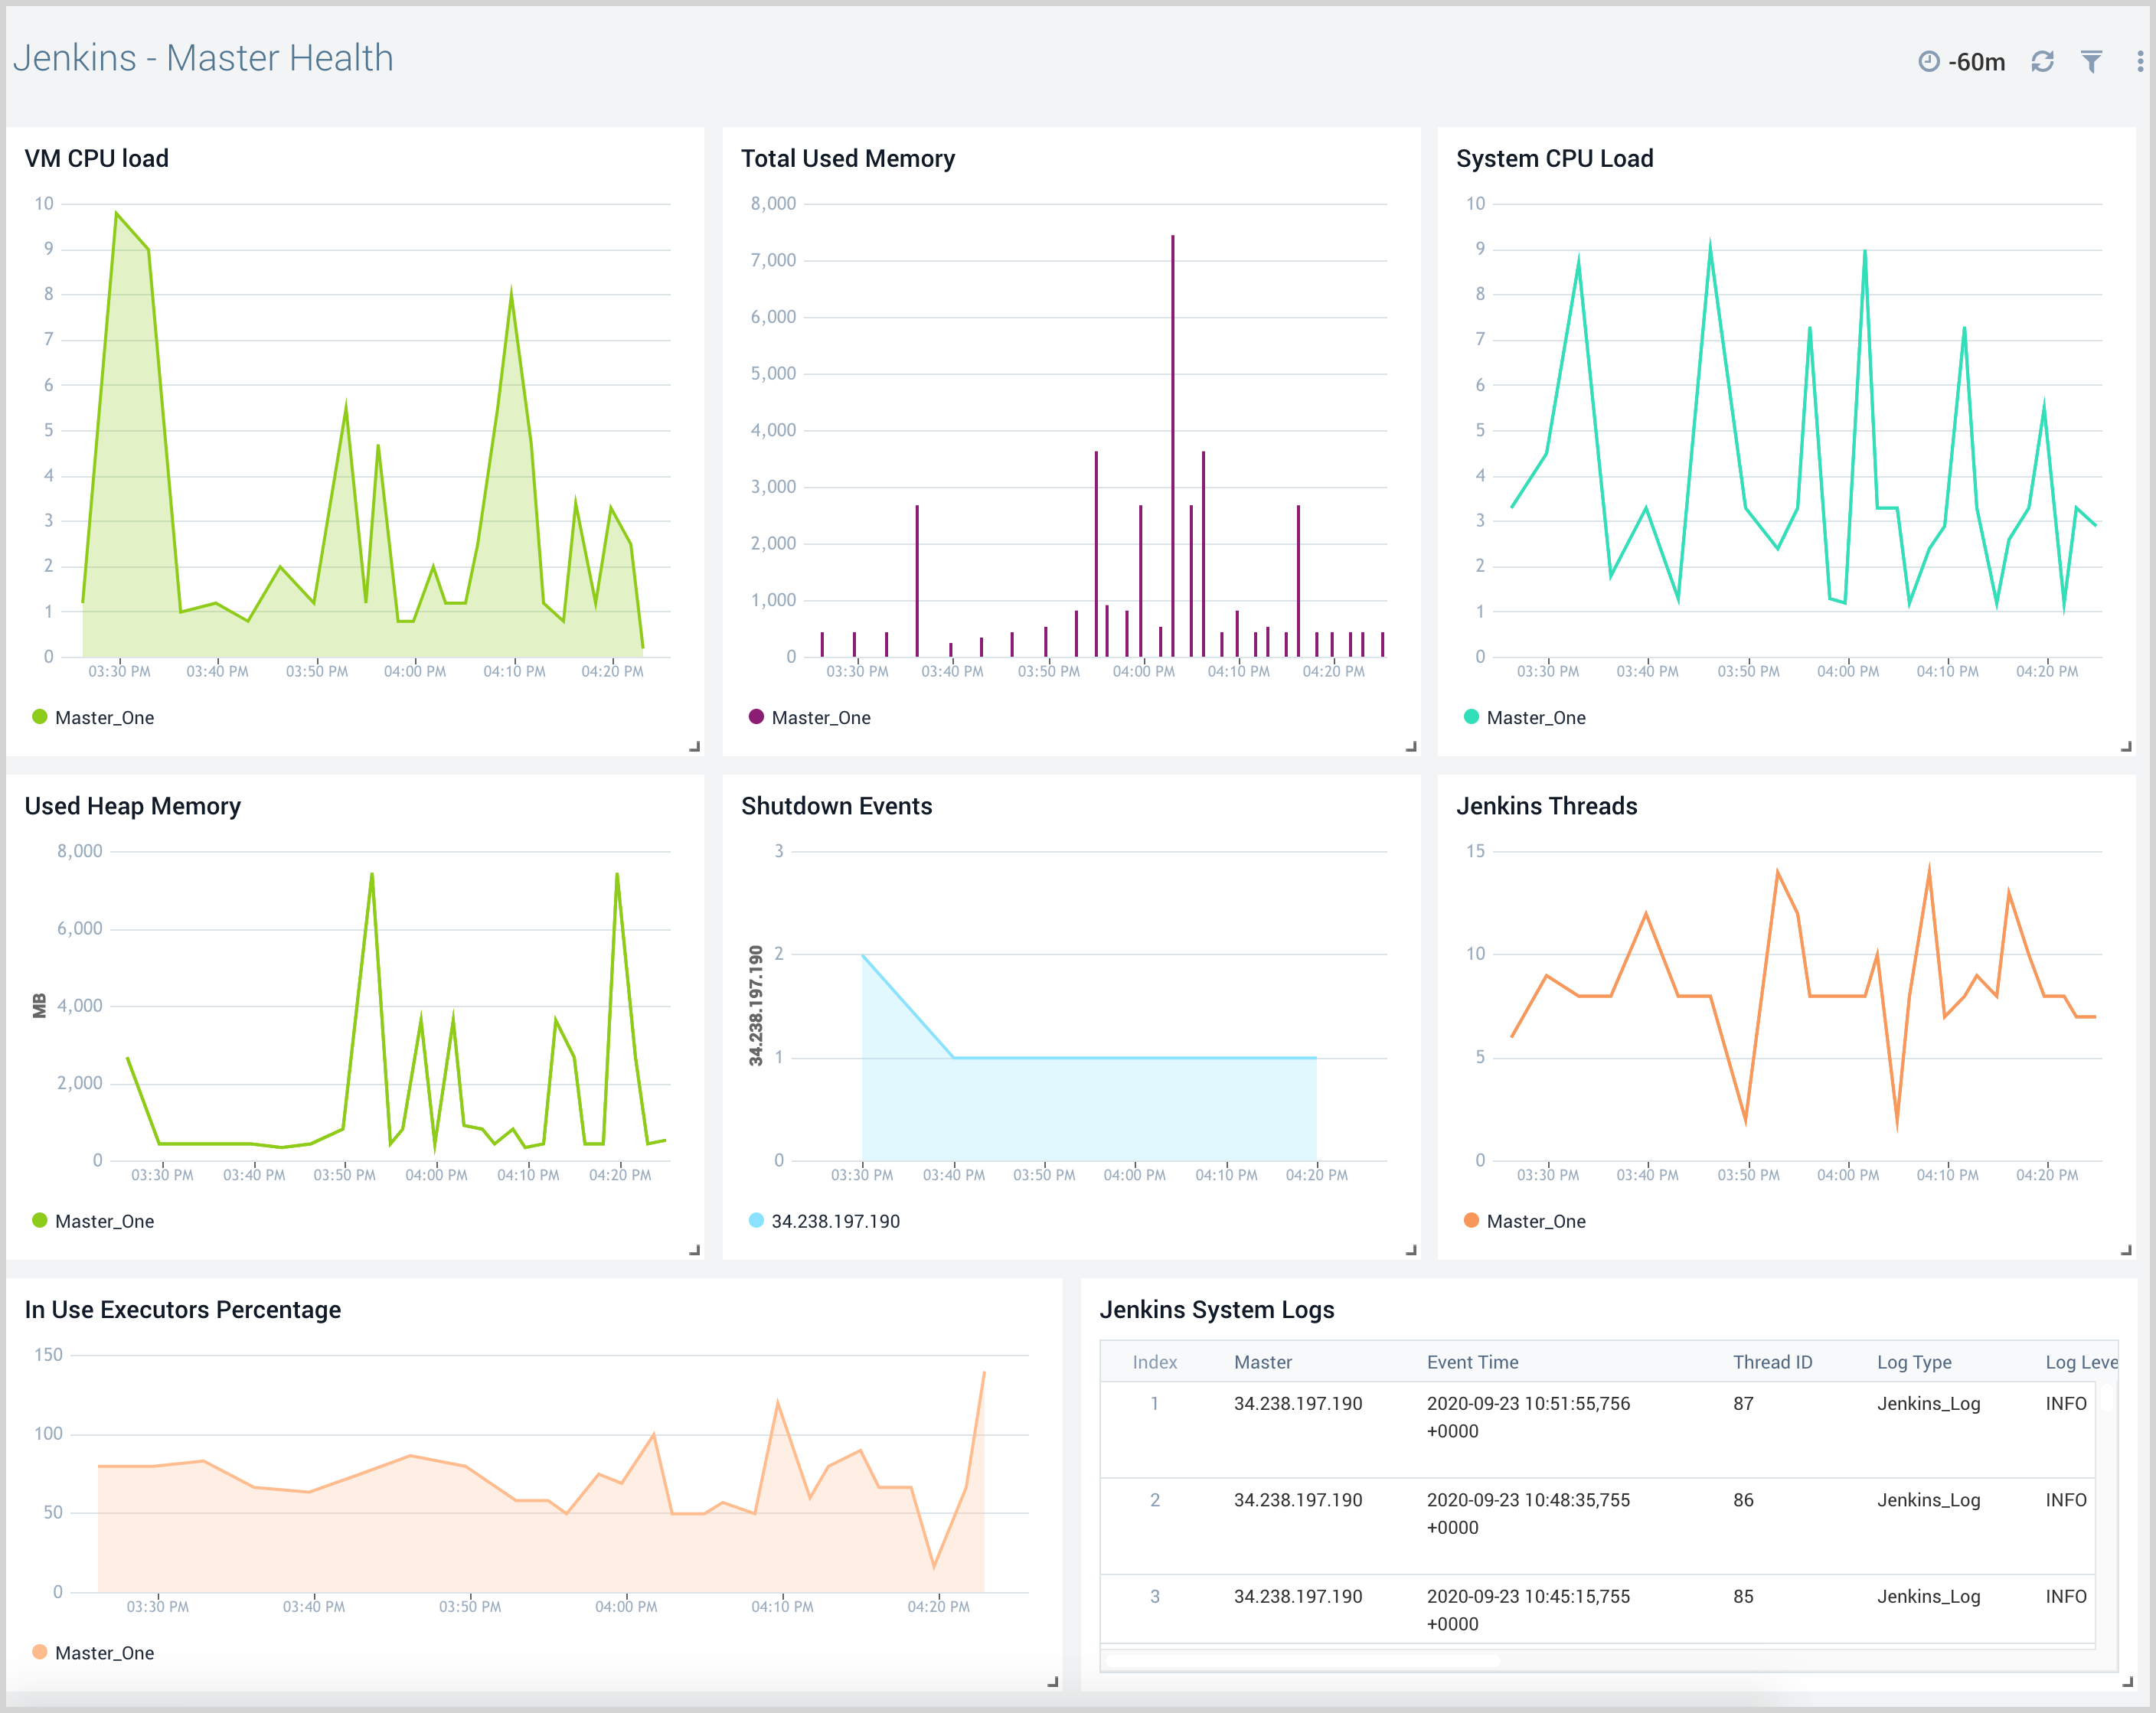
The Jenkins - Master Health dashboard provides insight into the health of Jenkins master nodes with information on shutdown events, Jenkins system logs, and metrics events such as CPU, memory, job duration, threads, and executors.
Executors are similar to threads that run jobs, so they are indicators of the load placed on Jenkins. If the executors are full, it means there are a lot of jobs running on the system and more executors may be needed to balance the load.
Use this dashboard to:
- Monitor shutdown events for Jenkins master nodes.
- Monitor Jenkins system sogs to determine the root cause of system issues.
- Monitor Jenkins master CPU usage and memory usage to allocate additional resources if needed.
- Monitor free executors and busy executors on Jenkins master.
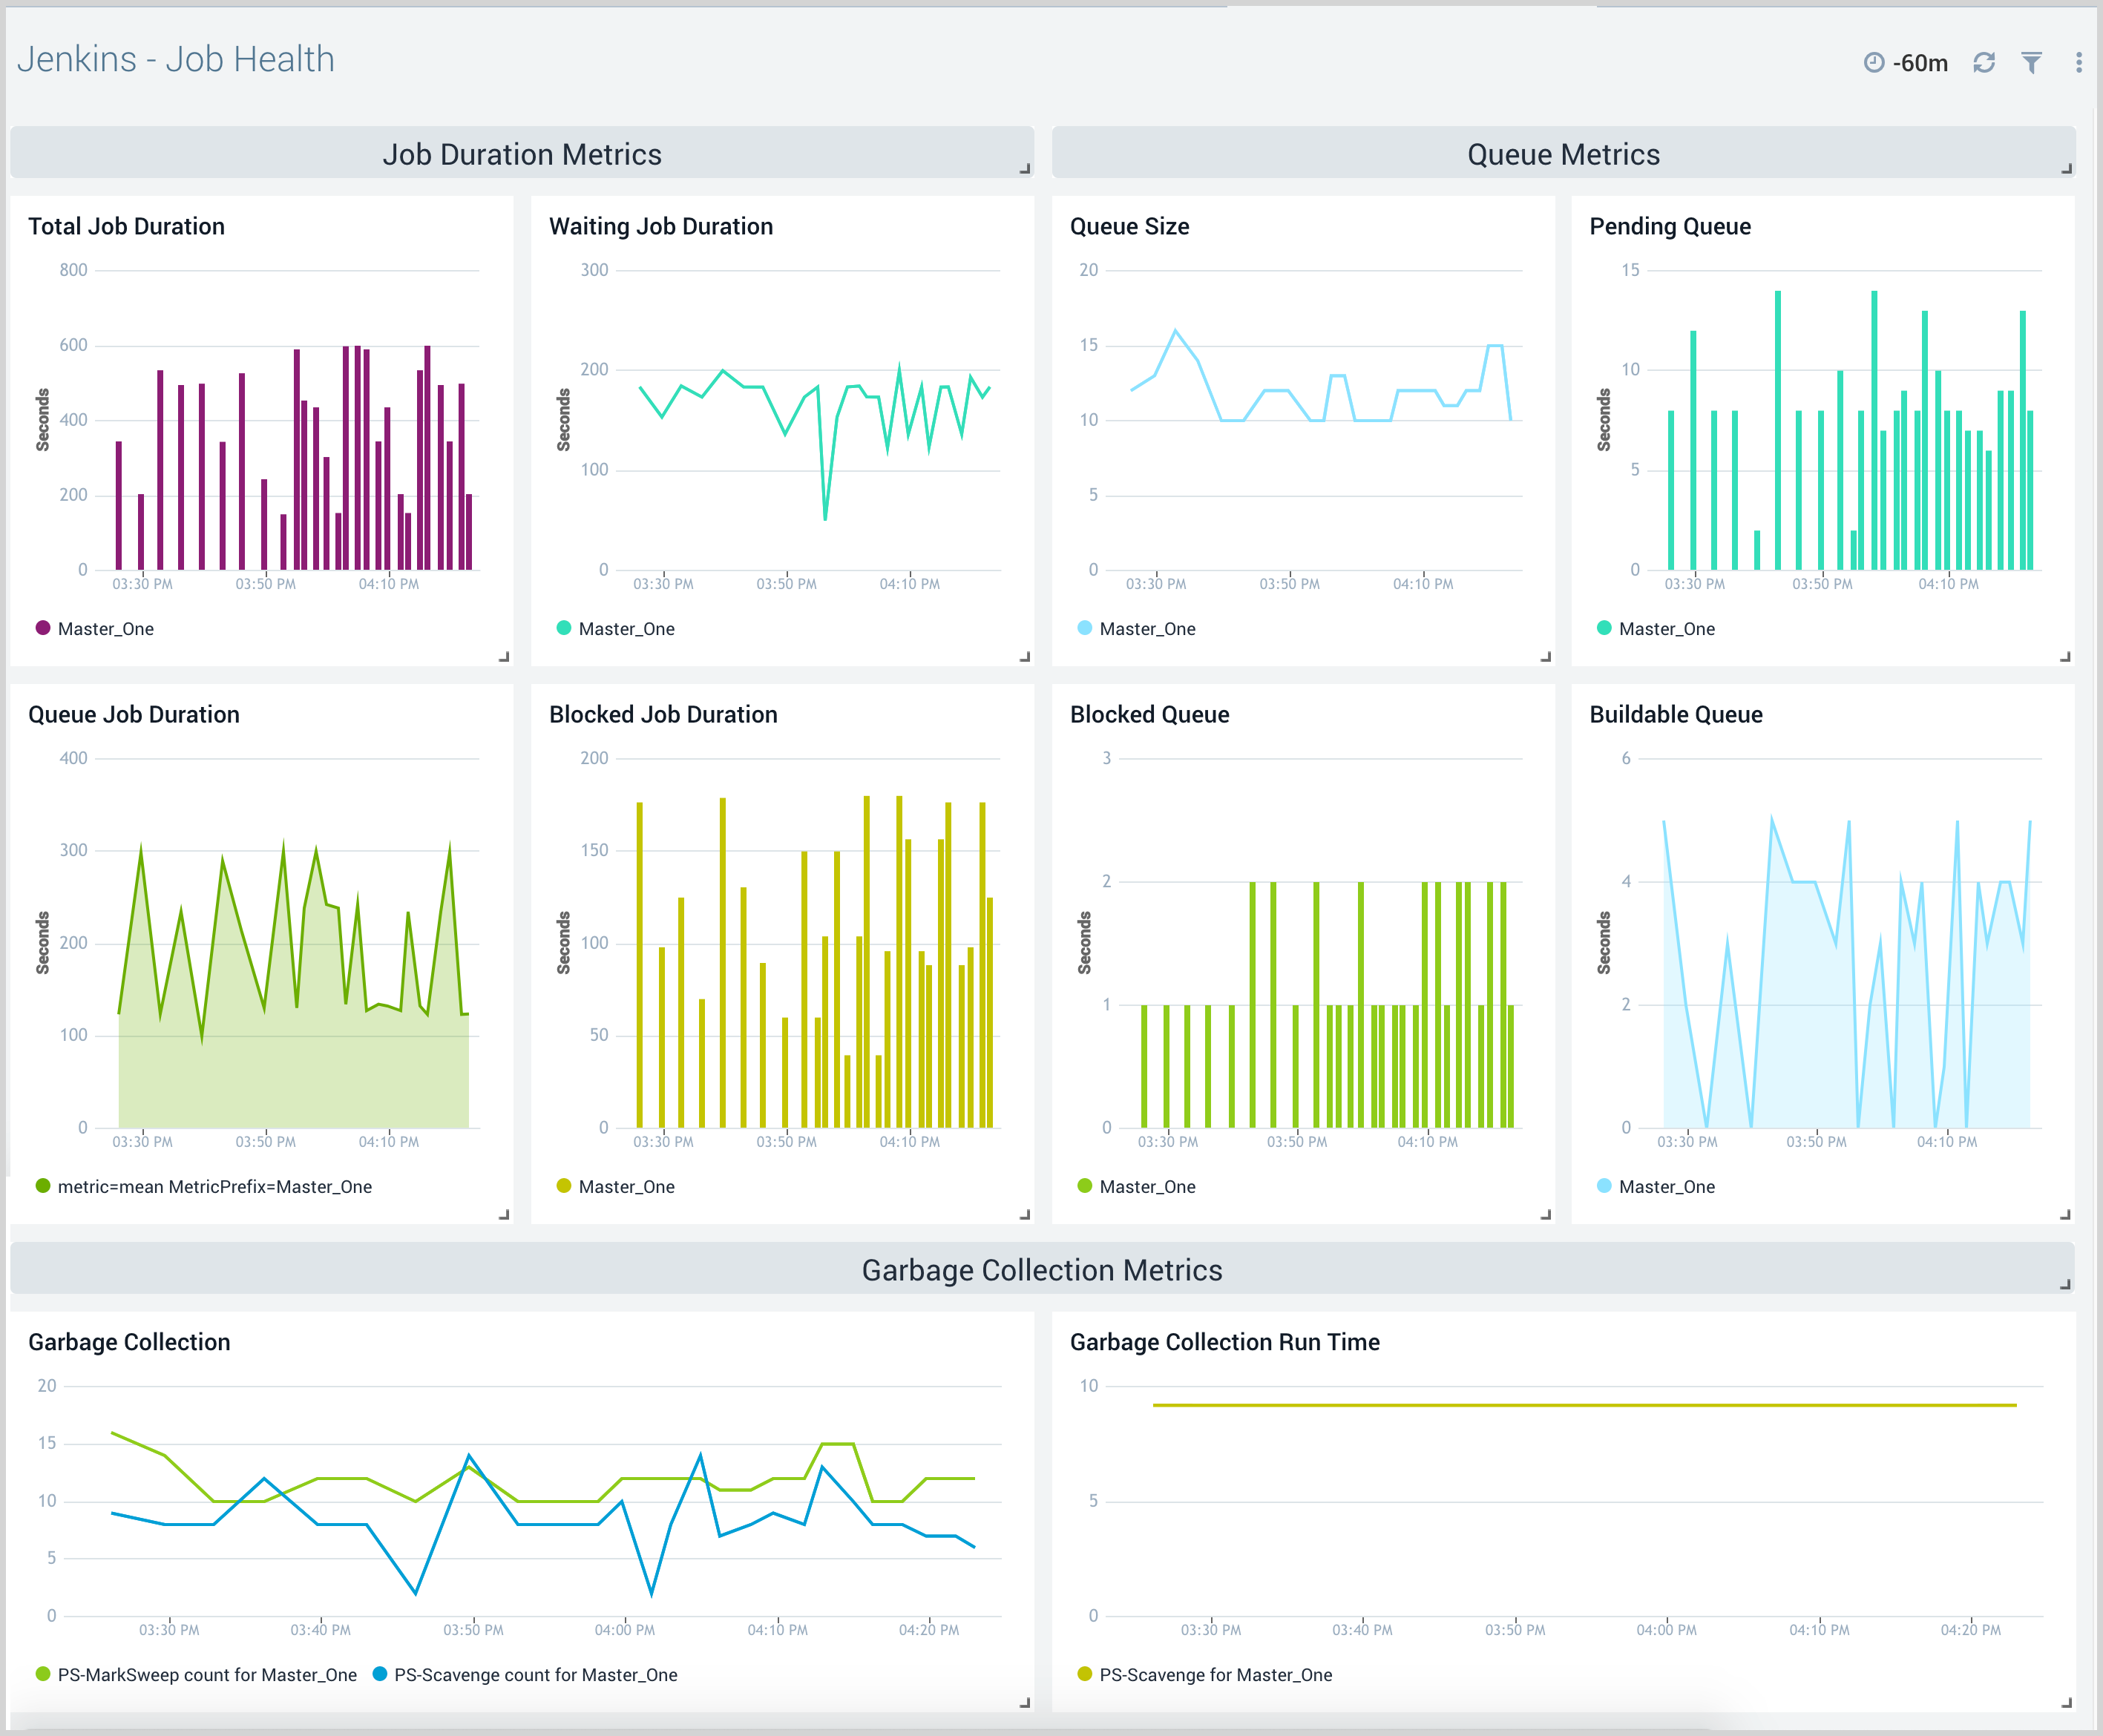
Job Health
The Jenkins - Job Health dashboard provides insight into the health of Jenkins jobs across various master nodes with information on job counts, job run duration, queue information, and garbage collection metrics.
Use this dashboard to:
- Monitor jobs in the queue, blocked and pending jobs to make sure your continuous integrations are running as expected.
- Monitor garbage collection statistics on the Jenkins master to understand how to improve performance and allocate additional resources if necessary.
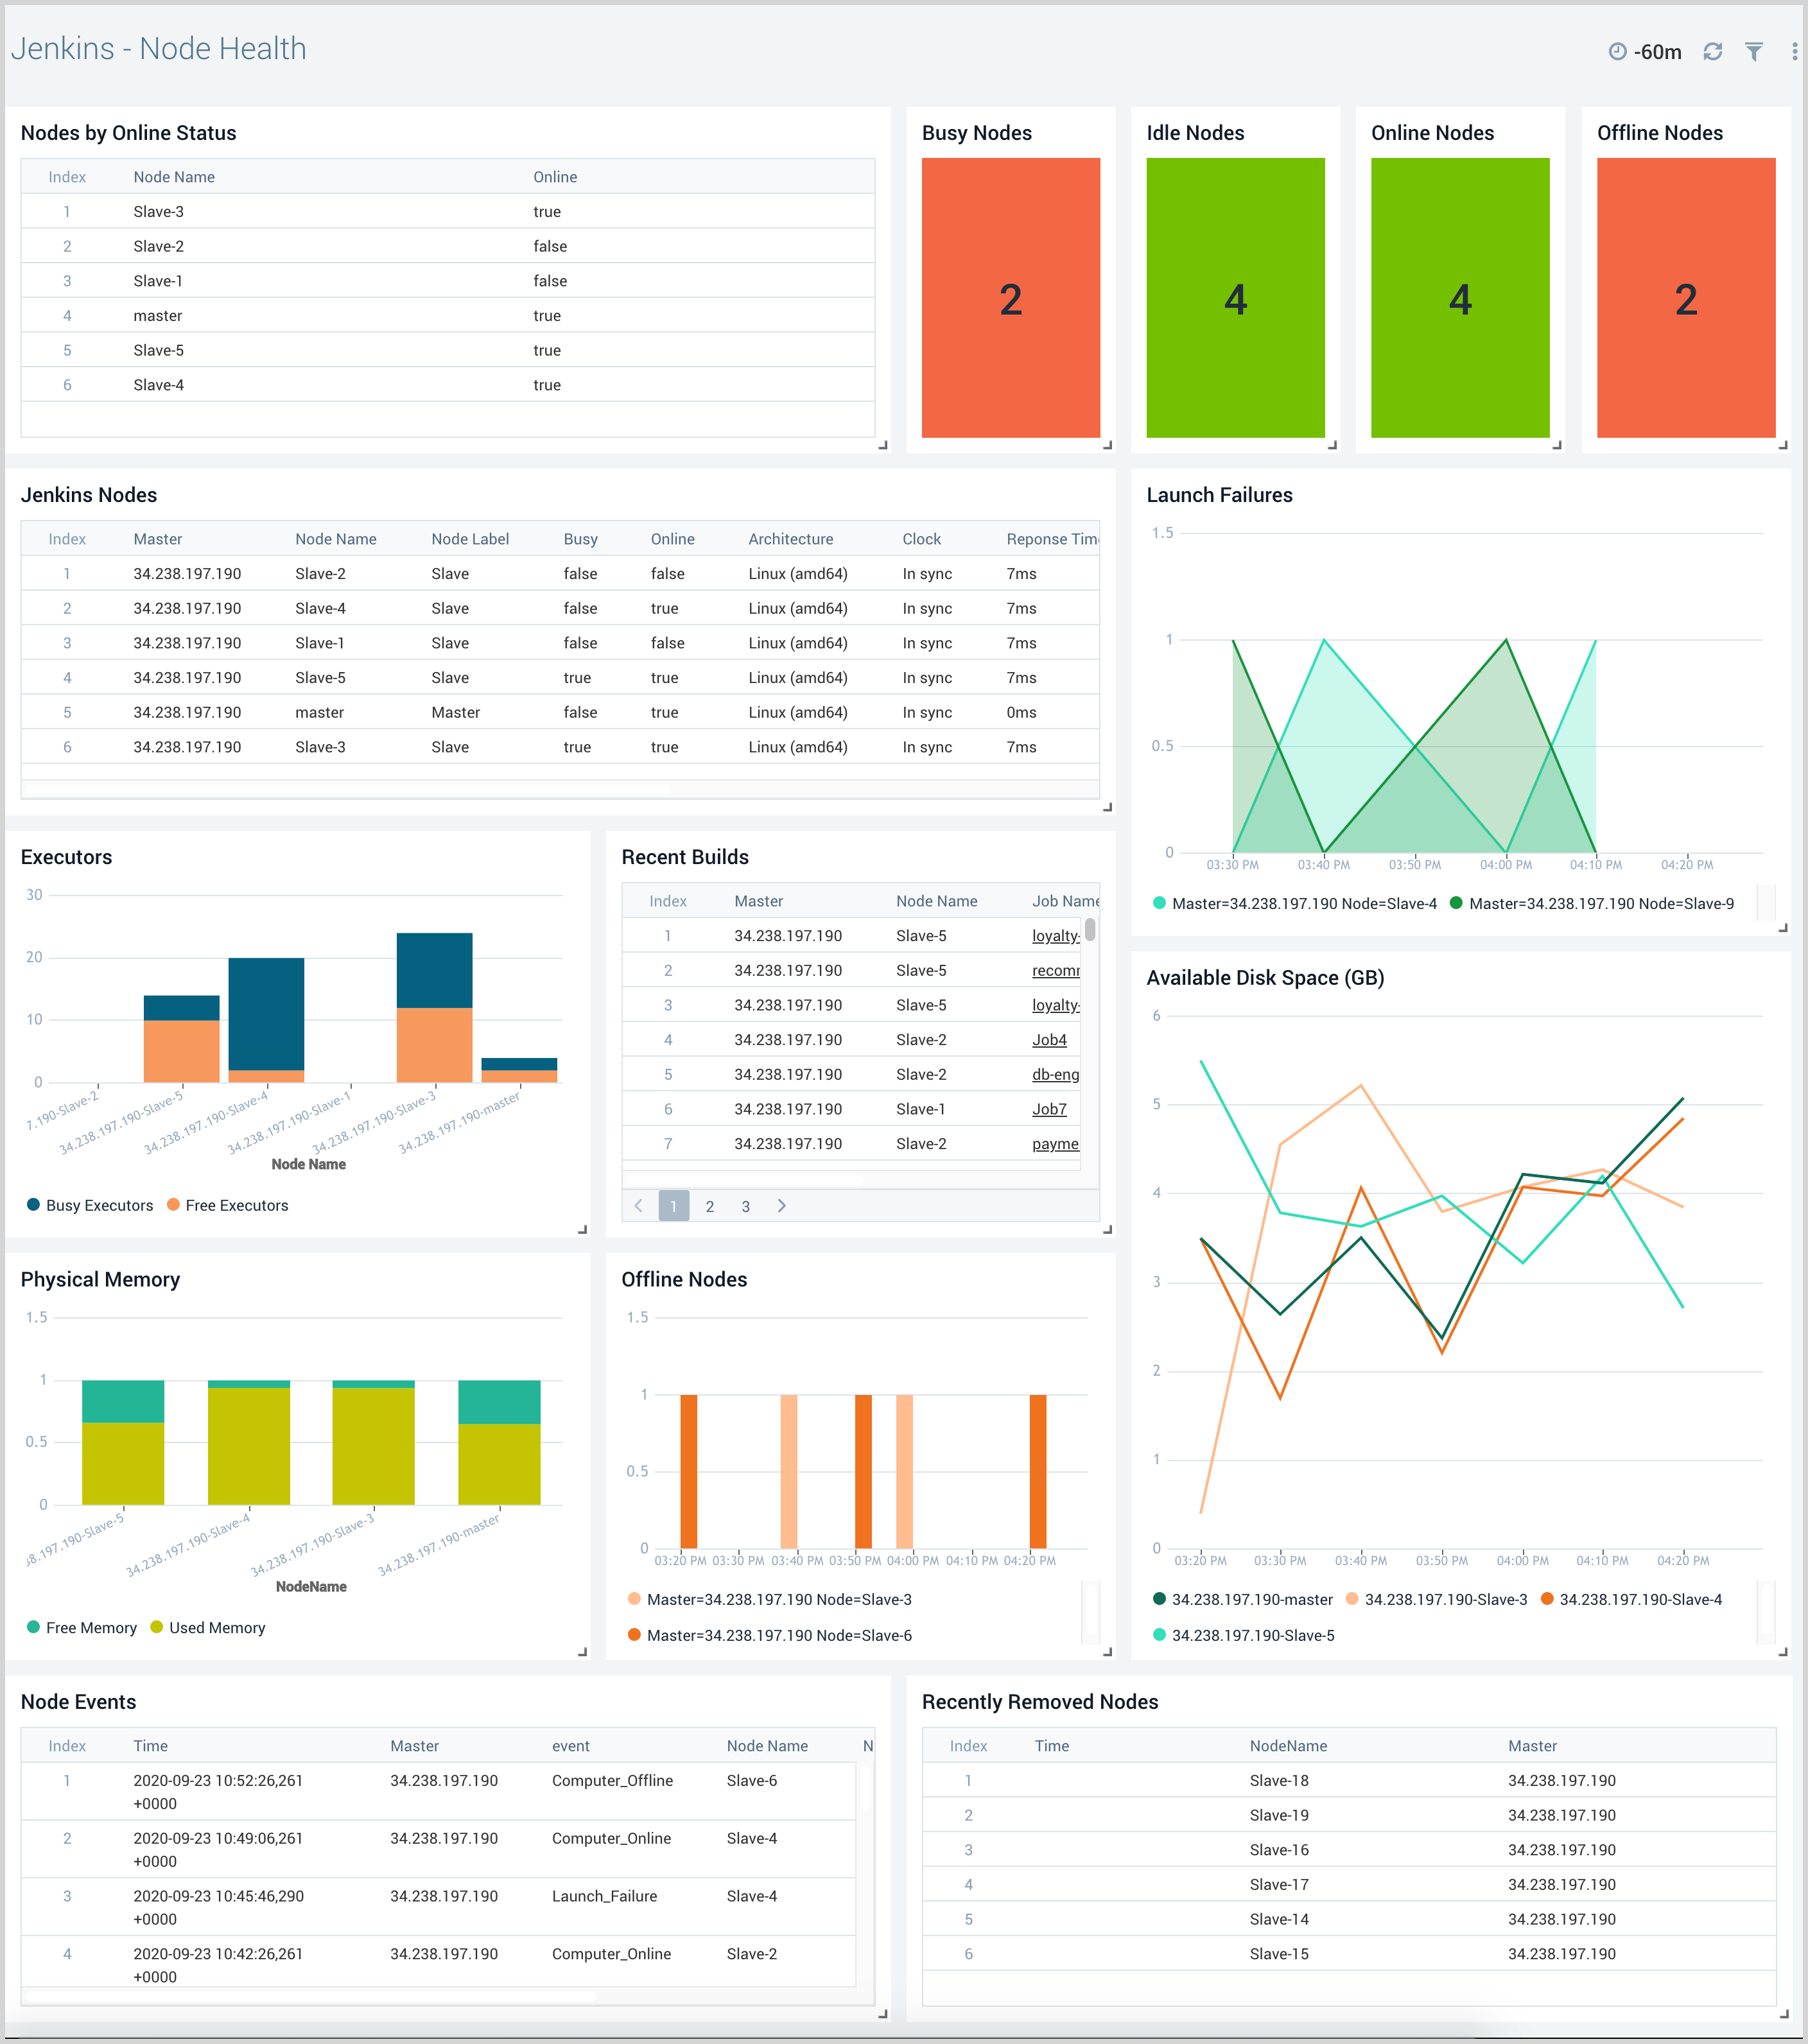
Node Health
The Jenkins - Node Health dashboard provides insights into the health of all Jenkins master and worker nodes, with information on node details, recent builds, resource consumption, and node events.
Use this dashboard to:
- Monitor the health of all Jenkins nodes to understand and resolve potential bottlenecks.
- Monitor node resource utilization and resize if necessary.
- Monitor removed nodes and node offline and launch failure events to ensure intended operations are being performed.
Job Monitoring
Job Monitoring Dashboards provide information on job activities like job run duration, job status, test results, pipeline stages, and console Logs. Job monitoring dashboards help you monitor job duration, status, failed jobs, and test cases. You can determine stack trace failures, failed stages details, source control management details, job configuration changes, and stage-wise console logs.
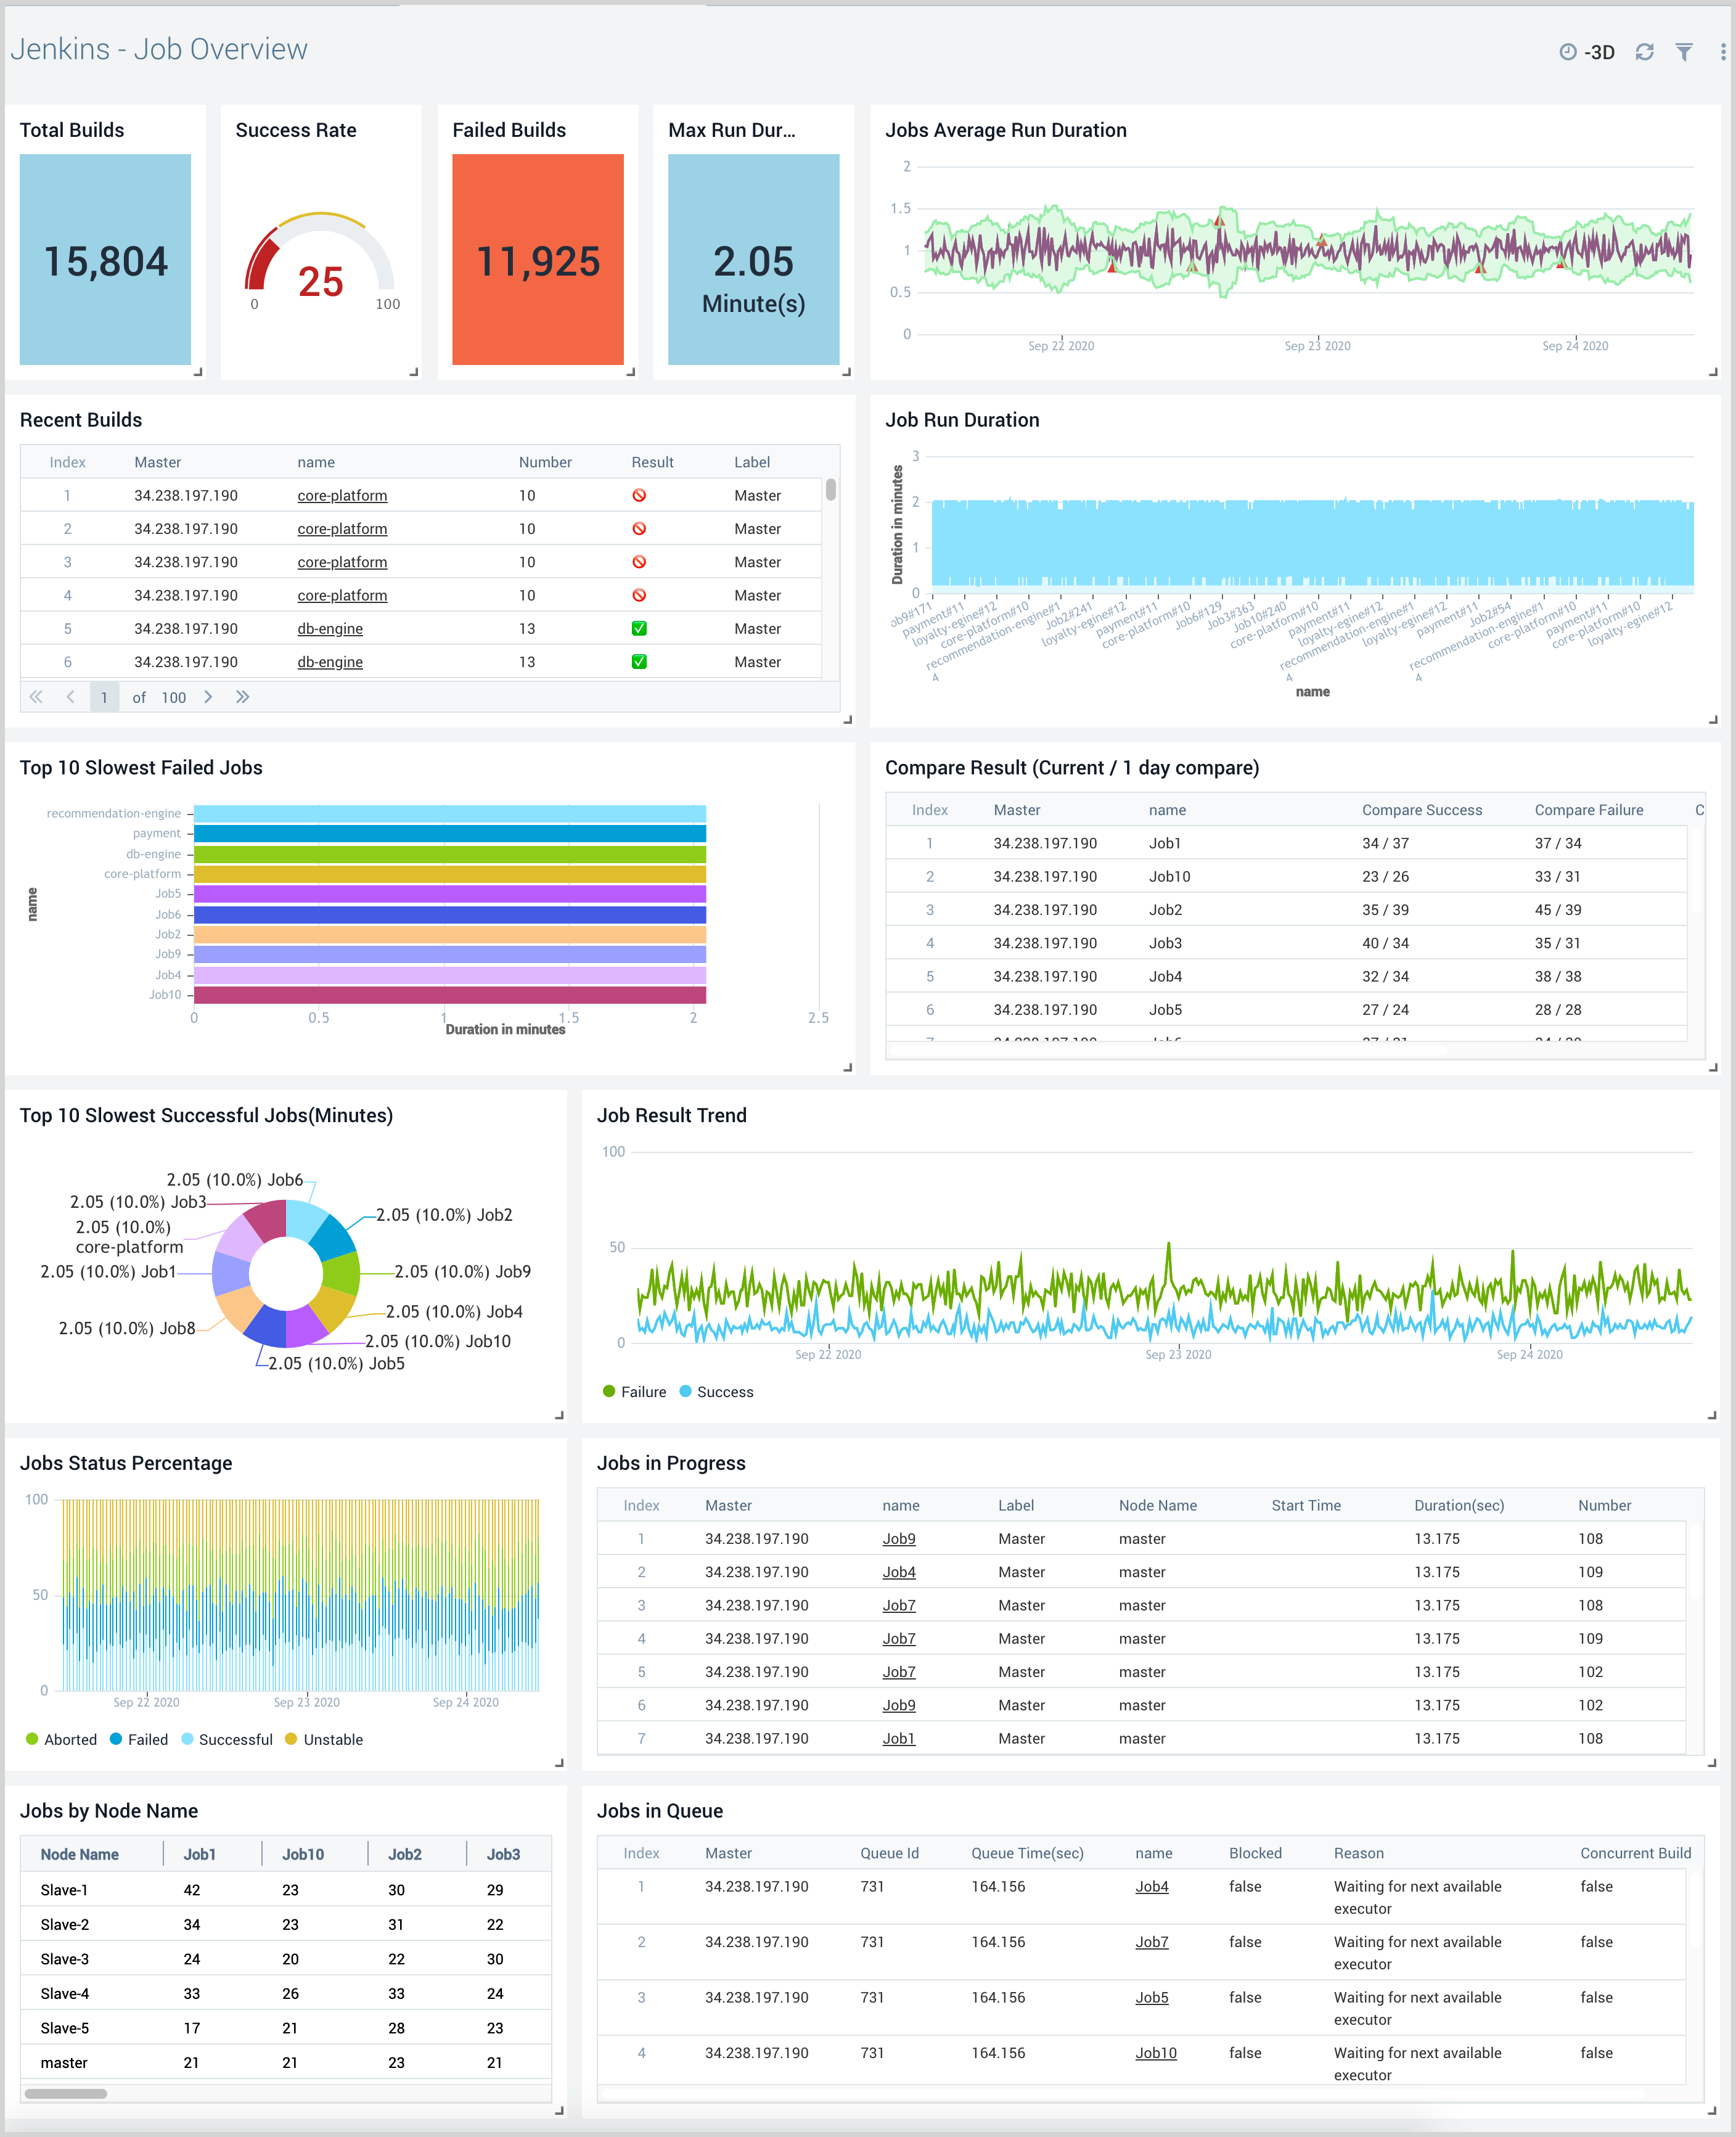
Job Overview
The Jenkins - Job Overview dashboard provides a high-level view of the job and builds status, trends, comparisons, and results.
Use this dashboard to:
- Monitor the total number of builds, successful and failed builds.
- Monitor recent builds and view detailed information in the Jenkins console.
- Monitor job duration trends to understand how to improve the execution of various stages in the pipeline.
- Monitor jobs in progress, and in queue to determine how the pipelines are performing and make adjustments to the build process if needed.
- Identify the slowest failed builds.
- View trends for job results and use that information to identify source code components and teams that need the most improvements.
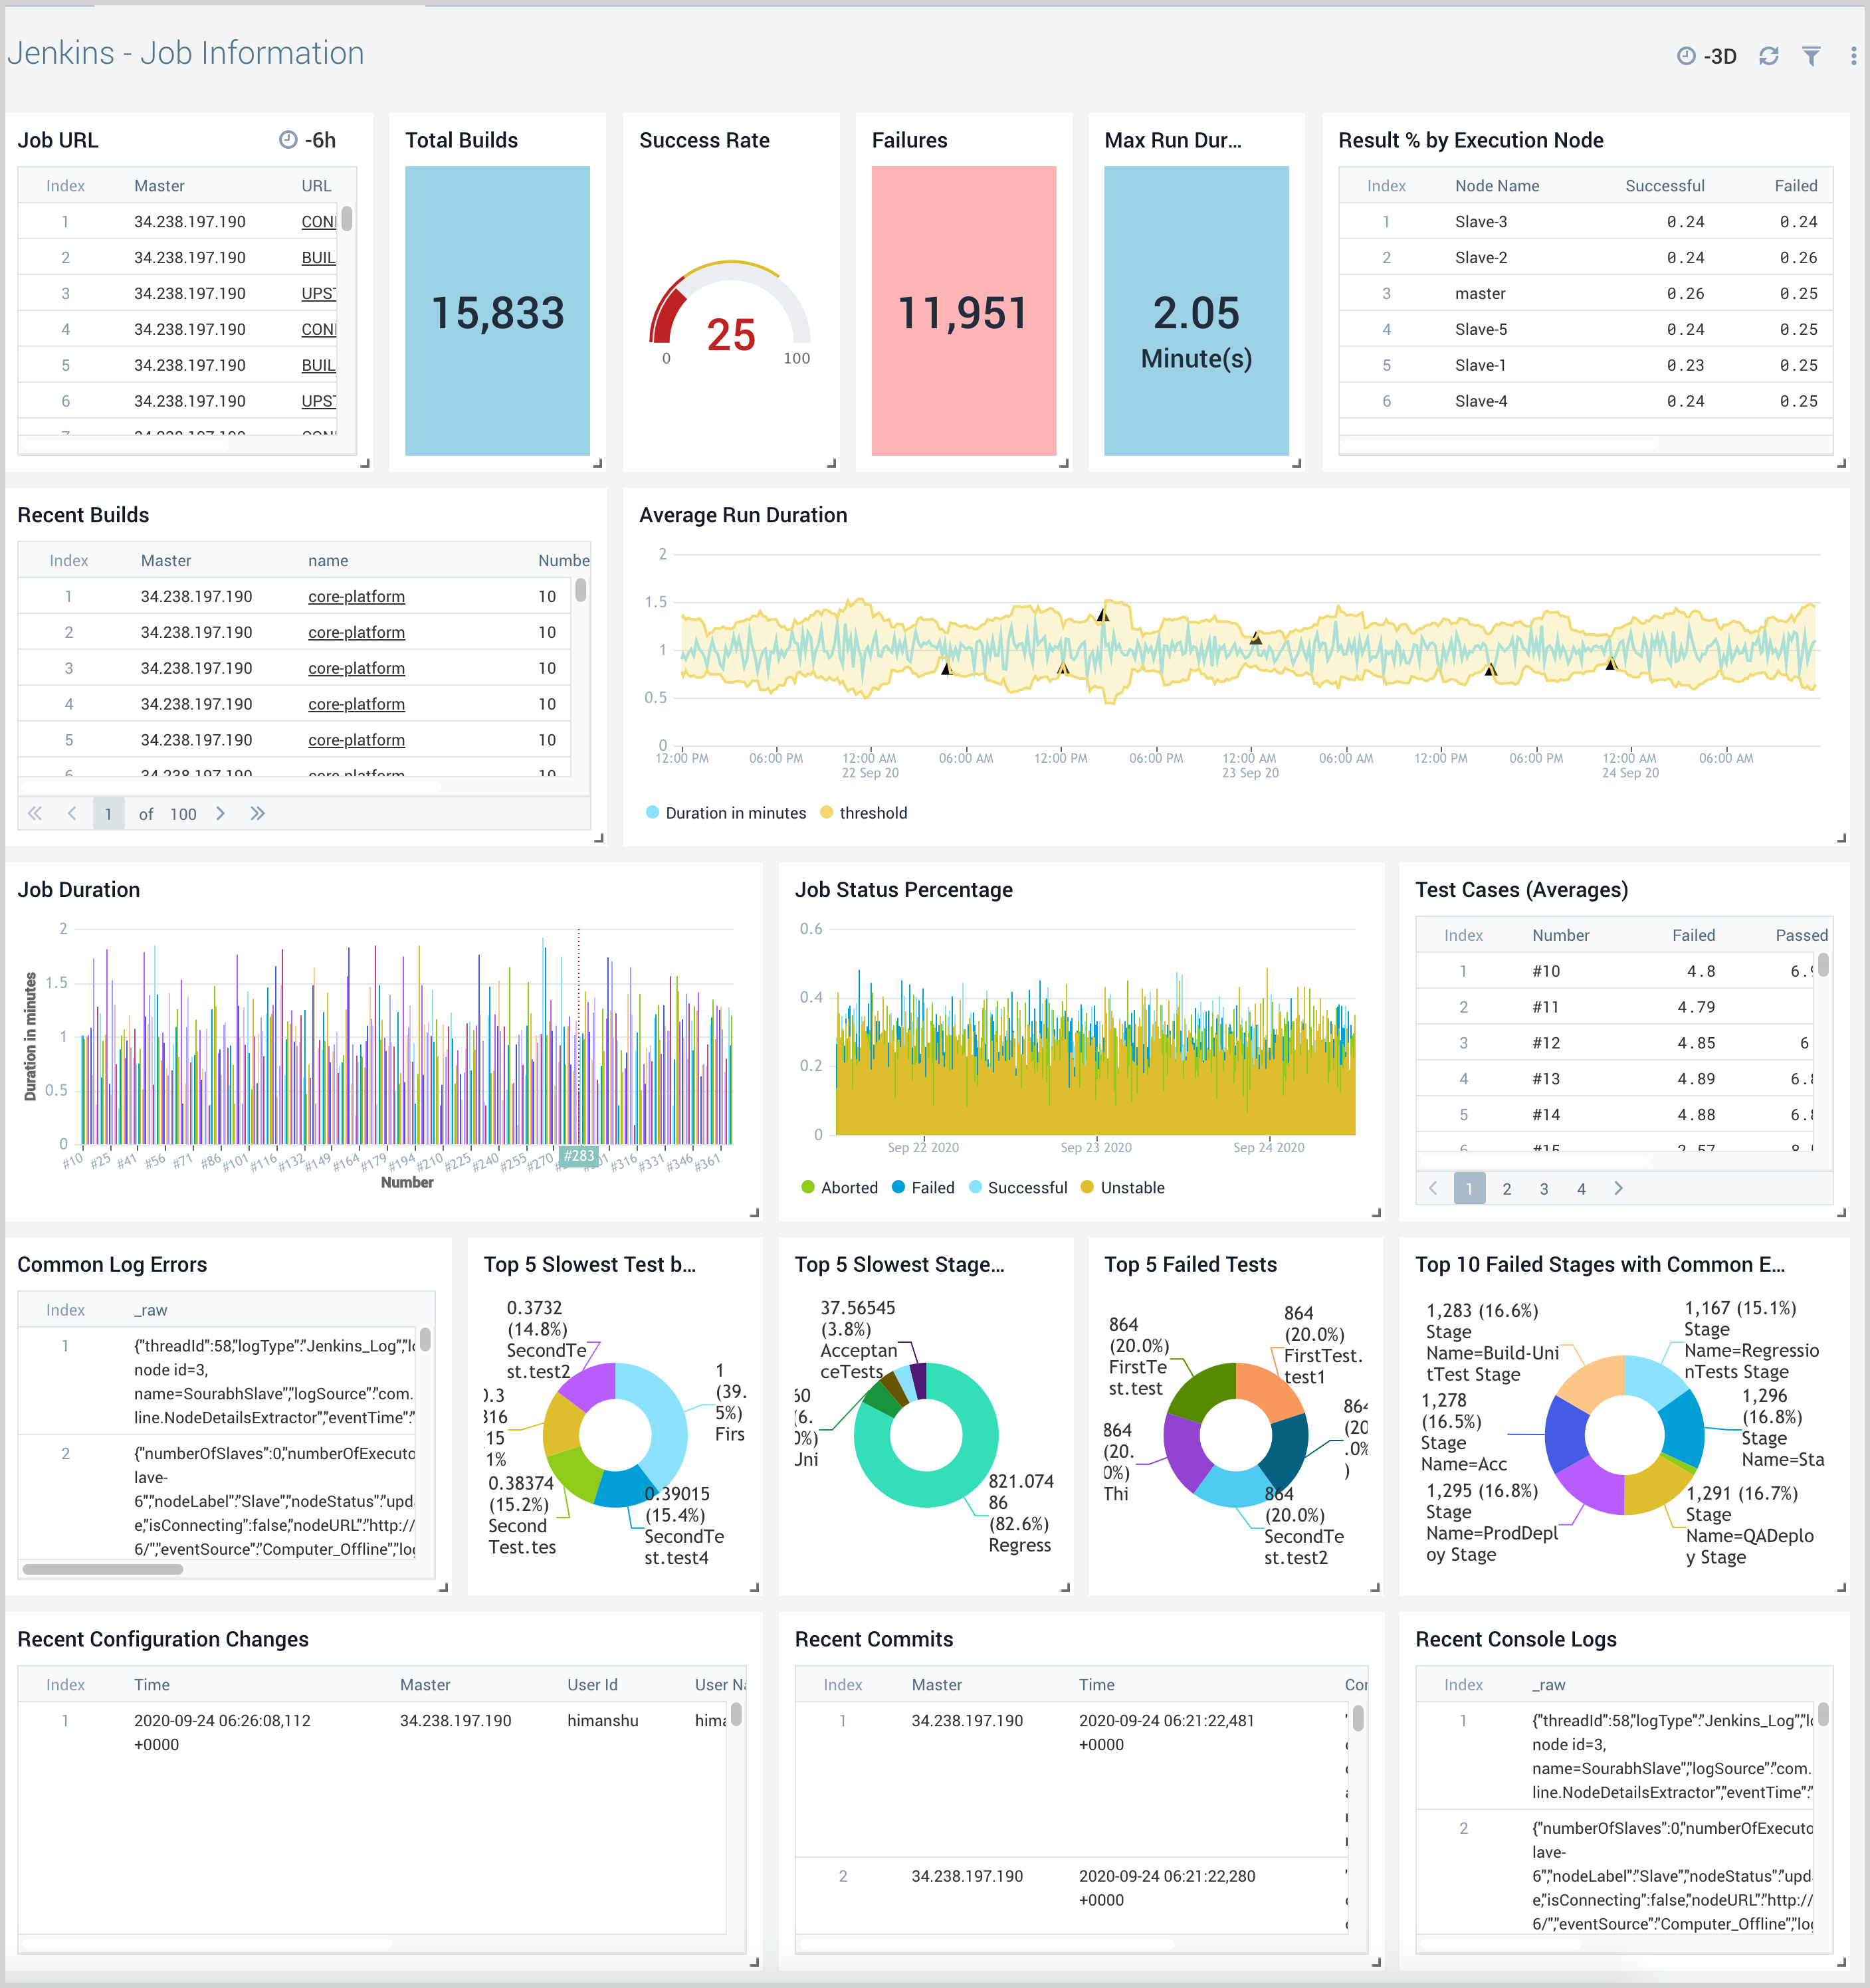
Job Information
The Jenkins - Job Information dashboard provides detailed information about a specific job. Panels show information on job URLs, duration trends, execution results, test case trends, slowest stages for pipeline jobs, console logs, and common errors.
Use this dashboard to:
- Monitor the total number of builds, successful builds, duration and failed builds for the job in question to understand how to best improve its execution going forward.
- Drilldown to Jenkins build information as needed.
- Investigate common errors using console logs.
- Investigate common stage failures.
- Monitor recent configuration changes and commits to identify potential causes of failure.
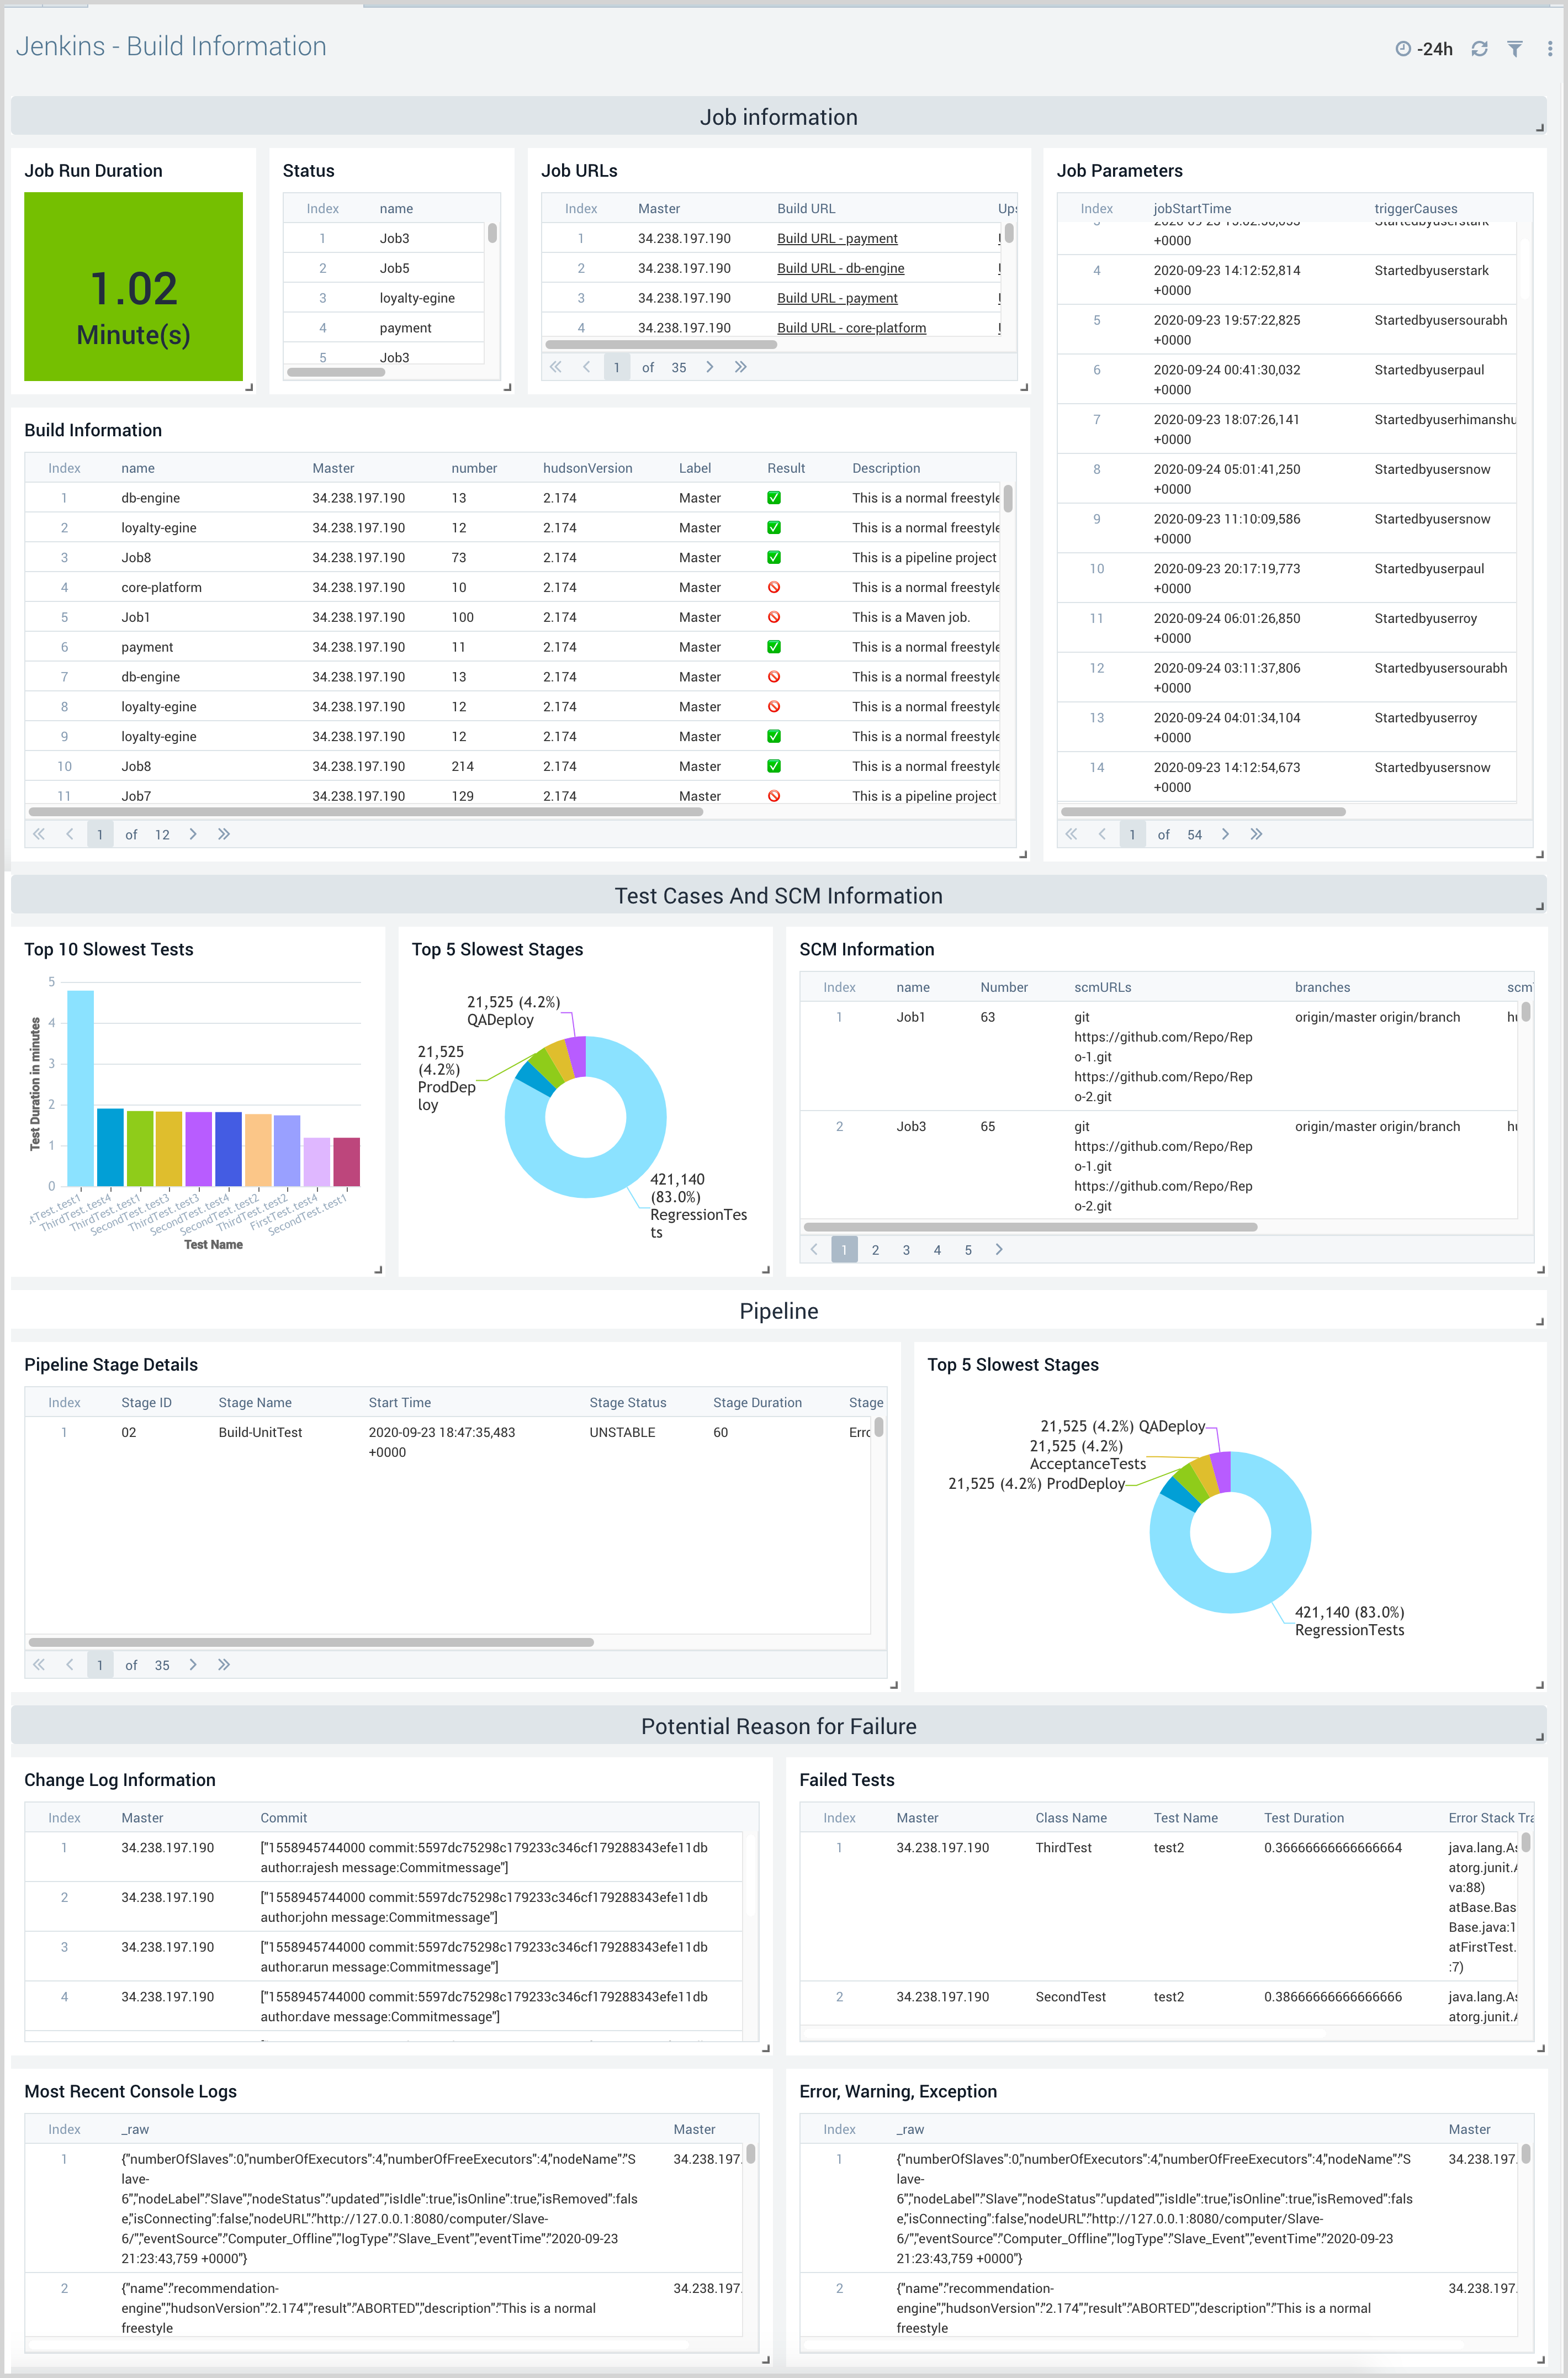
Build Information
The Jenkins - Build Information dashboard provides detailed information about a specific build. Panels show information on build parameters, source control management, commit details, test cases, pipeline stages, console logs, and configuration changes prior to a build.
Use this dashboard to:
- Monitor parameters used for the build and source control management, such as GitHub Repository, to understand recent commits that have been added to the build.
- Investigate possible causes for build failure using configuration change before build details, test case failure, commit changes, pipeline stage failure, and console logs.
- Investigate the cause for failed test cases by analyzing stack traces.
- Investigate configuration changes before the build by comparing the old configuration and current configurations.
- Identify command failure for pipeline jobs using stage and stack trace information.
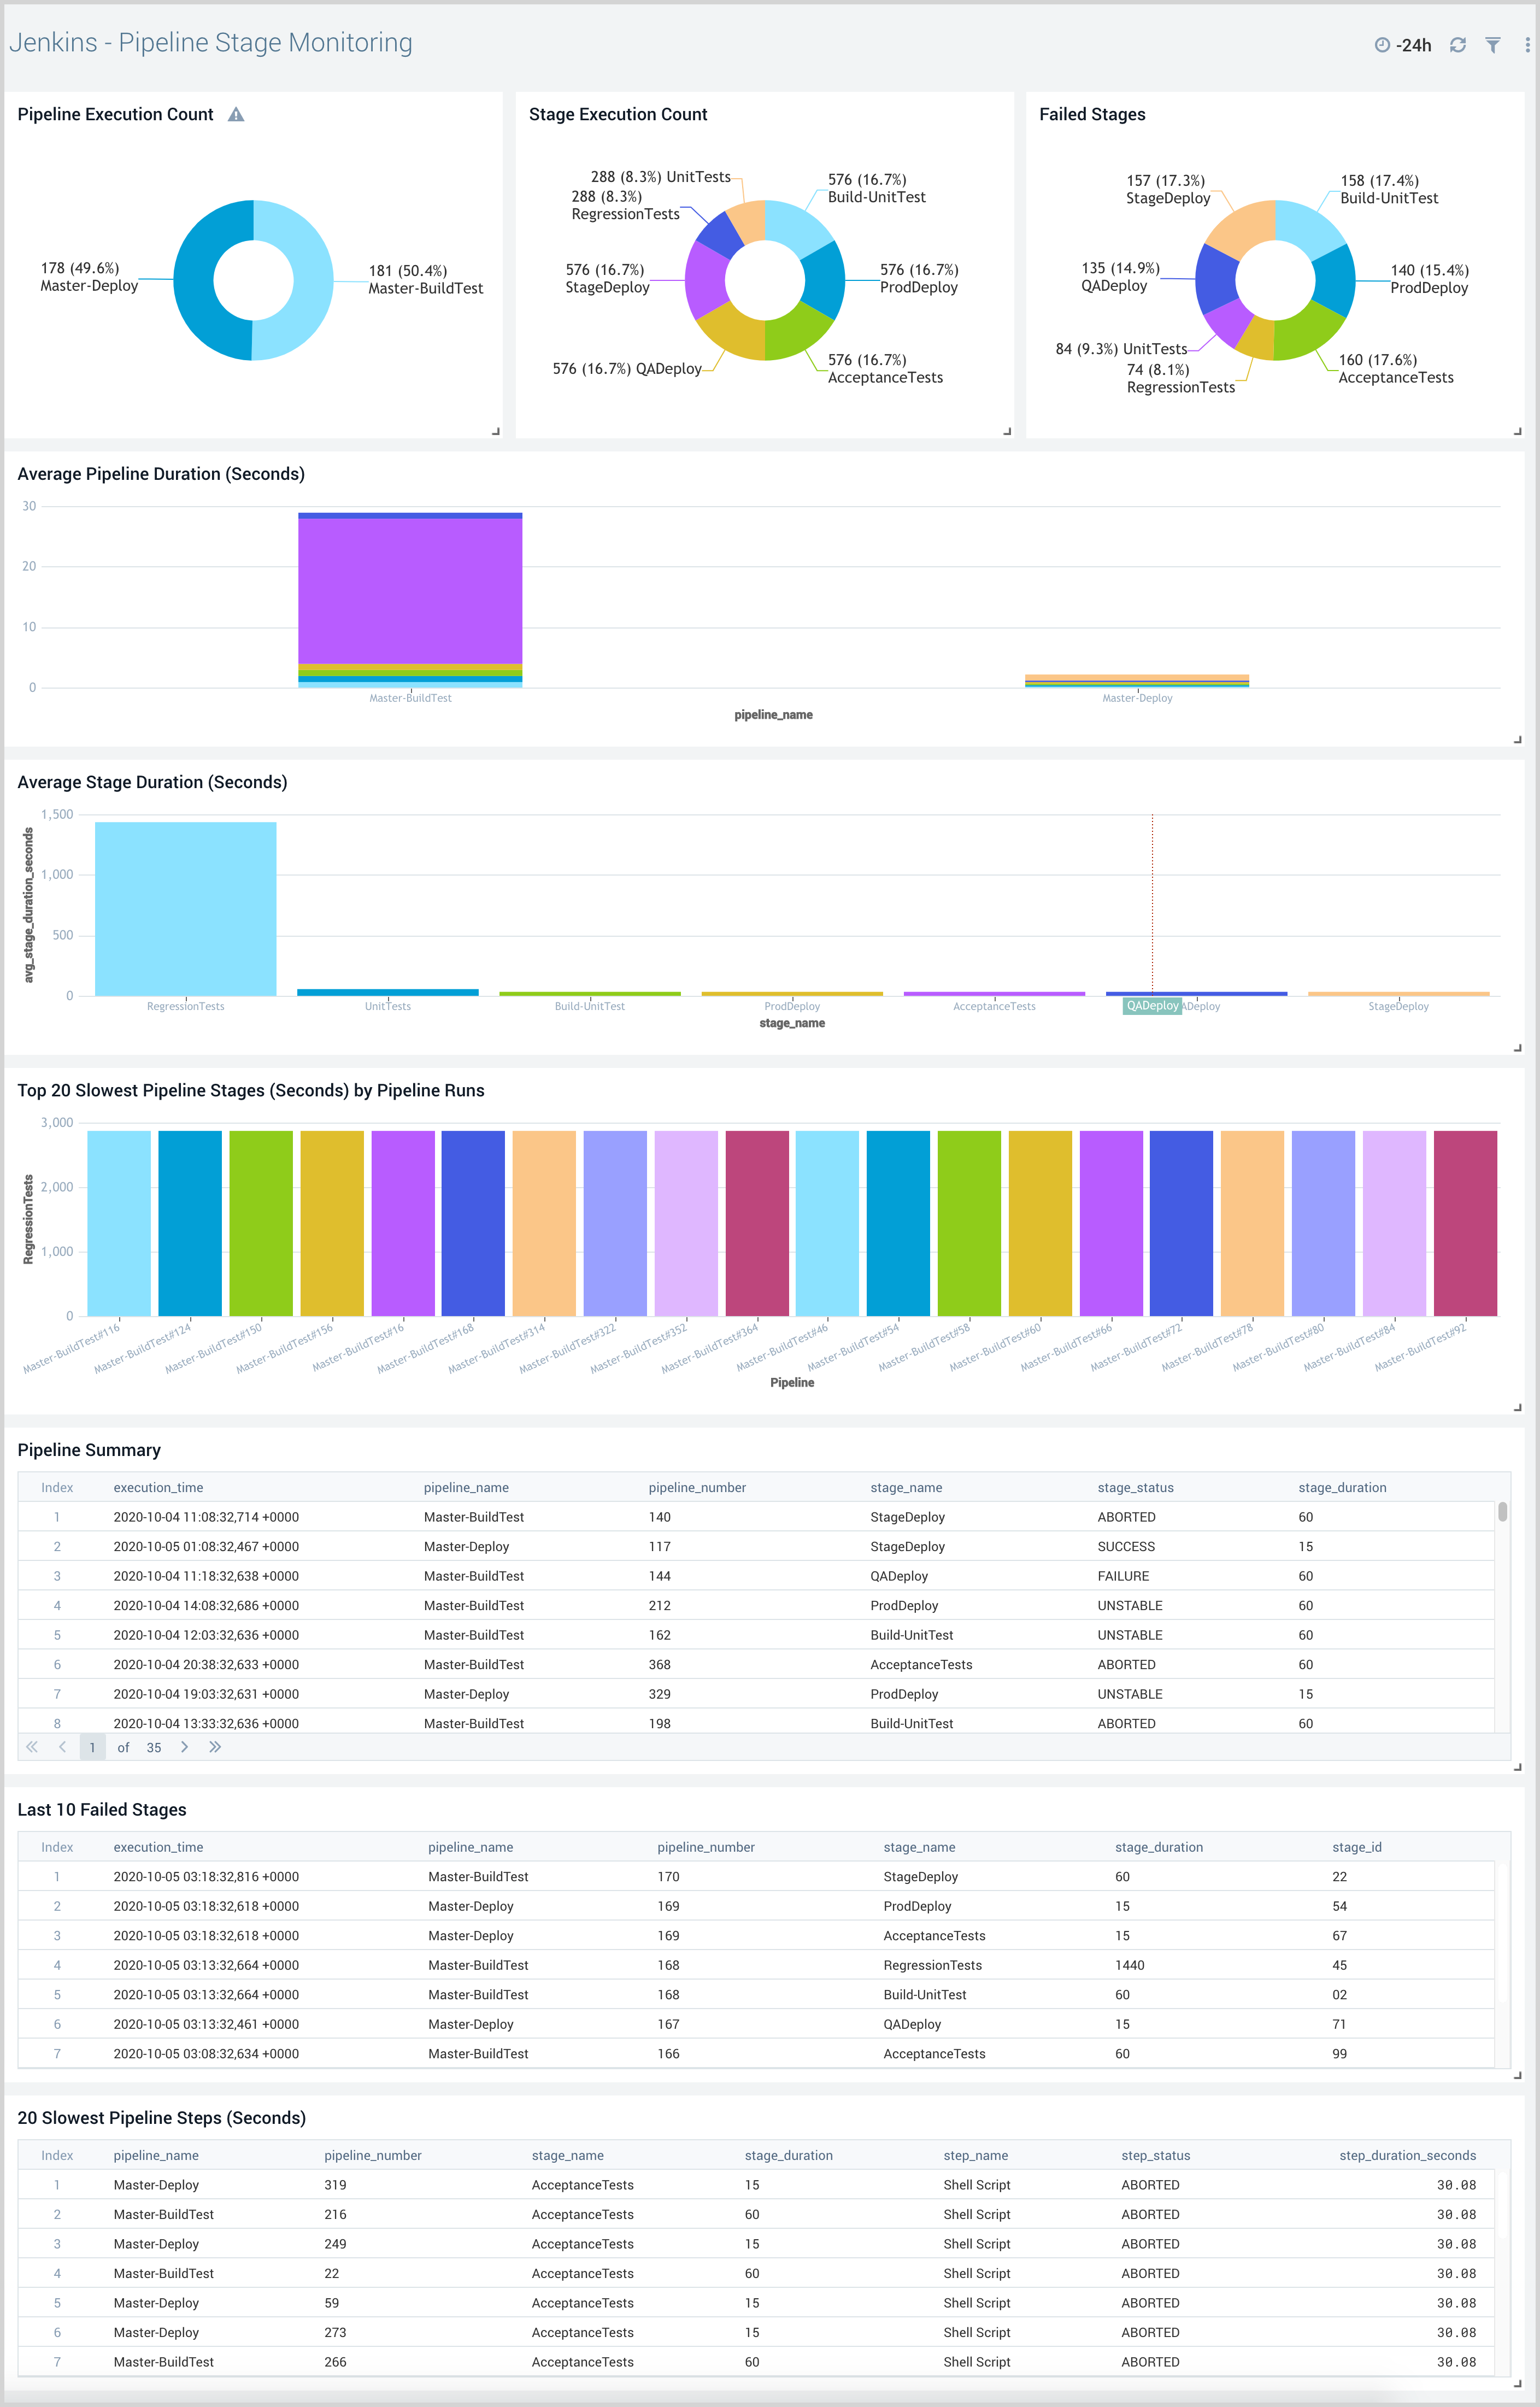
Pipeline Stage Monitoring
The Jenkins - Pipeline Stage Monitoring dashboard provides insights into pipeline performances.
Use this dashboard to:
- Identify which pipelines are taking the longest to complete.
- Drilldown to slowest stages and steps within each pipeline.
- Compare pipeline executions to identify which runs are slower or faster than others.
- Identify the failed pipeline stages and steps.
Upgrade/Downgrade the Jenkins app (Optional)
To update the app, do the following:
Next-Gen App: To install or update the app, you must be an account administrator or a user with Manage Apps, Manage Monitors, Manage Fields, Manage Metric Rules, and Manage Collectors capabilities depending upon the different content types part of the app.
- Select App Catalog.
- In the Search Apps field, search for and then select your app.
Optionally, you can identify apps that can be upgraded in the Upgrade available section. - To upgrade the app, select Upgrade from the Manage dropdown.
- If the upgrade does not have any configuration or property changes, you will be redirected to the Preview & Done section.
- If the upgrade has any configuration or property changes, you will be redirected to the Setup Data page.
- In the Configure section of your respective app, complete the following fields.
- Field Name. If you already have collectors and sources set up, select the configured metadata field name (eg _sourcecategory) or specify other custom metadata (eg: _collector) along with its metadata Field Value.
- Click Next. You will be redirected to the Preview & Done section.
Post-update
Your upgraded app will be installed in the Installed Apps folder and dashboard panels will start to fill automatically.
See our Release Notes changelog for new updates in the app.
To revert the app to a previous version, do the following:
- Select App Catalog.
- In the Search Apps field, search for and then select your app.
- To version down the app, select Revert to < previous version of your app > from the Manage dropdown.
Uninstalling the Jenkins app (Optional)
To uninstall the app, do the following:
- Select App Catalog.
- In the 🔎 Search Apps field, run a search for your desired app, then select it.
- Click Uninstall.