JFrog Artifactory - Classic Collector

JFrog Artifactory is a universal artifact repository manager that integrates with CI/CD and DevOps tools to provide artifact tracking. The Sumo Logic app for Artifactory 7 provides insight into your JFrog Artifactory binary repository. Our preconfigured dashboards provide an overview of your system as well as Traffic, Requests and Access, Download Activity, Cache Deployment Activity, and Non-Cached Deployment Activity.
If you do not have a Sumo Logic account and want to get up and running quickly, the JFrog Artifactory Sumo Logic integration is the most convenient way to get started. It allows you to access Sumo Logic directly from Artifactory.
If you have an existing Sumo Logic account, you can still use the integration, however, this will create a secondary Sumo Logic account. To use your existing account, install the Sumo Logic app for Artifactory instead of the integration and access your Artifactory data from Sumo Logic, rather than your Artifactory instance.
Prerequisites
- If you're using Artifactory Online, you'll need use the integration (our app is not compatible with Artifactory Online).
- If you're using Artifactory On-Premise, you can use our app or the integration.
Artifactory 7
This procedure documents how to collect logs from JFrog Artifactory 7 into Sumo Logic.
Log types
For each JFrog service, you will find its active log files in the $JFROG_HOME/<product>/var/log directory. For consistency, each log file is prefixed by its service name and a dash, <service-name>-service.log. For example, artifactory-service.log and router-request.log.
artifactory-service.logartifactory-access.logartifactory-request.logartifactory-traffic.*.log
For more information, see JFrog's Artifactory Log Files and Access Logs documentation.
Sample log messages
20201322001341|d29f485ce89ehh3i|0|DOWNLOAD|167.208.229.190
|libs-release:org/springframework/spring-tx/maven-metadata.xml.sha1|117127
20201222001254|g104521a2b42cc3l|176.164.175.181|nitin|GET|/milestone/org/freemarker
/freemarker/maven-metadata.xml|404|761|86|1|curl/7.54.0
2020-13-22 00:13:33,014 [ACCEPTED DEPLOY]
jcenter-cache:com/cloudera/cdh/cdh-root/5.4.4-SNAPSHOT/maven-metadata.xml for client :
admin/149.5.95.40.
Sample queries
_sourceCategory = Labs/artifactory/*
| where _sourceCategory matches "*artifactory/request"
| parse "*|*|*|*|*|*|*|*|*|*|*" as datetime, traceid, ip, user, method, path, status_code, response_size, request_size, response_time, user_agent
| where !(path matches "/ui*" ) and !(path matches "/webapp*")
| parse regex field=path "/(?<repo>[^\/]+).*" nodrop
| parse regex field=path "(?<with_api>/api/(?:(?:npm|ruby|deb|docker|vcs|bower|pypi)/|))(?<repo>[^\/]+)"
| count as count by repo
| sort by count
_sourceCategory = Labs/artifactory/* "login" DENIED
| where _sourceCategory matches "*artifactory/access"
| parse " [*] *" as event_type, user_info
| parse regex field=user_info "\s*for\s*\w+\s*:\s*(?<user>[^\/]+)\s*\/\s*(?<ip>\d{1,3}\.\d{1,3}\.\d{1,3}\.\d{1,3})\."| where event_type = "DENIED LOGIN"
| count as Attempts by ip, user
| sort by Attempts
_sourceCategory = Labs/artifactory/*
| where _sourceCategory matches "*artifactory/traffic"
| parse regex "(?<year>\d{4})(?<month>\d{2})(?<day>\d{2})(?<hour>\d{2})(?<minute>\d{2})(?<second>\d{2})\|(?<traceid>\w+)\|\d*\|(?<direction>[^|]*)\|\s*(?<ip>\d{1,3}\.\d{1,3}\.\d{1,3}\.\d{1,3}|[^|]*)\|(?<repo>[^:]*):(?<fullfilepath>[^|]*)\|(?<size>\d*)" nodrop
| where !isNull(ip) and ip != ""
| count as actions by ip
| lookup country_name, region, city from geo://location on ip = ip
| fields country_name, region, city, actions
| sort by actions | limit 10
Collecting logs
Step 1: Activate the traffic.log file
- To activate the traffic.log file, add the following parameter to your artifactory.system.properties file, located under $ARTIFACTORY/etc:
$JFROG_HOME/artifactory/var/etc/artifactory/artifactory.system.properties - A restart is required for traffic collection to take effect.
Step 2: Configure a collector
Configure an Installed Collector.
Step 3: Configure sources
In this step, you configure four local file sources, one for each log source listed in the table below. When you create a file source for a log type:
- Use the value from the File Path column below as the File Path for the source.
- The value you specify for the source's Source Category must end with the suffix shown below in the Source Category column. For example, you could set the Source Category for the Artifactory Server log source to be
foo/artifactory/console, but notartifactory/console/foo.
The following suffixes are required. For example, you could use _sourceCategory=<Foo>/artifactory/console, but the suffix artifactory/console must be used.
| Log source | File Path | Source Category |
|---|---|---|
| Artifactory Server and other microservices | $JFROG_HOME/<product>/var/log/artifactory-service.log | artifactory/console |
| Access | $JFROG_HOME/artifactory/var/artifactory/log/artifactory-access.log. | artifactory/access |
| Request | $JFROG_HOME/<product>/var/log/artifactory-request.log | artifactory/request |
| Traffic | $JFROG_HOME/<product>/var/log/artifactory-traffic.*.log | artifactory/traffic |
Remember that _sourceCategory names are case sensitive. When you run a search using _sourceCategory, make sure you use the same case as you did when configuring the source.
For complete instructions, see Local File Source.
- Configure a Local File source.
- Configure the Source fields:
- Name (required). A name is required.
- Description (optional).
- Source Category. (required)
- Configure the Advanced section:
- Enable Timestamp Parsing. True.
- Time Zone. Logs are in UTC by default.
- Timestamp Format. Auto Detect.
- Encoding Type. UTF-8.
- Multi-line Parsing. Detect Messages Spanning Multiple Lines, Infer Boundaries.
- Click Save.
Artifactory Online Sumo Logic integration
The JFrog Artifactory Sumo Logic integration provides the ability to access preconfigured Sumo Logic Dashboards directly from Artifactory that will allow you to analyze data from your Artifactory logs.
If you do not have an existing Sumo Logic account, enable the JFrog Artifactory Sumo Logic integration directly from Artifactory. When you enable the integration, a Sumo Logic Connector and Source get automatically configured, and the Sumo Logic App for Artifactory gets installed automatically. The JFrog Artifactory Sumo Logic integration provides a new Sumo Logic Free account with a daily data volume limit of 500MB per day, with 30 users and 14 days of data retention.
If you have an existing Sumo Logic account, you can configure Artifactory Online to send data (described below) to an existing Sumo Logic HTTP Logs and Metrics source.
Collect Artifactory logs
The integration collects data from the following Artifactory logs:
- artifactory.log. The main Artifactory log file that contains data on Artifactory server activity.
- access.log. The security log containing important information about accepted and denied requests, configuration changes, and password reset requests. For each event, the originating IP address gets recorded.
- request.log. Generic HTTP traffic information similar to the Apache HTTPd request log.
- traffic.*.log. A log containing information about site traffic and file sizes.
For more details about Artifactory logs, refer to JFrog's Artifactory Log Files.
Enable the integration
- Log in to JFrog Artifactory.
- Click the gear icon, then click Artifactory.
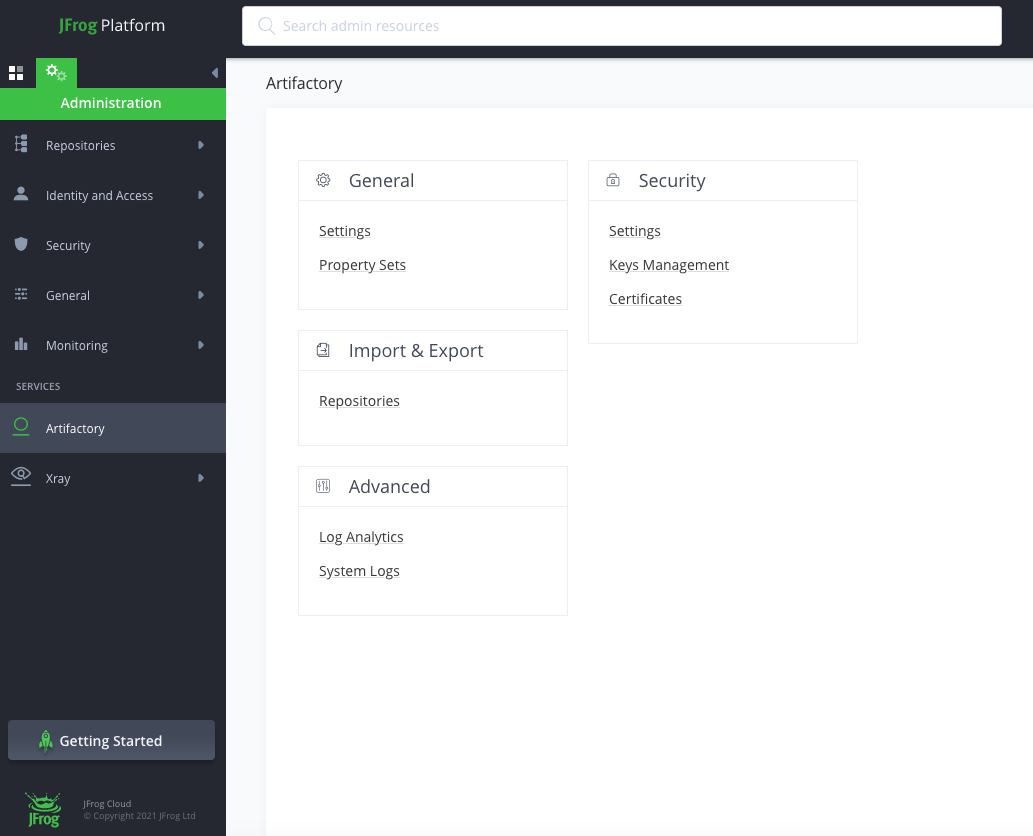
- Select Log Analytics.
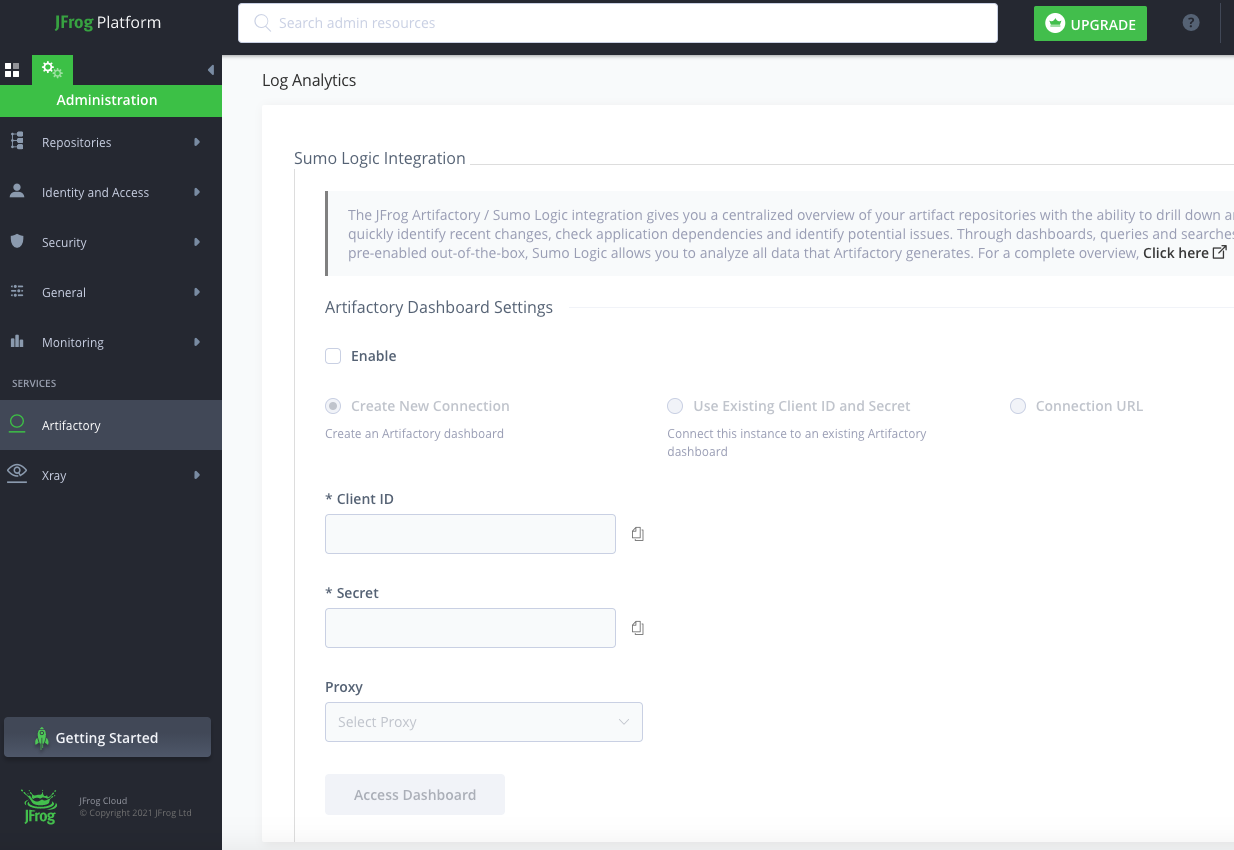
- In the dialog Enable Sumo Logic Integration, click Enable.
If you do not have a Sumo Logic account
If you do not have an existing Sumo Logic account and it is your first time here:
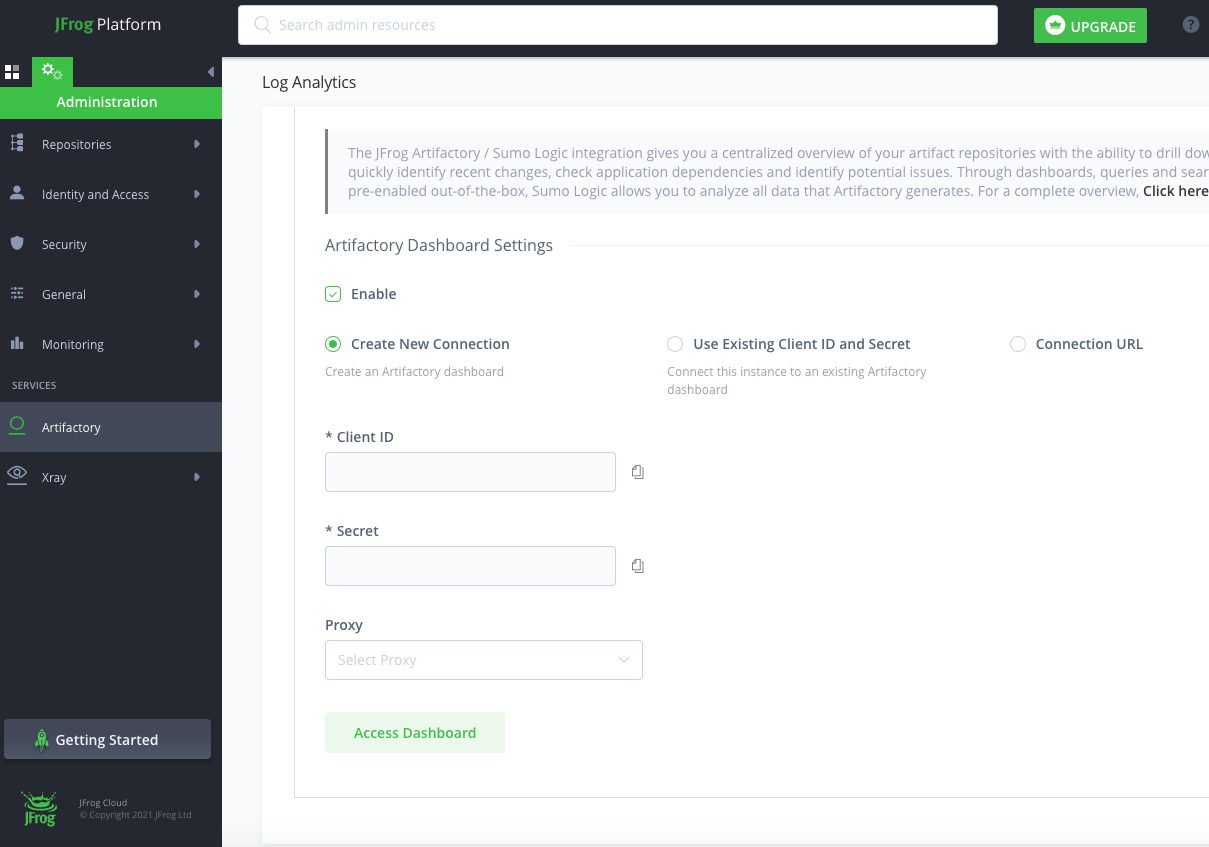
- Select Create New Connection.
- Click Access Dashboard.
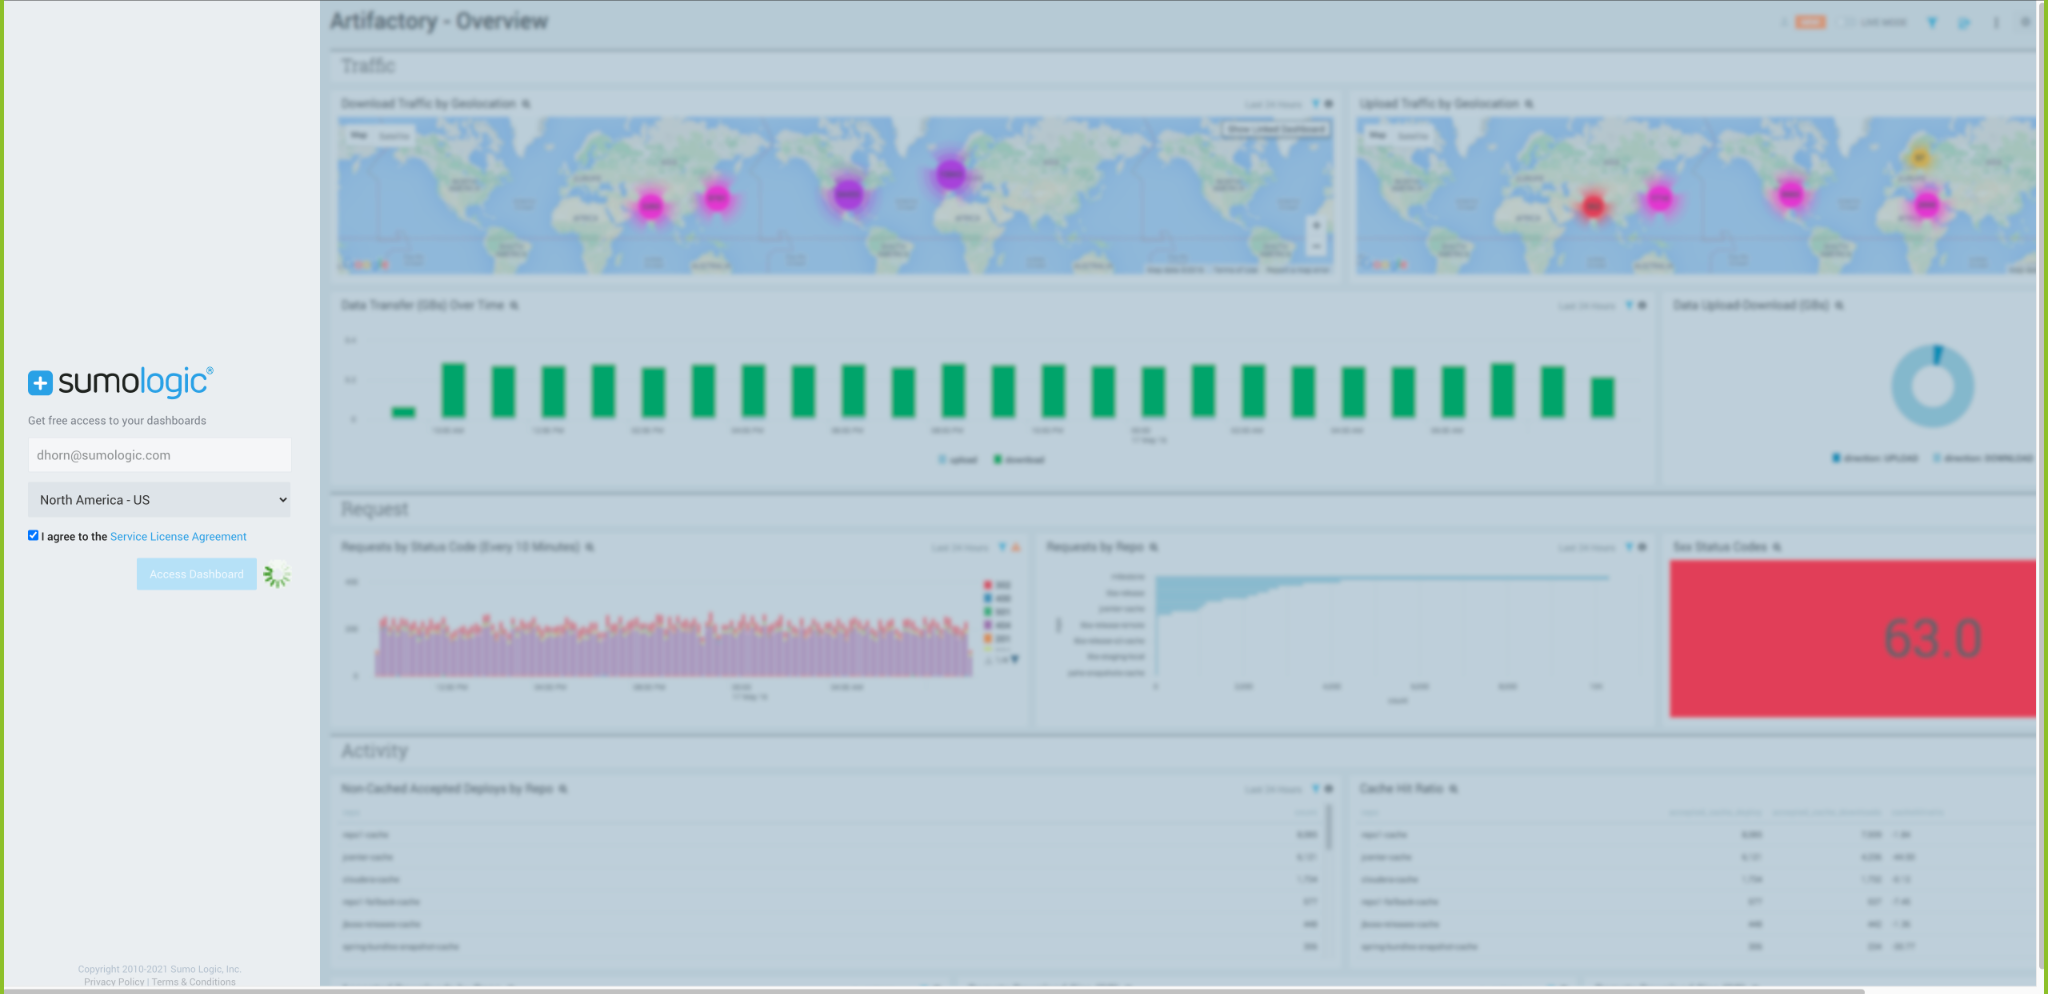
- When the Sumo Logic page appears, select I agree to the Service License Agreement, and click Access Dashboard.
- When you see the message Your Dashboards are being populated, click OK, Got It.
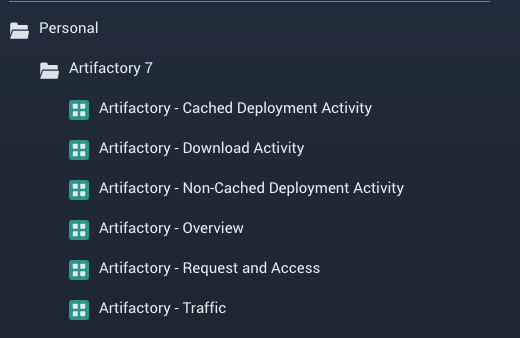
- To access your Artifactory dashboards, click Library > Personal > Artifactory 7.
If you have a Sumo Logic account
If you already have an existing Sumo Logic account created outside of Artifactory Online:
- Select Connection URL and copy and paste the URL of an existing Sumo Logic HTTP Logs and Metrics Source in the Connection URL text box.
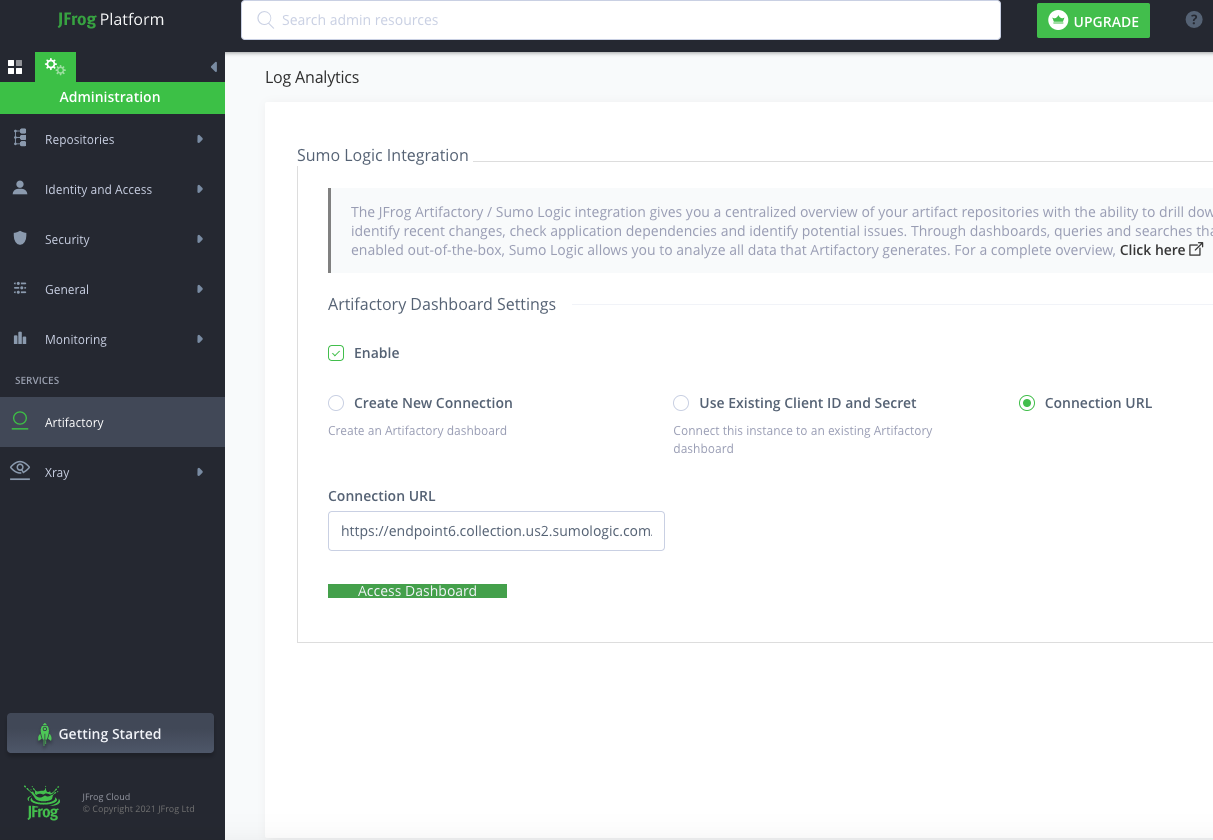
- Sign in to Sumo Logic and verify that your logs are flowing in as expected.
- Go to our Apps Catalog, search for Artifactory, then install the Sumo Logic app for Artifactory 7 to get instant insight into your Artifactory logs.
If you have an existing connection
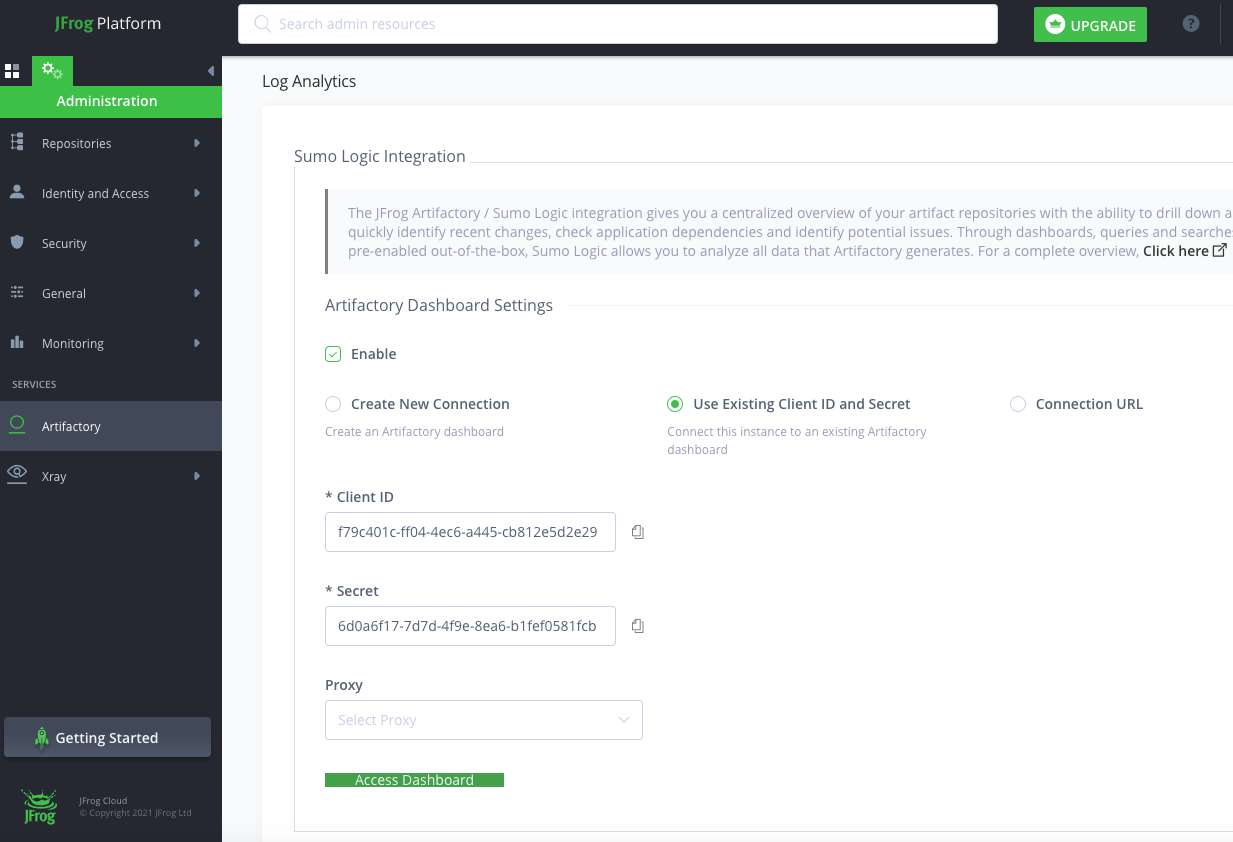
If you already have an existing connection set up via Artifactory Online:
- The Use Existing Client ID and Secret radio button is selected, and keys will pre-populate automatically based on your previous configuration.
- Click Access Dashboards to view Dashboards as you did before.
Field Extraction Rules
Here are Artifactory extraction rules that use different approaches.
_sourceCategory=*artifactory*
| where _sourceCategory matches "*artifactory/traffic"
| parse regex "(?<year>\d{4})(?<month>\d{2})(?<day>\d{2})(?<hour>\d{2})(?<minute>\d{2})(?<second>\d{2})\|\d*\|(?<direction>[^|]*)\|\s*(?<ip>\d{1,3}\.\d{1,3}\.\d{1,3}\.\d{1,3}|[^|]*)\|(?<repo>[^:]*):(?<fullfilepath>[^|]*)\|(?<size>\d*)" nodrop
_sourceCategory=*artifactory*
| where _sourceCategory matches "*artifactory/access"
| parse "[*] *:* for */*" as what, repo, path, user, ip
_sourceCategory=*artifactory*
| where _sourceCategory matches "*artifactory/request"
| parse "*|*|*|*|*|*|*|*|*|*" as datetime, response_time, type, ip, user, method, path, protocol, status_code, size
Installing the Artifactory app
Now that you have set up collection, install the Sumo Logic app for Artifactory to use the pre-configured searches and Dashboards that provide insight into your data.
To install the app, do the following:
Next-Gen App: To install or update the app, you must be an account administrator or a user with Manage Apps, Manage Monitors, Manage Fields, Manage Metric Rules, and Manage Collectors capabilities depending upon the different content types part of the app.
- Select App Catalog.
- In the 🔎 Search Apps field, run a search for your desired app, then select it.
- Click Install App.
note
Sometimes this button says Add Integration.
- Click Next in the Setup Data section.
- In the Configure section of your respective app, complete the following fields.
- Field Name. If you already have collectors and sources set up, select the configured metadata field name (eg _sourcecategory) or specify other custom metadata (eg: _collector) along with its metadata Field Value.
- Click Next. You will be redirected to the Preview & Done section.
Post-installation
Once your app is installed, it will appear in your Installed Apps folder, and dashboard panels will start to fill automatically.
Each panel slowly fills with data matching the time range query received since the panel was created. Results will not immediately be available but will be updated with full graphs and charts over time.
Viewing JFrog Artifactory dashboards
All dashboards have a set of filters that you can apply to the entire dashboard. Use these filters to drill down and examine the data to a granular level.
- You can change the time range for a dashboard or panel by selecting a predefined interval from a drop-down list, choosing a recently used time range, or specifying custom dates and times. Learn more.
- You can use template variables to drill down and examine the data on a granular level. For more information, see Filtering Dashboards with Template Variables.
- Most Next-Gen apps allow you to provide the scope at the installation time and are comprised of a key (
_sourceCategoryby default) and a default value for this key. Based on your input, the app dashboards will be parameterized with a dashboard variable, allowing you to change the dataset queried by all panels. This eliminates the need to create multiple copies of the same dashboard with different queries.
Overview
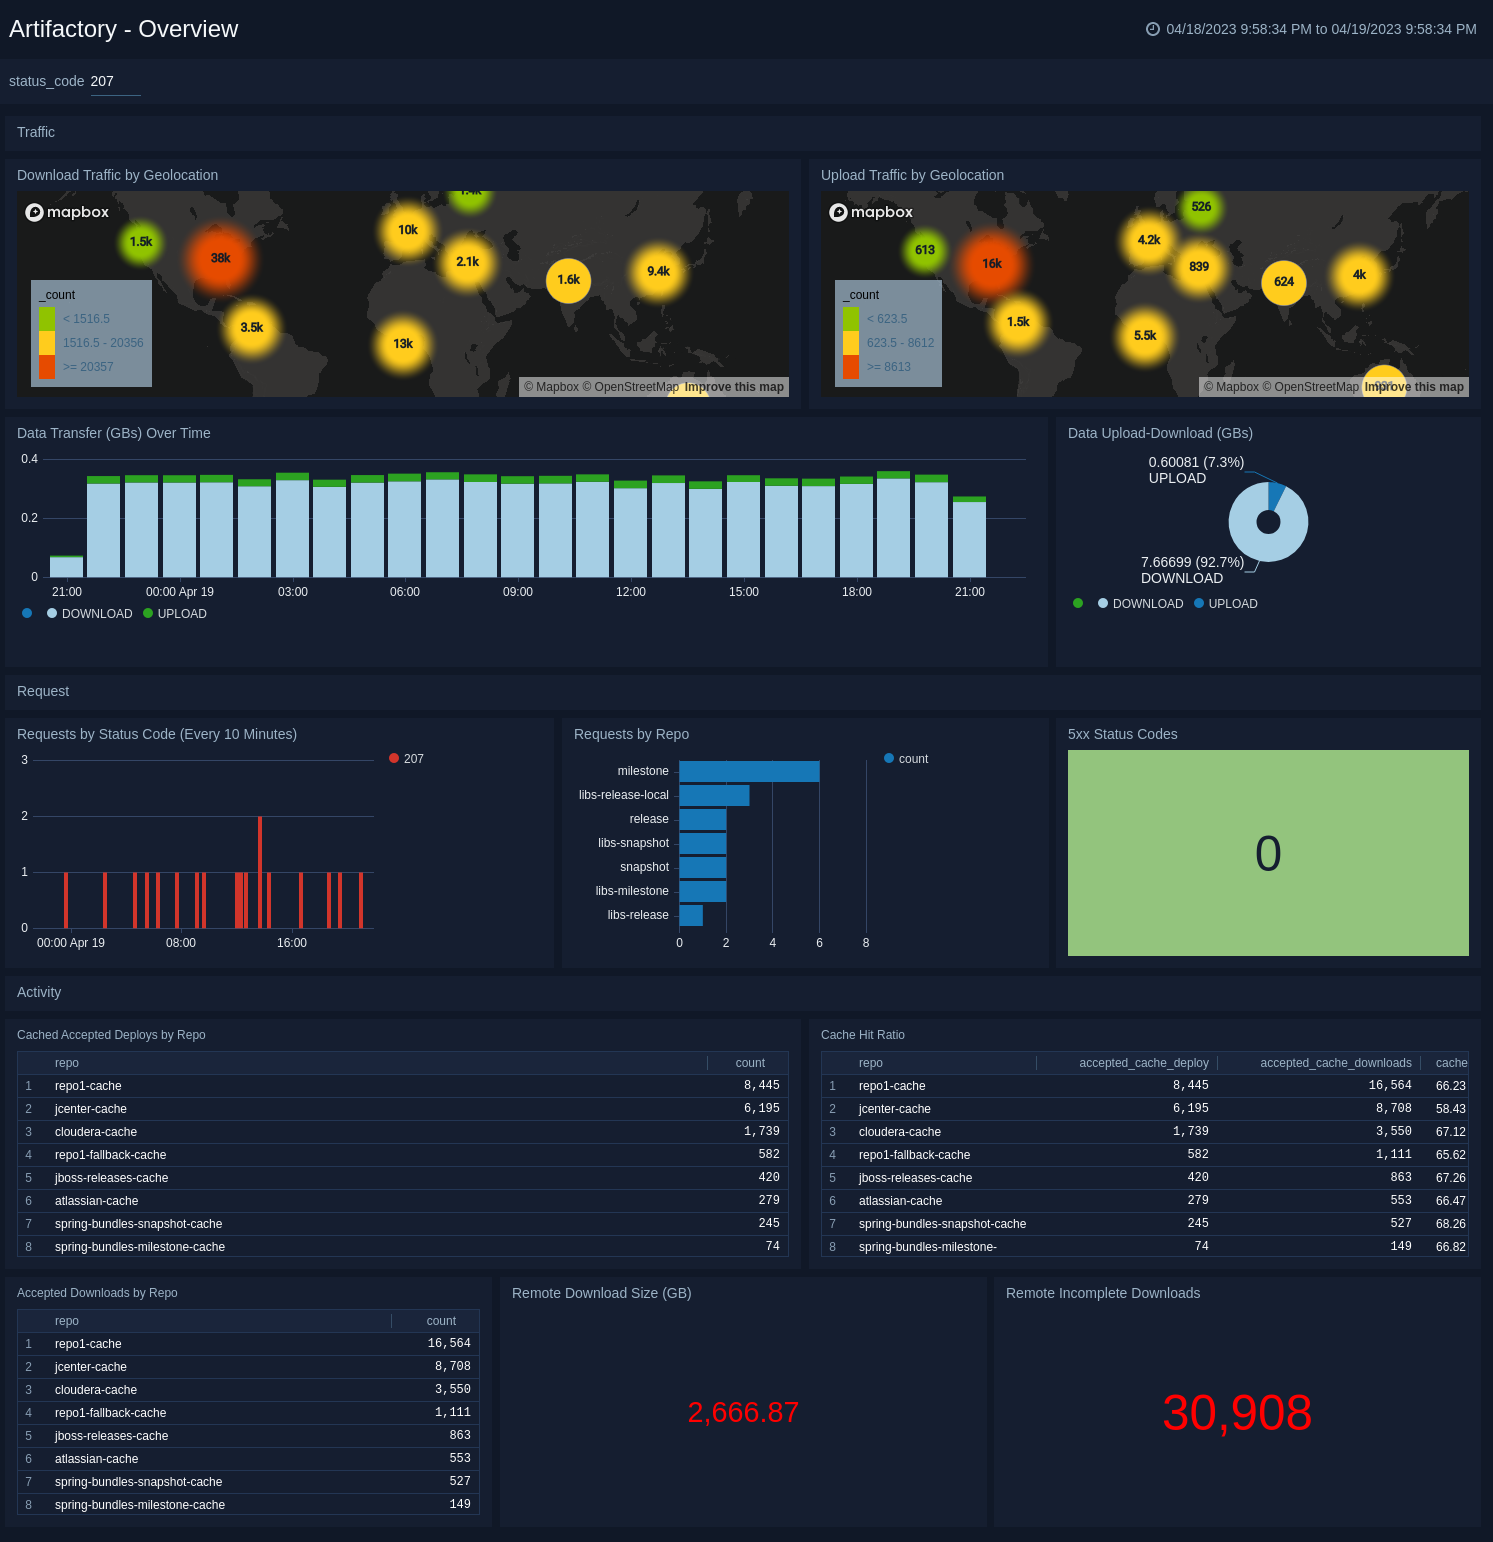
Traffic
Download Traffic by Geolocation. Uses a geo lookup operation to display download traffic by IP address on a map of the world for the last 24 hours.
Upload Traffic by Geolocation. Uses a geo lookup operation to display upload traffic by IP address on a map of the world for the last 24 hours.
Data Transfers (GBs) Over Time. Displays data transfers in GBs for uploads and downloads as a stacked column chart on a timeline for the last 24 hours.
Data Upload-Download (GBs). Compares the upload and download count in GB displayed in a pie chart for the last 24 hours.
Request
Requests by Status Code (Every 10 Minutes). Displays requests by status code every 10 minutes in a stacked column chart on a timeline for the last 24 hours.
Requests by Repo. Shows the number of requests by repo as a bar chart for the last 24 hours.
5xx Status Codes. Displays the number of 5xx status codes in a single value chart for the last 24 hours.
Activity
Non-Cached Accepted Deploys by Repo. Shows information about non-cached accepted deploys by repo in a table chart, including details on the repo and count, for the last 24 hours.
Cache Hit Ratio. Displays information on the cache hit ratio in a table chart, including details on repo, accepted cache deploy, accepted cache downloads, and cache hit ratio for the last 24 hours.
Accepted Downloads by Repo. Shows information on accepted downloads by repo including details on repo and count for the last 24 hours.
Remote Download Size (GB). Displays the remote download size in GBs as a single value chart for the last 24 hours.
Remote Incomplete Downloads. Displays the remote incomplete downloads in GB as a single value chart for the last 24 hours.
Traffic
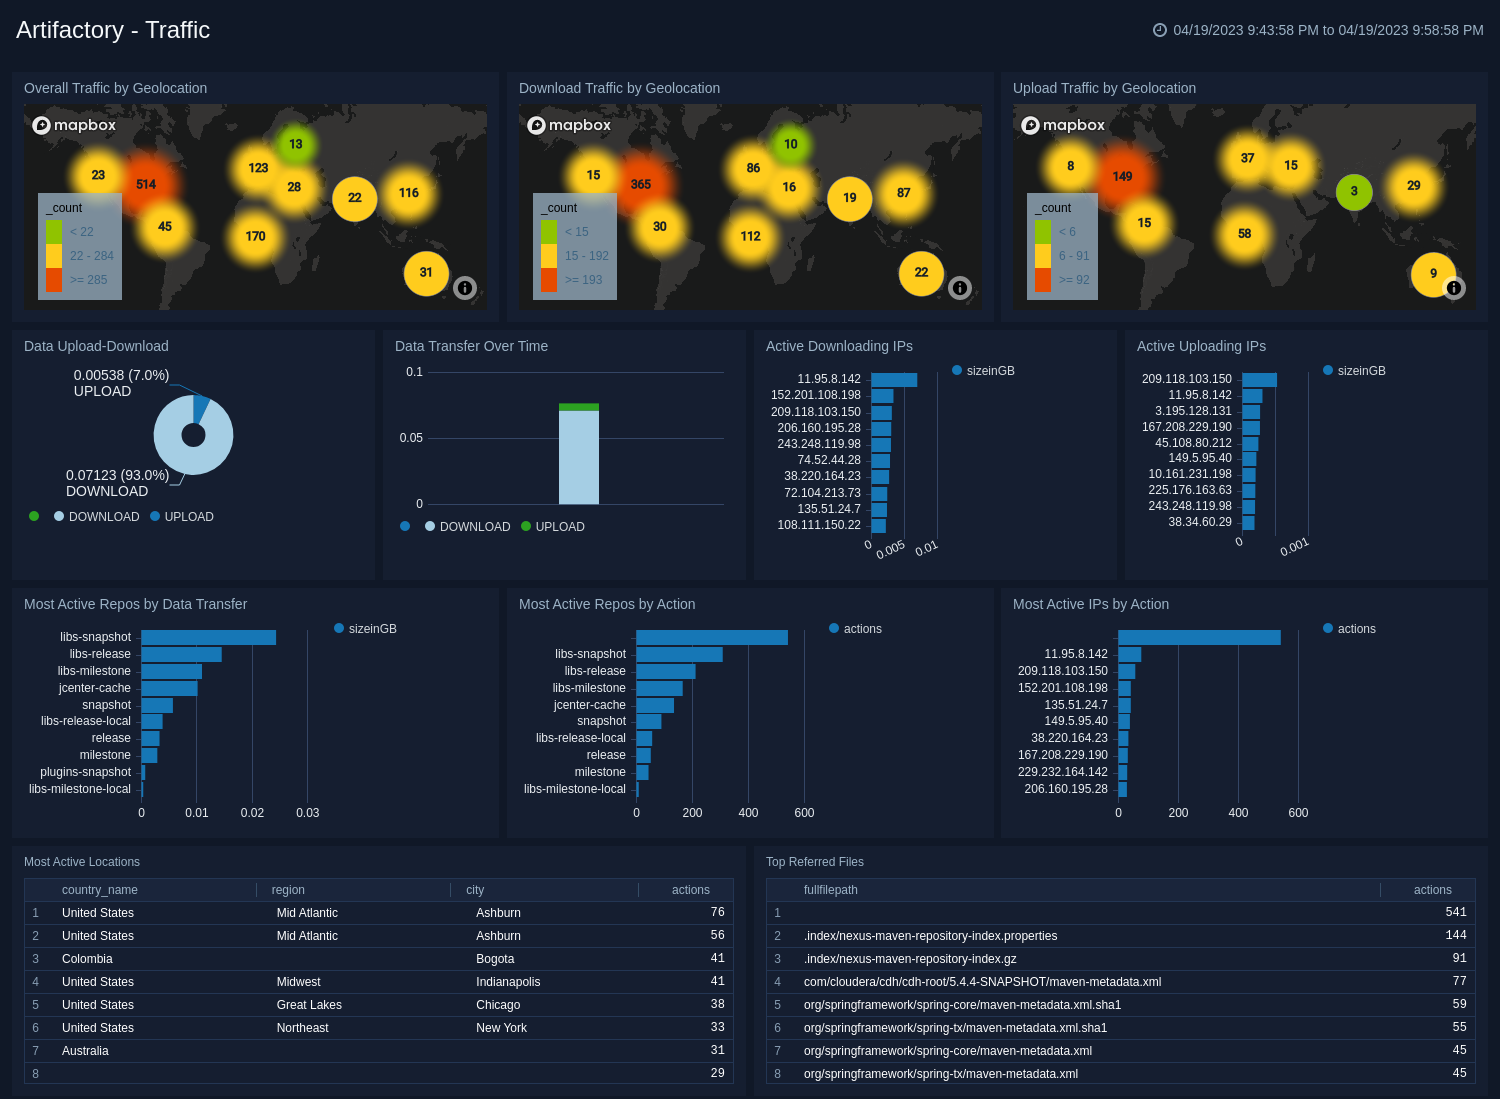
Overall Traffic by Geolocation. Uses a geo lookup operation to display overall traffic by IP address on a map of the world for the last 24 hours.
Download Traffic by Geolocation. Uses a geo lookup operation to display download traffic by IP address on a map of the world for the last 24 hours.
Upload Traffic by Geolocation. Uses a geo lookup operation to display upload traffic by IP address on a map of the world for the last 24 hours.
Data Upload-Download. Compares the upload and download count in GB displayed in a pie chart for the last 24 hours.
Data Transfer Over Time. Displays the amount of data transferred by upload and download over time as a stacked column chart on a timeline for the last 24 hours.
Active Downloading IPs. Shows the top 10 active downloading IPs in GB in a bar chart for the last 24 hours.
Active Uploading IPs. Provides the top 10 active uploading IPs in GB in a bar chart for the last 24 hours.
Most Active Repos by Data Transfer. Displays the top 10 most active repos by data transfer in GB in a bar chart for the last 24 hours.
Most Active Repos by Action. Shows the top 10 most active repos by action in GB in a bar chart for the last 24 hours.
Most Active IPs by Action. Provides information on the top 10 most active IPs by action in GB in a bar chart for the last 24 hours.
Most Active Locations. This aggregation table provides a list of the top 10 most active locations by country name, region, city, and the number of actions for the last 24 hours.
Top Referred Files. Displays a list of the top 10 referred files by file path and number of actions in an aggregation table for the last 24 hours.
Request and Access
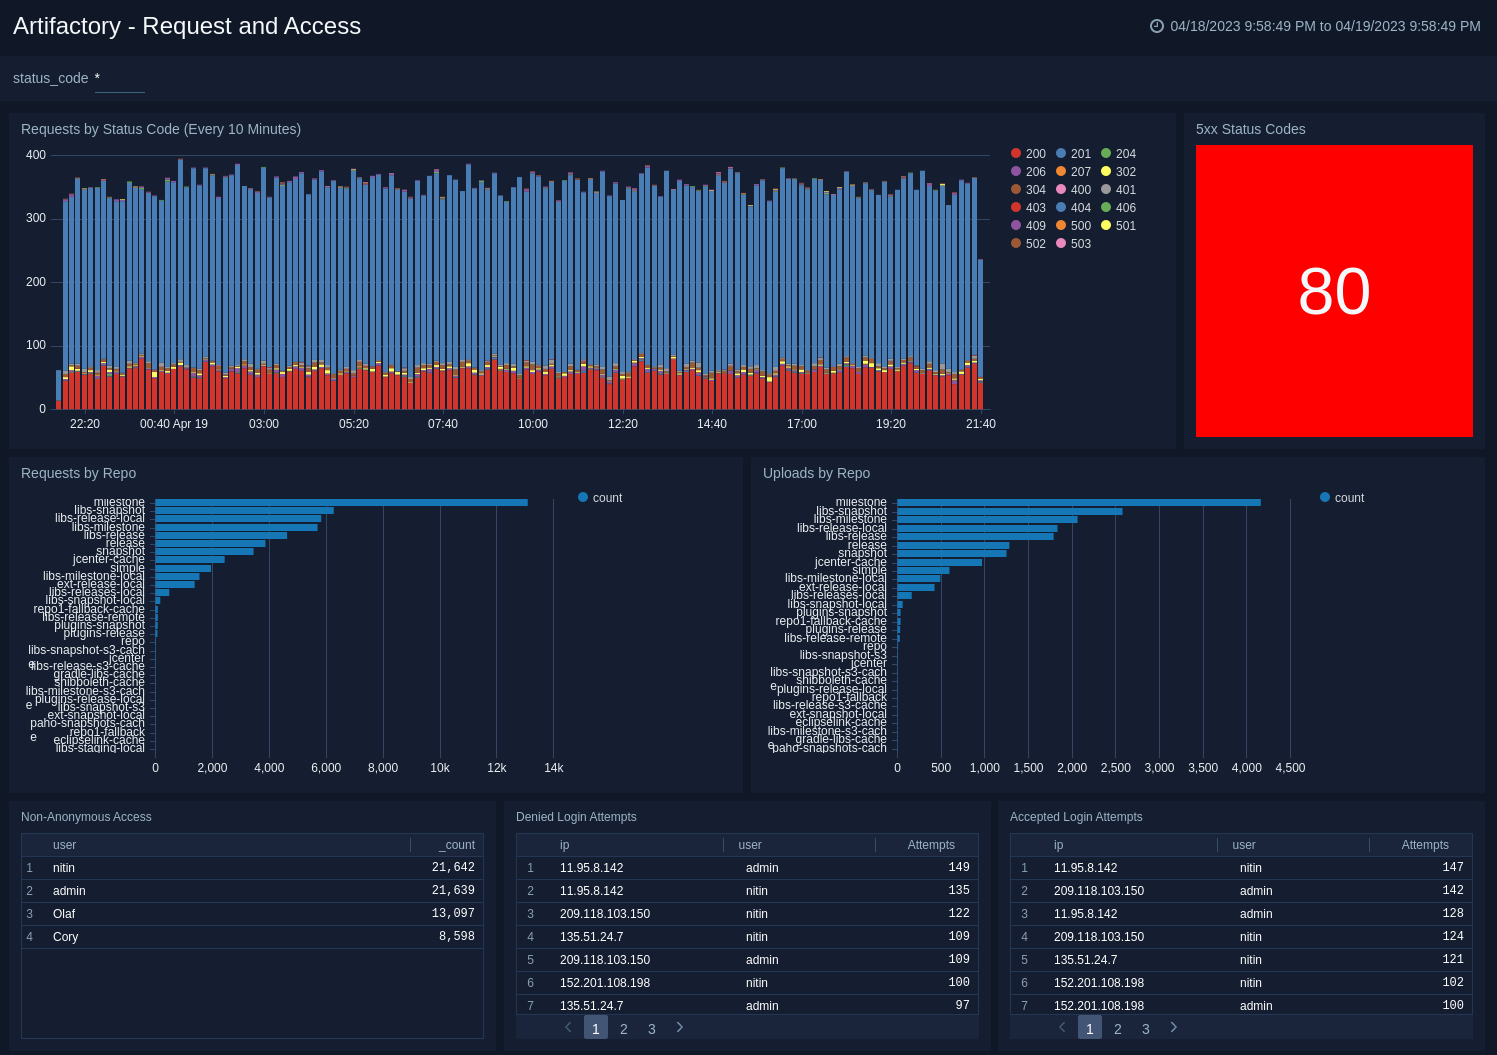
Requests by Status Code (Every 10 Minutes). Displays requests by status code every 10 minutes in a stacked column chart on a timeline for the last 24 hours.
5xx Status Codes. Provides the number of 5xx status codes in a single value chart for the last 24 hours.
Requests by Repo. Shows the number of requests by repo as a bar chart for the last 24 hours.
Uploads by Repo. Displays the number of uploads by repo as a bar chart for the last 24 hours.
Non-Anonymous Access. Displays the top 10 accepted non-anonymous access attempts in a table chart, including details on user name and count for the last 24 hours.
Denied Login Attempts. Displays the number of denied login attempts in a table chart, including details on IP address, user name, and number of attempts for the last 24 hours.
Accepted Login Attempts. Shows the number of accepted login attempts in a table chart, including details on IP address, user name, and number of attempts for the last 24 hours.
Download Activity
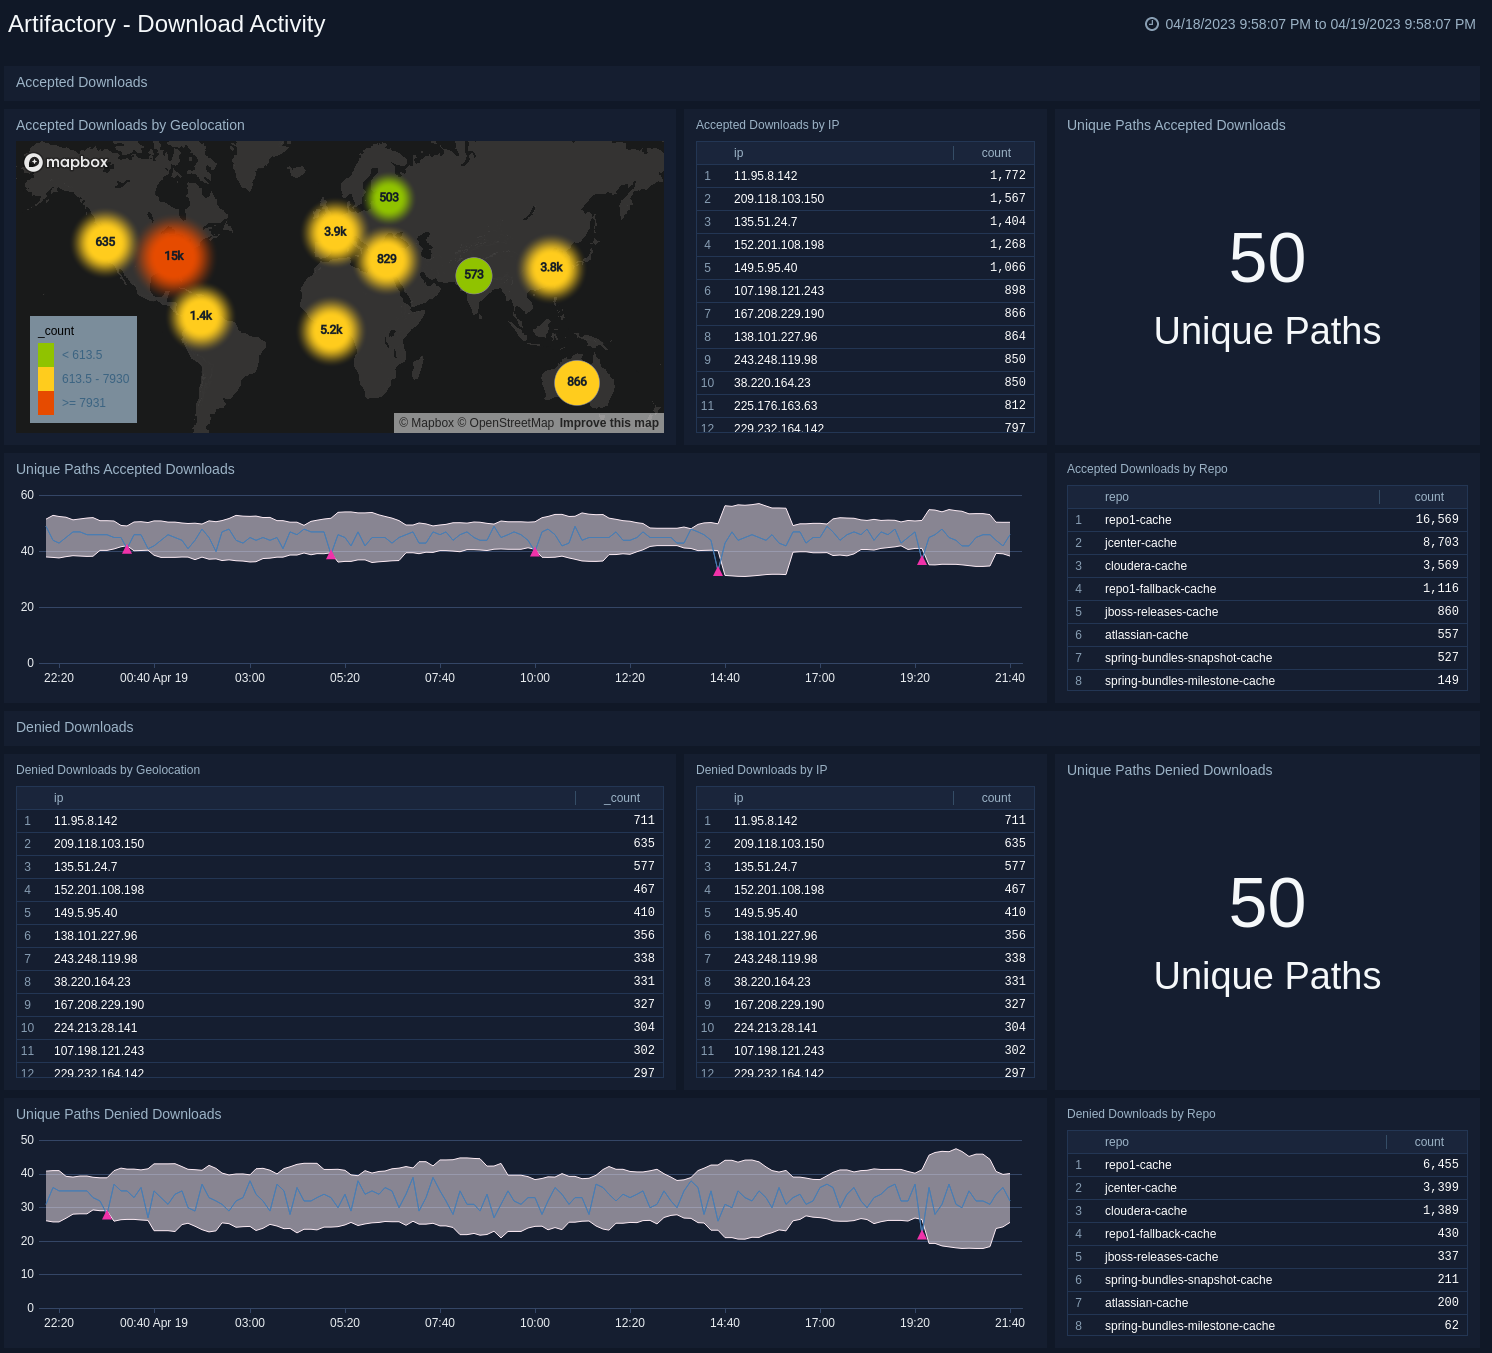
Accepted Downloads
Accepted Downloads by Geolocation. Uses a geo lookup operation to display accepted downloads by IP address on a map of the world for the last six hours.
Accepted Downloads by IP. Displays the number of accepted downloads by IP address in an aggregation table for the last six hours.
Unique Paths Accepted Downloads. Shows the number of unique paths of accepted downloads in a single value chart for the last six hours.
Unique Paths Accepted Downloads. Provides details on the number of unique paths of accepted downloads in a outlier combo chart on a timeline for the last six hours.
Accepted Downloads by Repo. Displays the number of accepted downloads by repo in an aggregation table for the last six hours.
Denied Downloads
Denied Downloads by Geolocation. Uses a geo lookup operation to display denied downloads by IP address on a map of the world for the last six hours.
Denied Downloads by IP. Displays the number of denied downloads by IP address in an aggregation table for the last six hours.
Unique Paths Denied. Shows the number of unique paths of denied downloads in a single value chart for the last six hours.
Unique Paths Denied Downloads. Provides details on the number of unique paths of denied downloads in a outlier combo chart on a timeline for the last six hours.
Denied Downloads by Repo. Provides details on the number of denied downloads per repo in an aggregation table for the last six hours.
Cached Deployment Activity
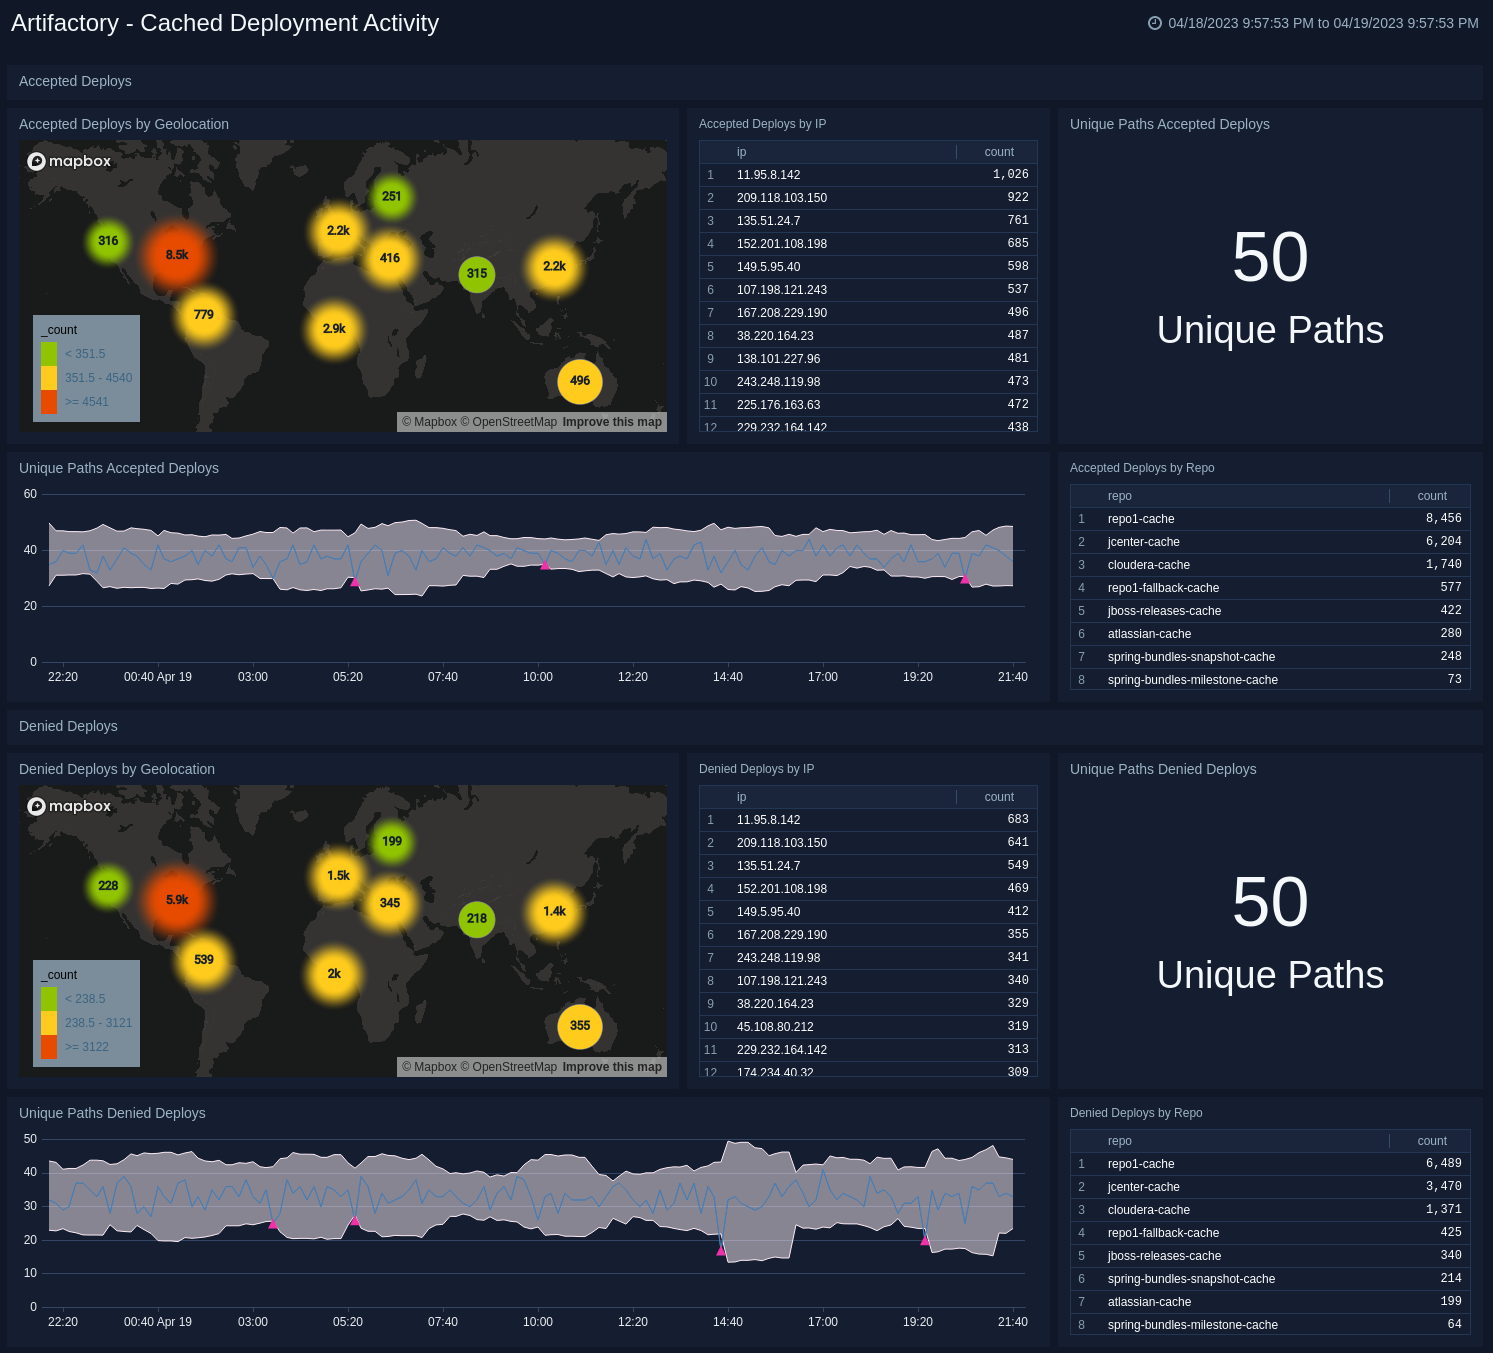
Accepted Deploys
Accepted Deploys by Geolocation. Uses a geo lookup operation to display accepted deploys by IP address on a map of the world for the last six hours.
Accepted Deploys by IP. Displays the number of accepted deploys by IP address in an aggregation table for the last six hours.
Unique Paths Accepted. Shows the number of unique paths of accepted deploys in a single value chart for the last six hours.
Unique Paths Accepted Deploys. Provides details on the number of unique paths of accepted deploys in a outlier combo chart on a timeline for the last six hours.
Accepted Deploys by Repo. Displays the number of accepted deploys by repo in an aggregation table for the last six hours.
Denied Deploys
Denied Deploys by Geolocation. Uses a geo lookup operation to display denied deploys by IP address on a map of the world for the last six hours.
Denied Deploys by IP. Displays the number of denied deploys by IP address in an aggregation table for the last six hours.
Unique Paths Denied Deploys. Shows the number of unique paths of denied deploys in a single value chart for the last six hours.
Unique Paths Denied Deploys. Provides details on the number of unique paths of denied deploys in a outlier combo chart on a timeline for the last six hours.
Denied Deploys by Repo. Provides details on the number of denied downloads per repo in an aggregation table for the last six hours.
Non-Cached Deployment Activity
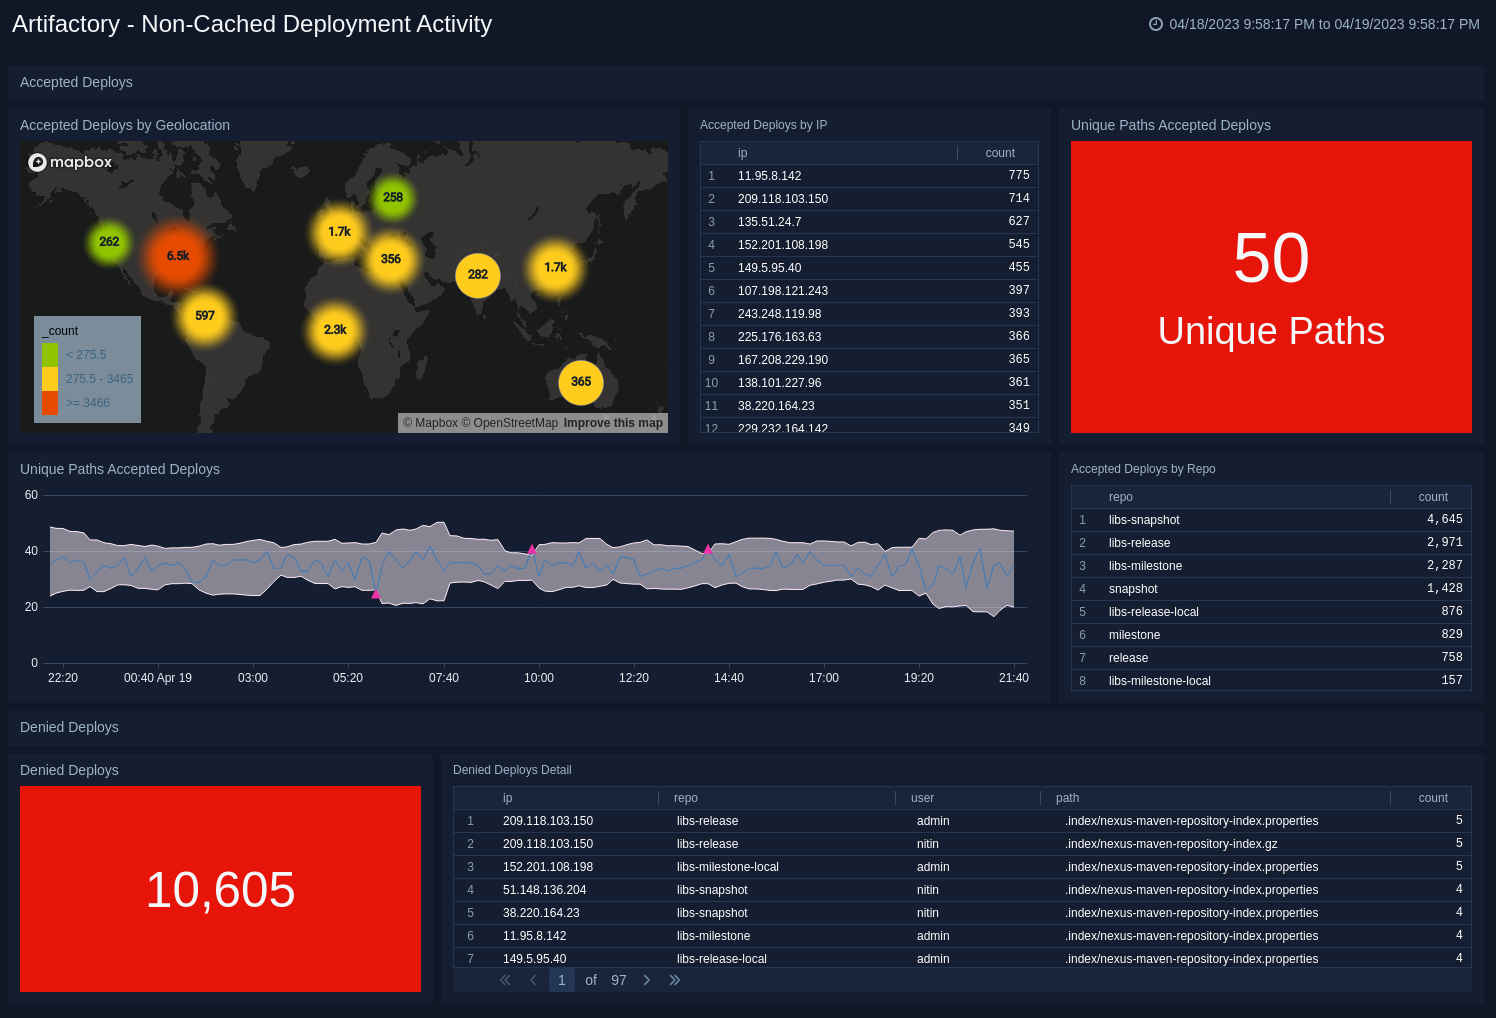
Accepted Deploys
Accepted Deploys by Geolocation. Uses a geo lookup operation to display accepted deploys by IP address on a map of the world for the last six hours.
Accepted Deploys by IP. Displays the number of accepted deploys by IP address in an aggregation table for the last six hours.
Unique Paths Accepted Deploys. Shows the number of unique paths of accepted deploys in a single value chart for the last six hours.
Unique Paths Accepted Deploys. Provides details on the number of unique paths of accepted deploys in a outlier combo chart on a timeline for the last six hours.
Accepted Deploys by Repo. Displays the number of accepted deploys by repo in an aggregation table for the last six hours.
Denied Deploys
Denied Deploys. Shows the number of denied deploys in a single value chart for the last six hours.
Denied Deploys Detail. Displays details on the number of denied deploys in an aggregation table, including IP address, repo name, user, path, and count for the last six hours.
Upgrade/Downgrade the Artifactory app (Optional)
To update the app, do the following:
Next-Gen App: To install or update the app, you must be an account administrator or a user with Manage Apps, Manage Monitors, Manage Fields, Manage Metric Rules, and Manage Collectors capabilities depending upon the different content types part of the app.
- Select App Catalog.
- In the Search Apps field, search for and then select your app.
Optionally, you can identify apps that can be upgraded in the Upgrade available section. - To upgrade the app, select Upgrade from the Manage dropdown.
- If the upgrade does not have any configuration or property changes, you will be redirected to the Preview & Done section.
- If the upgrade has any configuration or property changes, you will be redirected to the Setup Data page.
- In the Configure section of your respective app, complete the following fields.
- Field Name. If you already have collectors and sources set up, select the configured metadata field name (eg _sourcecategory) or specify other custom metadata (eg: _collector) along with its metadata Field Value.
- Click Next. You will be redirected to the Preview & Done section.
Post-update
Your upgraded app will be installed in the Installed Apps folder and dashboard panels will start to fill automatically.
See our Release Notes changelog for new updates in the app.
To revert the app to a previous version, do the following:
- Select App Catalog.
- In the Search Apps field, search for and then select your app.
- To version down the app, select Revert to < previous version of your app > from the Manage dropdown.
Uninstalling the Artifactory app (Optional)
To uninstall the app, do the following:
- Select App Catalog.
- In the 🔎 Search Apps field, run a search for your desired app, then select it.
- Click Uninstall.
More Information
For more information about JFrog Artifactory, see Using Node.js npm with Artifactory via the API and CLI (Sumo Logic DevOps blog).
For questions or help regarding the integration, see the JFrog Artifactory documentation or contact Sumo Logic Support.