Jira Cloud

The Sumo Logic App for Jira Cloud provides insights into how your Jira projects and issues are being managed so as to enable you to be more effective and manage work across multiple teams. This guide provides instructions for installing and configuring the Jira Cloud App, as well as offering examples and descriptions of the app pre-configured dashboards.
Log types
The Jira Cloud App uses the following types of logs:
- Issue related events
- Project-related events
- User related events
- Jira configuration related events
- Jira Software related events
For more information, see Webhooks in Jira help
Sample log messages
For more information about log messages, see Sample Log for Jira Cloud.
Sample queries
This section provides a sample query from the Unassigned Issues panel on the Jira Cloud - Issue Details dashboard.
Parameters
- Issue:*
- Issue_Summary:*
_sourceCategory="jira_cloud" *issue*
| json field=_raw "webhookEvent", "issue_event_type_name", "changelog", "issue.fields.creator.displayName", "issue.self",  "issue.key", "timestamp", "issue.fields.issuetype.name", "issue.fields.status.name", "issue.fields.resolution.name", "issue.fields.project.name", "issue.fields.status.statusCategory.name", "user.active",  "issue.fields.assignee.displayName", "issue.fields.summary", "issue.fields.priority.name", "issue.fields.components", "issue.fields.labels" as  event_name, event_type, change_log, issue_creator, jira_self, issue_key, timestamp, type, status, resolution, project_name, status_category, is_active, issue_assignee, issue_summary, priority, components, labels  nodrop
| where   project_name matches "*" AND issue_key matches "*" AND type matches "*" AND priority matches "*" AND status_category matches "*" AND status matches "*"
| isNull(issue_assignee) ? "Unassigned" : issue_assignee as issue_assignee
| parse regex field=labels "\"(?<label>[\S]+?)\"" multi nodrop
| parse regex field=components "\"name\":\"(?<component>[\S]+?)\"" multi nodrop
| where component matches "*" and  label matches "*"
| json field=change_log "items" as changes nodrop
| formatDate(fromMillis(timestamp), "MM-dd-yyyy HH:mm:ss", "UTC") as date_time
| parse regex field=jira_self "https:\/\/(?<base_url>.*?)\/"
| concat("https://",base_url,"/browse/", issue_key) as issue_url
| tourl(issue_url, issue_key) as issue
| withtime issue_assignee
| most_recent(issue_assignee_withtime) as user by issue, issue_summary
| where user="Unassigned"
| count as count by issue, issue_summary
| fields - count
Collecting logs for the Jira Cloud App
This section provides instructions for configuring log collection for the Jira Cloud App.
Configuring log collection consists of the following tasks:
- Configuring a Hosted Collector in Sumo Logic to receive Jira Cloud Events: A Hosted Collector is installed to receive the Webhooks from Jira. The Webhooks configuration helps to notify the app or web application when certain events occur in Jira. Using the Webhooks the remote applications do not have to monitor whether changes have occurred
- Registering a Webhook in Jira Cloud: Webhooks are registered in Jira for various events by Jira administration console or Jira REST API methods. These Webhooks can be used as an alert to the remote application when the issues are updated or sprints are started.
For more information, please see the documentation for Webhooks in Jira Cloud.
Step 1: Configure Hosted Collector to Receive Webhooks
In this step, you create a host collector to receive Webhooks from Jira and set up an HTTP source on it.
- Configure a Hosted Collector, or select an existing hosted collector for the HTTP source.
- Configure an HTTP source on the hosted collector.
- For Source Category, specify
jira_cloud/events. - Make a note of the HTTP address for the source. You will supply it when you configure a Jira Webhook in the next step.
- For Source Category, specify
Step 2: Register Webhook in Jira
Follow the instructions on Webhooks in Jira help to register a Webhook for the following events:
Issue Related Events
- Issue
- created
- updated
- deleted
- Comment
- created
- updated
- deleted
- Attachment
- created
- deleted
- Worklog
- created
- updated
- deleted
- Entity property
- created or updated
- deleted
- Issue link
- created
- deleted
Project-related Events
- Version
- released
- unreleased
- created
- moved
- updated
- merged
- deleted
- Project
- created
- updated
- deleted
User-Related Events
- User
- created
- deleted
- updated
Jira Configuration Related Events
- Features status change (enabled/disabled)
- voting
- watching
- unassigned issues
- subtasks
- attachments
- issue links
- time tracking
- time tracking provider
Jira Software Related Events
- Board
- created
- deleted
- updated
- configuration changed
Sprint Events
- Sprint
- created
- deleted
- updated
- started
- closed
When you configure the Webhook, enter the URL for the HTTP source you created in Step 2 as the endpoint for the Webhook.
Installing the Jira Cloud App
To install the app, do the following:
Next-Gen App: To install or update the app, you must be an account administrator or a user with Manage Apps, Manage Monitors, Manage Fields, Manage Metric Rules, and Manage Collectors capabilities depending upon the different content types part of the app.
- Select App Catalog.
- In the 🔎 Search Apps field, run a search for your desired app, then select it.
- Click Install App.
note
Sometimes this button says Add Integration.
- Click Next in the Setup Data section.
- In the Configure section of your respective app, complete the following fields.
- Field Name. If you already have collectors and sources set up, select the configured metadata field name (eg _sourcecategory) or specify other custom metadata (eg: _collector) along with its metadata Field Value.
- Click Next. You will be redirected to the Preview & Done section.
Post-installation
Once your app is installed, it will appear in your Installed Apps folder, and dashboard panels will start to fill automatically.
Each panel slowly fills with data matching the time range query received since the panel was created. Results will not immediately be available but will be updated with full graphs and charts over time.
Viewing Jira Cloud Dashboards
All dashboards have a set of filters that you can apply to the entire dashboard. Use these filters to drill down and examine the data to a granular level.
- You can change the time range for a dashboard or panel by selecting a predefined interval from a drop-down list, choosing a recently used time range, or specifying custom dates and times. Learn more.
- You can use template variables to drill down and examine the data on a granular level. For more information, see Filtering Dashboards with Template Variables.
- Most Next-Gen apps allow you to provide the scope at the installation time and are comprised of a key (
_sourceCategoryby default) and a default value for this key. Based on your input, the app dashboards will be parameterized with a dashboard variable, allowing you to change the dataset queried by all panels. This eliminates the need to create multiple copies of the same dashboard with different queries.
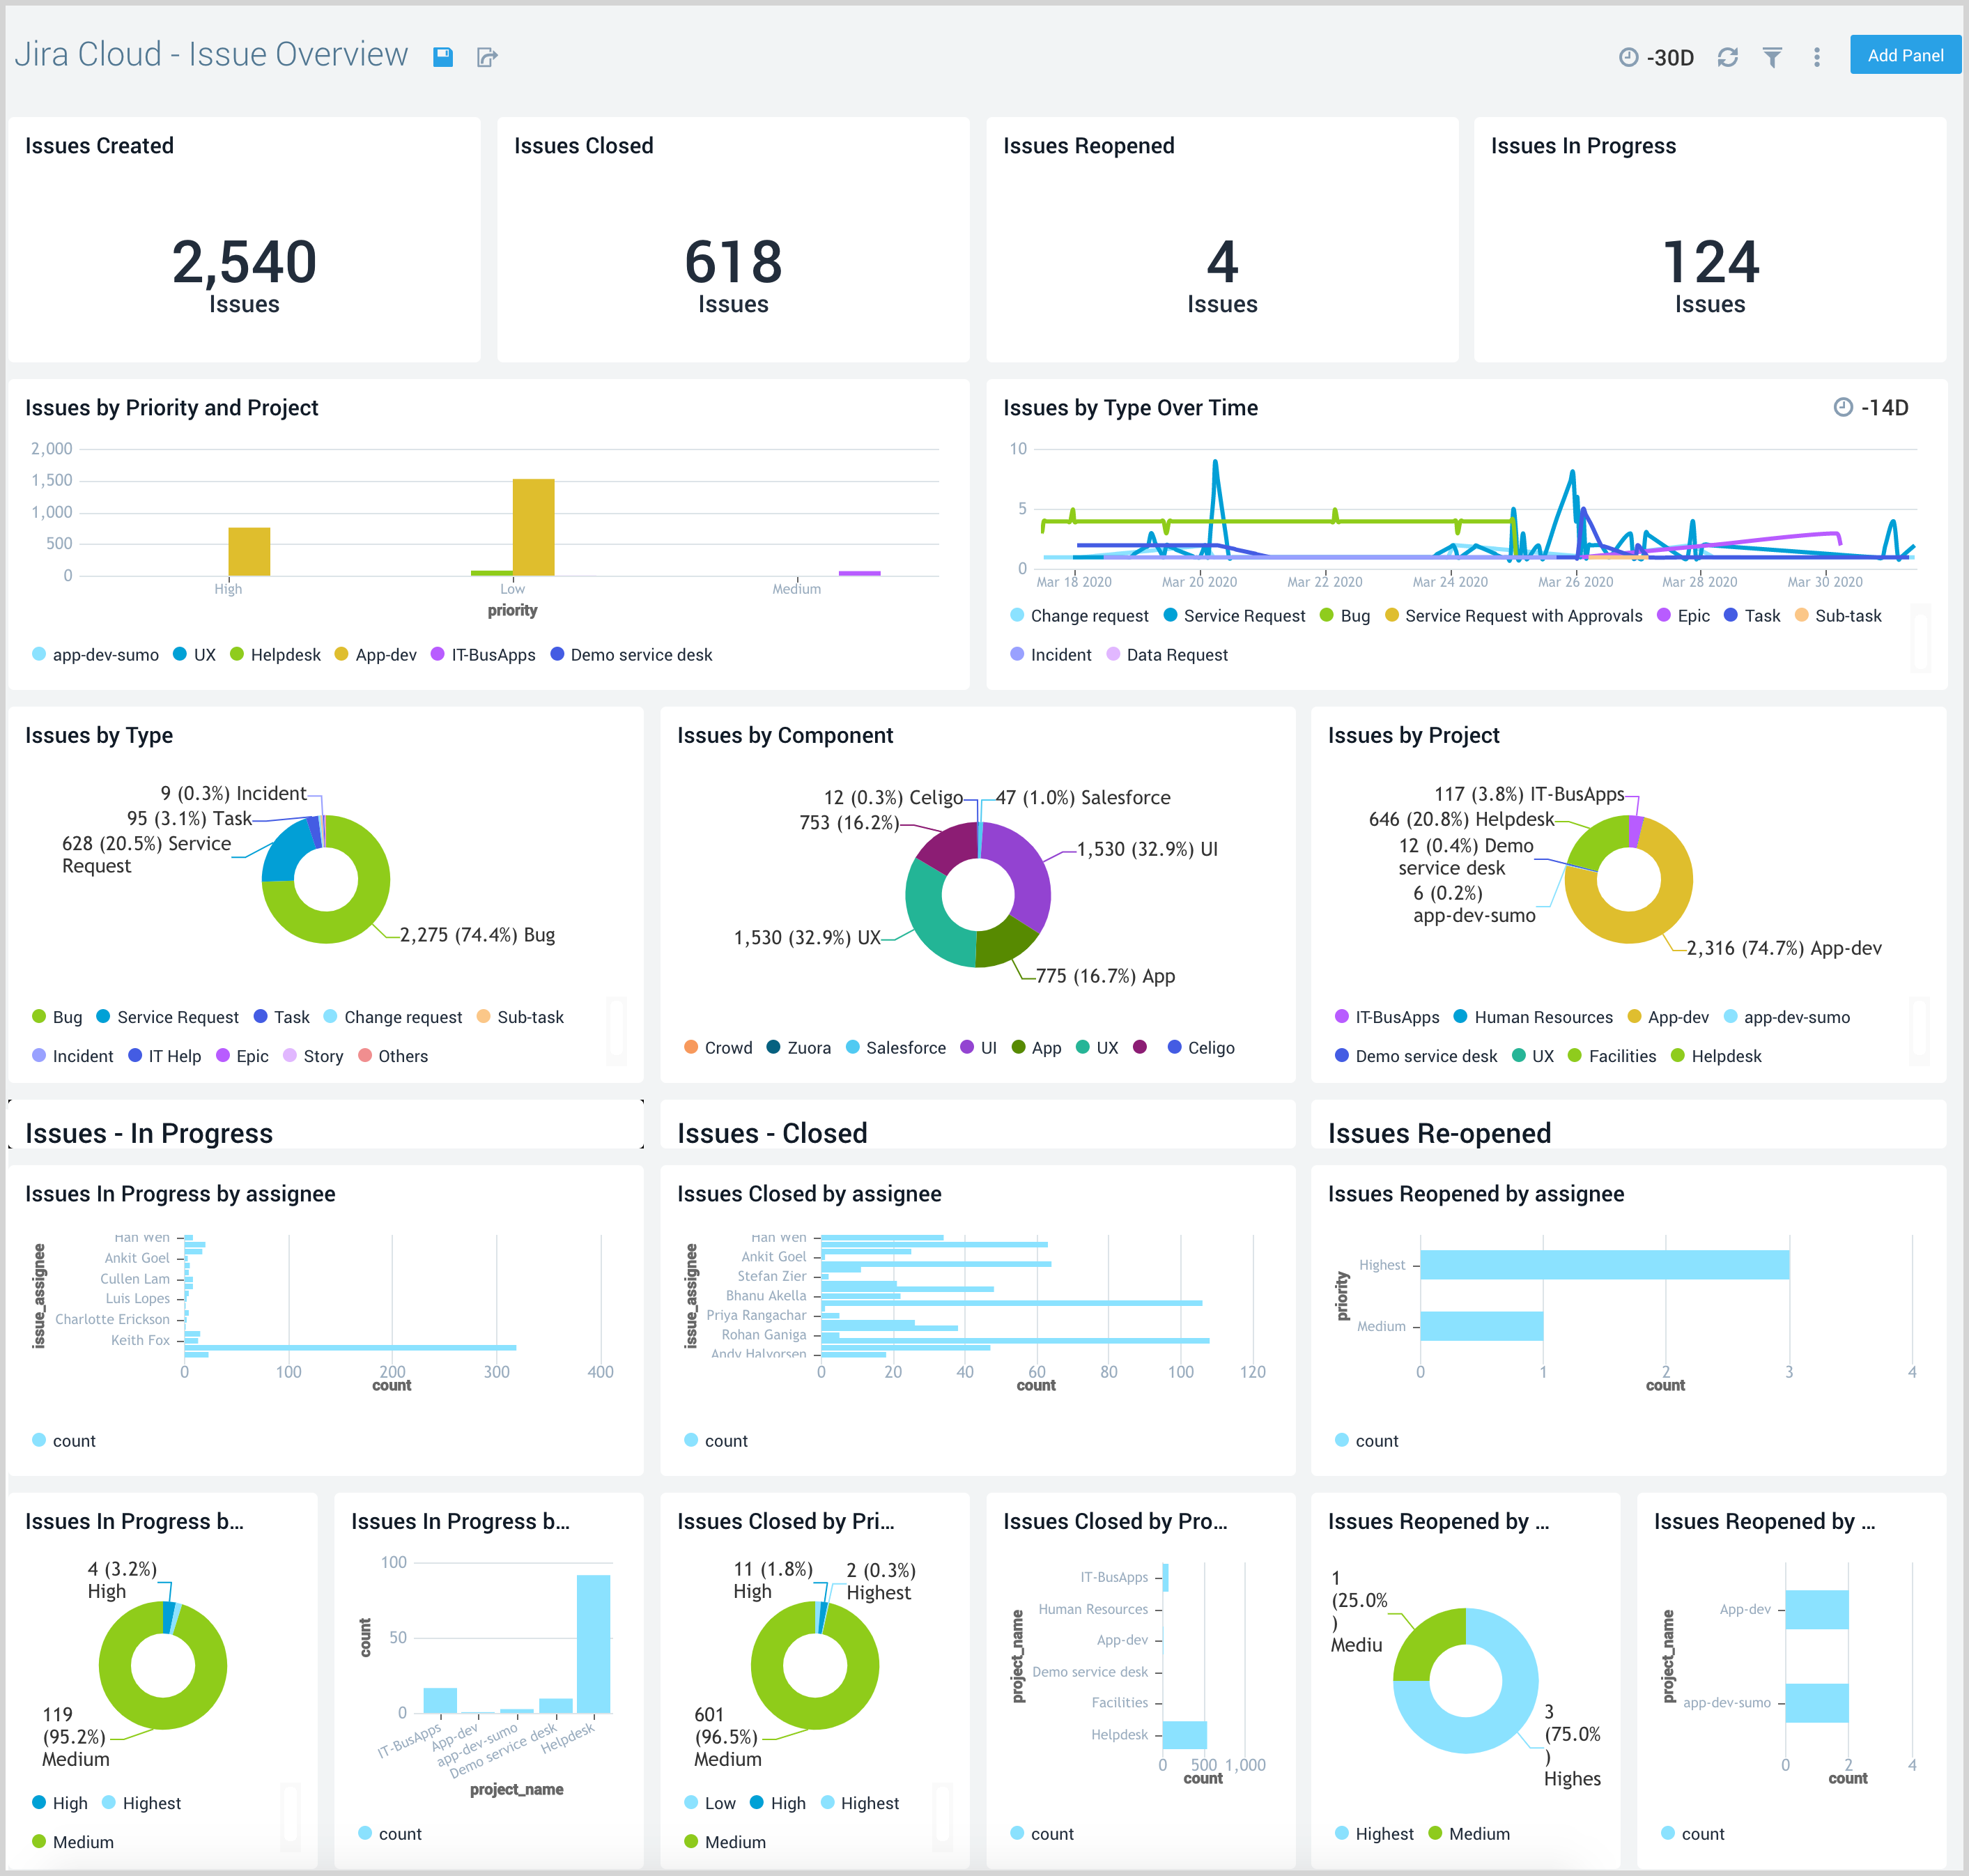
Issue Overview
The Jira Cloud - Issue Overview dashboard provides users with a high-level view of activities such as issues created, closed, reopened, and in progress.
Use this dashboard to:
- Understand how issues are being created, closed and reopened.
- Quickly identify issue types, components, and projects that need the most attention.
- Identify how work in progress could affect your development and delivery lifecycle.
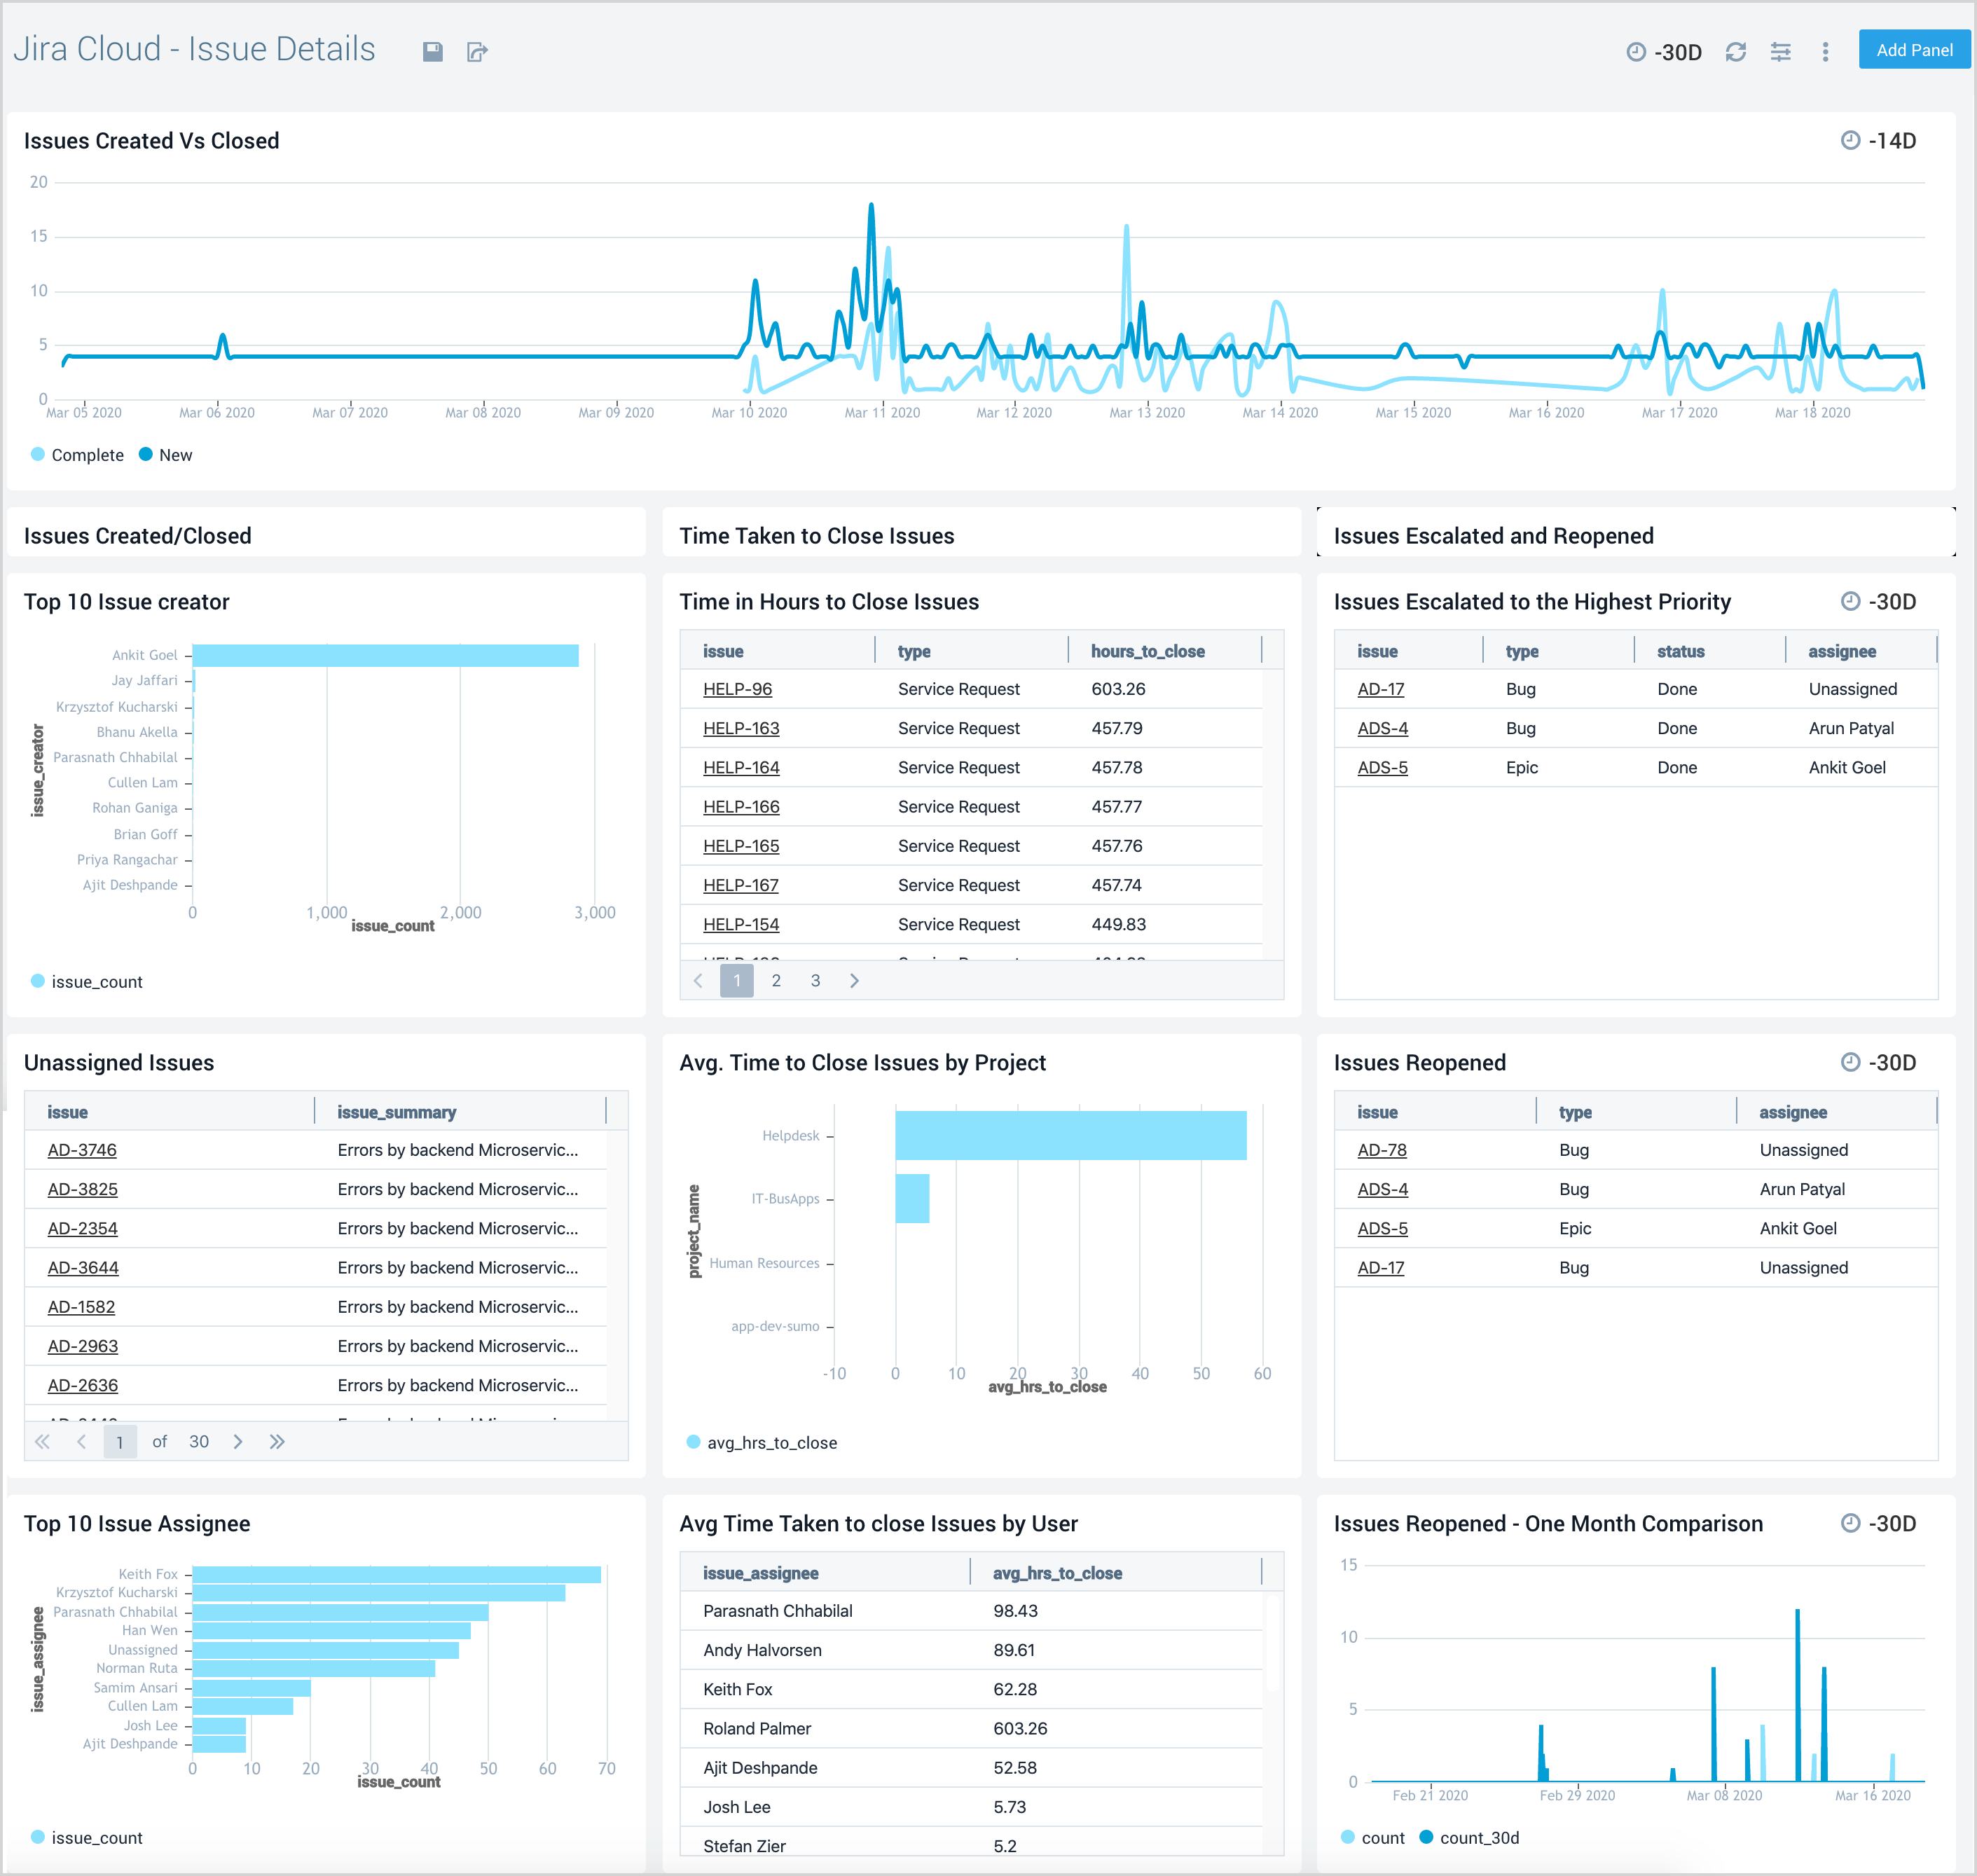
Issue Details
The Jira Cloud - Issue Details dashboard provides a visual overview of issues in Jira. The analytics help you visually examine critical information related to issues created compared to issues closed. The panels also provide details on open and closed issues, issue assignments and escalations. a list of issues escalated, unassigned, or reopened, and the average time is taken to close issues.
Use this dashboard to:
- Identifying issues, components, teams, and initiatives that require the most attention.
- Get insight into the time taken to close Jira issues by projects, types, and users.
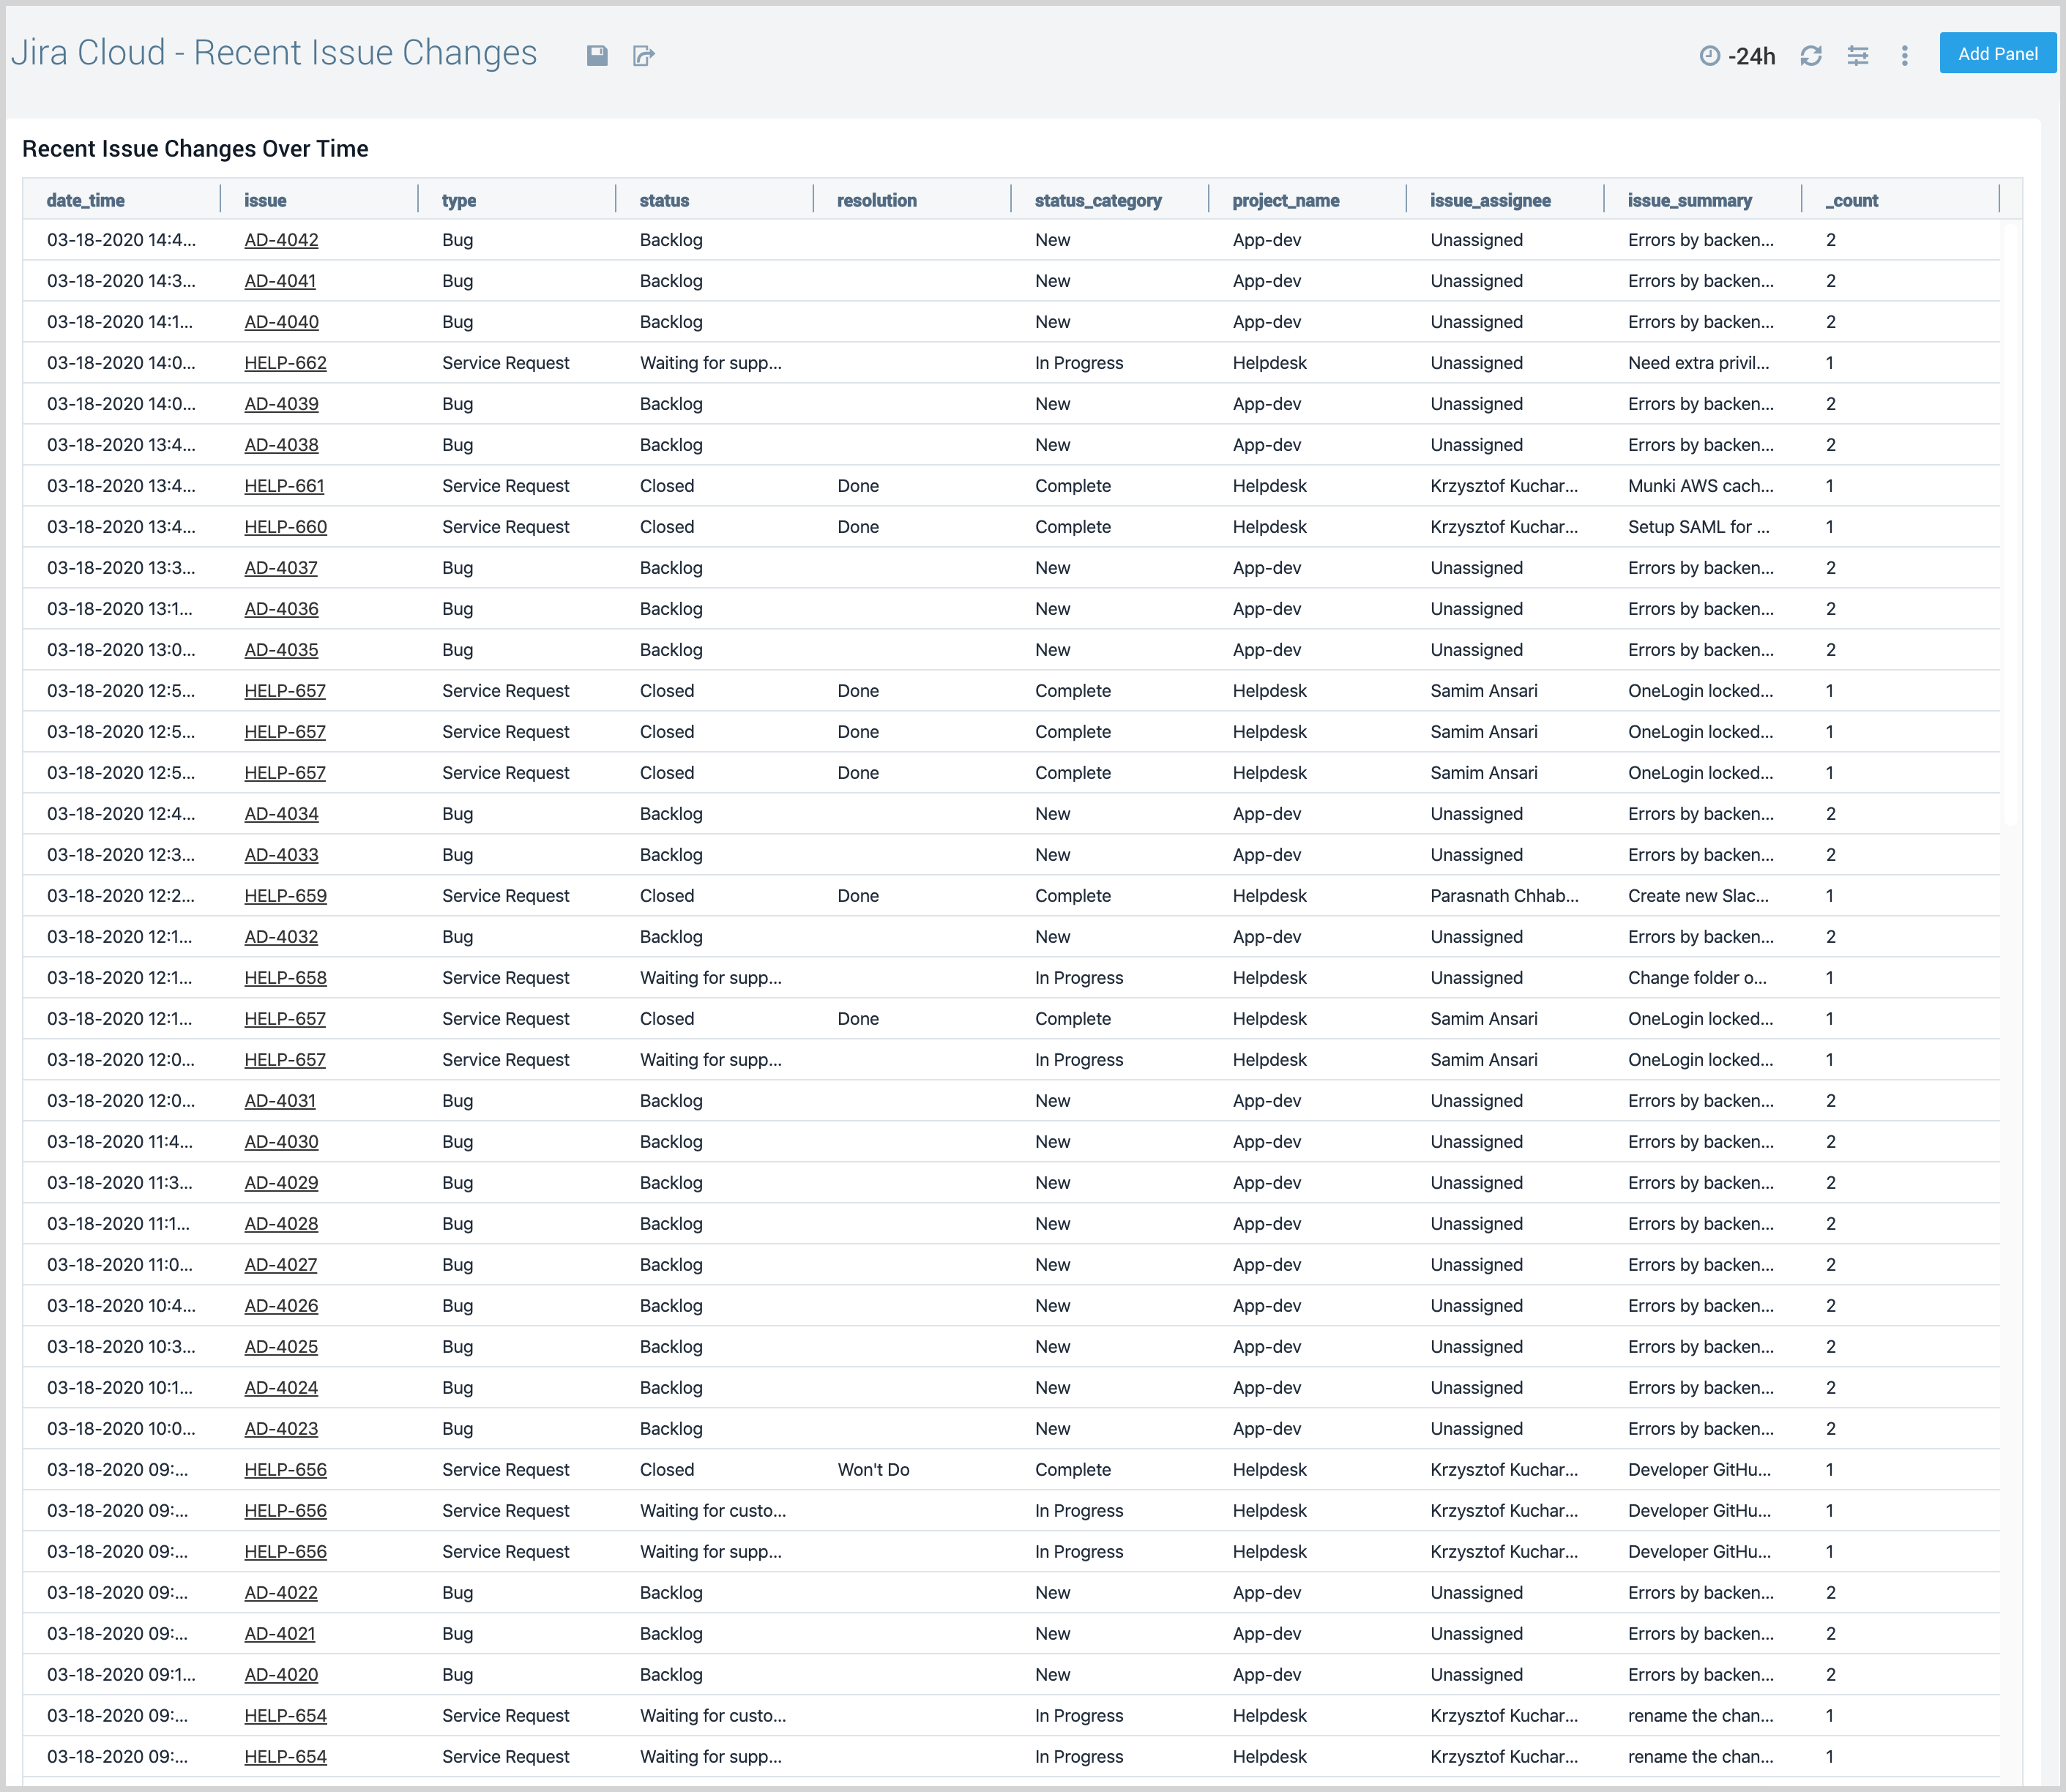
Recent Issues Changes
The Jira Cloud - Recent Issues Changes dashboard tracks the recent progress of Jira issues. The panels provide information about the type of issue, the timestamp when it was created, issue status, category, assignee, and issue summary.
Use this dashboard to:
- Identify the recent progress of Issues. This dashboard gives the progress of your software delivery processes in chronological order. You can use filters to drill down to a more detailed view.
Following drill down, filters are available: Components, Project Name, Status, Label, Issue Key, Issue Type, Priority, and Status Category.
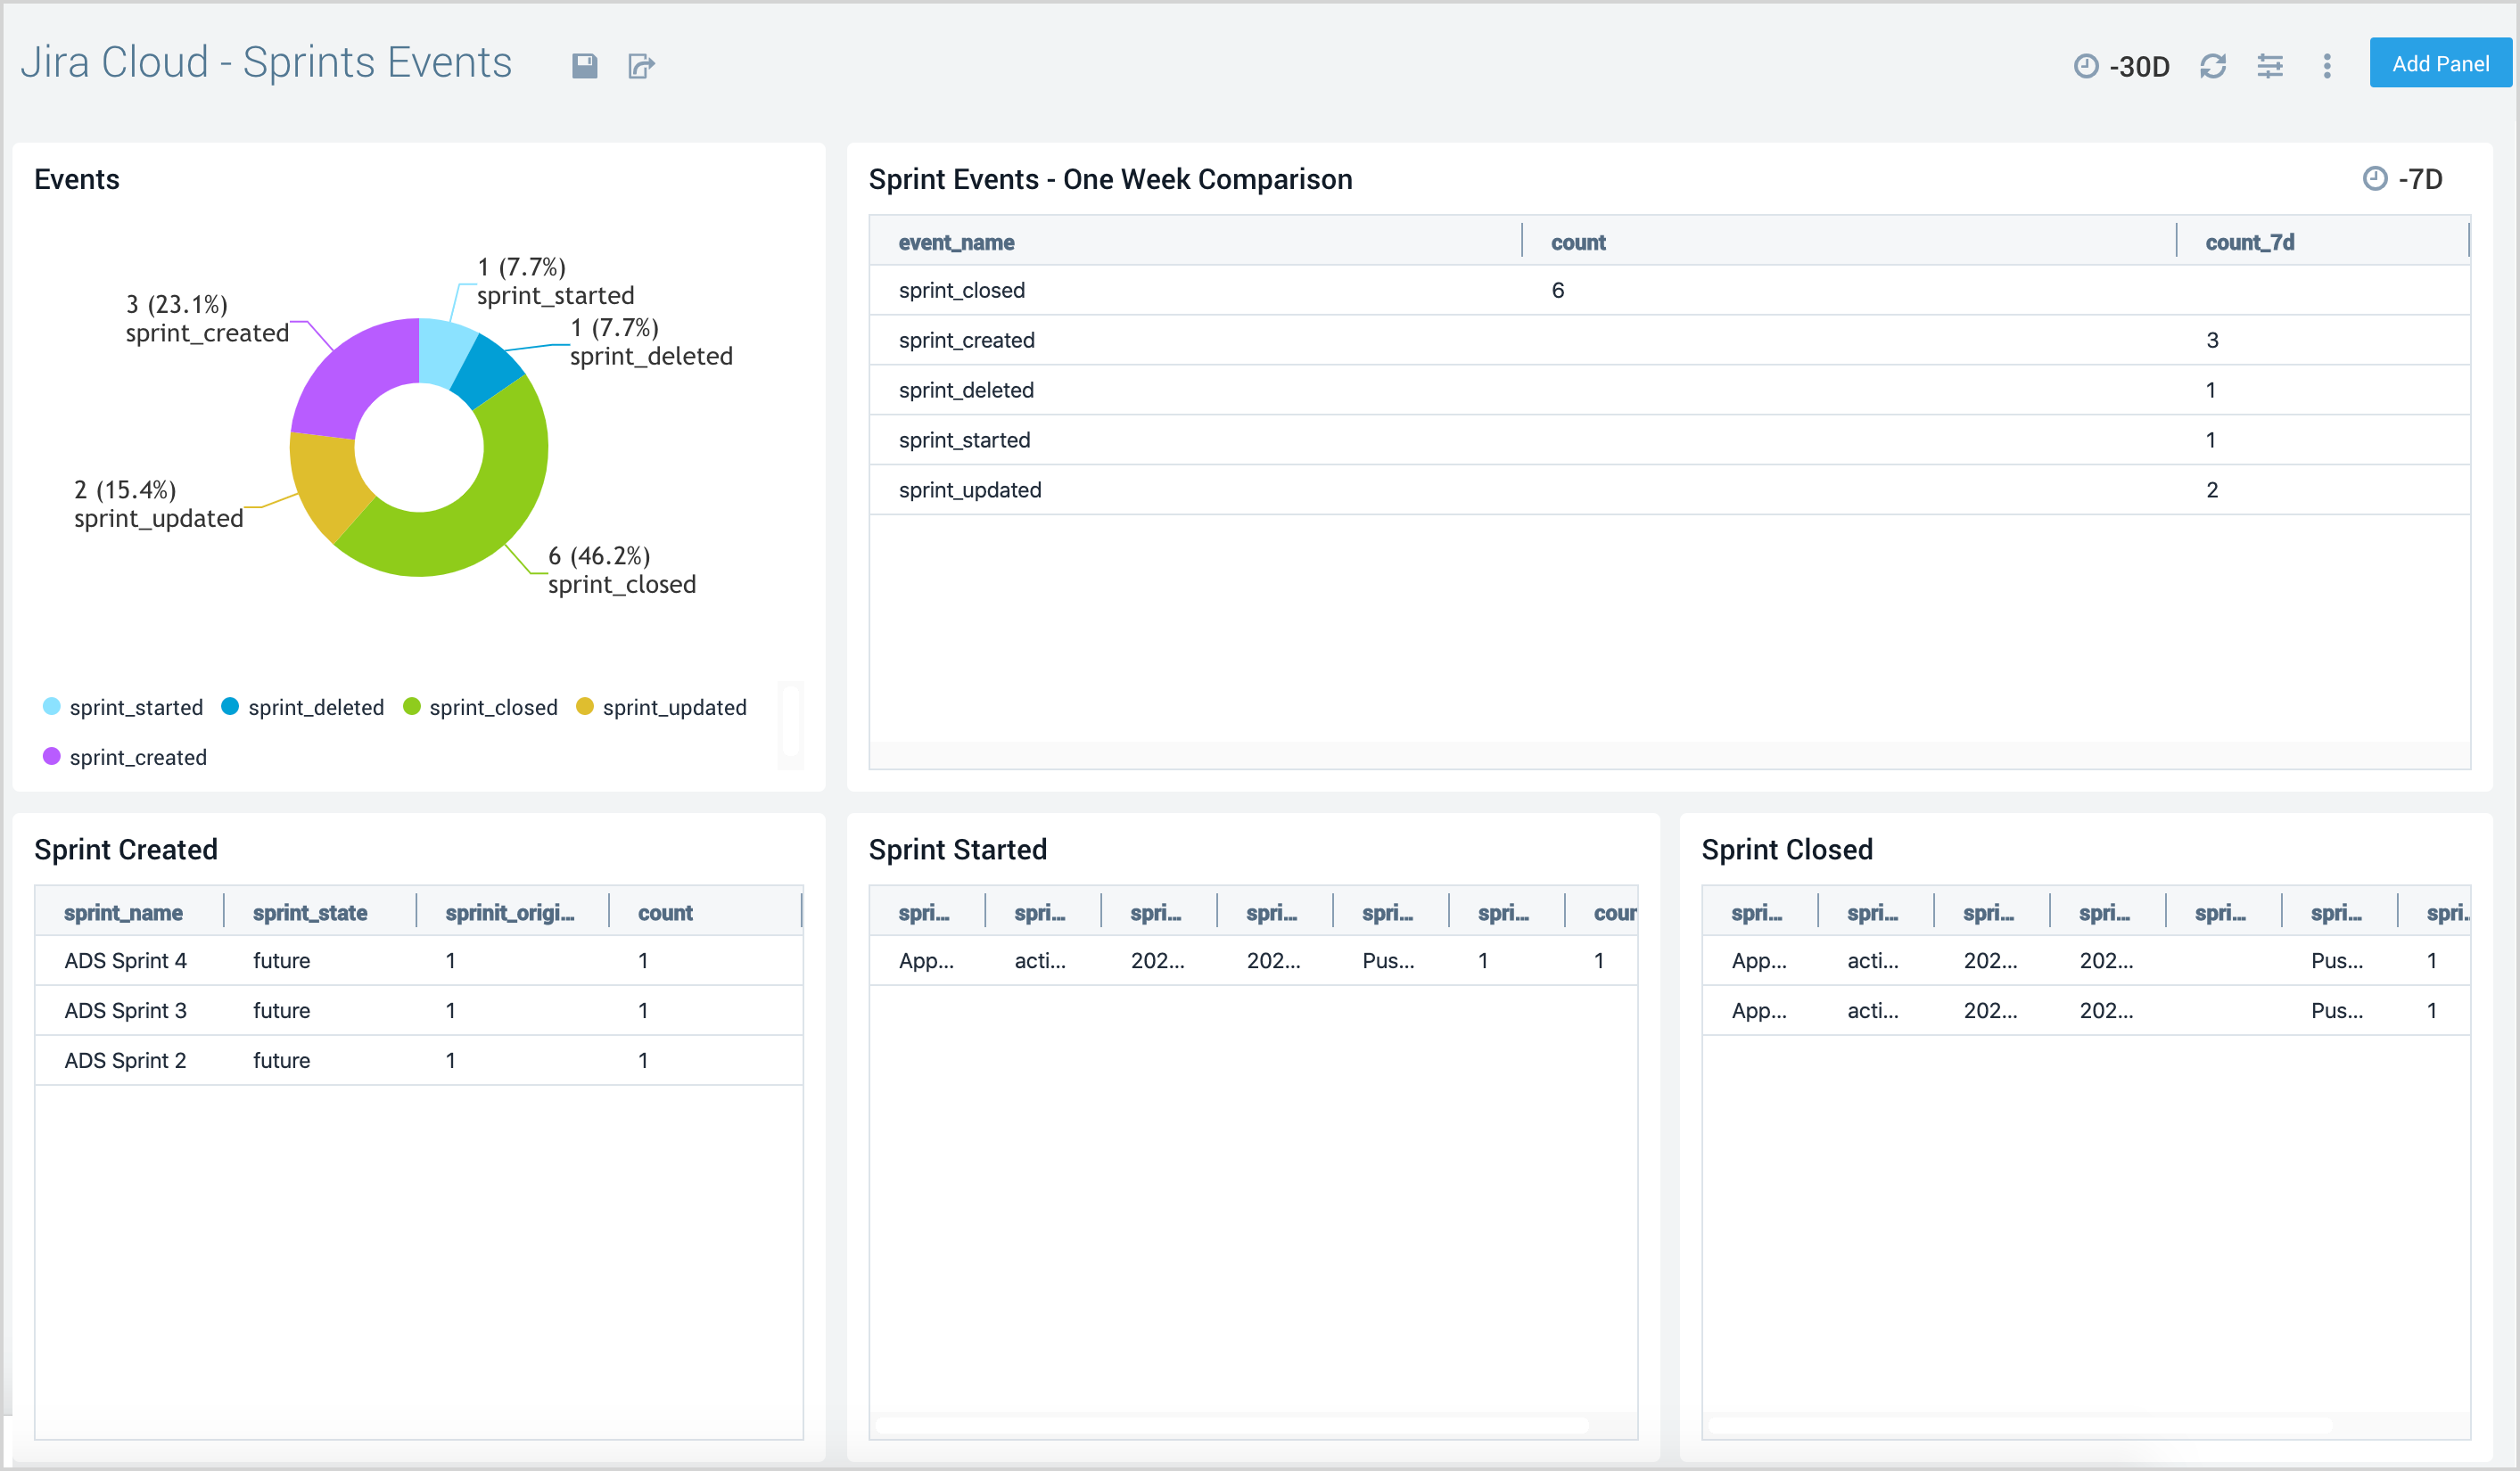
Sprint Events
The Jira Cloud - Sprint Events dashboard provides an at-a-glance view of sprint events. The panels also provide tabular representations of all sprint events spread over a week, sprints created, sprints started, and sprints closed.
Use this dashboard to:
- Monitor the progress of sprints in your development cycle. You can track active sprints and their start and end dates.
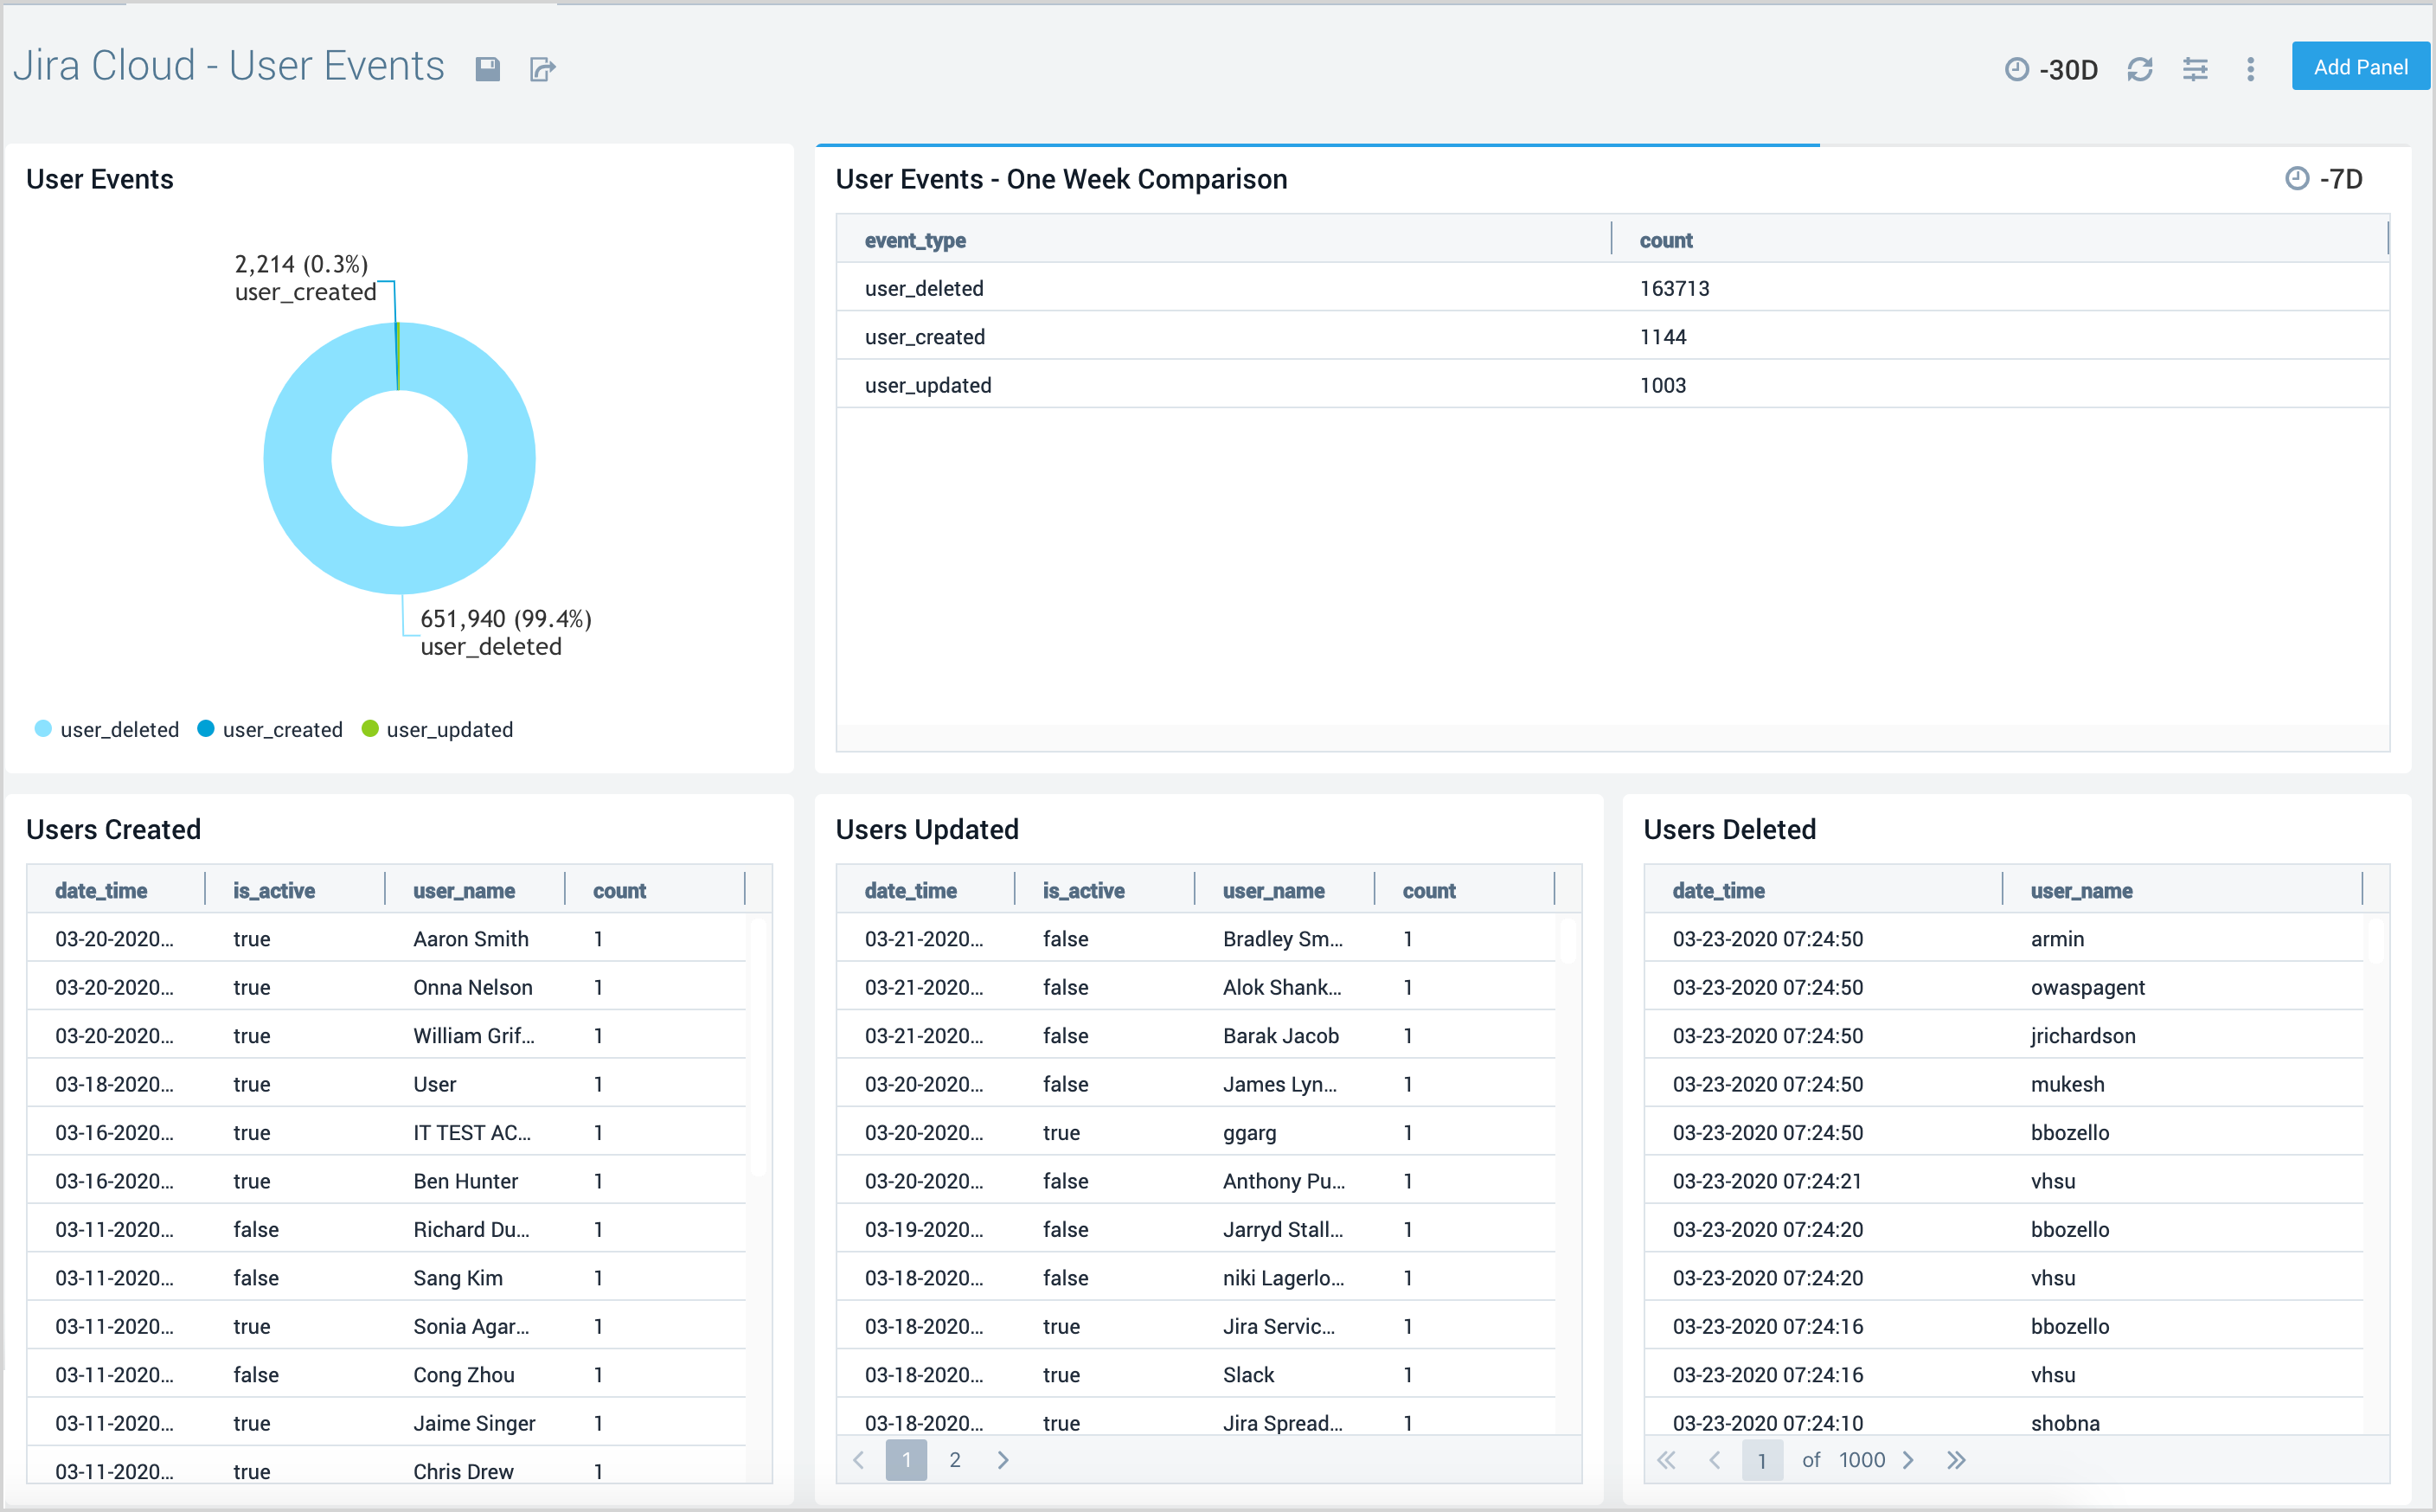
User Events
The Jira Cloud - User Events dashboard provides an overview of user profiles. The analytics allow you to closely monitor the unusual activity related to users created, updated, and deleted.
Use this dashboard to:
- Monitor and audit all administrative activities related to the creation and modification of Jira Cloud users.