Amazon VPC Flow Cloud Security Monitoring and Analytics
The Amazon VPC (Virtual Private Cloud) Flow - Cloud Security Monitoring and Analytics app thoroughly assess Amazon VPC Flow logs to gain a better understanding of your environment and associated traffic patterns. Dig deep into the data, broken down by access levels, group creation, etc.
The Amazon VPC Flow Logs show the IP network traffic of your VPC, allowing you to troubleshoot traffic and security issues. The Amazon VPC Flow Logs App leverages this data to provide real-time visibility and analysis of your environment. It consists of predefined searches and Dashboards.
See Amazon VPC Flow Logs more information.
The VPC Flow Logs can be published to Amazon CloudWatch Logs and Amazon S3. You can use either of the below methods to collect Amazon VPC Flow Logs.
Each method has advantages. Using an Amazon S3 source is more reliable, while using a CloudWatch Logs source with the CloudFormation template allows you to optimize your logs. With the CloudWatch Logs source and CloudFormation template, you can customize logs by adding more information and filtering out unwanted data. The Security Groups dashboard utilizes customized logs that are generated from the Lambda function and created with the CloudFormation template from logs sent to CloudWatch Logs.
Field Extraction Rule for VPC Flow logs
Here is an example Field Extraction Rule for VPC Flow logs.
Rule Name: VPCFlowLogFER
Applied at: Ingest Time
Scope (Specific Data):
_sourceCategory=<Source category for respective VPC flow log source>
Parse Expression:
json "logStream", "logGroup", "message", "direction" as logStream, logGroup, msg, direction nodrop
| if (_raw matches "{*", msg, _raw) as msg
| parse field=msg "* * * * * * * * * * * * * *" as version,accountID,interfaceID,src_ip,dest_ip,src_port,dest_port,Protocol,Packets,bytes,StartSample,EndSample,Action,status nodrop
Collect Amazon VPC Flow Logs from CloudWatch using CloudFormation
This section has instructions for collecting VPC Flow Logs using a CloudFormation template. Alternatively, you can Collect Amazon VPC Flow Logs using Amazon S3 Source.
This section has instructions for collecting logs for the Amazon VPC Flow Logs app.
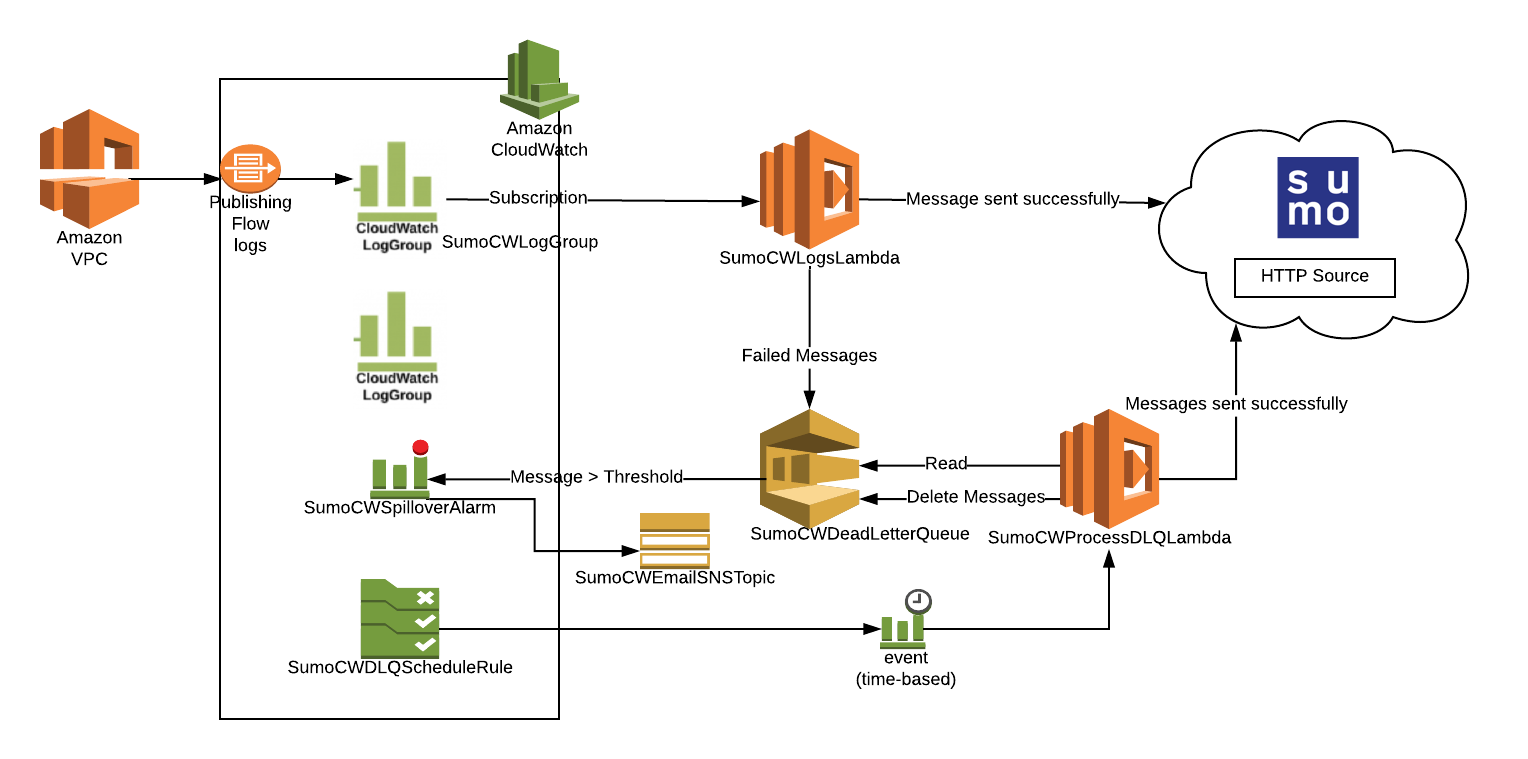
The diagram below illustrates the collection process for Amazon VPC Flow Logs. VPC is enabled to send logs to Amazon CloudWatch. A Lambda function subscribes to a CloudWatch Log Group to obtain the flow logs, and then sends the data on to a Sumo Logic HTTP Source on a hosted collector. The AWS resources are created by a Sumo-provided CloudFormation template.
Step 1: Enable Amazon VPC Flow Logs
You can enable Amazon Virtual Private Cloud (VPC) Flow Logs from the Amazon Web Services (AWS) Management Console, the AWS Command Line Interface (CLI), or by making calls to the Elastic Compute Cloud (EC2) API.
To enable Amazon Virtual Private Cloud (VPC) Flow Logs from the AWS console:
- Go to VPC management, and go to the VPC list.
- Select the VPC.
- Click Actions > Create Flow Log.
- On the Create Flow Log page, select a Role to use Flow logs.
- If you haven't set up IAM permissions, click Set Up Permissions.
- From the new tab, VPC Flow Logs is requesting permissions to use resources in your account:
- From the IAM Role, select Create a new IAM Role.
- Add a Role Name that describes your logs, for example, VPC-Flow-Logs.
- Click Allow.
- Back in Create Flow Log, enter the new role you created in Role.
- In Destination Log Group enter a descriptive name such as VPCFlowLogs.
- Click Create Flow Log. It can take up to an hour for the log group to show up in CloudWatch Logs.
Step 2: Configure hosted collector and HTTP source
- Create a Hosted Collectorin Sumo Logic.
- Configure an HTTP Source in Sumo Logic. When configuring the source:
- Under Advanced Options for Logs, for Timestamp Format, click Specify a format.
- Under Format, enter:
epoch. - Under Timestamp locator, enter:
\s(\d{10,13})\s\d{10,13}. - Click Save.
Step 3: Create AWS functions and resources
Follow the steps on Amazon CloudWatch Logs, starting with the Download the CloudFormation template step and ending with the Dealing with alarms step. As you perform the procedure note the additional instructions below, regarding log format and optional environment variables.
Configure LogFormat correctly (Required)
When you Create a stack on the AWS CloudFormation console, in Step 5, make sure you select either VPC-JSON or VPC-RAW in the LogFormat field in the Specify Details window.
Environment Variables for VPC Flow log collection (Optional)
When you Configure environment variables for Lambda functions, in addition to the variables listed, you can optionally also define the following environment variables.
If you define the environment variables below, do it for both of the Lambda functions created by the CloudFormation template.
Environment variable: VPC_CIDR_PREFIX
Description: Comma-separated list of IP prefixes for filtering out internal traffic. For example, vpcCIDRprefix= 10.8.0.0,10.9.0.0 filters out logs whose destinationIP and sourceIP matches any of the two prefixes 10.8.0.0 and 10.9.0.0.
For example, if VPC_CIDR_PREFIX = “10.0.”, then all the IPs with 10.0.*.* will match the prefix.
Environment variable: INCLUDE_SECURITY_GROUP_INFO
Description: This option is supported only if you set LogFormat to VPC-JSON. Set to true to include the following fields in logs:
- vpc-id
- subnet-id
- aws-region
- security-group-ids
- direction
If you set the value to true, follow the instructions in Grant Lambda permissions (Optional).
Grant Lambda permissions (Optional)
This step is supported only if INCLUDE_SECURITY_GROUP_INFO is set to true.
The Lambda function fetches list of Elastic Network Interfaces using the describeNetworkInterfaces API. You need to grant permission to Lambda by adding the following inline policy in the SumoCWLambdaExecutionRole role. See the instructions on Creating Policies on the JSON Tab in AWS help.
Paste the JSON below, after adding the ARN of the Lambda functions.
{
    "Version": "2012-10-17",
    "Statement": [
        {
            "Sid": "DescribeENILambdaPerms",
            "Effect": "Allow",
            "Action": "ec2:DescribeNetworkInterfaces",
            "Resource": "*"
        }
    ]
}
Step 4: Subscribe the Lambda function to the VPC Flow Log group
- Select the VPC Flow Log group in the CloudWatch Logs management panel. This is the Log Group created in the first part (VPCFlowLogs was used).
- Click Actions and select Stream to Lambda Function.
- Select the Lambda function created by the CloudFormation template. Its name starts with "SumoCWLogsLambda".
- Click Next.
- Select JSON for Log Format.
- Click Next.
- Click Start Streaming. Wait a few minutes, and check to make sure your logs are flowing into Sumo.
Collect Amazon VPC Flow Logs Using an Amazon S3 Source
This section has instructions for collecting Amazon VPC Flow Logs using an Amazon S3 source. If you prefer to collect VPC logs using a CloudFormation template, see Collect Amazon VPC Flow Logs using a CloudFormation Template.
Step 1: Enable Amazon VPC Flow Logs
- You can use an existing S3 bucket, or create a new one, as described in Create a S3 bucket in AWS help.
- Create flow logs for your VPCs, subnets, or network interfaces. For instructions, see Creating a Flow Log that Publishes to Amazon S3 in AWS help.
- Confirm that logs are being delivered to the S3 bucket. Log files are saved to the bucket using following folder structure:
bucket_ARN/optional_folder/AWSLogs/aws_account_id/vpcflowlogs/region/year/month/day/log_file_name.log.gz.
Step 2: Configure Amazon S3 Source
- Grant Access to an Amazon S3 Bucket.
- Enable logging using the AWS Management Console.
- When you create an AWS Source, you associate it with a Hosted Collector. Before creating the Source, identify the Hosted Collector you want to use, or create a new Hosted Collector. For instructions, see Create a Hosted Collector.
- Add an AWS Source for the S3 Source to Sumo Logic. When you configure the S3 source:
- In the Advanced Options for Logs section, uncheck the Detect messages spanning multiple lines option.
- In the Processing Rules for Logs section, add an Exclude messages that match processing rule to ignore the following file header lines:
version account-id interface-id srcaddr dstaddr srcport dstport protocol packets bytes start end action log-status.
Installing the AWS VPC Security App
Now that you have set up collection, install the Sumo Logic App for Amazon VPC Flow to use the preconfigured searches and dashboards that provide insight into your data.
To install the app, do the following:
Next-Gen App: To install or update the app, you must be an account administrator or a user with Manage Apps, Manage Monitors, Manage Fields, Manage Metric Rules, and Manage Collectors capabilities depending upon the different content types part of the app.
- Select App Catalog.
- In the 🔎 Search Apps field, run a search for your desired app, then select it.
- Click Install App.
note
Sometimes this button says Add Integration.
- Click Next in the Setup Data section.
- In the Configure section of your respective app, complete the following fields.
- Field Name. If you already have collectors and sources set up, select the configured metadata field name (eg _sourcecategory) or specify other custom metadata (eg: _collector) along with its metadata Field Value.
- Click Next. You will be redirected to the Preview & Done section.
Post-installation
Once your app is installed, it will appear in your Installed Apps folder, and dashboard panels will start to fill automatically.
Each panel slowly fills with data matching the time range query received since the panel was created. Results will not immediately be available but will be updated with full graphs and charts over time.
Viewing AWS VPC Security dashboards
Analytics and Monitoring dashboards to provide operational security for AWS VPC flow data sources.
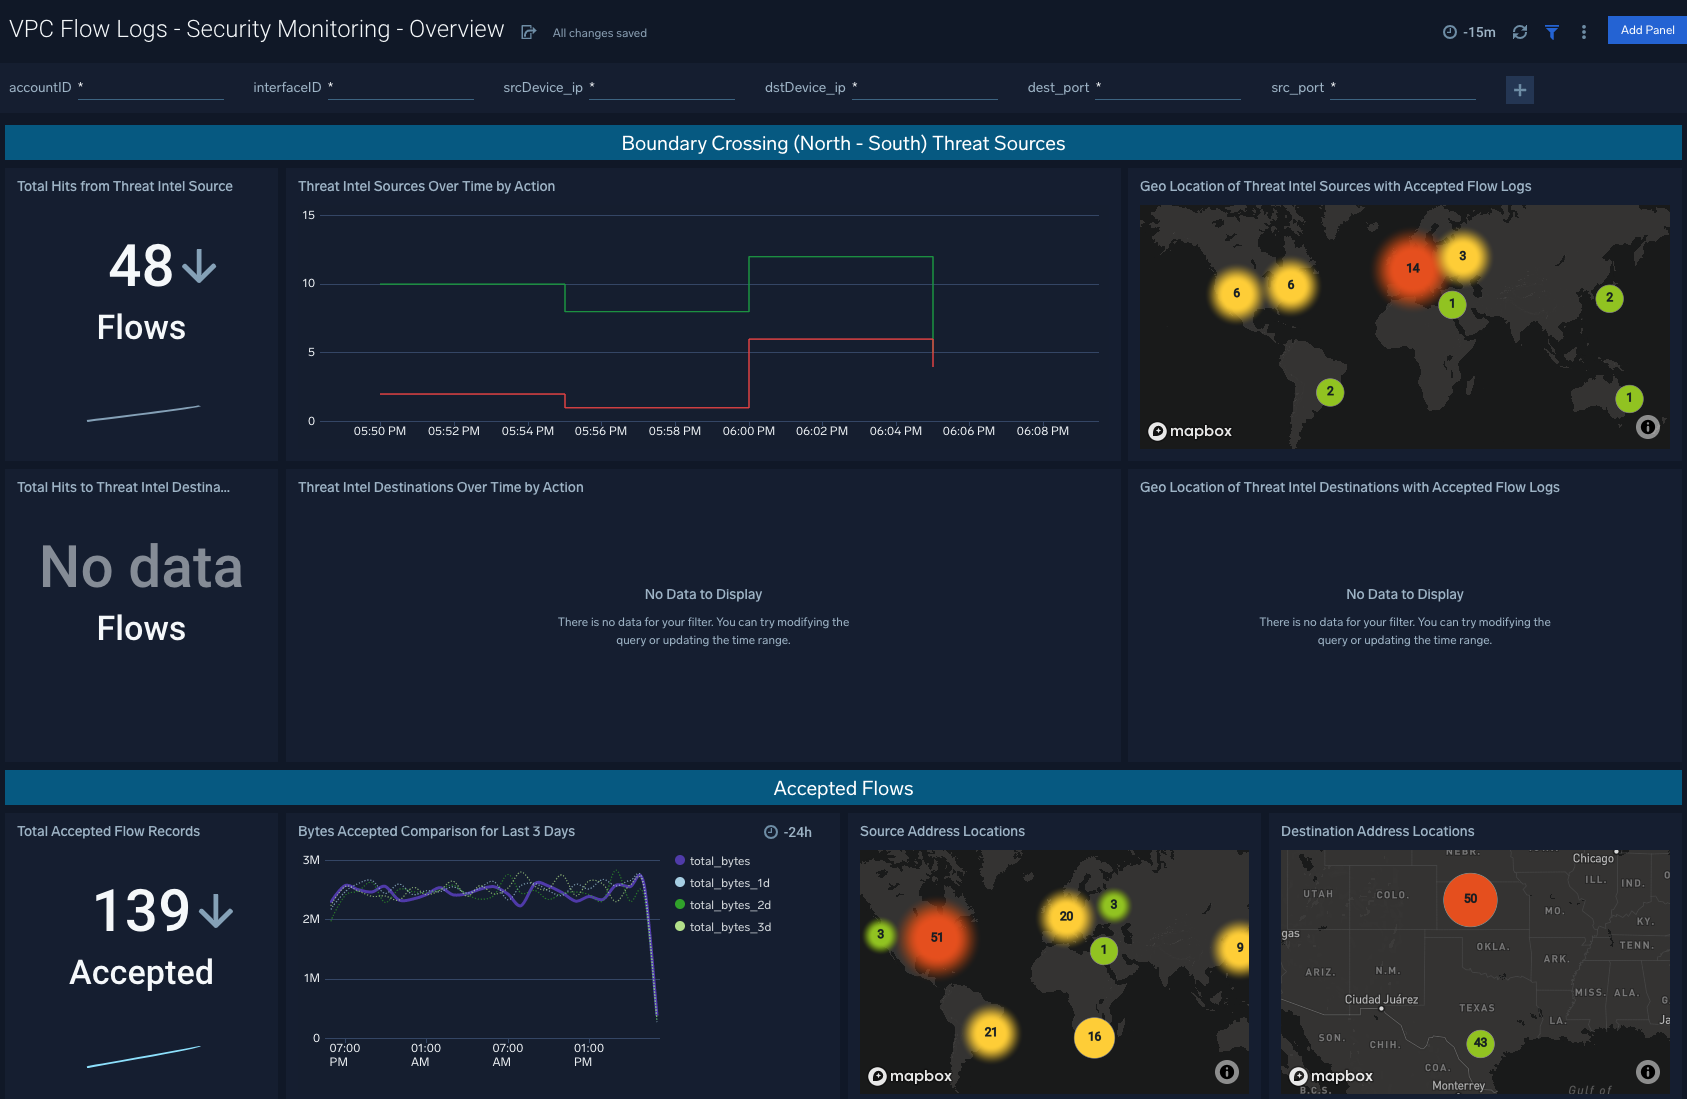
VPC Flow Logs - Security Monitoring - Overview
Description: See the details of security group activities and all AWS activities divided by read only and non read only.
Use Case: Provides analysis of group activity events including revoking and authorizing access, creating and deleting groups, and other events.
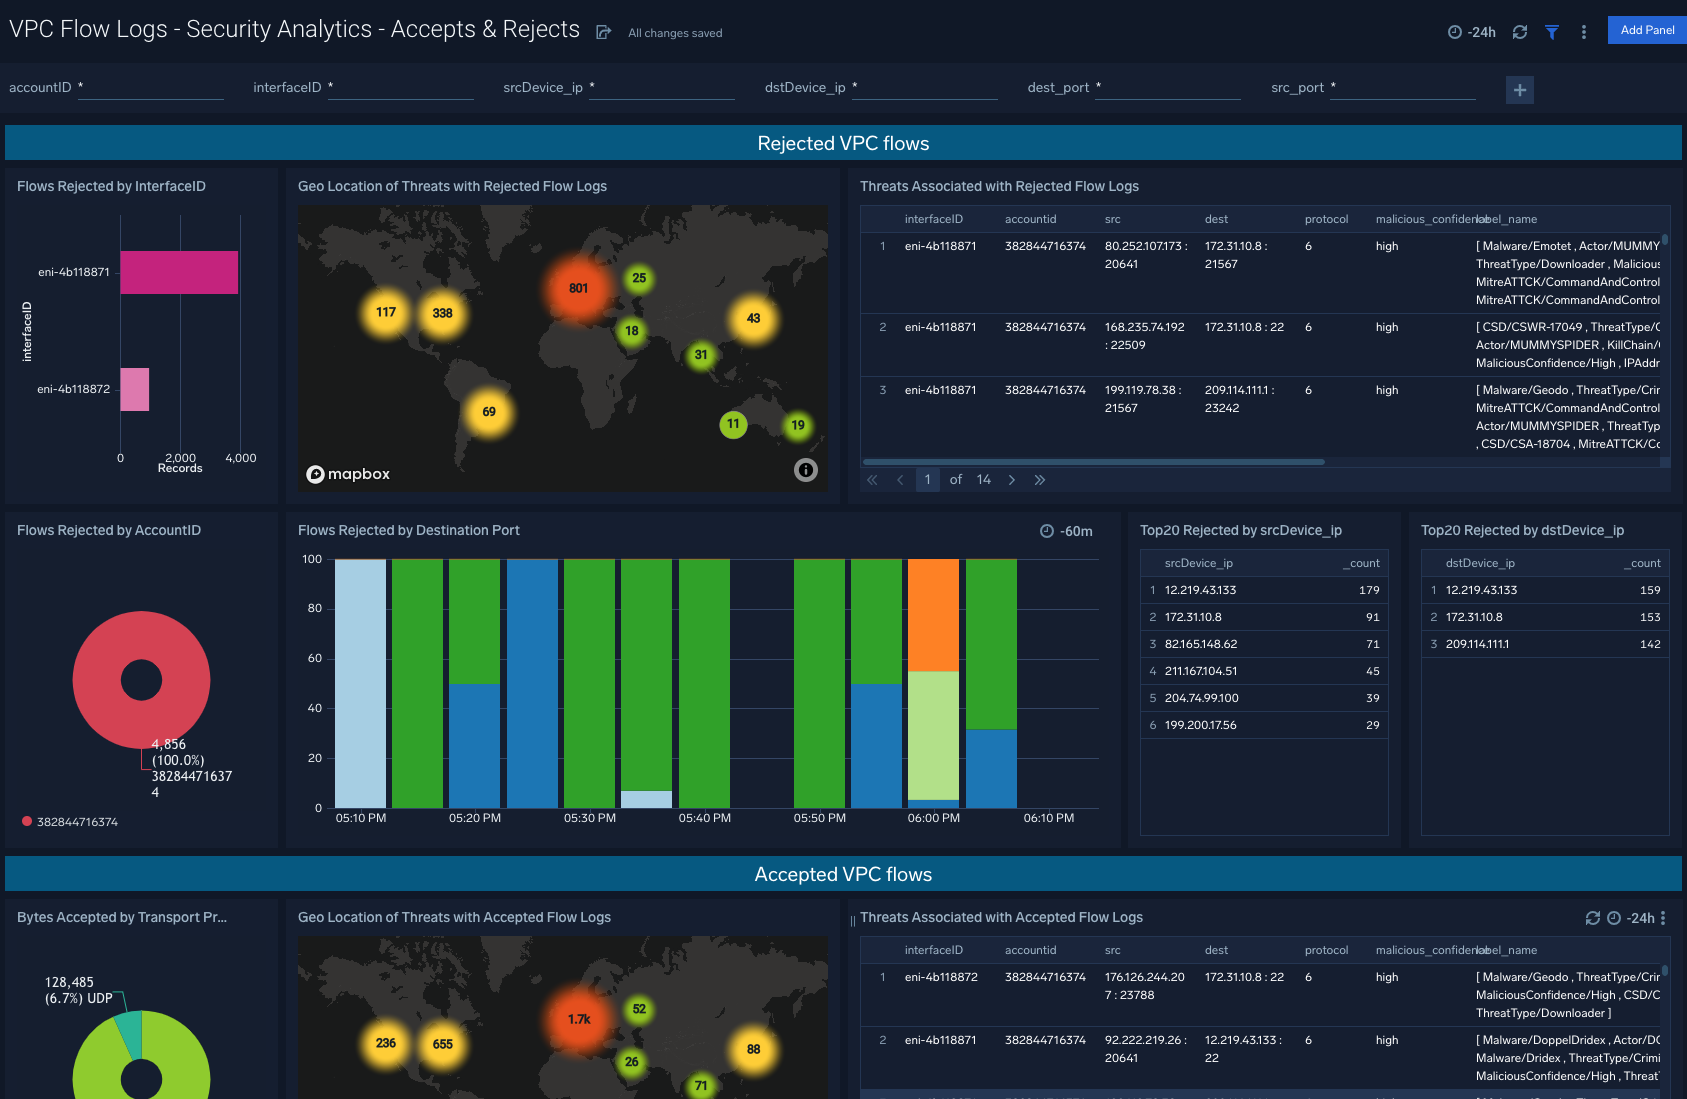
VPC Flow Logs - Security Analytics - Accepts & Rejects
Description: See the details of security group activities and all AWS activities divided by read only and non read only.
Use Case: Provides analysis of group activity events including revoking and authorizing access, creating and deleting groups, and other events.
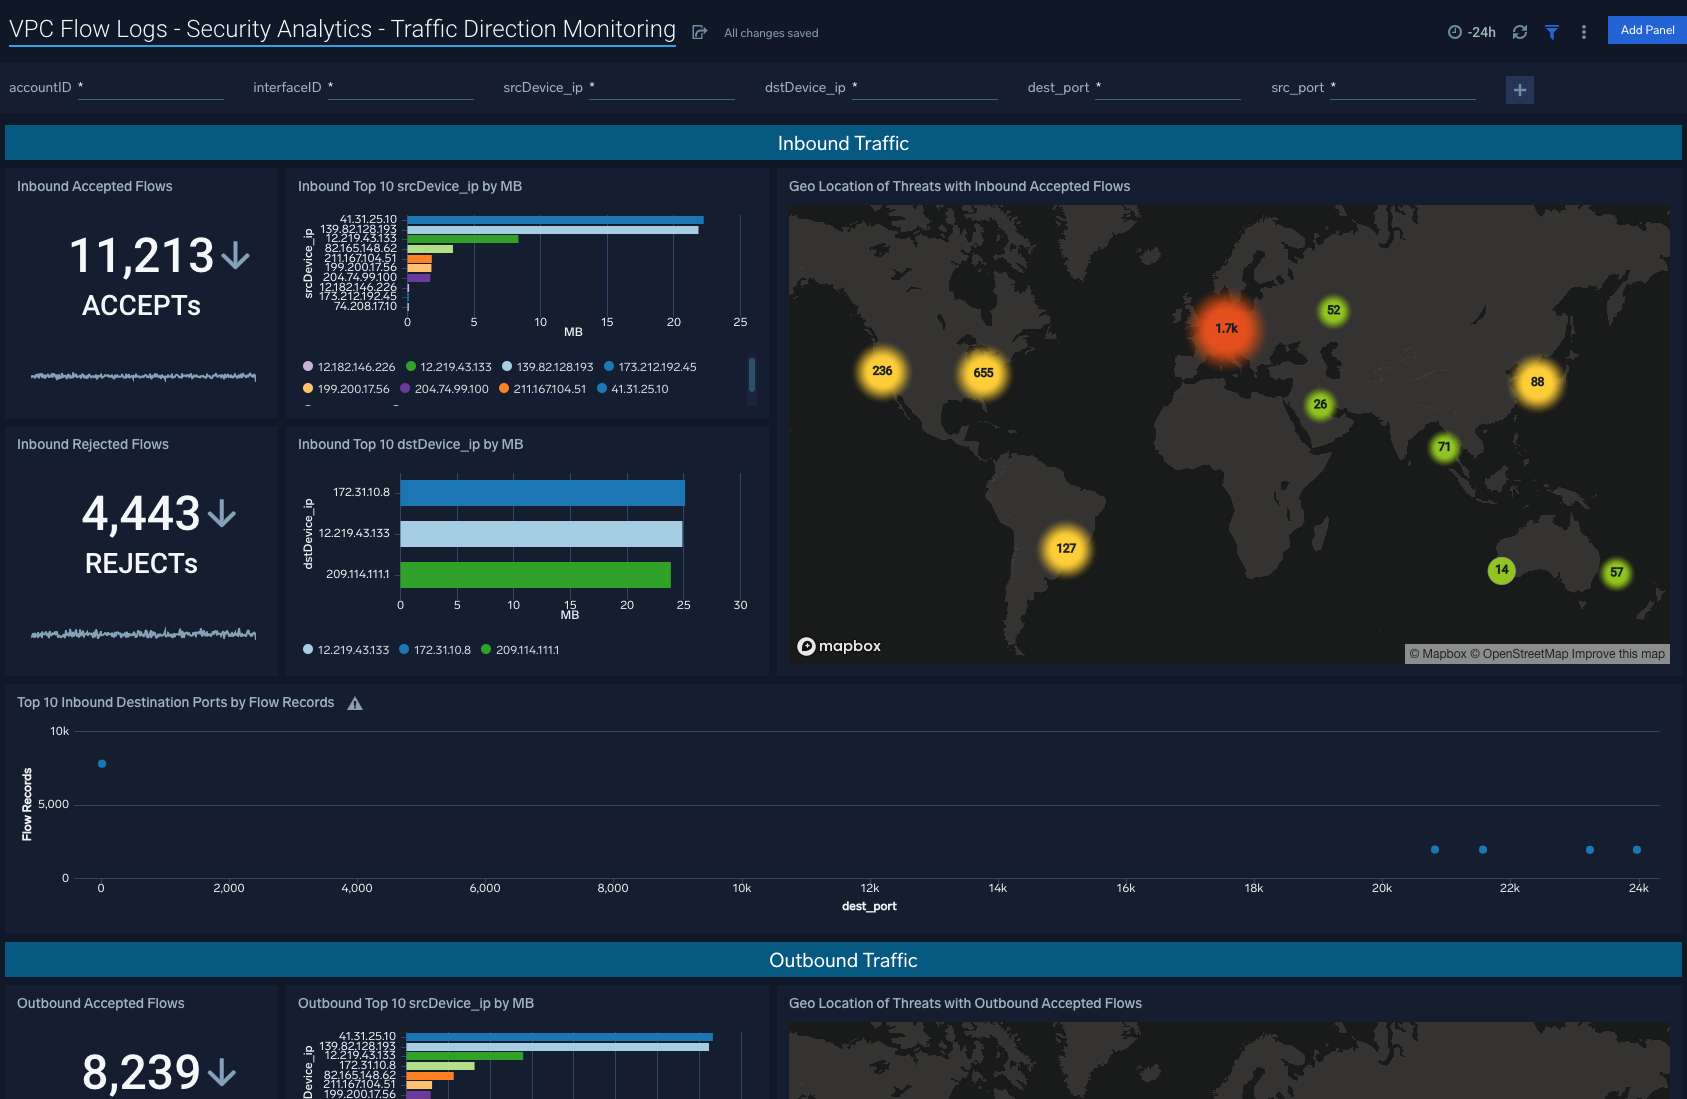
VPC Flow Logs - Security Analytics - Traffic Direction Monitoring
Description: See the details of security group activities and all AWS activities divided by read only and non read only.
Use Case: Provides analysis of group activity events including revoking and authorizing access, creating and deleting groups, and other events.
Use Case: Provides analysis of group activity events including revoking and authorizing access, creating and deleting groups, and other events.