AWS Security Hub Cloud Security Monitoring and Analytics
The Sumo Logic AWS Security Hub app is designed to extract key findings from the AWS Security Hub, which is designed to centrally view and manage security alerts and automate security checks. The additional level of analysis within these dashboards surfaces the most relevant findings and takes a focused approach to improve overall security posture. Finding types and severity levels act as leading indicators for security engineers to go into security incidents with the most relevant technical details to address active threats.
Collecting Findings
To set up Collection, follow the instructions provided at Collect findings for the AWS Security Hub App.
Installing the AWS Security Hub App
Now that you've set up ingested and collected findings for AWS Security Hub, you can install the Sumo Logic App for AWS Security Hub and use the preconfigured searches and Dashboards that provide insight into your data.
To install the app, do the following:
Next-Gen App: To install or update the app, you must be an account administrator or a user with Manage Apps, Manage Monitors, Manage Fields, Manage Metric Rules, and Manage Collectors capabilities depending upon the different content types part of the app.
- Select App Catalog.
- In the 🔎 Search Apps field, run a search for your desired app, then select it.
- Click Install App.
note
Sometimes this button says Add Integration.
- Click Next in the Setup Data section.
- In the Configure section of your respective app, complete the following fields.
- Field Name. If you already have collectors and sources set up, select the configured metadata field name (eg _sourcecategory) or specify other custom metadata (eg: _collector) along with its metadata Field Value.
- Click Next. You will be redirected to the Preview & Done section.
Post-installation
Once your app is installed, it will appear in your Installed Apps folder, and dashboard panels will start to fill automatically.
Each panel slowly fills with data matching the time range query received since the panel was created. Results will not immediately be available but will be updated with full graphs and charts over time.
Viewing AWS Security Hub dashboards
Each dashboard has a set of filters that you can apply to the entire dashboard. Click the funnel icon in the top dashboard menu bar to display a scrollable list of filters that narrow search results across the entire dashboard.
AWS Security Hub - Security Monitoring - Overview
See the overview of Security Hub findings broken down by severity. Filters are available to limit the dashboard panels to specific account IDs, finding IDs, finding types, normalized severity, and title.
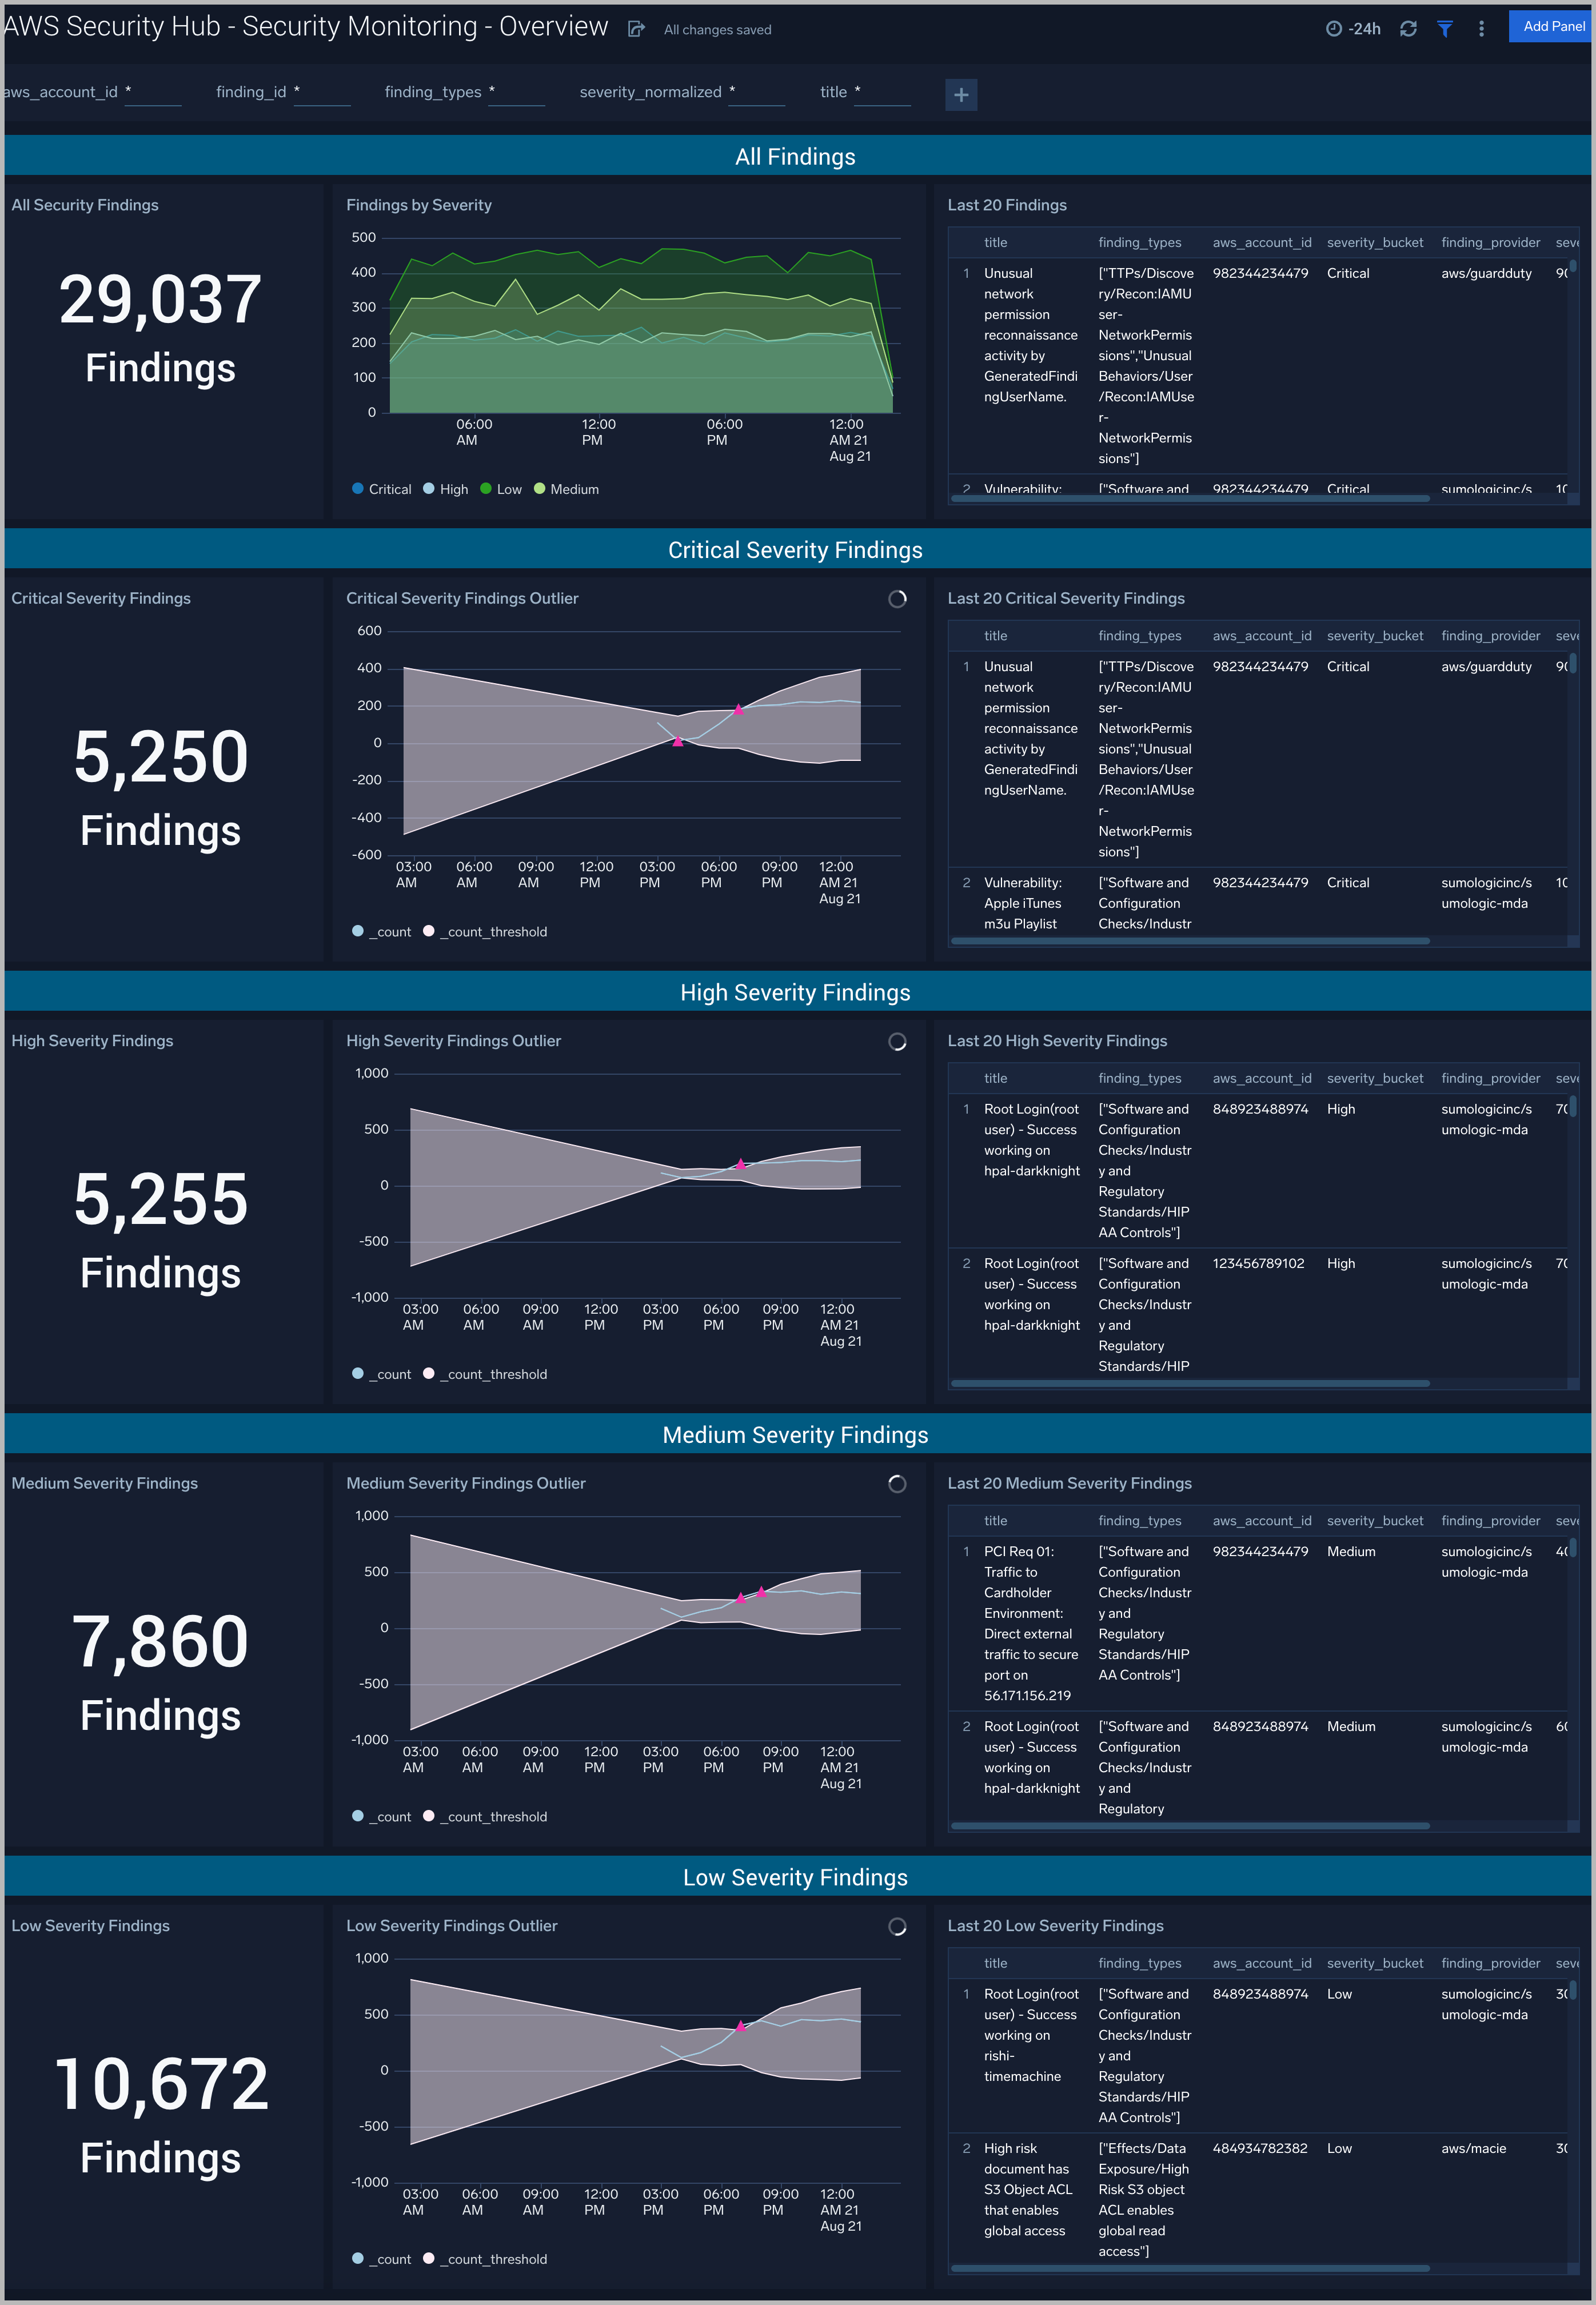
Findings Summary
All Security Findings. See the count of total findings of the last 24 hours by default or the dashboard time window setting.
Findings by Severity. Line chart showing the relative volumes of findings over the last 24 hours by default or the dashboard time window setting separated by severity.
Last 20 Findings. Provides a table detailing the 20 most recent findings.
Critical, High, Medium, Low Severity Findings
All panels for Critical, High, Medium, and Low Severity findings are the same. The only difference is filtering based on the listed severity level.
Severity Findings. See the count of findings at this severity over the last 24 hours by default or the dashboard time window setting.
Severity Outliers. Review the trending volume of findings at this severity level over the last 24 hours by default or the dashboard time window setting. The gray thresholds show ranges within 3 standard deviations of the past 10 mean values. Pink triangles show values that exceed that threshold and are likely points of investigation considering the large change in volume of findings.
Last 20 Severity Findings. See the details of the last 20 findings at this severity level.
AWS Security Hub - Security Analytics - Compliance
See the overview of Security Hub findings broken down by compliance status. Filters are available to limit the dashboard panels to specific account IDs, finding IDs, finding types, normalized severity, title, and compliance status.
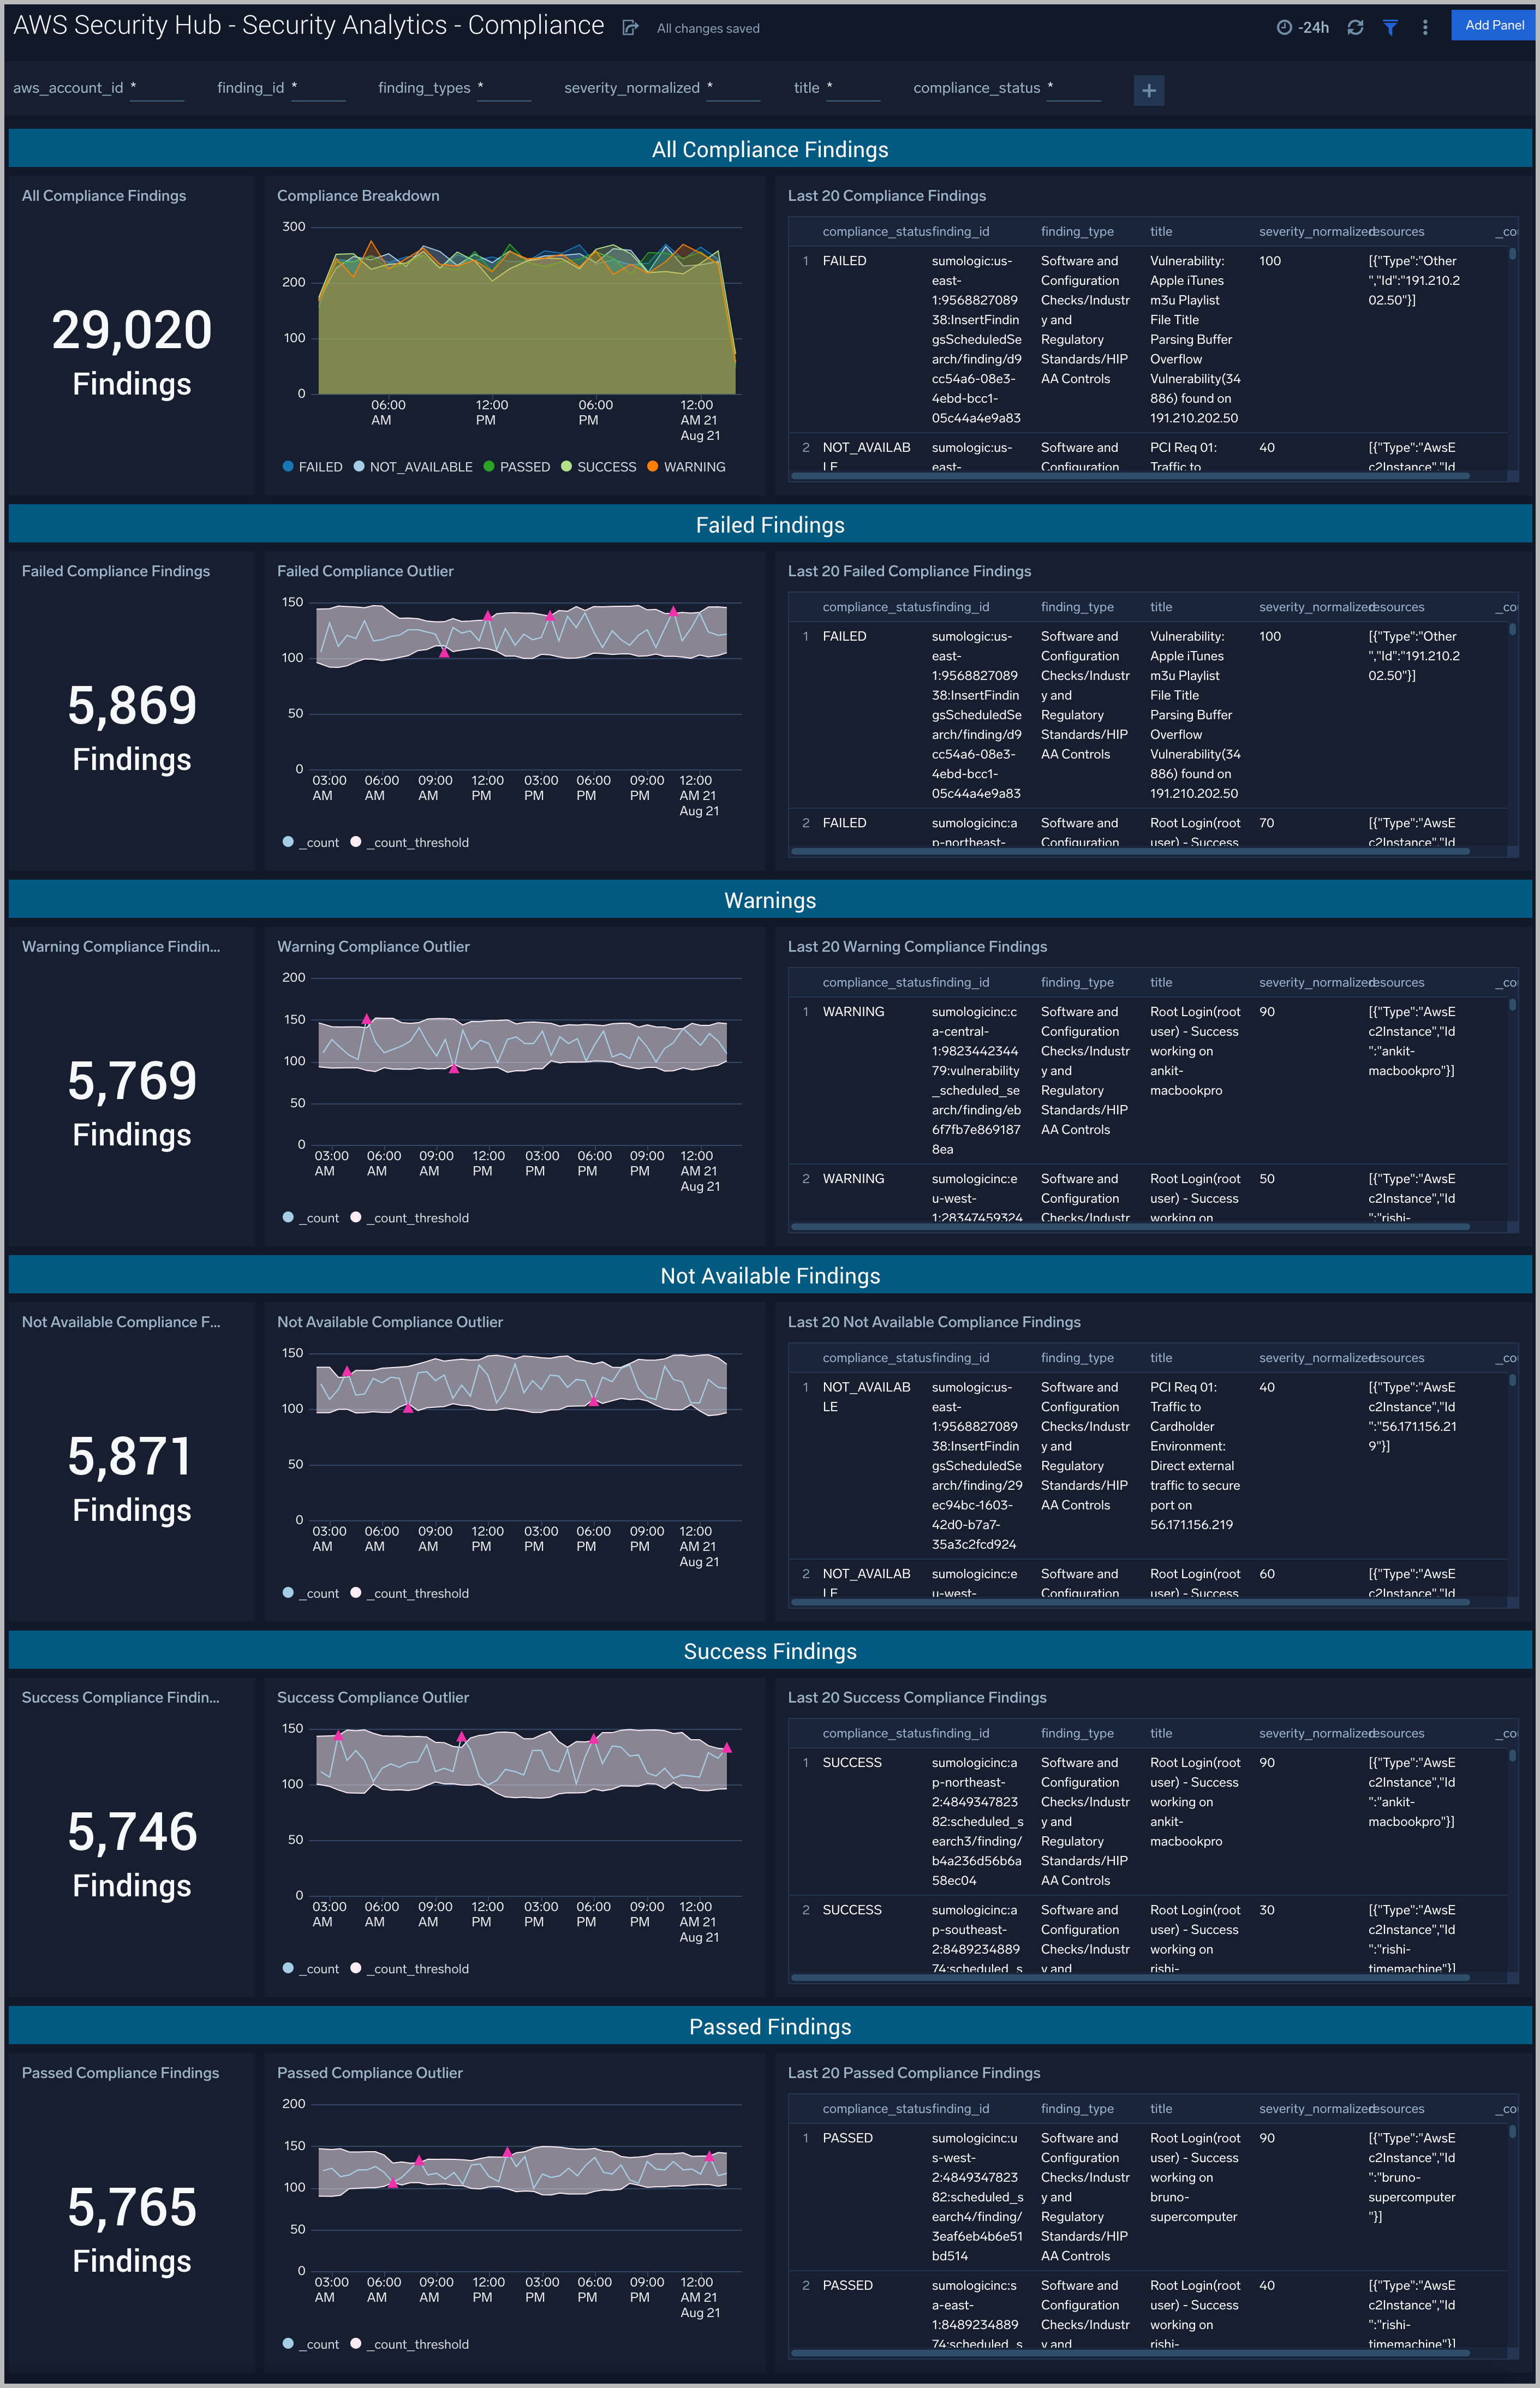
Findings Summary
All Compliance Findings. See the count of total findings of the last 24 hours by default or the dashboard time window setting.
Compliance Breakdown. Line chart showing the relative volumes of findings over the last 24 hours by default or the dashboard time window setting separated by severity. One or more compliance statuses can be filtered by selecting the status from the legend at the bottom of the chart.
Last 20 Compliance Findings. Provides a table detailing the 20 most recent findings.
Failed, Warning, Not Available, Success, and Passed Findings.
All panels for each section of findings are the same. The only difference is filtering based on the compliance status.
Compliance Findings. See the count of findings at this status over the last 24 hours by default or the dashboard time window setting.
Severity Outliers. Review the trending volume of findings at this severity level over the last 24 hours by default or the dashboard time window setting. The gray thresholds show ranges within 3 standard deviations of the past 10 mean values. Pink triangles show values that exceed that threshold and are likely points of investigation considering the large change in volume of findings.
Last 20 Severity Findings. See the details of the last 20 findings at this severity level.