Linux - Cloud Security Monitoring and Analytics - OpenTelemetry

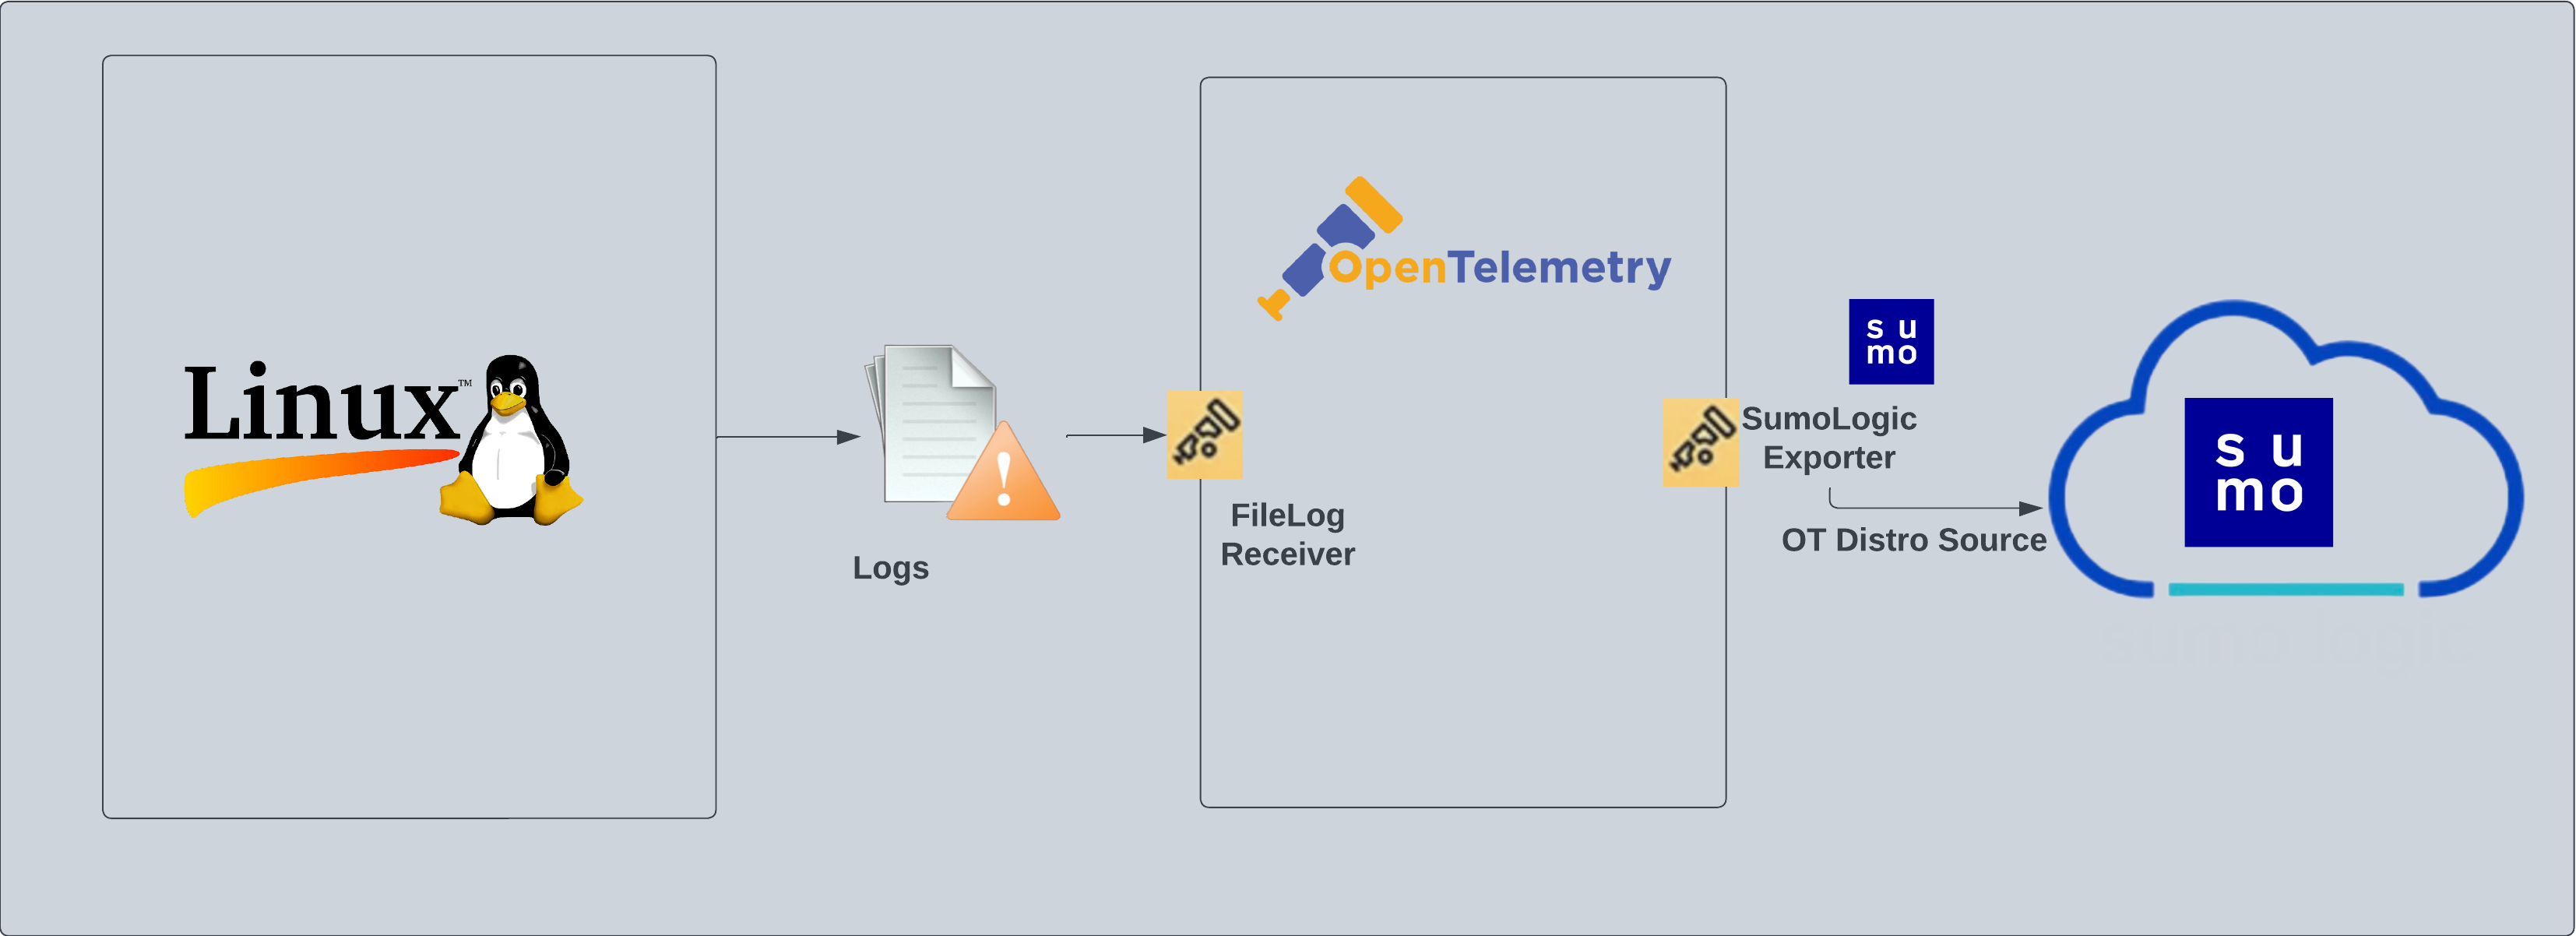
Linux - Cloud Security Monitoring and Analytics - OpenTelemetry is a unified log app that ingests distribution of Linux data to Sumo Logic via OpenTelemetry filelog receiver. The app's preconfigured dashboards provide insight into user, service, systems, login, and privilege activity, providing a better understanding of your production environments and surface relevant insights by tuning out-of-the-box content to align with your security team's focus.
Fields created in Sumo Logic for Linux - Security Analytics
The following tag will be created as part of Linux app installation, if not already present.
sumo.datasource. Has a fixed value of linux.
Prereqisites
This app is based on the following log files from the Ubuntu Linux machine.
- auth.log
- syslog
- daemon.log
- dpkg.log
- kern.log
- CentOS, Amazon Linux, and Red Hat
- audit/audit.log
- secure
- messages
- yum.log
If you've already configured collection of these log files (for example, during Linux or Linux - PCI app setup), then no additional log file collection is required. If any of the log files are missing, you can configure the missing file collection in the next step.
For Linux systems with ACL Support, the otelcol install process should have created the ACL grants necessary for the otelcol system user to access default log locations. You can verify the active ACL grants using the getfacl command. Install the ACL in your Linux environment, if not installed.
The required ACL may not be supported for some rare cases, for example, Linux OS Distro, which is officially not supported by Sumo Logic. In this case, you can run the following command to explicitly grant the permissions.
sudo setfacl -R -m d:u:otelcol-sumo:r-x,d:g:otelcol-sumo:r-x,u:otelcol-sumo:r-x,g:otelcol-sumo:r-x <PATH_TO_LOG_FILE>
Run the above command for all the log files in the directory that need to be ingested, which are not residing in the default location.
If Linux ACL Support is not available, traditional Unix-styled user and group permission must be modified. It should be sufficient to add the otelcol system user to the specific group that has access to the log files.
Collection configuration and app installation
As part of data collection setup and app installation, you can select the App from App Catalog and click on Install App. Follow the steps below.
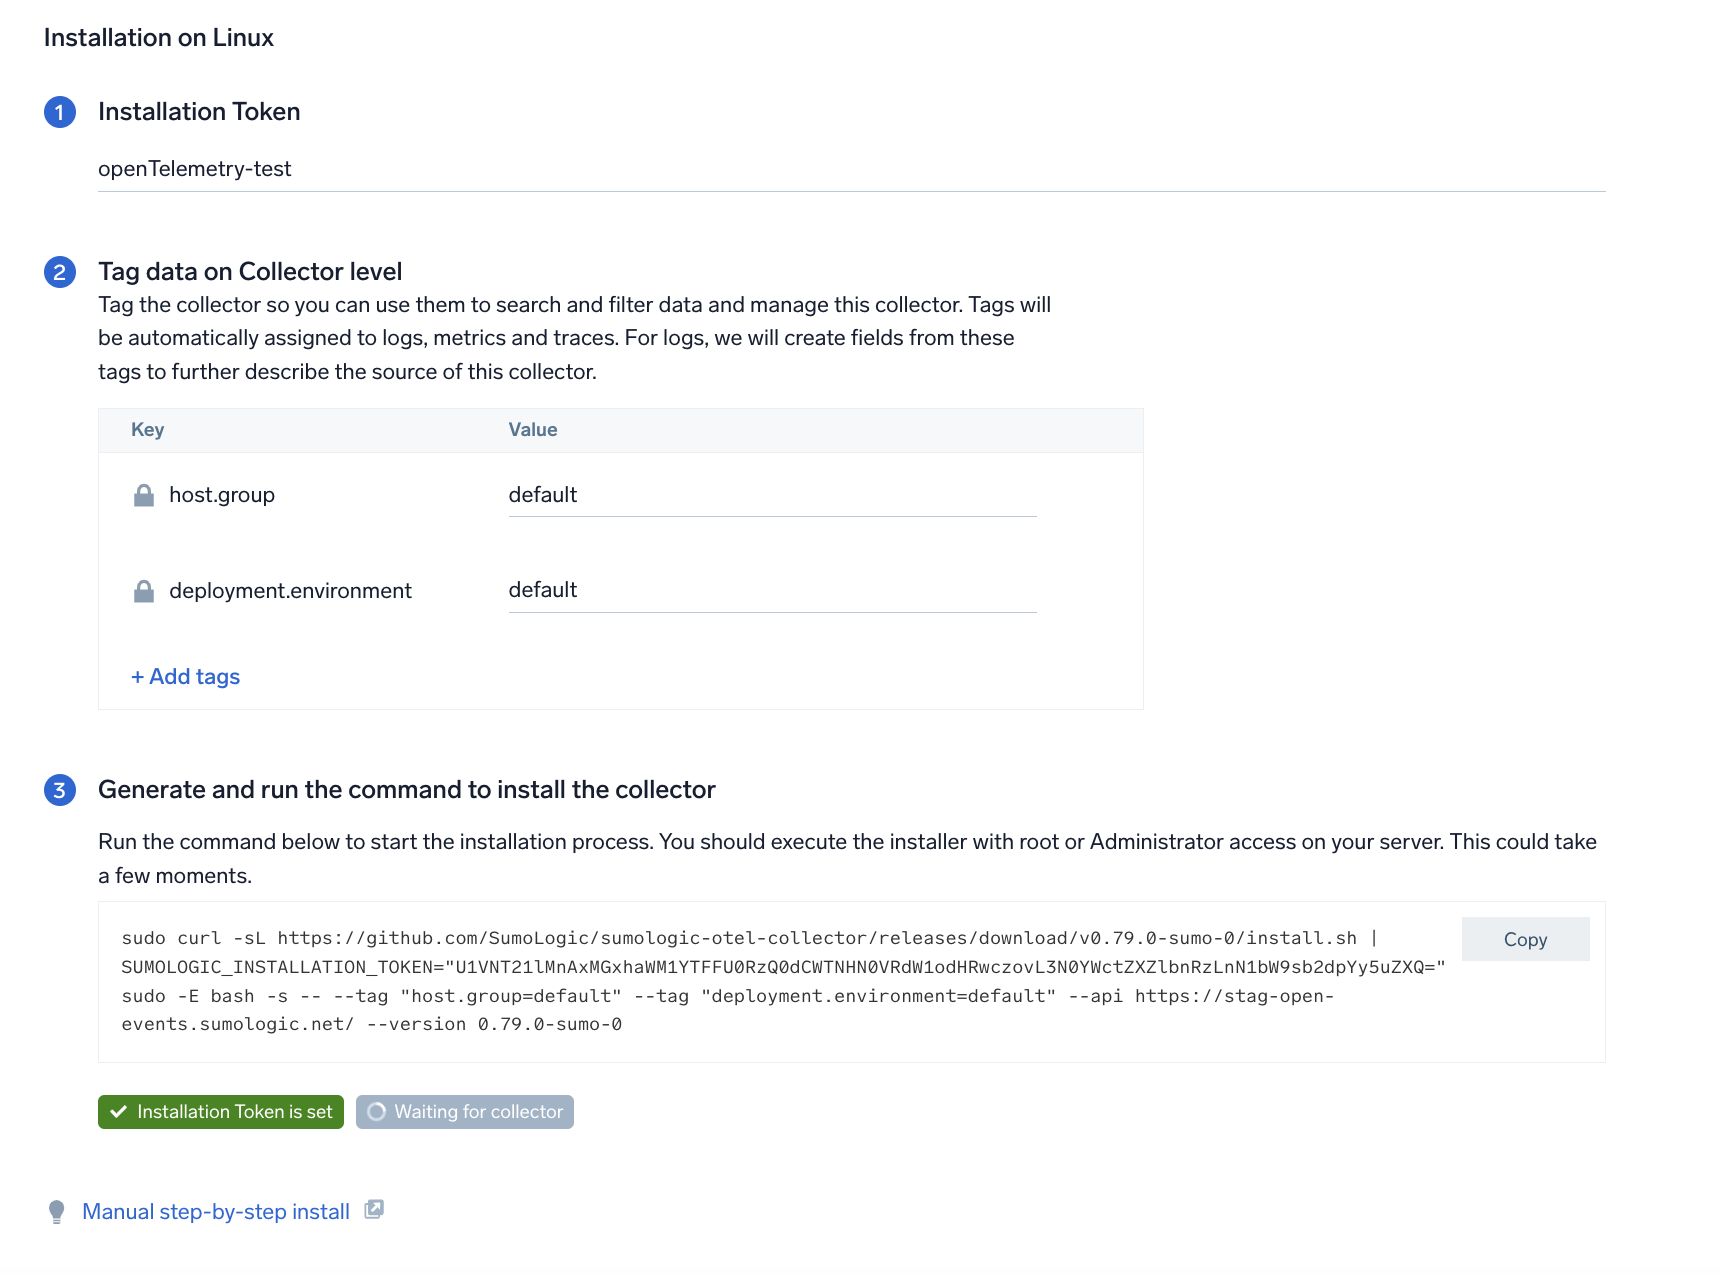
Step 1: Set up Collector
If you want to use an existing OpenTelemetry Collector, you can skip this step by selecting the Use an existing Collector option.
To create a new Collector:
- Select the Add a new Collector option.
- Select the platform where you want to install the Sumo Logic OpenTelemetry Collector.
This will generate a command that you can execute in the machine environment you need to monitor. Once executed, it will install the Sumo Logic OpenTelemetry Collector.
Step 2: Configure integration
In this step, you will configure the YAML required for Linux collection. The app requires path for system log file based on the Linux version used.
Required Logs for Ubuntu
The following logs, located in the /var/log folder, are required for using the Sumo Logic app for Cloud Security Monitoring and Analytics for Linux with Ubuntu.
- auth.log
- syslog
- daemon.log
- dpkg.log
- kern.log
Required Logs for CentOS, Amazon Linux, and Red Hat
The following logs, located in the /var/log folder, are required for using the Sumo Logic app for Cloud Security Monitoring and Analytics for Linux with CentOS, Amazon Linux, and Red Hat.
- audit/audit.log
- secure
- Messages
- yum.log
Click on the Download YAML File button to get the YAML file.
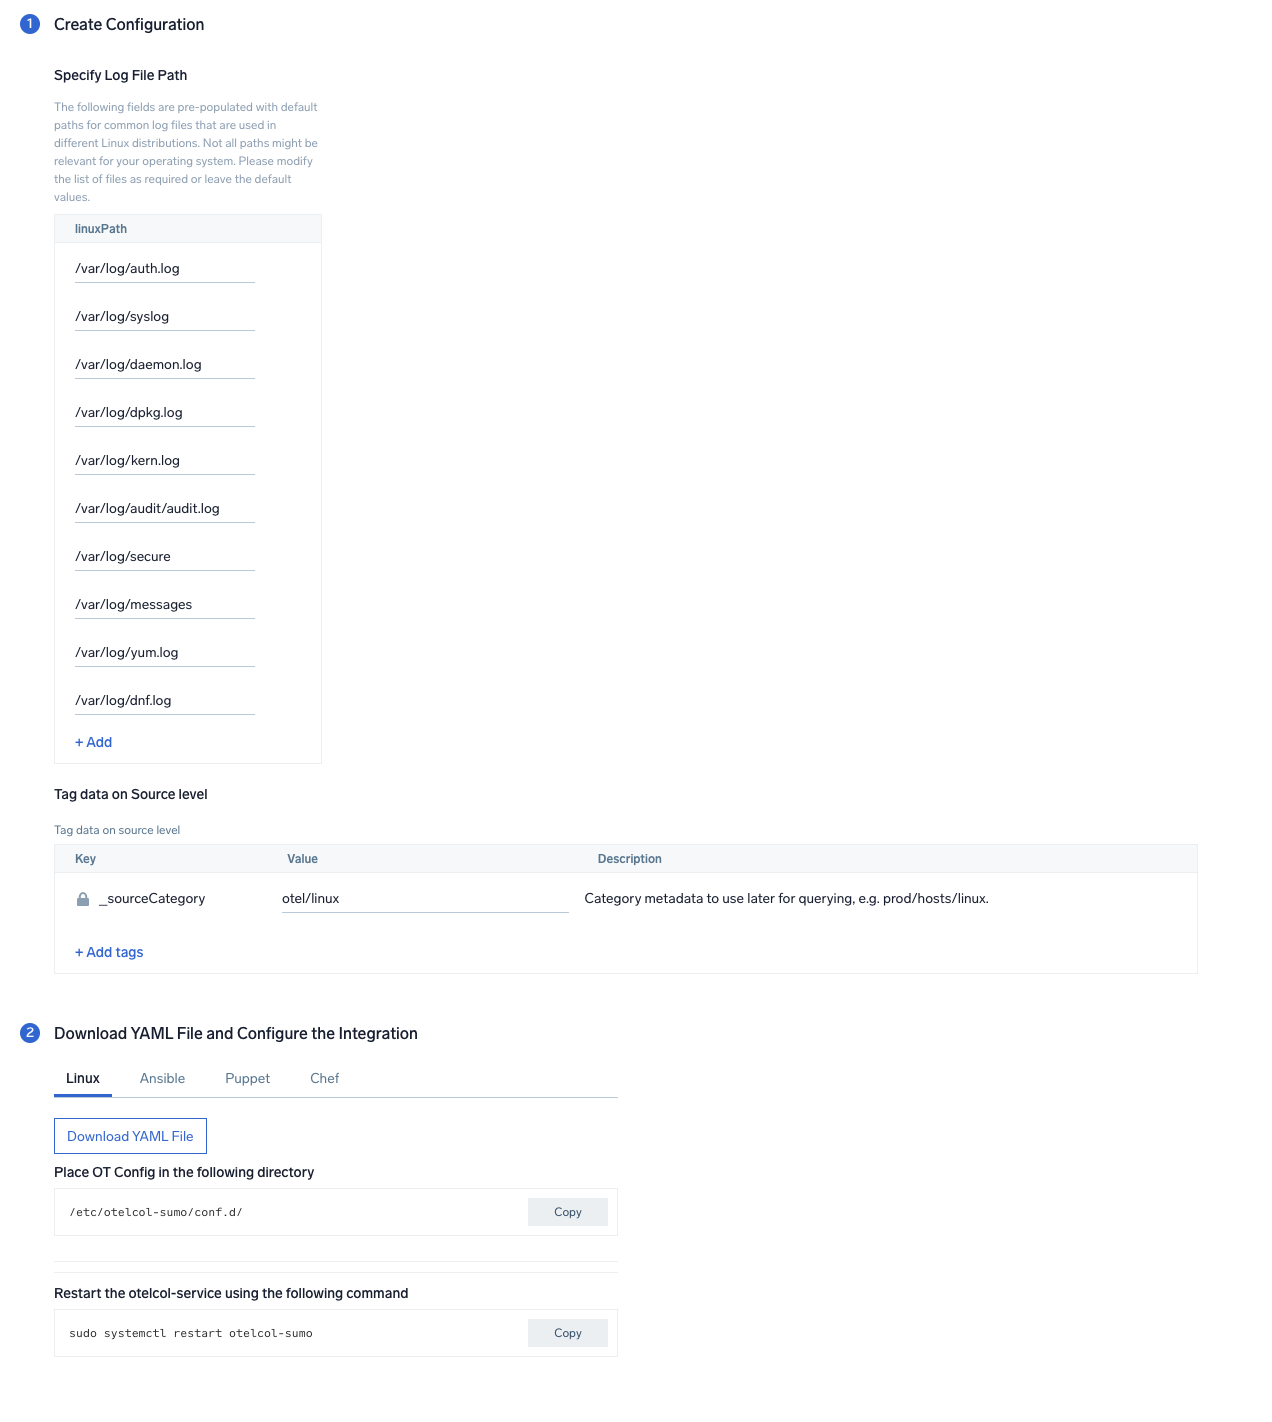
By default, the path for Linux log files required for all the distros are pre-populated in the UI. (Optional) Unwanted file paths can be removed from the list if the files are not available on your Linux distribution. The collection will work even if not all the files are present in your system.
Step 3: Send logs to Sumo Logic
Once you have downloaded the YAML file as described in the previous step, follow the below steps based on your platform.
- Linux
- Chef
- Ansible
- Puppet
- Copy the yaml file to
/etc/otelcol-sumo/conf.d/folder in the Artifactory instance that needs to be monitored. - Restart the collector using:
sudo systemctl restart otelcol-sumo
- Copy the yaml file into your Chef cookbook files directory
files/<downloaded_yaml_file>. - Use a Chef file resource in a recipe to manage it.
cookbook_file '/etc/otelcol-sumo/conf.d/<downloaded_yaml_file>' do mode 0644 notifies :restart, 'service[otelcol-sumo]', :delayed end - Add the recipe to your collector setup to start collecting the data. Every team typically has their established way of applying the Chef recipe. The resulting Chef recipe should look something like:
cookbook_file '/etc/otelcol-sumo/conf.d/<downloaded_yaml_file>' do
mode 0644
notifies :restart, 'service[otelcol-sumo]', :delayed
end
- Place the file into your Ansible playbook files directory.
- Run the Ansible playbook.
ansible-playbook -i inventory install_sumologic_otel_collector.yaml
-e '{"installation_token": "<YOUR_TOKEN>", "collector_tags": {<YOUR_TAGS>}, "src_config_path": "files/conf.d"}'
- Place the file into your Puppet module files directory
modules/install_otel_collector/files/<downloaded_yaml>. - Use a Puppet file resource to manage it.
file { '/etc/otelcol-sumo/conf.d/<downloaded_yaml_file>':
    ensure => present,
    source => 'puppet:///modules/install_otel_collector/<downloaded_yaml_file>',
    mode => '0644',
    notify => Service[otelcol-sumo],
} - Apply the Puppet manifest. Every team typically has their established way of applying the Puppet manifest. The resulting Puppet manifest should look something like:
node 'default' {
    class { 'install_otel_collector'
      installation_token => '<YOUR_TOKEN>',
      collector_tags => { <YOUR_TAGS> },
    }

    service { 'otelcol-sumo':
      provider => 'systemd',
      ensure => running,
      enable => true,
      require => Class['install_otel_collector'],
    }

    file { '/etc/otelcol-sumo/conf.d/<downloaded_yaml_file>':
      ensure => present,
      source => 'puppet:///modules/install_otel_collector/<downloaded_yaml_file>',
      mode => '0644',
      notify => Service[otelcol-sumo],
    }
  }
After successfully executing the above command, Sumo Logic will start receiving data from your host machine.
Click Next. This will install the app (dashboards and monitors) to your Sumo Logic Org.
Dashboard panels will start to fill automatically. It's important to note that each panel fills with data matching the time range query and received since the panel was created. Results won't immediately be available, but within 20 minutes, you'll see full graphs and maps.
Sample log messages
Dec 13 04:44:00 <1> [zypper++] Summary.cc(readPool):133 I_TsU(27372)Mesa-libGL1-8.0.4-20.4.1.i586(@System)
Sample queries
sumo.datasource=linux deployment.environment=* host.group=* host.name=*
| parse regex "\S*\s+\d+\s+\d+:\d+:\d+\s+(?<dest_host>\S*)\s+(?<process>\w*)(?:\[\d+\]:|:)\s*(?<message>.+)$" nodrop
| if (isEmpty(dest_host), _sourceHost, dest_host) as dest_host
| parse regex "(?<service>\w*)\[\d+\]:\s+"
| where !isEmpty(service)
| where dest_host matches "*"
| where process matches "*"
| count as eventCount, first(_messagetime) as latest, last(_messagetime) as earliest by service, dest_host
| formatDate(fromMillis(latest),"MM/dd/yyyy HH:mm:ss Z") as %"LatestTime"
| formatDate(fromMillis(earliest),"MM/dd/yyyy HH:mm:ss Z") as %"EarliestTime"
| fields -latest, earliest, eventCount
| sort by %"LatestTime"
Viewing Linux - Cloud Security Monitoring and Analytics dashboards
All dashboards have a set of filters that you can apply to the entire dashboard. Use these filters to drill down and examine the data to a granular level.
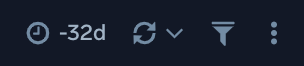
- You can change the time range for a dashboard or panel by selecting a predefined interval from a drop-down list, choosing a recently used time range, or specifying custom dates and times. Learn more.
- If required, configure the refresh interval rate for a dashboard or panel by clicking the drop-down arrow next to the refresh icon.
- Click the funnel icon in the dashboard top menu bar to filter dashboard with Template Variables.
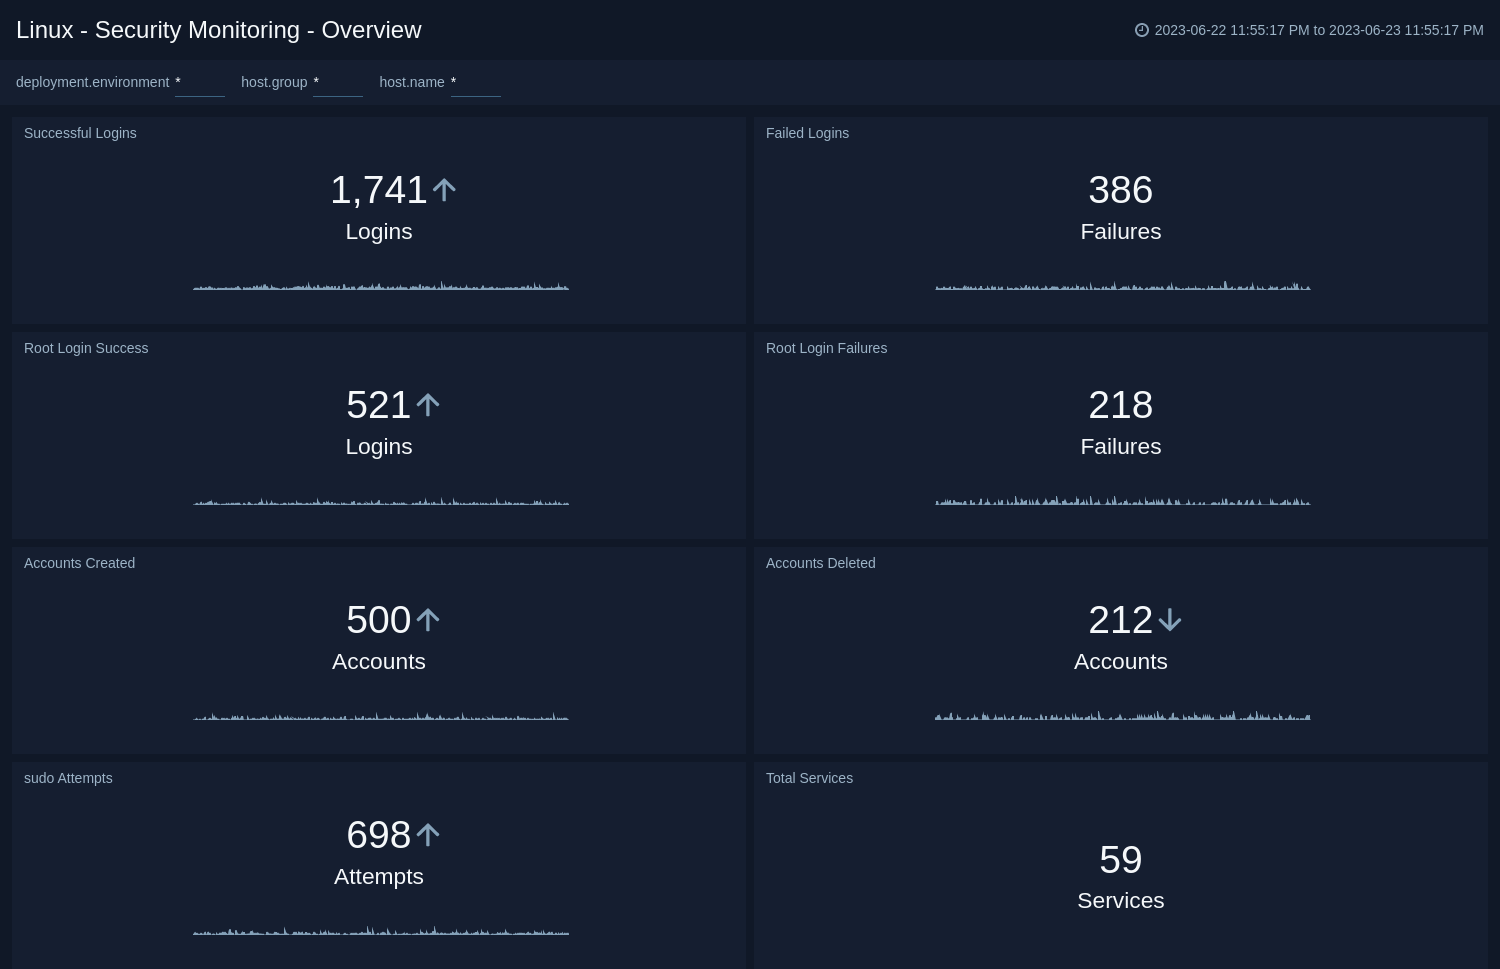
Overview
The Linux - Security Analytics - Overview dashboard provides an overview of security statistics relevant for Linux systems and presents information about successful and failed logins, root login successes and failures, user accounts created and deleted, sudo attempts, and total services.
Use this dashboard to:
- Monitor administrative actions (create, delete users) performed by end users.
- Ensure proper services are running on all systems.
- Detect attempts to change the system time.
- Verify the status of critical systems.
- Monitor excessive failed login attempts and detect total number of attempts to break into the system.
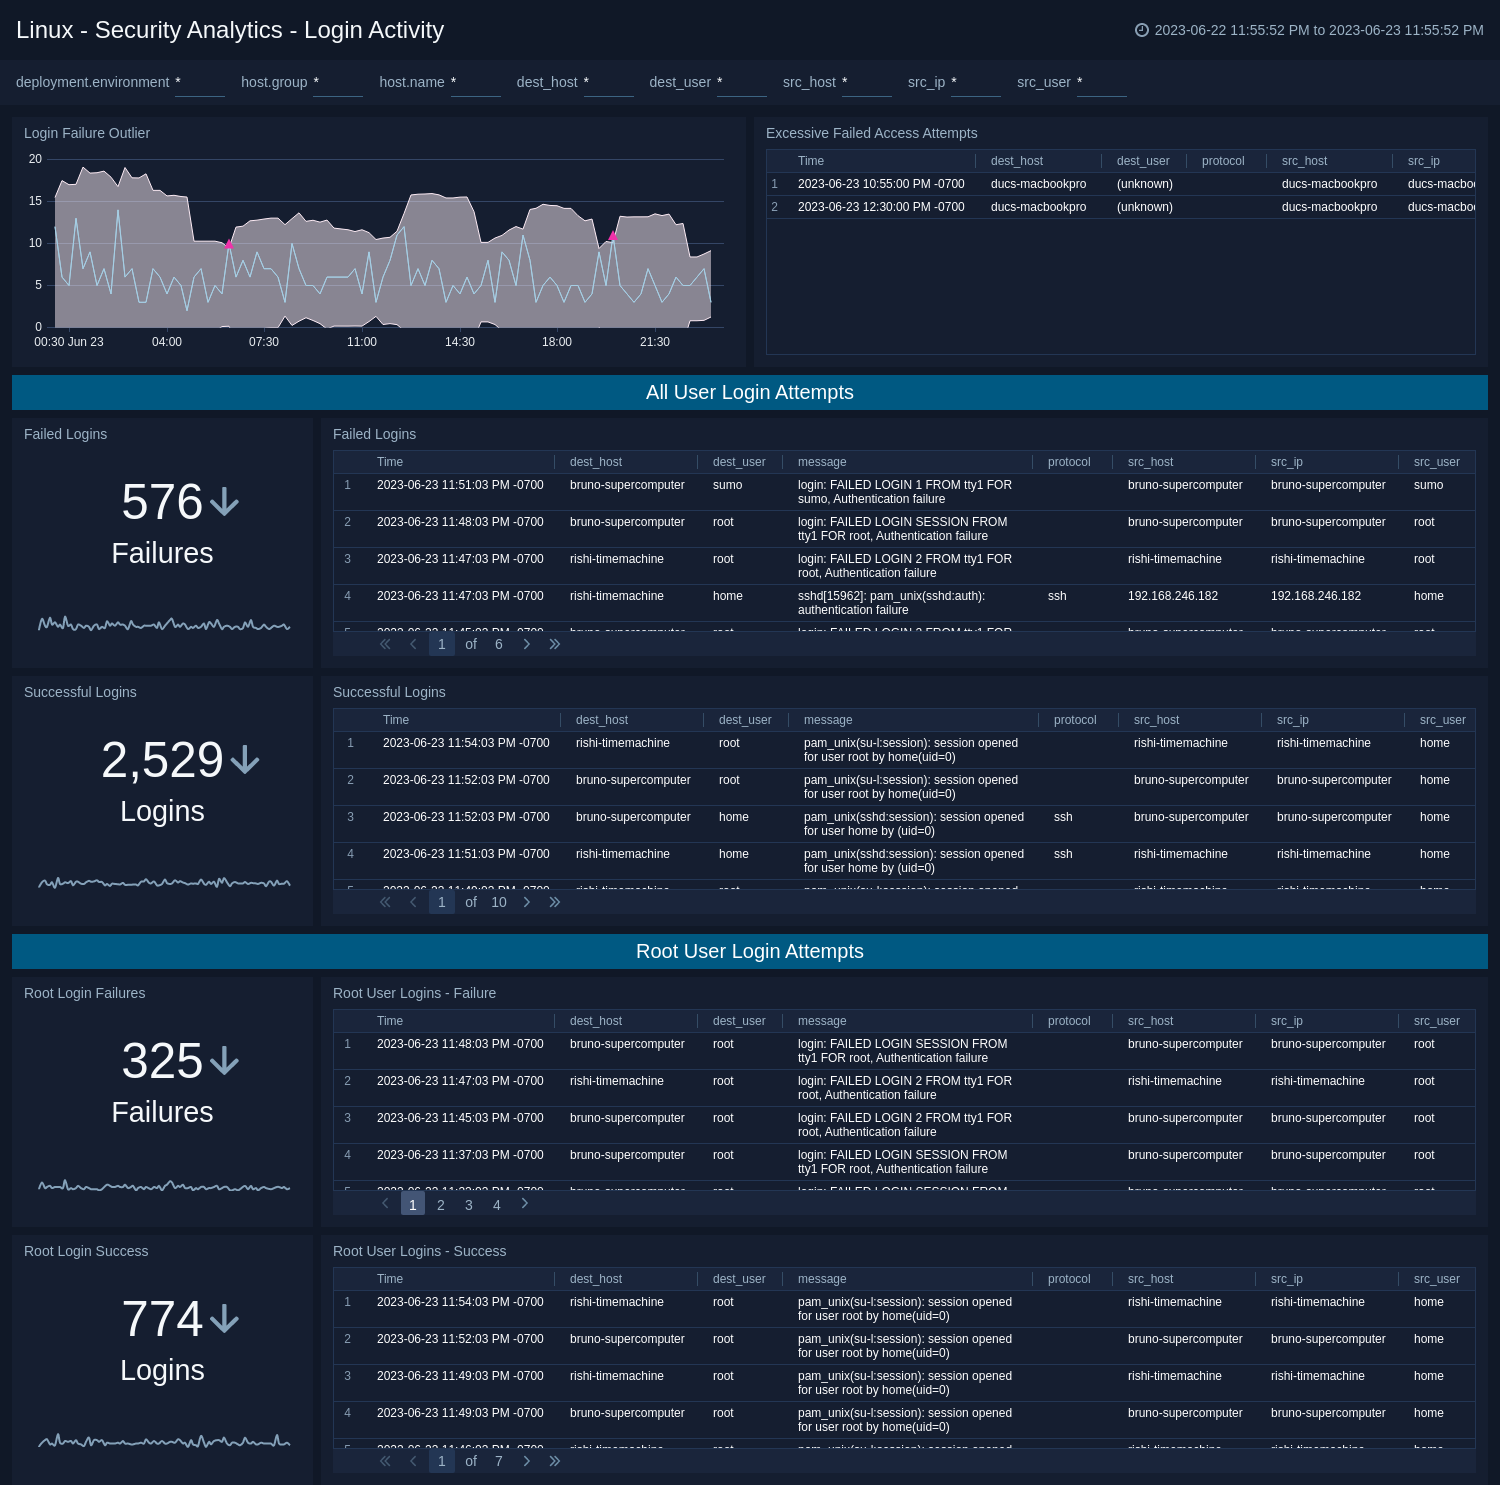
Login Activity
The Linux - Security Analytics - Login Activity dashboard tracks the login activity and provides information about failed and successful user and root logins.
Use this dashboard to:
- Monitor access to the Linux computing environment.
- Monitor failed and successful user logins.
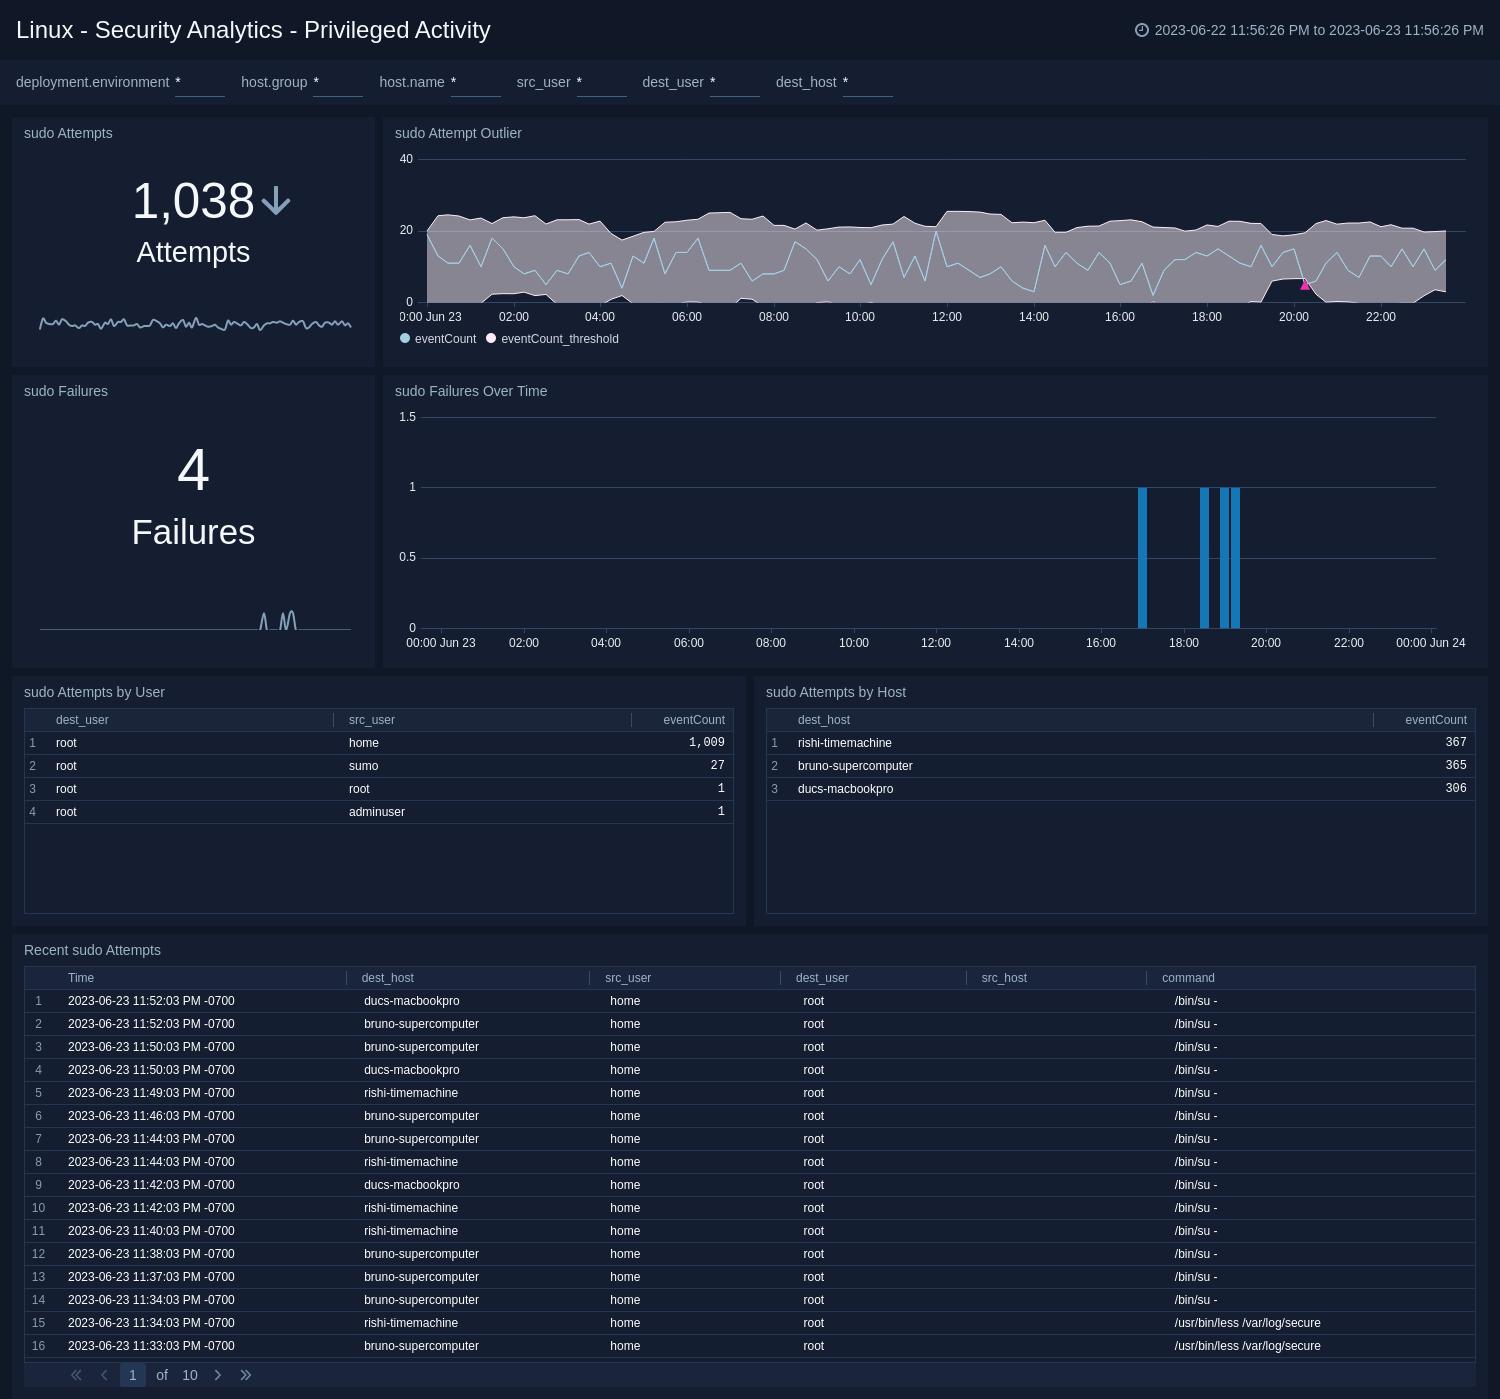
Privileged Activity
The Linux - Security Analytics - Privileged Activity dashboard provides information about total sudo attempts, failed sudo attempts, top 10 users and hosts that have issued sudo attempts, recent sudo attempts, and sudo attempts over time.
Use this dashboard to:
- Monitor successful and failed access attempts to systemswith administrative privileges.
- Monitor actions performed by users with administrative privileges.
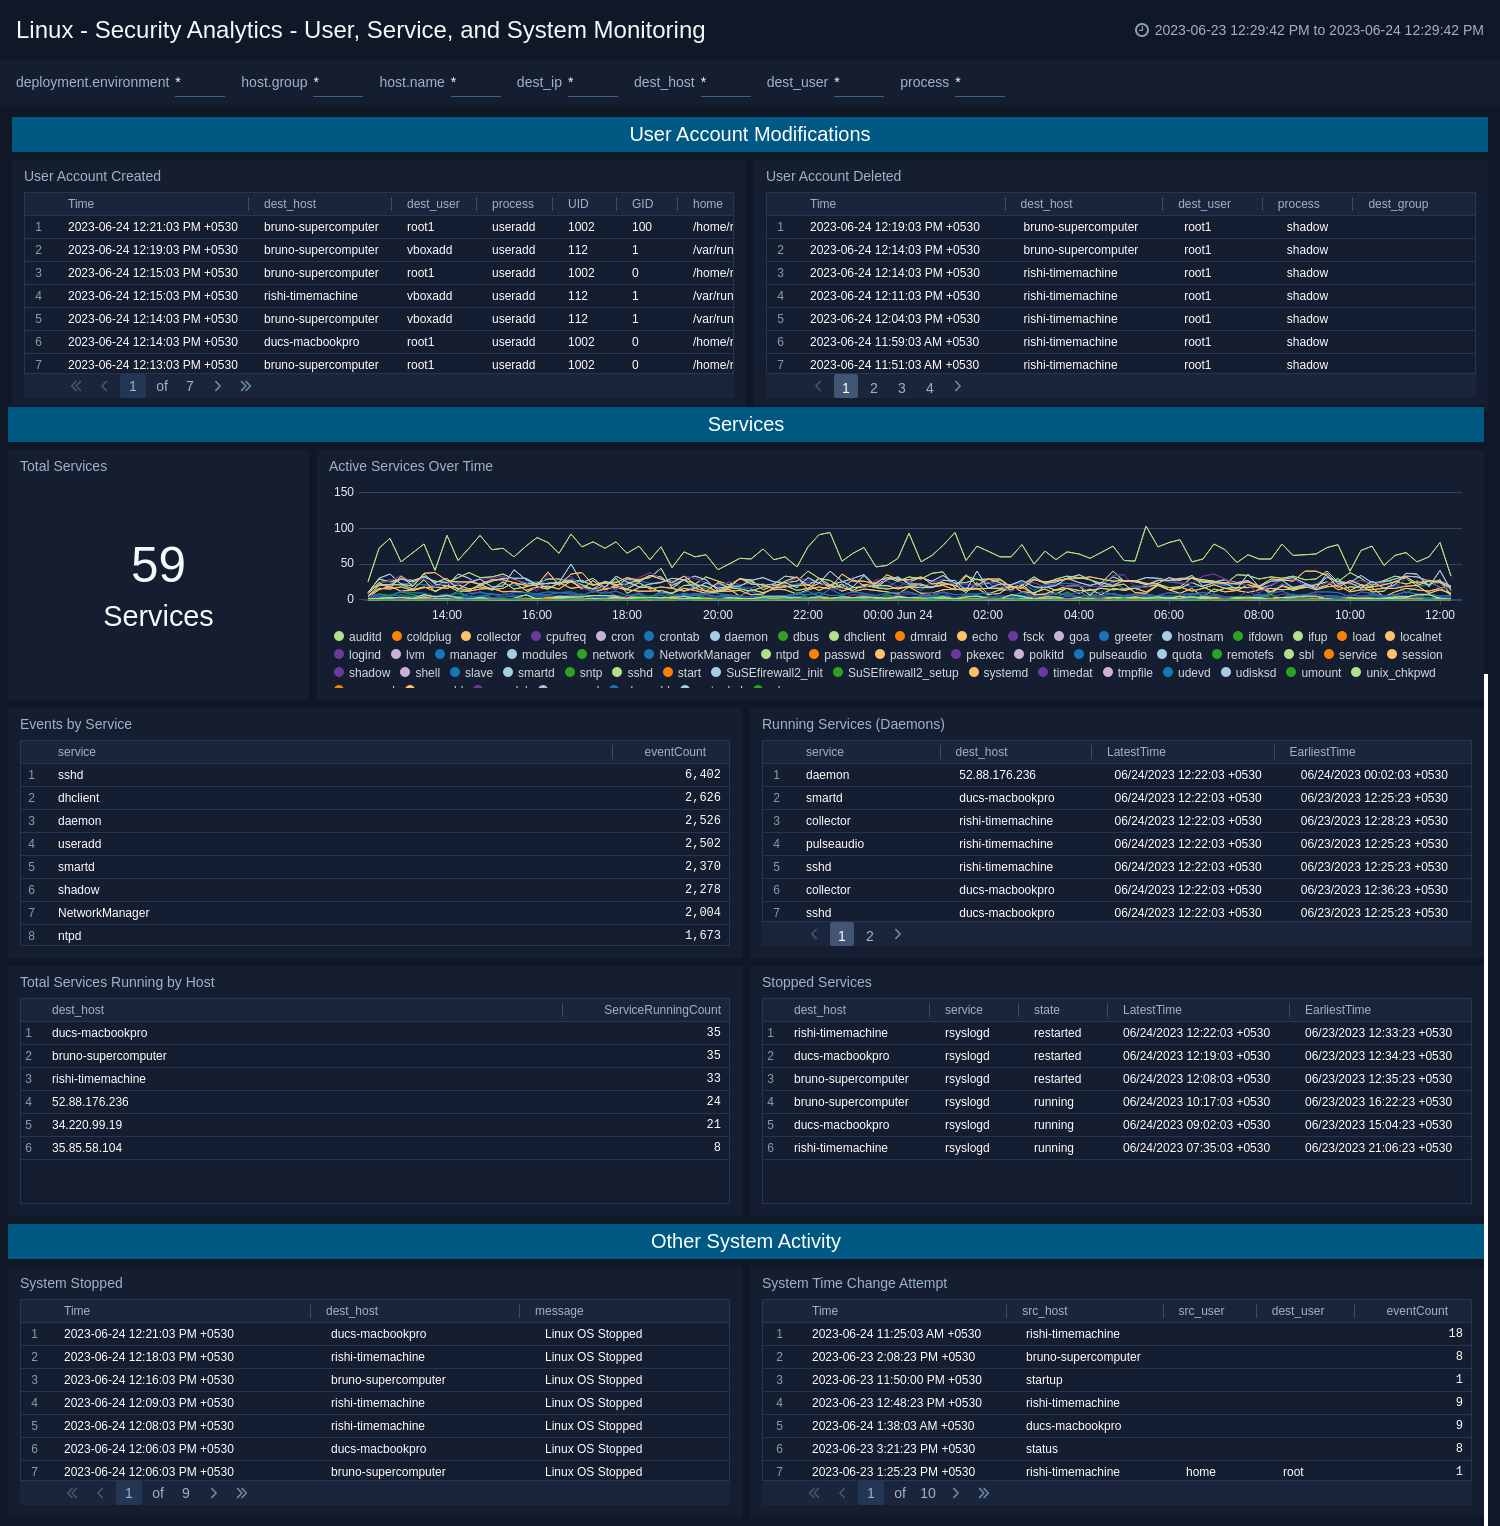
User, Service, and System Monitoring
The Linux - Security Analytics - User, Service, and System Monitoring dashboard provides information about total sudo attempts, failed sudo attempts, top 10 users and hosts that have issued sudo attempts, recent sudo attempts, and sudo attempts over time.
Use this dashboard to:
- Monitor accounts created and deleted.
- Monitor service usage and other system activity.
Create monitors for Linux - Cloud Security Monitoring and Analytics app
From your App Catalog:
- From the Sumo Logic navigation, select App Catalog.
- In the Search Apps field, search for and then select your app.
- Make sure the app is installed.
- Navigate to What's Included tab and scroll down to the Monitors section.
- Click Create next to the pre-configured monitors. In the create monitors window, adjust the trigger conditions and notifications settings based on your requirements.
- Scroll down to Monitor Details.
- Under Location click on New Folder.
note
By default, monitor will be saved in the root folder. So to make the maintenance easier, create a new folder in the location of your choice.
- Enter Folder Name. Folder Description is optional.
tip
Using app version in the folder name will be helpful to determine the versioning for future updates.
- Click Create. Once the folder is created, click on Save.
Linux - Cloud Security Monitoring and Analytics alerts
| Name | Description | Alert Condition | Recover Condition |
|---|---|---|---|
Linux CSMA - Excessive Failed Authentication | This alert is triggered when multiple failed login attempts from the same source are detected, indicating potential brute force attempts. | Count > 10 | Count <= 10 |
Linux CSMA - Root Login Detection | This alert is triggered when direct login attempts using the root account are detected, indicating a potential security concern since root logins should typically be disabled. | Count >= 1 | Count < 1 |
Linux CSMA - System Shutdown Detection | This alert is triggered when unexpected system shutdown events are detected through kernel stop messages, which may indicate unauthorized access, malicious activity, power issues, or system failures. | Count > 0 | Count <= 0 |
Linux CSMA - User Account Creation Spike | This alert is triggered when multiple user accounts are created in a short time period, which may indicate automated account creation, compromised systems, or unauthorized bulk user provisioning. | Count > 3 | Count <= 3 |