Palo Alto Firewall 9 Cloud Security Monitoring and Analytics
The Palo Alto Firewall app helps you to analyze traffic and gain a better understanding of your Palo Alto Networks environments. Dig deep into the data, broken down by threat detection indicators, malware type, and so in order to break out data for higher granularity.
Log types
The app uses Traffic and Threat logs.
Sample log messages
Oct 09 10:19:15 SumPunFw07.sumotest.com 1,2019/10/09 10:19:15,001234567890002,TRAFFIC,drop,2304,2019/10/09 10:19:15,209.118.103.150,160.177.222.249,0.0.0.0,0.0.0.0,InternalServer,,,not-applicable,vsys1,inside,z1-FW-Transit,ethernet1/2,,All traffic,2019/10/09 10:19:15,0,1,63712,443,0,0,0x0,udp,deny,60,60,0,1,2019/10/09 10:19:15,0,any,0,0123456789,0x0,Netherlands,10.0.0.0-10.255.255.255,0,1,0,policy-deny,0,0,0,0,,SumPunFw07,from-policy,,,0,,0,,N/A,0,0,0,0,1202585d-b4d5-5b4c-aaa2-d80d77ba456e,0
786 <10>1 2022-03-29T22:32:26+00:00 PA-VM.demo.bkacad.cf - - - - ,2022/03/29*22:32:26,164859314646745,THREAT,vulnerability,,2022/03/29*22:32:26,156.194.158.165,156.194.158.165,156.194.158.165,156.194.158.165,test-threat,,,unknown-udp,vsys1,Outside,Outside,ethernet1/1,ethernet1/1,Forward-Sumo,,8660,1,47495,9034,0,0,0x2000,udp,drop,,Realtek Jungle SDK Remote Code Execution Vulnerability(91535),any,critical,client-to-server,1648593146467628956,0x0,Korea Republic Of,156.194.158.165-156.194.158.165,,,0,,,0,,,,,,,,0,0,0,0,0,,PA-VM,,,,,N/A_id/0,/,0,,N/A,code-execution,appThreat-8468-6979,,0,1648593146,,,141fd502-fc32-4867-b9a5-5c421583a44b,0,,,,,,,,,,,,,,, ,,,,,,,,,,,,,,0,2022-03-29T22:32:26.467+00:00,,,,unknown,unknown,unknown,1,,,no,no /
Sample queries
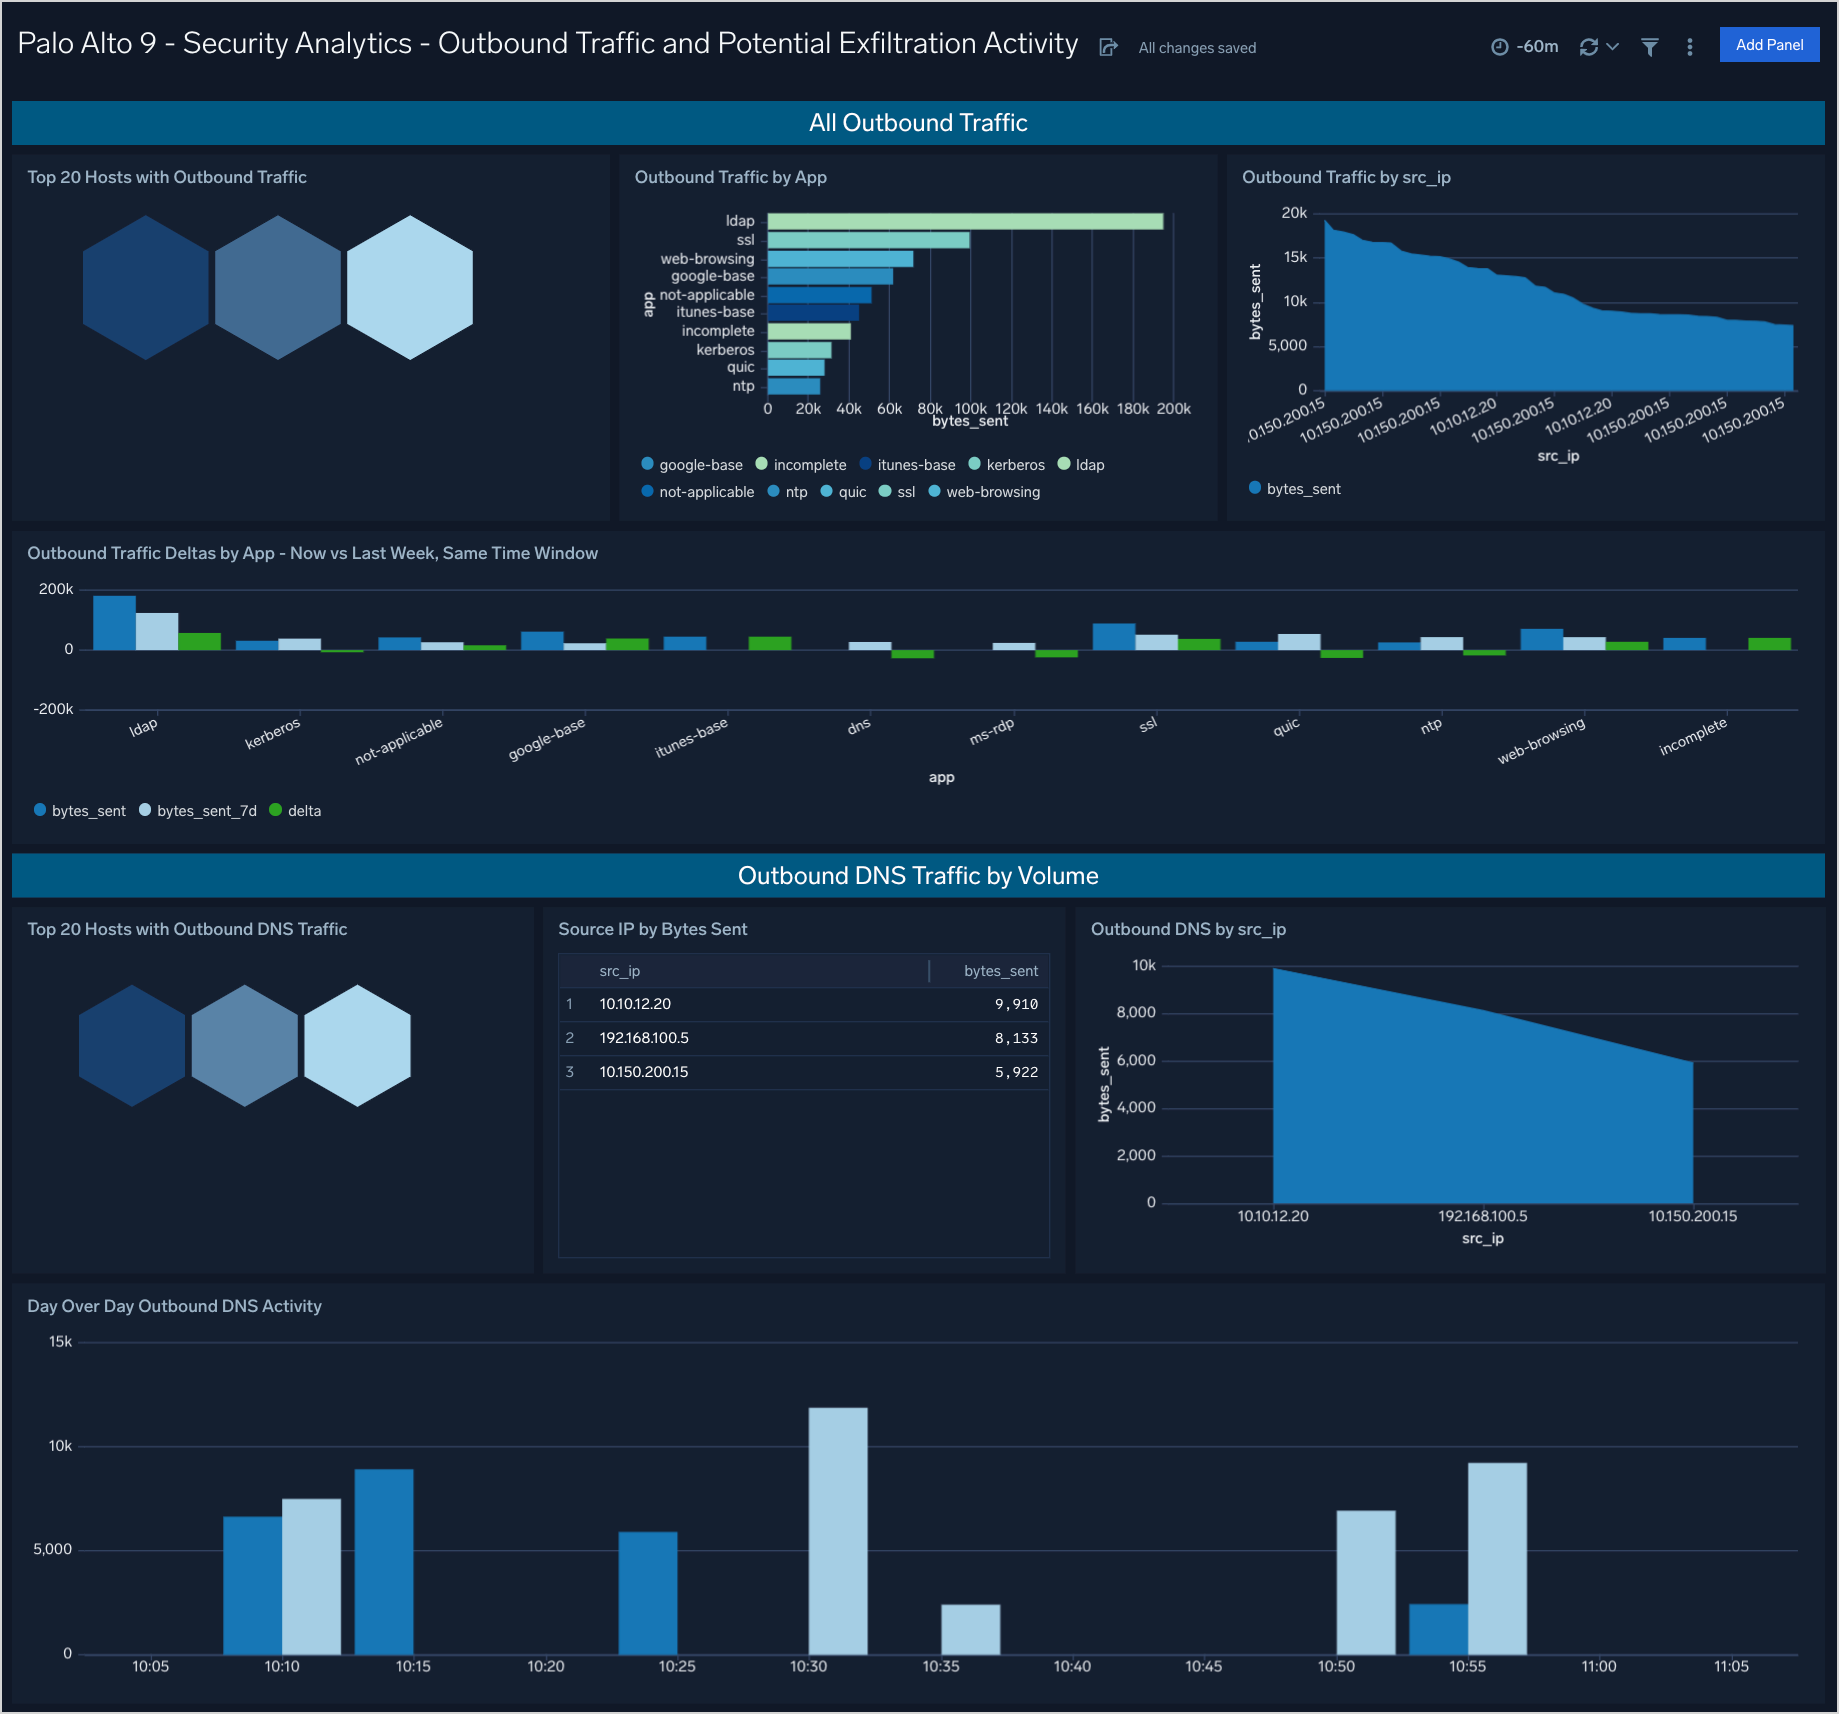
This example query is from the Top 20 Hosts with Outbound Traffic panel of the Outbound Traffic and Potential Exfiltration Activity dashboard.
_sourceCategory = Labs/PaloAltoNetworksv10 TRAFFIC
| csv _raw extract 1 as f1, 2 as Receive_Time, 3 as serialNum, 4 as type, 5 as subtype, 6 as f2, 7 as LogGenerationTime, 8 as src_ip, 9 as dest_ip, 10 as NAT_src_ip, 11 as NAT_dest_ip, 12 as ruleName, 13 as src_user, 14 as dest_user, 15 as app, 16 as vsys, 17 as src_zone, 18 as dest_zone, 19 as inbound_interface, 20 as outbound_interface, 21 as LogAction, 22 as f3, 23 as SessonID, 24 as RepeatCount, 25 as src_port, 26 as dest_port, 27 as NAT_src_port, 28 as NAT_dest_port, 29 as flags, 30 as protocol, 31 as action, 32 as bytes, 33 as bytes_sent, 34 as bytes_recv, 35 as Packets, 36 as StartTime, 37 as ElapsedTime, 38 as Category, 39 as f4, 40 as seqNum, 41 as ActionFlags, 42 as src_Country, 43 as dest_country, 44 as f5, 45 as pkts_sent, 46 as pkts_received, 47 as session_end_reason, 48 as Device_Group_Hierarchy_l1, 49 as Device_Group_Hierarchy_l2, 50 as Device_Group_Hierarchy_l3, 51 as Device_Group_Hierarchy_l4, 52 as vsys_Name, 53 as DeviceName, 54 as action_source, 55 as Source_VM_UUID, 56 as Destination_VM_UUID, 57 as Tunnel_ID_IMSI, 58 as Monitor_Tag_IMEI, 59 as Parent_Session_ID, 60 as parent_start_time, 61 as Tunnel, 62 as SCTP_Association_ID, 63 as SCTP_Chunks, 64 as SCTP_Chunks_Sent, 65 as SCTP_Chunks_Received, 66 as UUIDforrule, 67 as HTTP2Connection, 68 as AppFlapCount ,69 as PolicyID ,70 as LinkSwitches ,71 as SDWANCluster ,72 as SDWANDeviceType ,73 as SDWANClusterType ,74 as SDWANSite ,75 as DynamicUserGroupName ,76 as XFFAddress ,77 as SourceDeviceCategory ,78 as SourceDeviceProfile ,79 as SourceDeviceModel ,80 as SourceDeviceVendor ,81 as SourceDeviceOSFamily ,82 as SourceDeviceOSVersion ,83 as SourceHostname ,84 as SourceMACAddress ,85 as DestinationDeviceCategory ,86 as DestinationDeviceProfile ,87 as DestinationDeviceModel ,88 as DestinationDeviceVendor ,89 as DestinationDeviceOSFamily ,90 as DestinationDeviceOSVersion ,91 as DestinationHostname ,92 as DestinationMACAddress ,93 as ContainerID ,94 as PODNamespace ,95 as PODName ,96 as SourceExternalDynamicList ,97 as DestinationExternalDynamicList ,98 as HostID ,99 as UserDeviceSerialNumber ,100 as SourceDynamicAddressGroup ,101 as DestinationDynamicAddressGroup ,102 as SessionOwner ,103 as HighResolutionTimestamp ,104 as ASliceServiceType ,105 as ASliceDifferentiator
| where type="TRAFFIC"
| isPrivateIP(src_ip) as private_src_ip
| where private_src_ip
| isPublicIP(dest_ip) as public_dest_ip
| where public_dest_ip
| sum(bytes_sent) as bytes_sent, sum(bytes_recv) as bytes_received by src_ip
| top 20 src_ip by bytes_sent
Prerequisites
You must have Palo Alto Networks Web administrative user permissions to successfully complete these tasks.
Collecting logs for Palo Alto Firewall 9
This section provides instructions for configuring log collection for the Sumo Logic app for Palo Alto Firewall 9, as well as sample log messages and a query example from an app dashboard. This includes the following tasks:
- Create a hosted collector with a Cloud Syslog source
- Define the destination for the logs.
- Configure syslog forwarding.
- Verify logs in Palo Alto Networks.
Step 1. Create a hosted collector and Cloud Syslog source
In this step, you configure a hosted collector with a Cloud Syslog source that will act as Syslog server to receive logs and events from Palo Alto Networks devices.
To configure a hosted collector with a Cloud Syslog source, do the following:
- Sign in to Sumo Logic and create a Hosted Collector.
- Create a Cloud Syslog Source on the hosted collector, specifying the following:
- Enter a Source Name.
- Provide a Source Category: NW/PAN/V9
- Click Save.
- Copy the Token, host URL, and TCP TLS Port to a safe place. You will need this information in the tasks that follow.
Step 2. Define the destination for the logs
In this step, you create a server profile where you can define the log destination. This will be the hostname, port, and protocol (TLS) of the Sumo Logic Cloud Syslog source.
To create a server profile specifying the log destination, do the following:
- Login to the Palo Alto Networks Web interface as an administrative user.
- Select Device tab > Server Profiles > Syslog.
- Click Add at the bottom of the screen and provide endpoint details and a profile name, such as
Sumo_Logs_Profile01. - In the Syslog Server Profile window, select the Servers tab and click Add.
- In the Servers window, specify the following information:
- In the Syslog Server Profile window, select the Custom Log Format tab, and use the following custom format for the following log type:
,$receive_time,$serial,$type,$subtype,,$time_generated,$src,$dst,$natsrc,$natdst,$rule,$srcuser,$dstuser,$app,$vsys,$from,$to,$inbound_if,$outbound_if,\
$logset,,$sessionid,$repeatcnt,$sport,$dport,$natsport,$natdport,$flags,$proto,$action,$bytes,$bytes_sent,$bytes_received,$packets,$start,$sec,$category,,$seqno,\
$actionflags,$srcloc,$dstloc,,$pkts_sent,$pkts_received,$session_end_reason,$dg_hier_level_1,$dg_hier_level_2,$dg_hier_level_3,$dg_hier_level_4,$vsys_name,$device_name,\
$action_source,$src_uuid,$dst_uuid,$tunnelid/$imsi,$monitortag/$imei,$parent_session_id,$parent_start_time,$tunnel,$assoc_id,\
$chunks,$chunks_sent,$chunks_received,\
$rule_uuid,$http2_connection #<Add your token from Step 1>,$receive_time,$serial,$type,$subtype,,$time_generated,$src,$dst,$natsrc,$natdst,$rule,$srcuser,$dstuser,$app,$vsys,$from,$to,$inbound_if,$outbound_if,$logset,,$sessionid,$repeatcnt,$sport,$dport,$natsport,$natdport,$flags,$proto,$action,$misc,$threatid,$category,$severity,$direction,\
$seqno,$actionflags,$srcloc,$dstloc,,$contenttype,$pcap_id,$filedigest,$cloud,$url_idx,$user_agent,$filetype,$xff,$referer,$sender,$subject,\
$recipient,$reportid,$dg_hier_level_1,$dg_hier_level_2,$dg_hier_level_3,$dg_hier_level_4,$vsys_name,$device_name,,$src_uuid,$dst_uuid,$http_method,$tunnel_id/$imsi,$monitortag/$imei,$parent_session_id,$parent_start_time,$tunnel,\
$thr_category,$contentver,,$assoc_id,$ppid,$http_headers,$url_category_list,\
$rule_uuid,$http2_connection #<Add your token from Step 1> - Click OK.
- Commit the changes.
Step 3. Configure syslog forwarding
To configure syslog forwarding for Traffic logs, follow the steps to Configure Log Forwarding as described in the Palo Networks documentation.
Step 4. Verify logs in Palo Alto Networks
In this step, you view logs using the Palo Alto Network Web interface to confirm the logs are generated on the firewall.
To verify the logs in Palo Alto Networks, do the following:
- In the Palo Alto Networks UI, select Monitor > Logs.
- Once the setup is done, sign in to Sumo Logic.
- To validate that the logs are flowing to Sumo Logic, run a query using the source category you configured during Step 1, such as:
_sourceCategory = NW/PAN/V9.
Installing the PAN Firewall 9 Security app
To install the app, do the following:
Next-Gen App: To install or update the app, you must be an account administrator or a user with Manage Apps, Manage Monitors, Manage Fields, Manage Metric Rules, and Manage Collectors capabilities depending upon the different content types part of the app.
- Select App Catalog.
- In the 🔎 Search Apps field, run a search for your desired app, then select it.
- Click Install App.
note
Sometimes this button says Add Integration.
- Click Next in the Setup Data section.
- In the Configure section of your respective app, complete the following fields.
- Field Name. If you already have collectors and sources set up, select the configured metadata field name (eg _sourcecategory) or specify other custom metadata (eg: _collector) along with its metadata Field Value.
- Click Next. You will be redirected to the Preview & Done section.
Post-installation
Once your app is installed, it will appear in your Installed Apps folder, and dashboard panels will start to fill automatically.
Each panel slowly fills with data matching the time range query received since the panel was created. Results will not immediately be available but will be updated with full graphs and charts over time.
Viewing PAN Firewall 9 Security dashboards
All dashboards have a set of filters that you can apply to the entire dashboard. Use these filters to drill down and examine the data to a granular level.
- You can change the time range for a dashboard or panel by selecting a predefined interval from a drop-down list, choosing a recently used time range, or specifying custom dates and times. Learn more.
- You can use template variables to drill down and examine the data on a granular level. For more information, see Filtering Dashboards with Template Variables.
- Most Next-Gen apps allow you to provide the scope at the installation time and are comprised of a key (
_sourceCategoryby default) and a default value for this key. Based on your input, the app dashboards will be parameterized with a dashboard variable, allowing you to change the dataset queried by all panels. This eliminates the need to create multiple copies of the same dashboard with different queries.
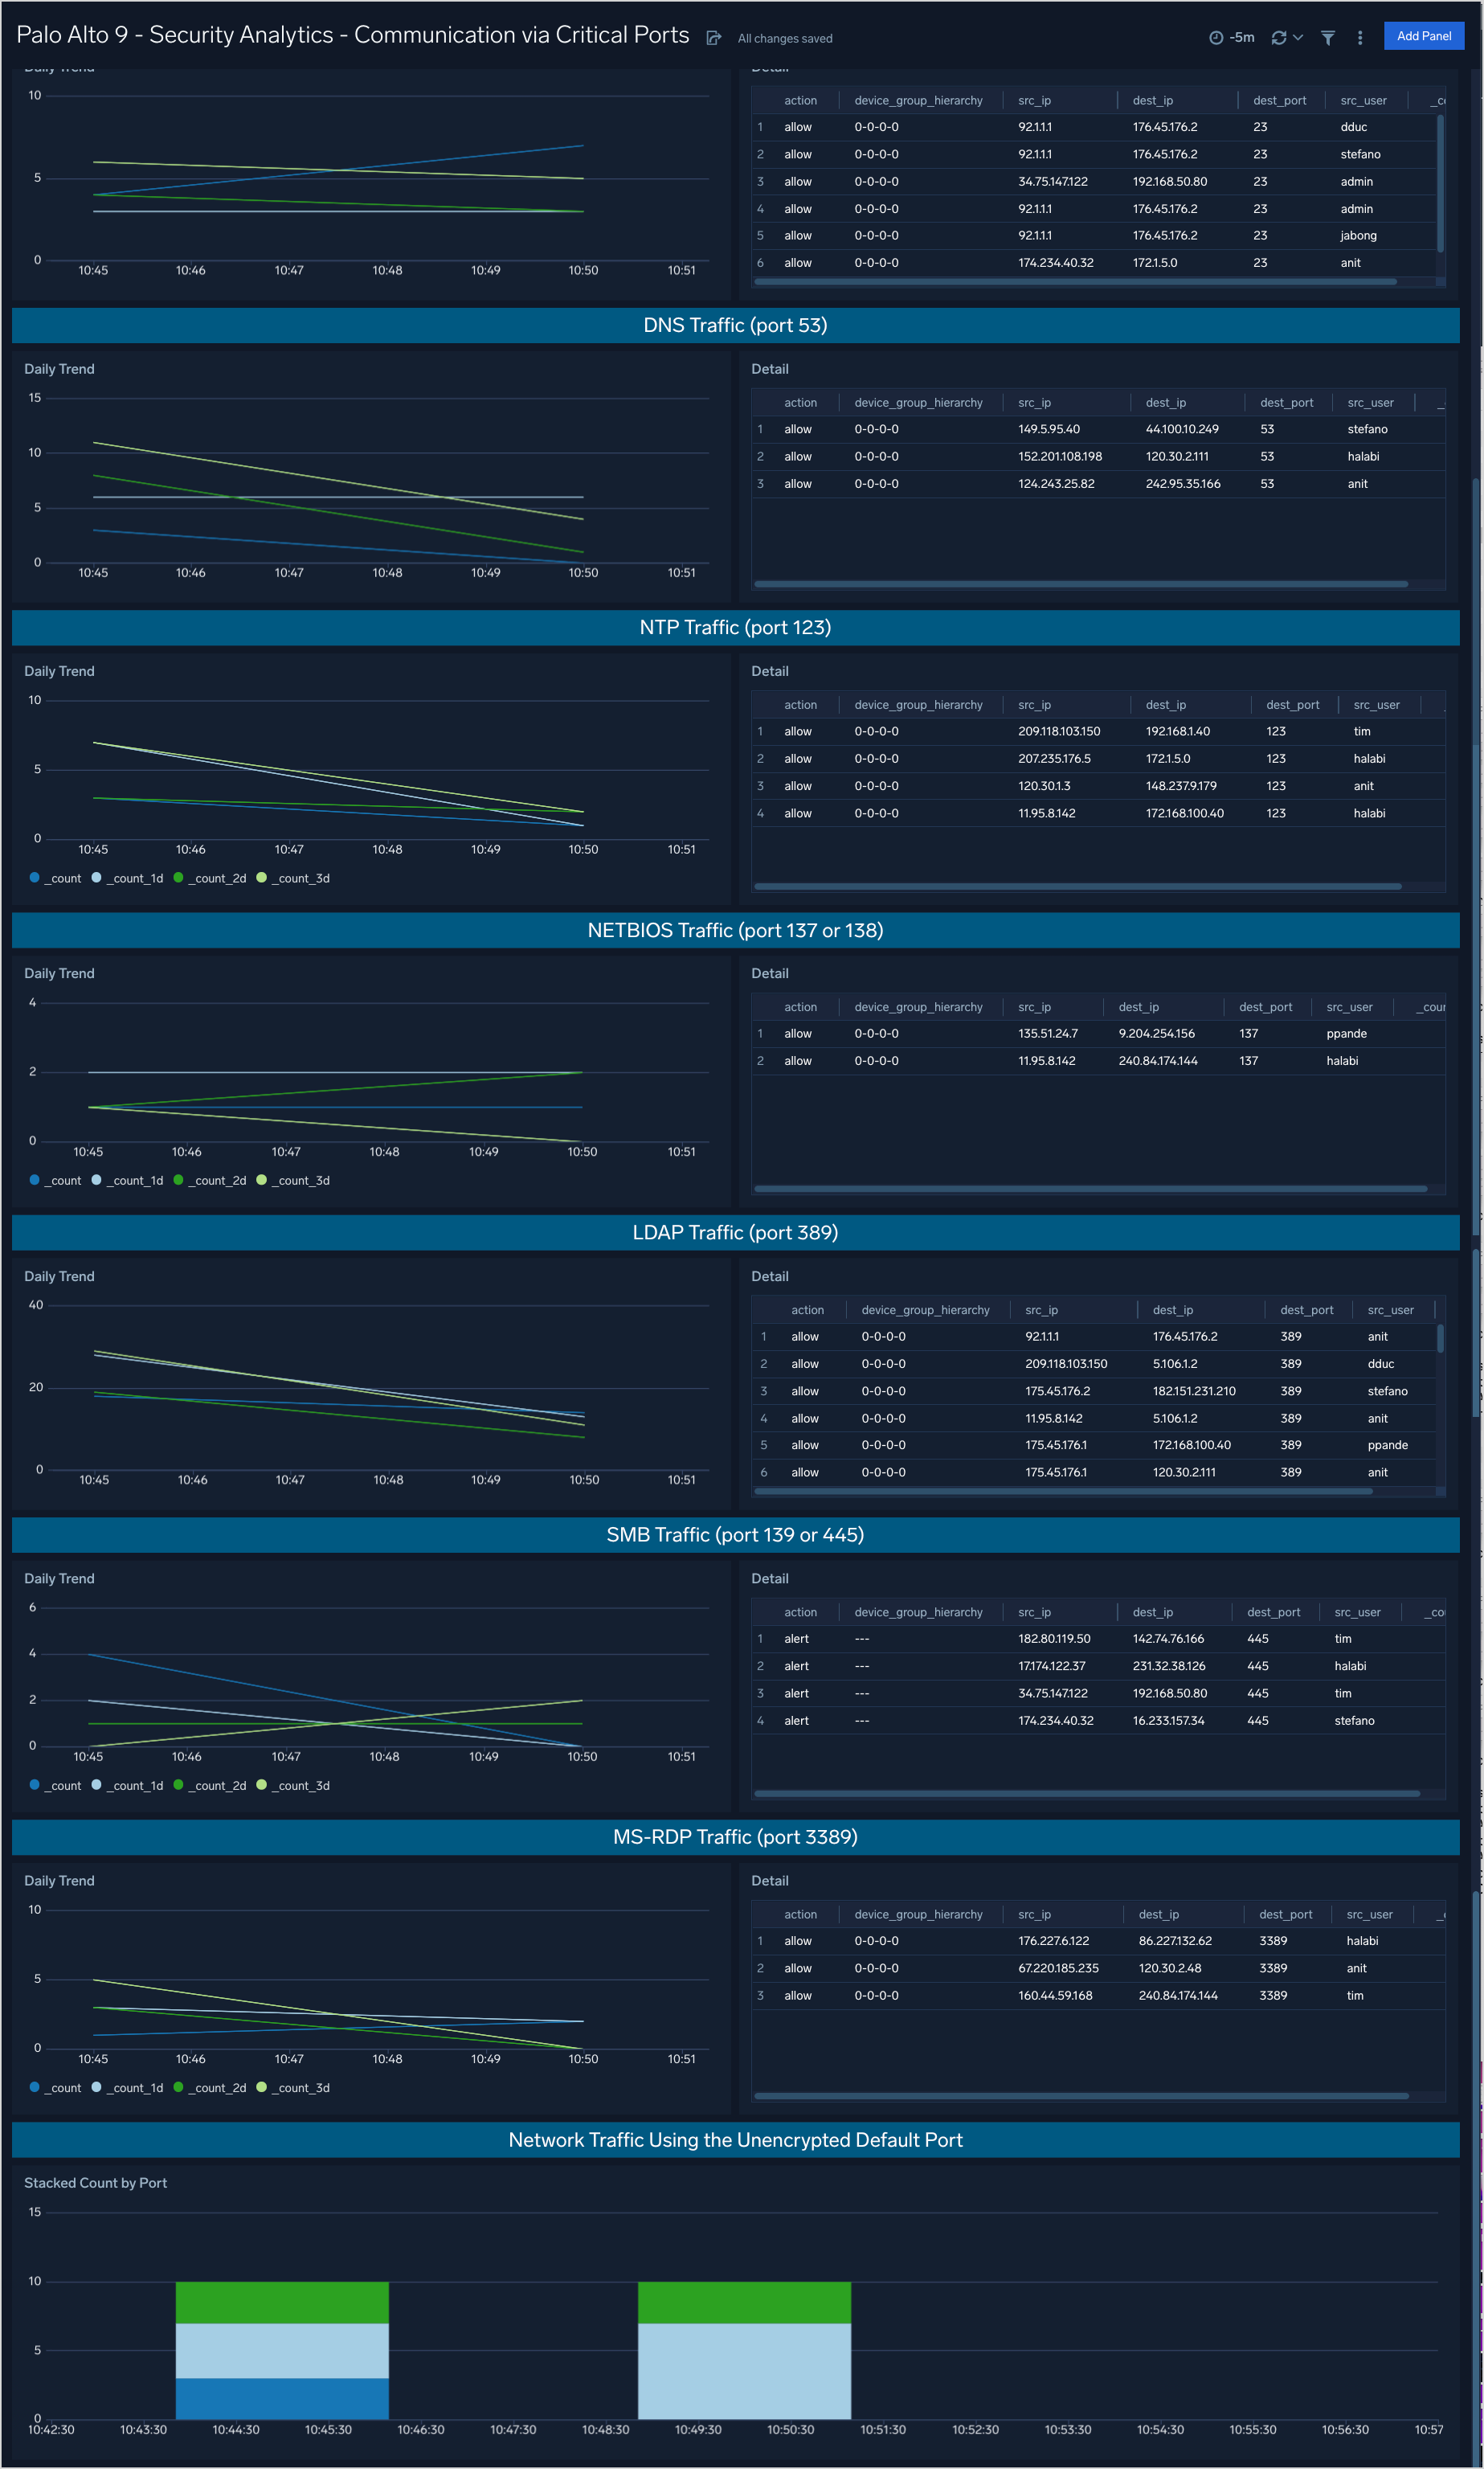
Security Analytics - Communication via Critical Ports
The Palo Alto 9 - Security Analytics - Communication via Critical Ports dashboard provides analytics including trending for outbound communications via well known ports. Also provides additional analysis of application communications attempts across the firewall.
Use case: You can use this dashboard to analyze daily traffic patterns in outbound volumes of traffic for the following ports: 21, 22, 23, 53, 123, 137, 138, 389, 445, and 3389. The graph on the left compares the current day’s traffic volumes with the volumes of the same time one, two, and three days ago. The table on the right provides a sortable list of those connections.
Additionally at the top of the dashboard are two table containing analytics on known and unknown applications connections using the ports listed above.
Security Analytics - Outbound Traffic and Potential Exfiltration Activity
The Palo Alto 9 - Security Analytics - Outbound Traffic and Potential Exfiltration Activity dashboard provides outbound traffic analysis including DNS activity for potential indicators of exfiltration activity.
Use case: You can use this dashboard to review volumes of outbound traffic by host, by application, and timeframe comparisons with last week. Increased and unaccounted for increases in traffic may be the result of unauthorized exfiltration of information. Additional analysis is provided for DNS traffic alone as large amounts of DNS traffic are not part of normal operations.
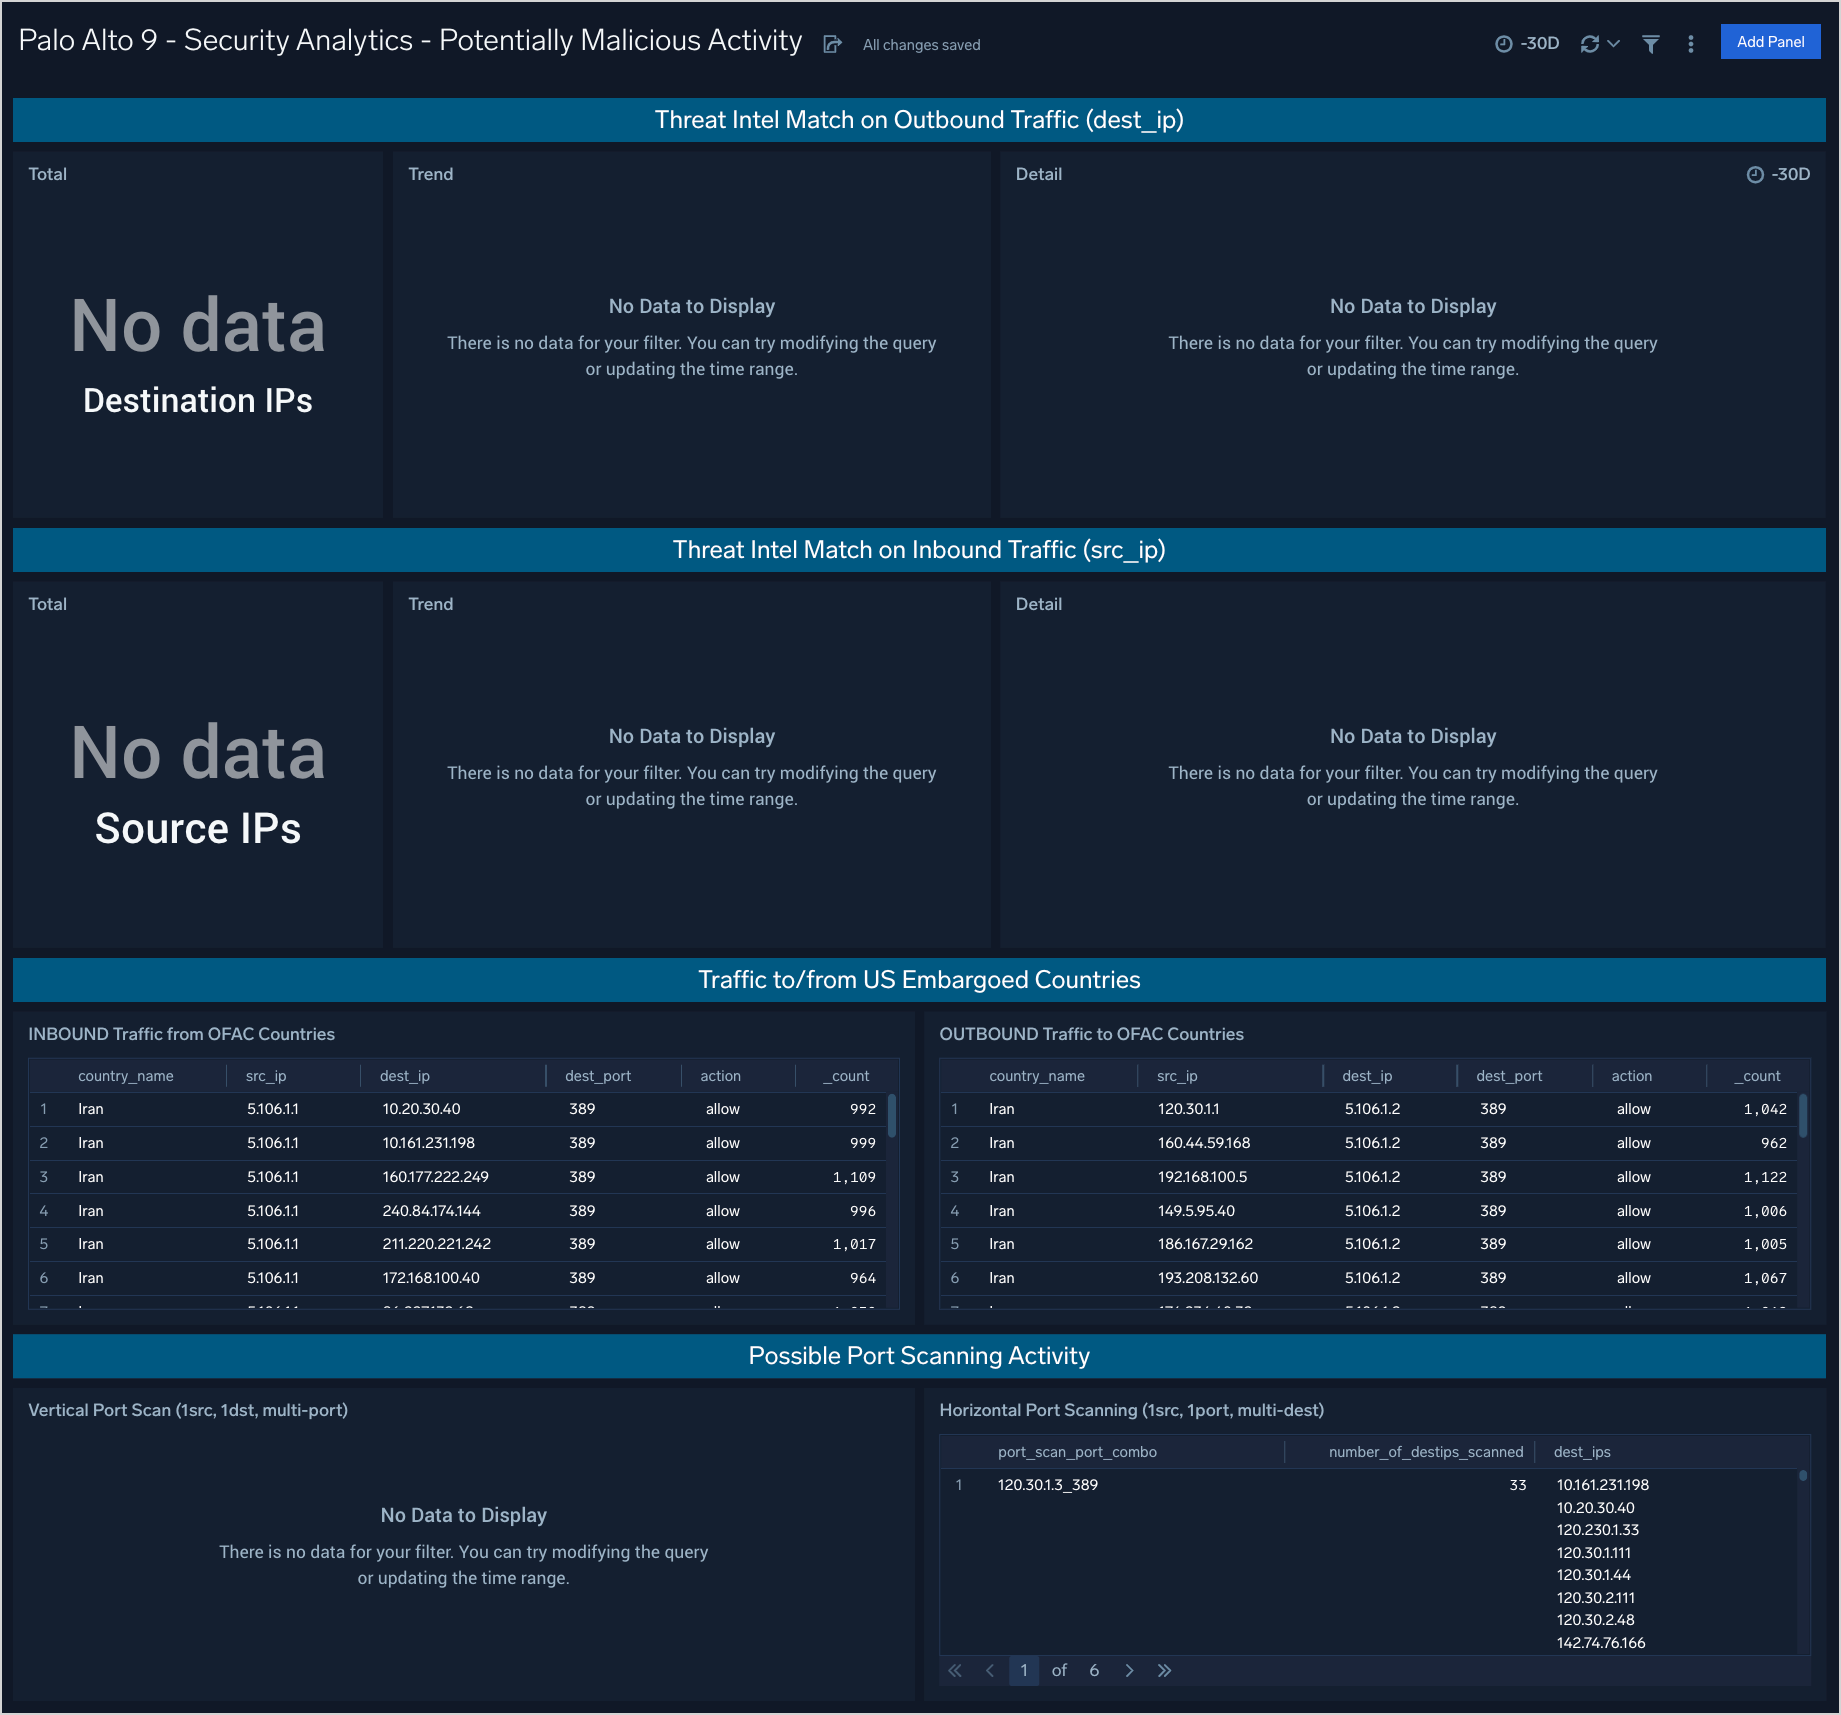
Security Analytics - Potentially Malicious Activity
The Palo Alto 9 - Security Analytics - Potentially Malicious Activity dashboard provides information about traffic to and from IP addresses called out as potentially malicious by threat intelligence, countries that are on the OFAC (embargoed) list, and potential port scans.
Use case: You can use this dashboard to analyze attempted and successful connections to IP addresses on threat intelligence lists both inboudn and outbound. Additionally you can view connections to geolocation IP addresses associated with countries on the OFAC list (USA embargo list). Finally the bottom panel provides analysis on vertical port scans (one target, scanned on multiple network ports) and horizontal port scans (same port scanned across multiple destinations.)
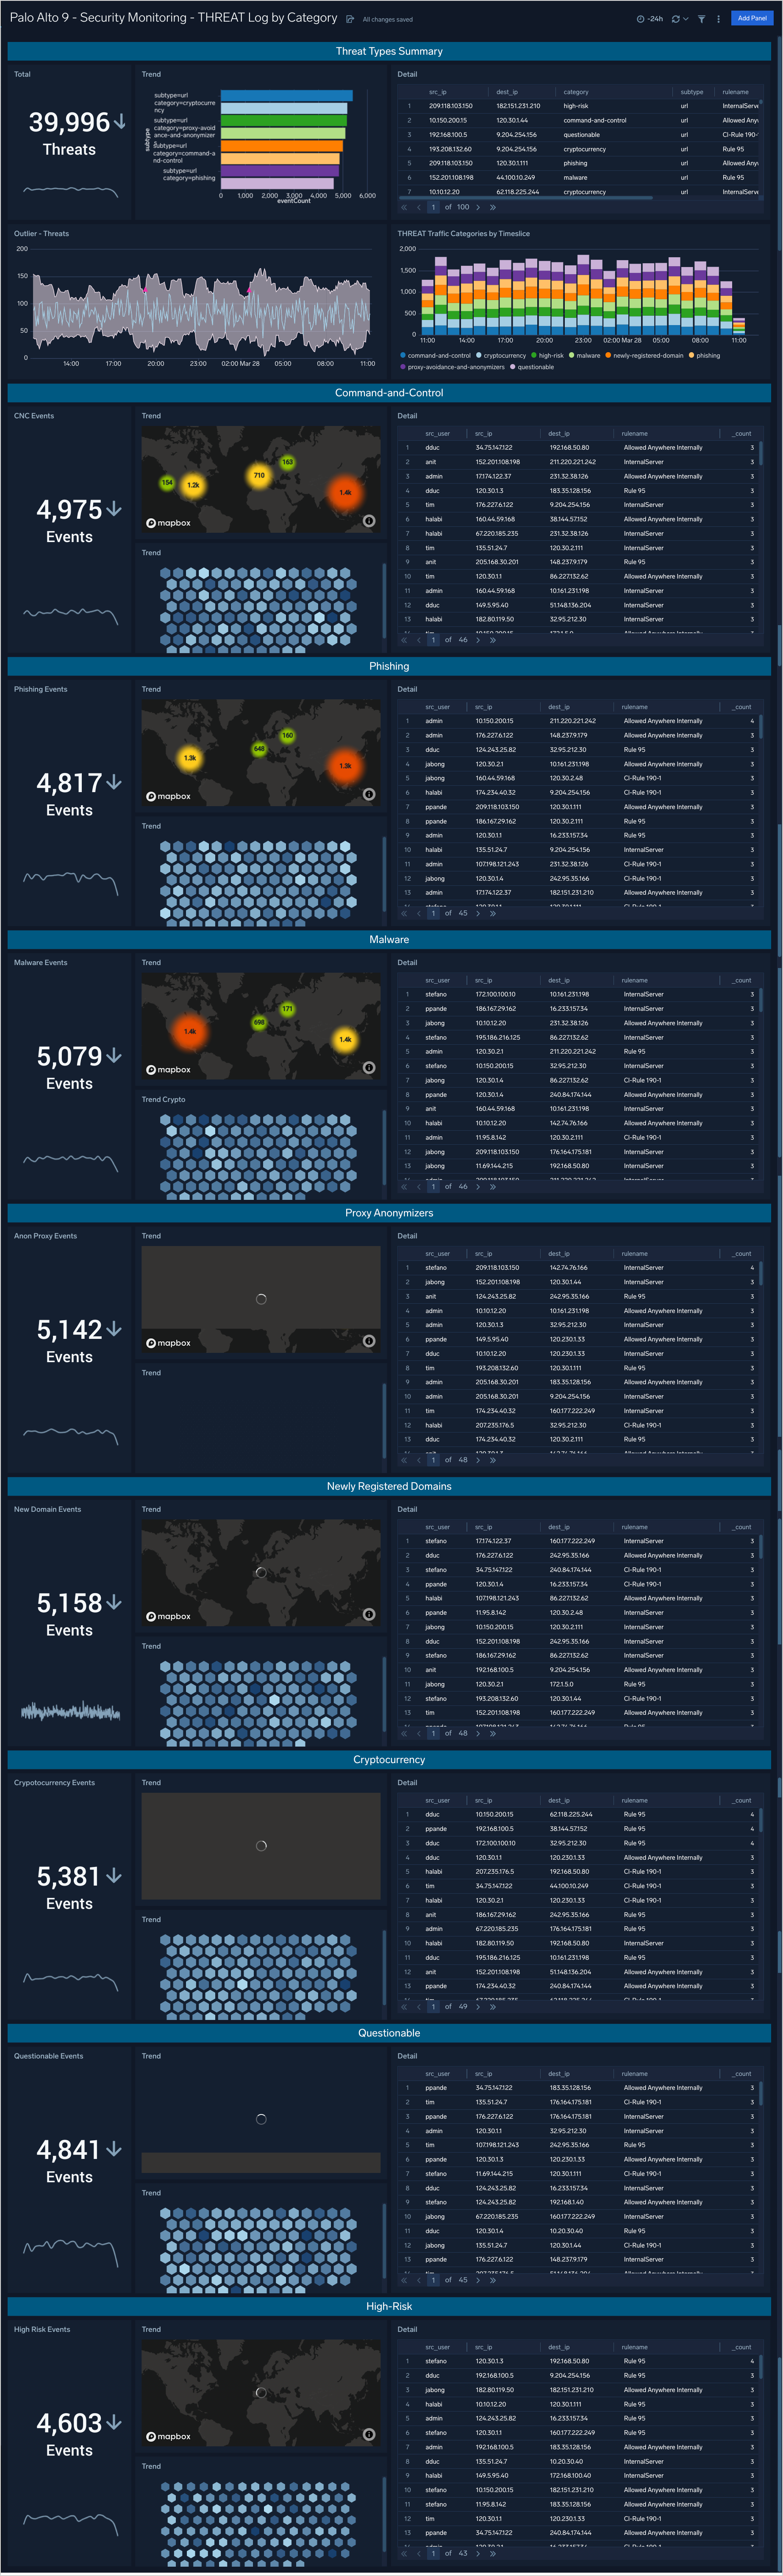
Security Monitoring - THREAT Log by Category
The Palo Alto 9 - Security Monitoring - THREAT Log by Category dashboard provides analytics about the THREAT type logs provided by the firewall. These are the indications of security events detected by the firewall’s defensive measures such as anti-malware, network intrusion detection, and the like.
Use case: You can use this dashboard to review THREAT events in summary or broken down by category: Command-and-control, Phishing, Malware, Proxy Anonymizers, Newly Registered Domains, Cryptocurrency, Questionable, and High-Risk.
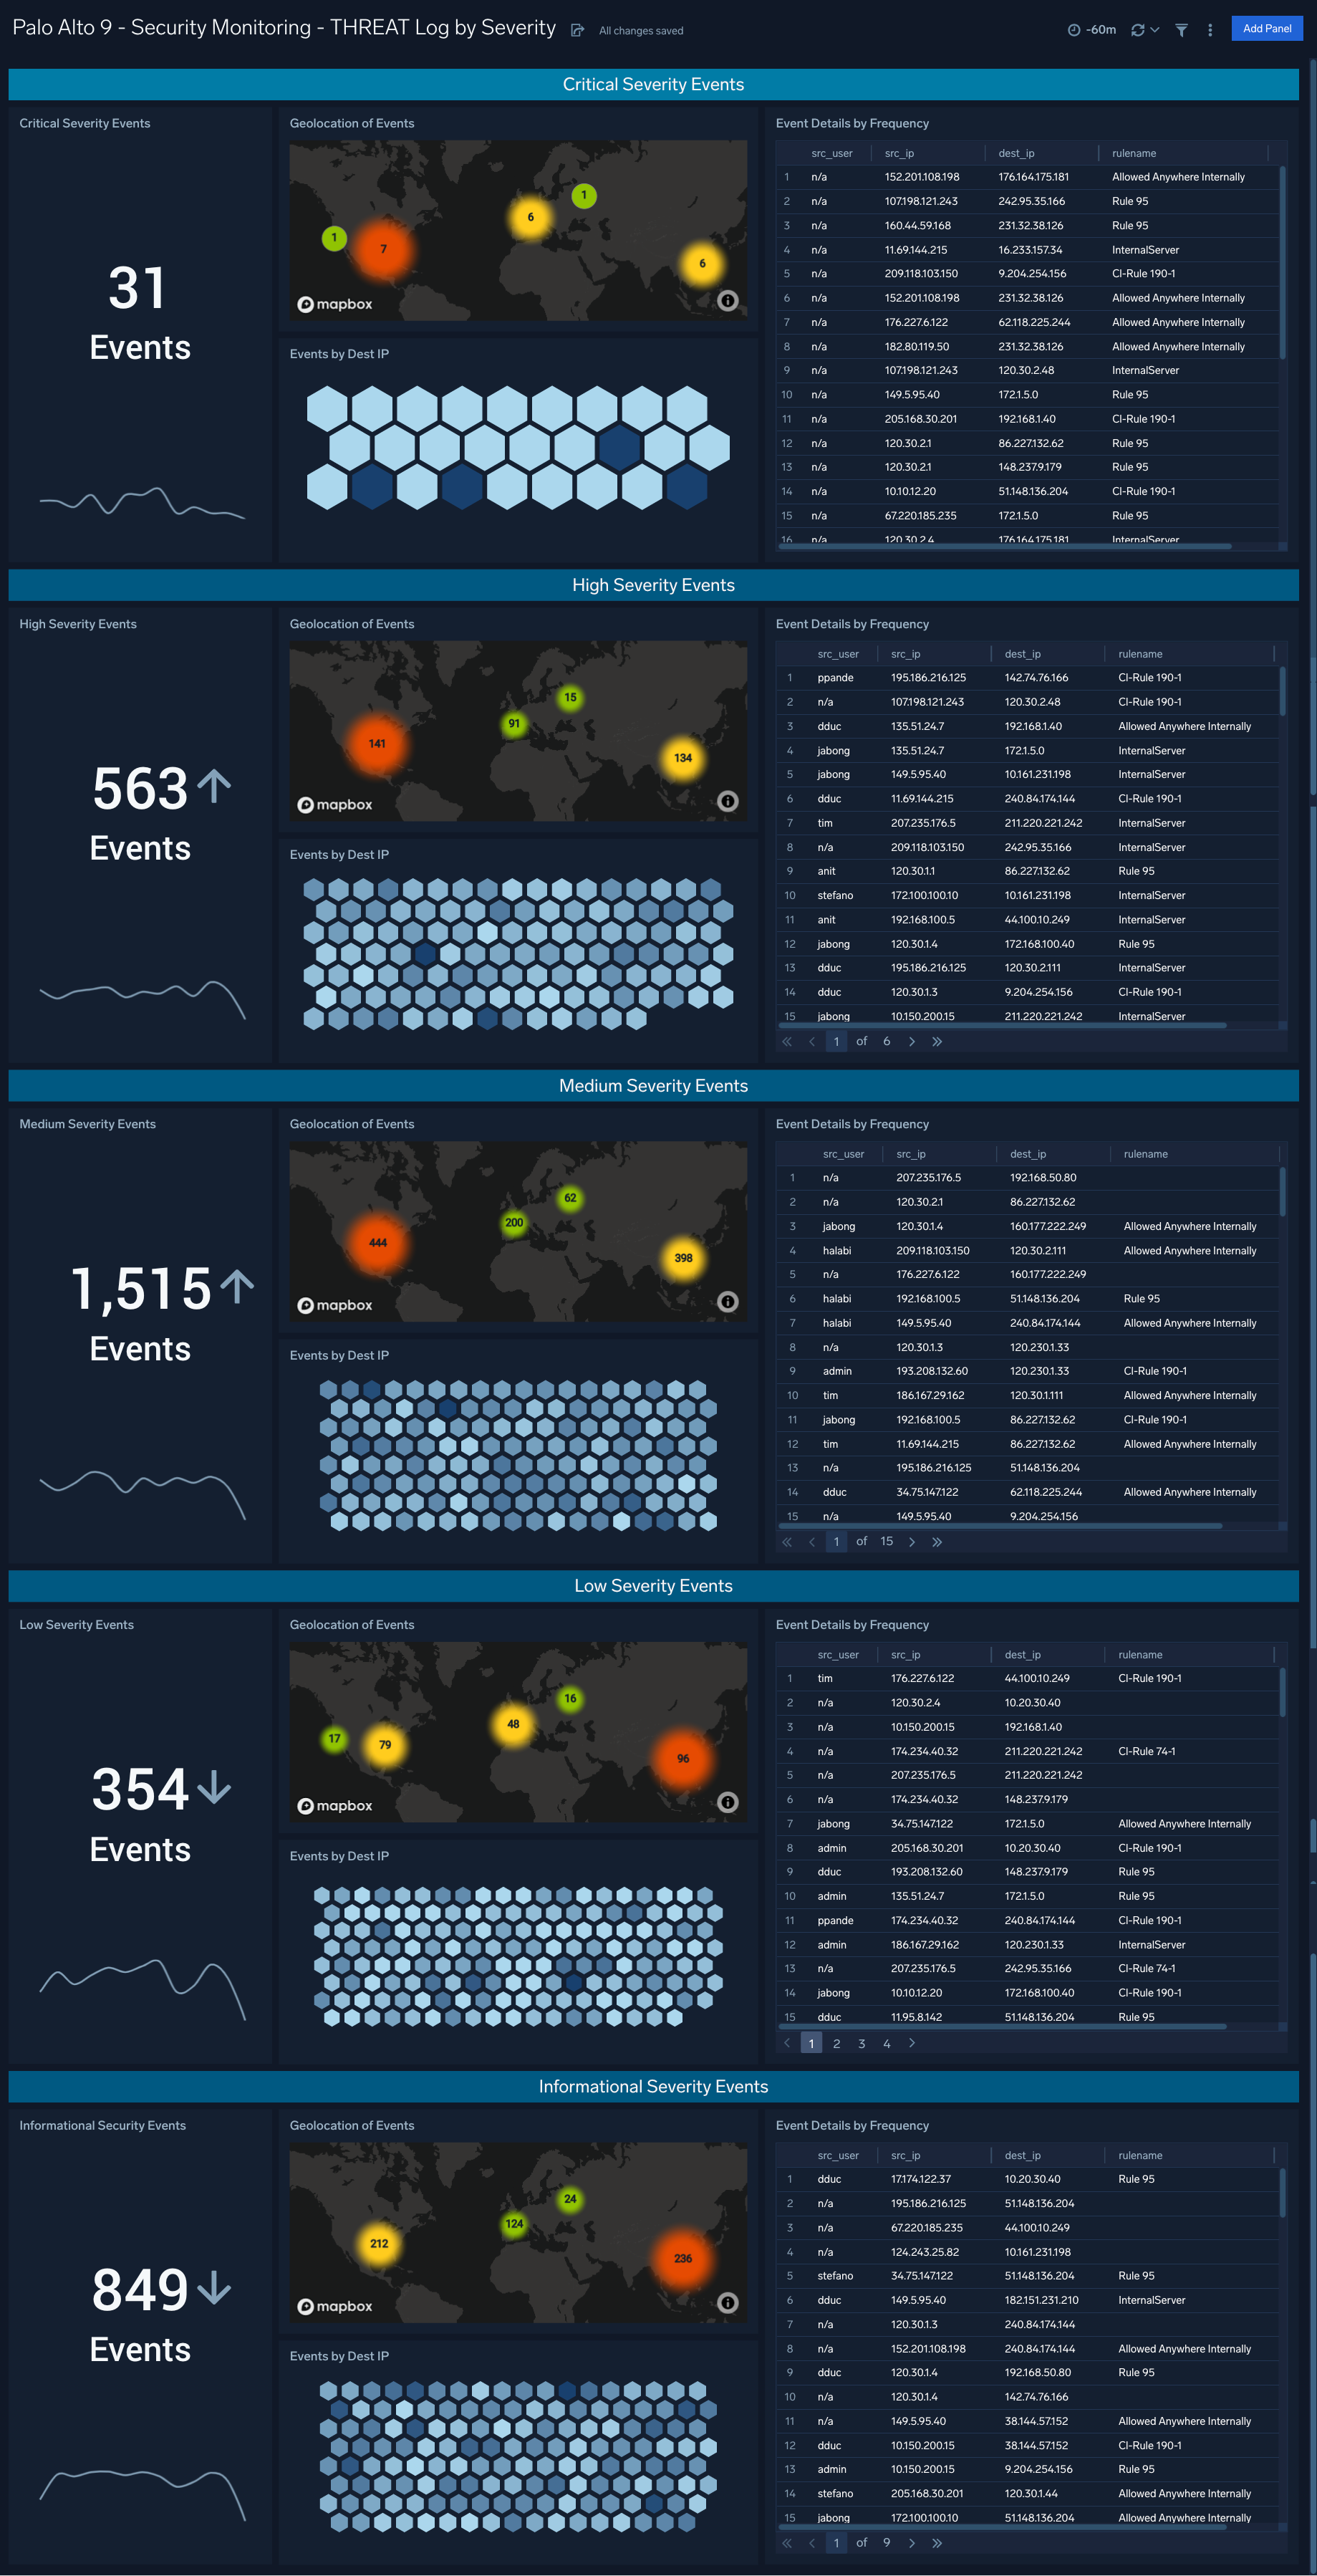
Security Monitoring - THREAT Logs by Severity
The Palo Alto 9 - Security Monitoring - THREAT Logs by Severity dashboard provides analytics about the THREAT type logs provided by the firewall. These are the indications of security events detected by the firewall’s defensive measures such as anti-malware, network intrusion detection, and the like.
Use case: You can use this dashboard to review THREAT events broken down by severity, allowing you to focus on the critical events first but also providing events of lesser severity for additional triage and investigation if necessary.
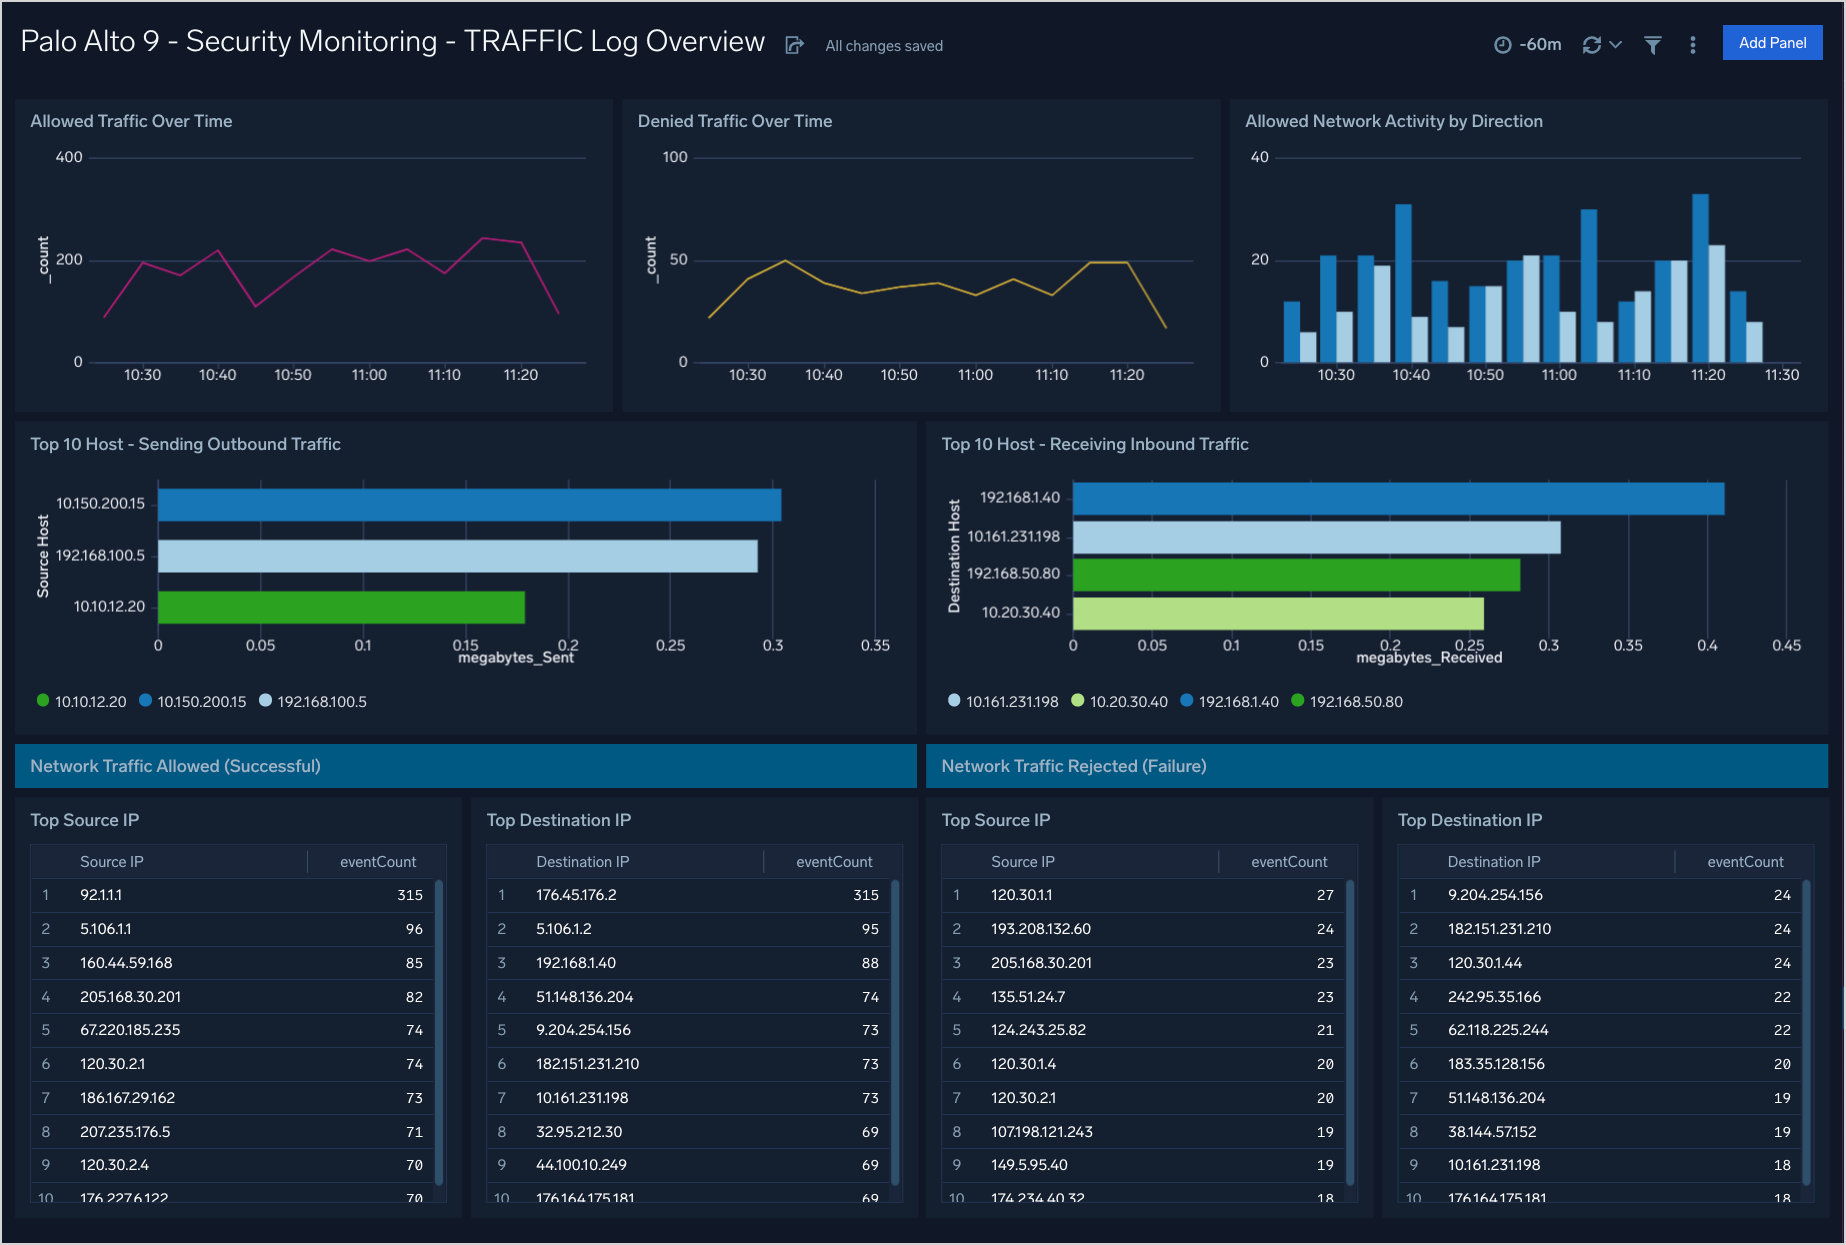
Security Monitoring - TRAFFIC Log Overview
The Palo Alto 9 - Security Monitoring - TRAFFIC Log Overview dashboard provides monitoring of allowed and denied traffic over time by volume and host.
Use case: You can use this dashboard to monitor allowed and denied traffic through the firewall. Analysis is provided over time and in lists of top 10 sources, destinations, and hosts.
Upgrade/Downgrade the PAN Firewall 9 Security app (Optional)
To update the app, do the following:
Next-Gen App: To install or update the app, you must be an account administrator or a user with Manage Apps, Manage Monitors, Manage Fields, Manage Metric Rules, and Manage Collectors capabilities depending upon the different content types part of the app.
- Select App Catalog.
- In the Search Apps field, search for and then select your app.
Optionally, you can identify apps that can be upgraded in the Upgrade available section. - To upgrade the app, select Upgrade from the Manage dropdown.
- If the upgrade does not have any configuration or property changes, you will be redirected to the Preview & Done section.
- If the upgrade has any configuration or property changes, you will be redirected to the Setup Data page.
- In the Configure section of your respective app, complete the following fields.
- Field Name. If you already have collectors and sources set up, select the configured metadata field name (eg _sourcecategory) or specify other custom metadata (eg: _collector) along with its metadata Field Value.
- Click Next. You will be redirected to the Preview & Done section.
Post-update
Your upgraded app will be installed in the Installed Apps folder and dashboard panels will start to fill automatically.
See our Release Notes changelog for new updates in the app.
To revert the app to a previous version, do the following:
- Select App Catalog.
- In the Search Apps field, search for and then select your app.
- To version down the app, select Revert to < previous version of your app > from the Manage dropdown.
Uninstalling the PAN Firewall 9 Security app (Optional)
To uninstall the app, do the following:
- Select App Catalog.
- In the 🔎 Search Apps field, run a search for your desired app, then select it.
- Click Uninstall.