Windows Cloud Security Monitoring and Analytics
The Cloud Security Monitoring & Analytics for Windows app offers pre-built dashboards and queries to help you track your Windows system, user accounts, login activity, and Windows updates.
This section provides instructions for configuring log collection for the Windows - Cloud Security Monitoring and Analytics app.
Log types
The Windows - Cloud Security Monitoring and Analytics app uses Windows Security Event and System Event logs. It does not work with third-party logs.
Sample log messages
{
	"TimeCreated":"2020-10-12T07:31:14+000039800Z",
	"EventID":"1102",
	"Task":104,
	"Correlation":"",
	"Keywords":"Audit Success",
	"Channel":"Security",
	"Opcode":"Info",
	"Security":"",
	"Provider":{
		"Guid":"{fc65ddd8-d6ef-4962-83d5-6e5cfe9ce148}",
		"Name":"Microsoft-Windows-Eventlog"
	},
	"EventRecordID":101802,
	"Execution":{
		"ThreadID":2896,
		"ProcessID":908
	},
	"Version":0,
	"Computer":"WIN-6D5CO5AB123",
	"Level":"Informational",
	"EventData":{

	},
	"UserData":{
		"LogFileCleared":{
			"xmlns":"http://sz2016rose.ddns.net/win/2004/08/windows/eventlog",
			"SubjectUserName":"Administrator",
			"SubjectDomainName":"WIN-6D5CO5AB123",
			"SubjectLogonId":"0x1971888",
			"SubjectUserSid":"S-1-5-21-2020-10-12T07:31:14-203418232-2020-10-12T07:31:14-500"
		}
	},
	"Message":"The audit log was cleared.\r\nSubject:\r\n\tSecurity ID:\tWIN-6D5CO5AB123\\Administrator\r\n\tAccount Name:\tAdministrator\r\n\tDomain Name:\tWIN-6D5CO5AB123\r\n\tLogon ID:\t0x1971888"
}
Sample queries
The sample query is from the Recent Policy Changes panel from Windows - Overview dashboard.
_sourceCategory=Labs/windows-jsonformat ( "Audit Policy Change" or "System audit policy was changed" or *policy*change* or "Policy Change" or 4902 or 4904 or 4905 or 4906 or 4907 or 4912 or 4715 or 4719 or 4739)
| json "EventID", "Computer", "Message" as event_id, host, msg_summary nodrop
| parse regex field = msg_summary "(?<msg_summary>.*\.*)"
| where (event_id in ("4902", "4904", "4905", "4906", "4907", "4912", "4715", "4719", "4739") or msg_summary matches "System audit policy was changed*") and host matches "*"
| count by msg_summary | sort by _count, msg_summary asc
Collecting logs for Windows Cloud Security Monitoring and Analytics
Configure a Collector and a Source
To configure a collector and source, do the following:
- Configure an Installed Windows collector through the user interface or from the command line.
- Configure either a local or remote Windows Event Log source. To configure a Windows Event Log source set the following:
- Event Format. Select Collect using JSON format. Events are formatted into JSON that is designed to work with Sumo Logic features, making it easier for you to reference your data.
- Event Collection Level. When JSON format is selected you have to select Complete Message from the dropdown.
Complete Message will ingest the entire event content along with metadata.
For more information on local or remote Windows Event Log Source configuration, refer to Local Windows Event Log Source and Remote Windows Event Log Source.
Installing the Windows Cloud Security app
To install the app, do the following:
Next-Gen App: To install or update the app, you must be an account administrator or a user with Manage Apps, Manage Monitors, Manage Fields, Manage Metric Rules, and Manage Collectors capabilities depending upon the different content types part of the app.
- Select App Catalog.
- In the 🔎 Search Apps field, run a search for your desired app, then select it.
- Click Install App.
note
Sometimes this button says Add Integration.
- Click Next in the Setup Data section.
- In the Configure section of your respective app, complete the following fields.
- Field Name. If you already have collectors and sources set up, select the configured metadata field name (eg _sourcecategory) or specify other custom metadata (eg: _collector) along with its metadata Field Value.
- Click Next. You will be redirected to the Preview & Done section.
Post-installation
Once your app is installed, it will appear in your Installed Apps folder, and dashboard panels will start to fill automatically.
Each panel slowly fills with data matching the time range query received since the panel was created. Results will not immediately be available but will be updated with full graphs and charts over time.
Viewing Windows Cloud Security dashboards
All dashboards have a set of filters that you can apply to the entire dashboard. Use these filters to drill down and examine the data to a granular level.
- You can change the time range for a dashboard or panel by selecting a predefined interval from a drop-down list, choosing a recently used time range, or specifying custom dates and times. Learn more.
- If required, configure the refresh interval rate for a dashboard or panel by clicking the drop-down arrow next to the refresh icon.
- Click the funnel icon in the dashboard top menu bar to filter dashboard with Template Variables.
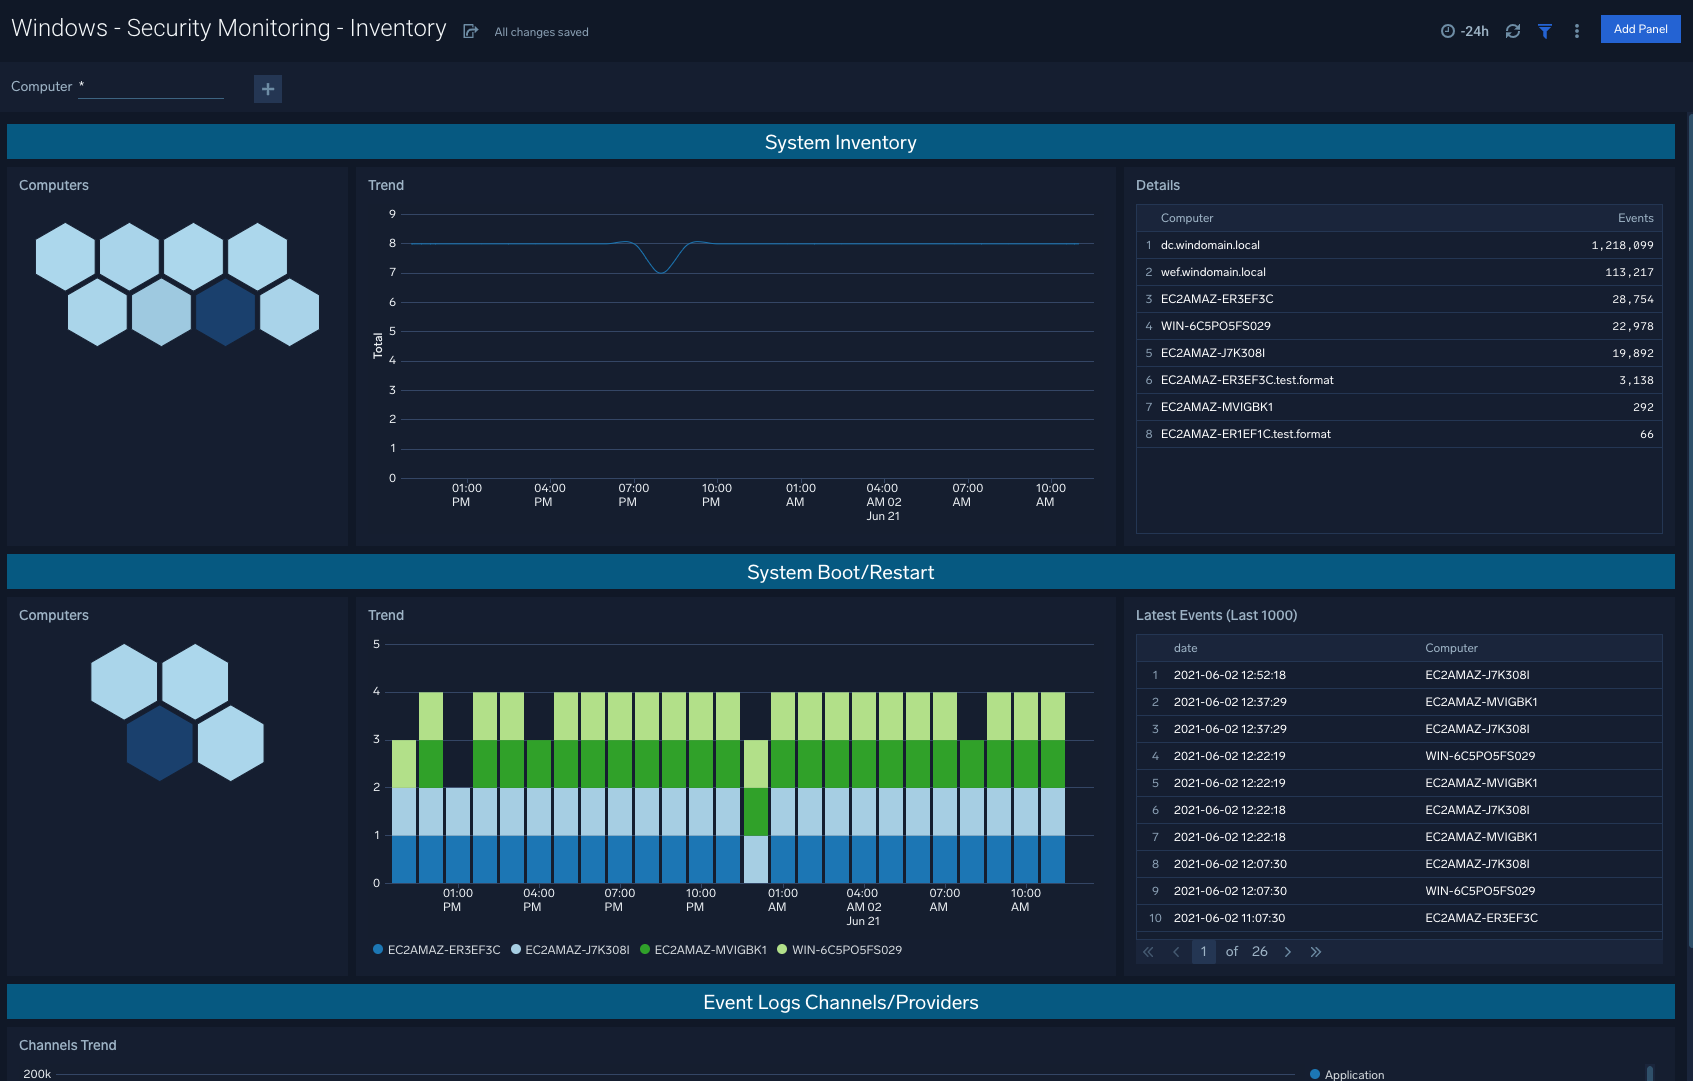
Inventory
The Windows - Security Monitoring - Inventory dashboard helps you to quickly assess system inventory and recent system reboots/restarts in order to understand device activity within your environment.
Use case: System inventory and system boots are leading indicators of potential security threats to be aware of, and that may require further attention.
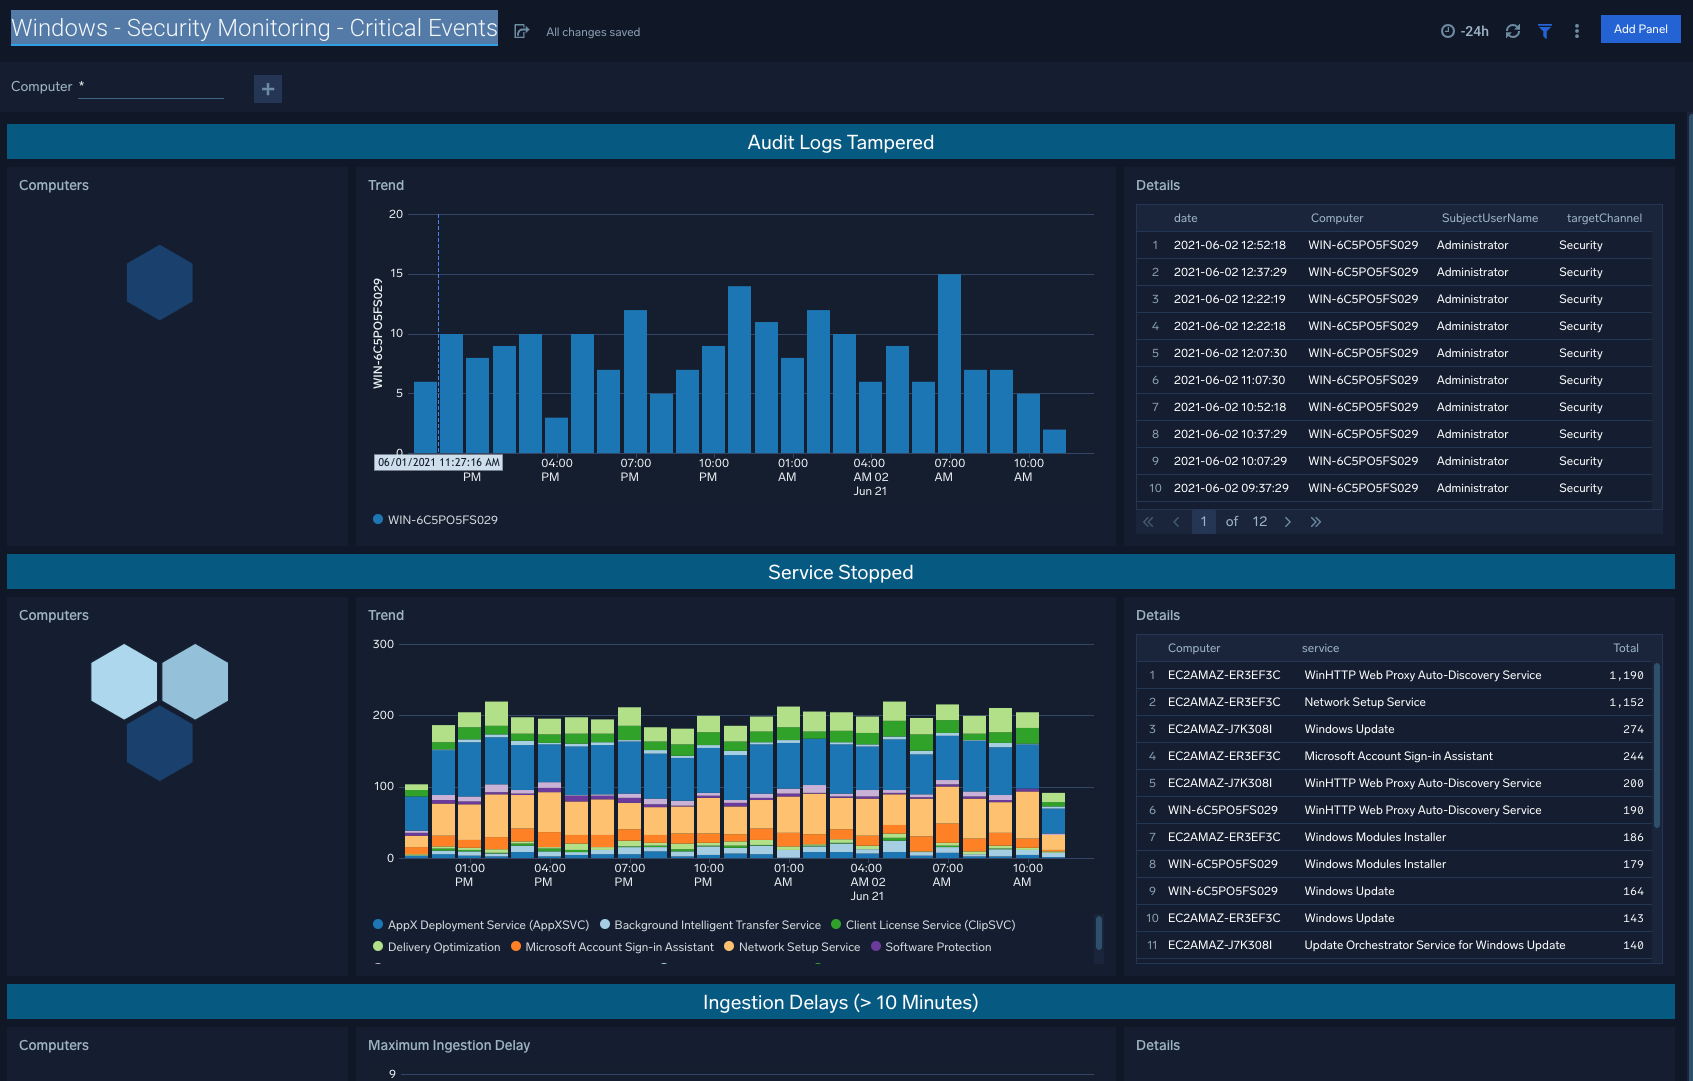
Critical Events
The Windows - Security Monitoring - Critical Events dashboard helps you when the audit logs are tampered, services are stopped, and ingestion delays go above ten seconds, these are all good indicators that there are action items to be taken to resolve issues within your Windows machines.
Use case: Evaluating unexpected critical events within Windows infrastructure allows for teams to stay on top of any necessary remedial steps.
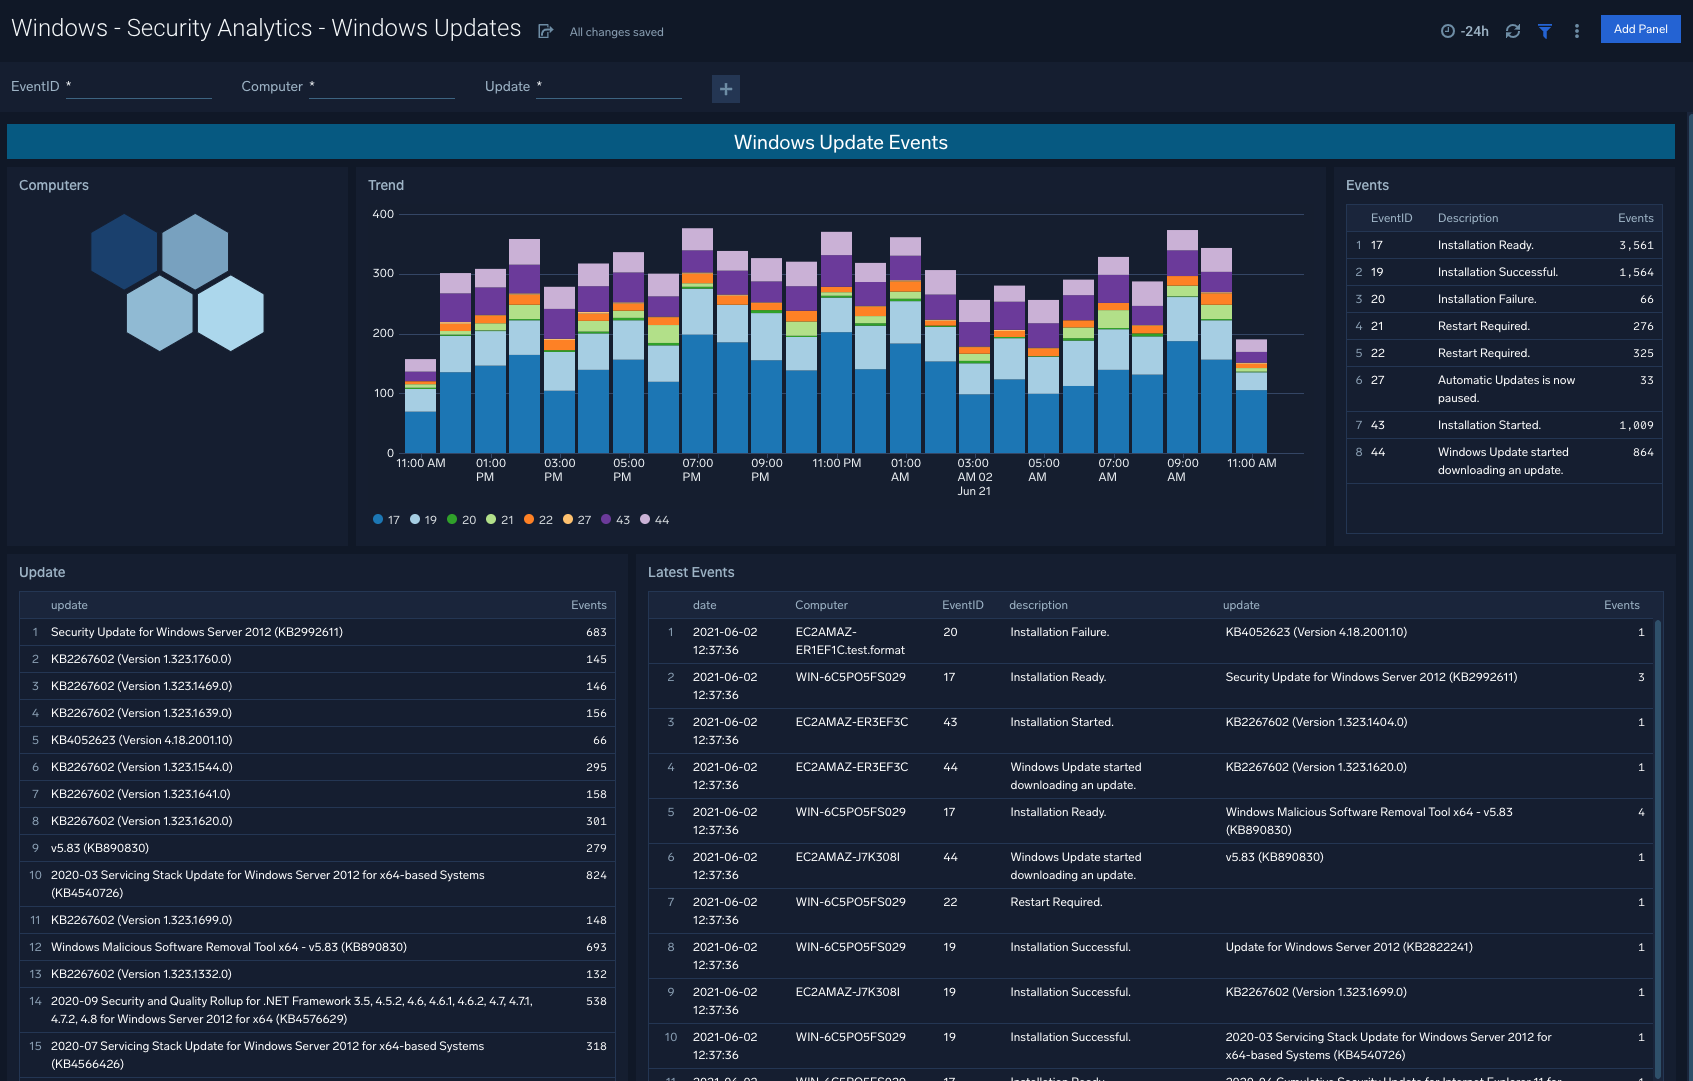
Windows Updates
The Windows - Security Analytics - Windows Updates dashboard provides rich visualizations to indicate the ongoing flow of Windows updates within your organization, so that engineering teams are made aware of red flags or update schedules that require updating.
Use case: Assess overall trend lines via the dashboard, and dive into specific events and event types to understand specific update failures.
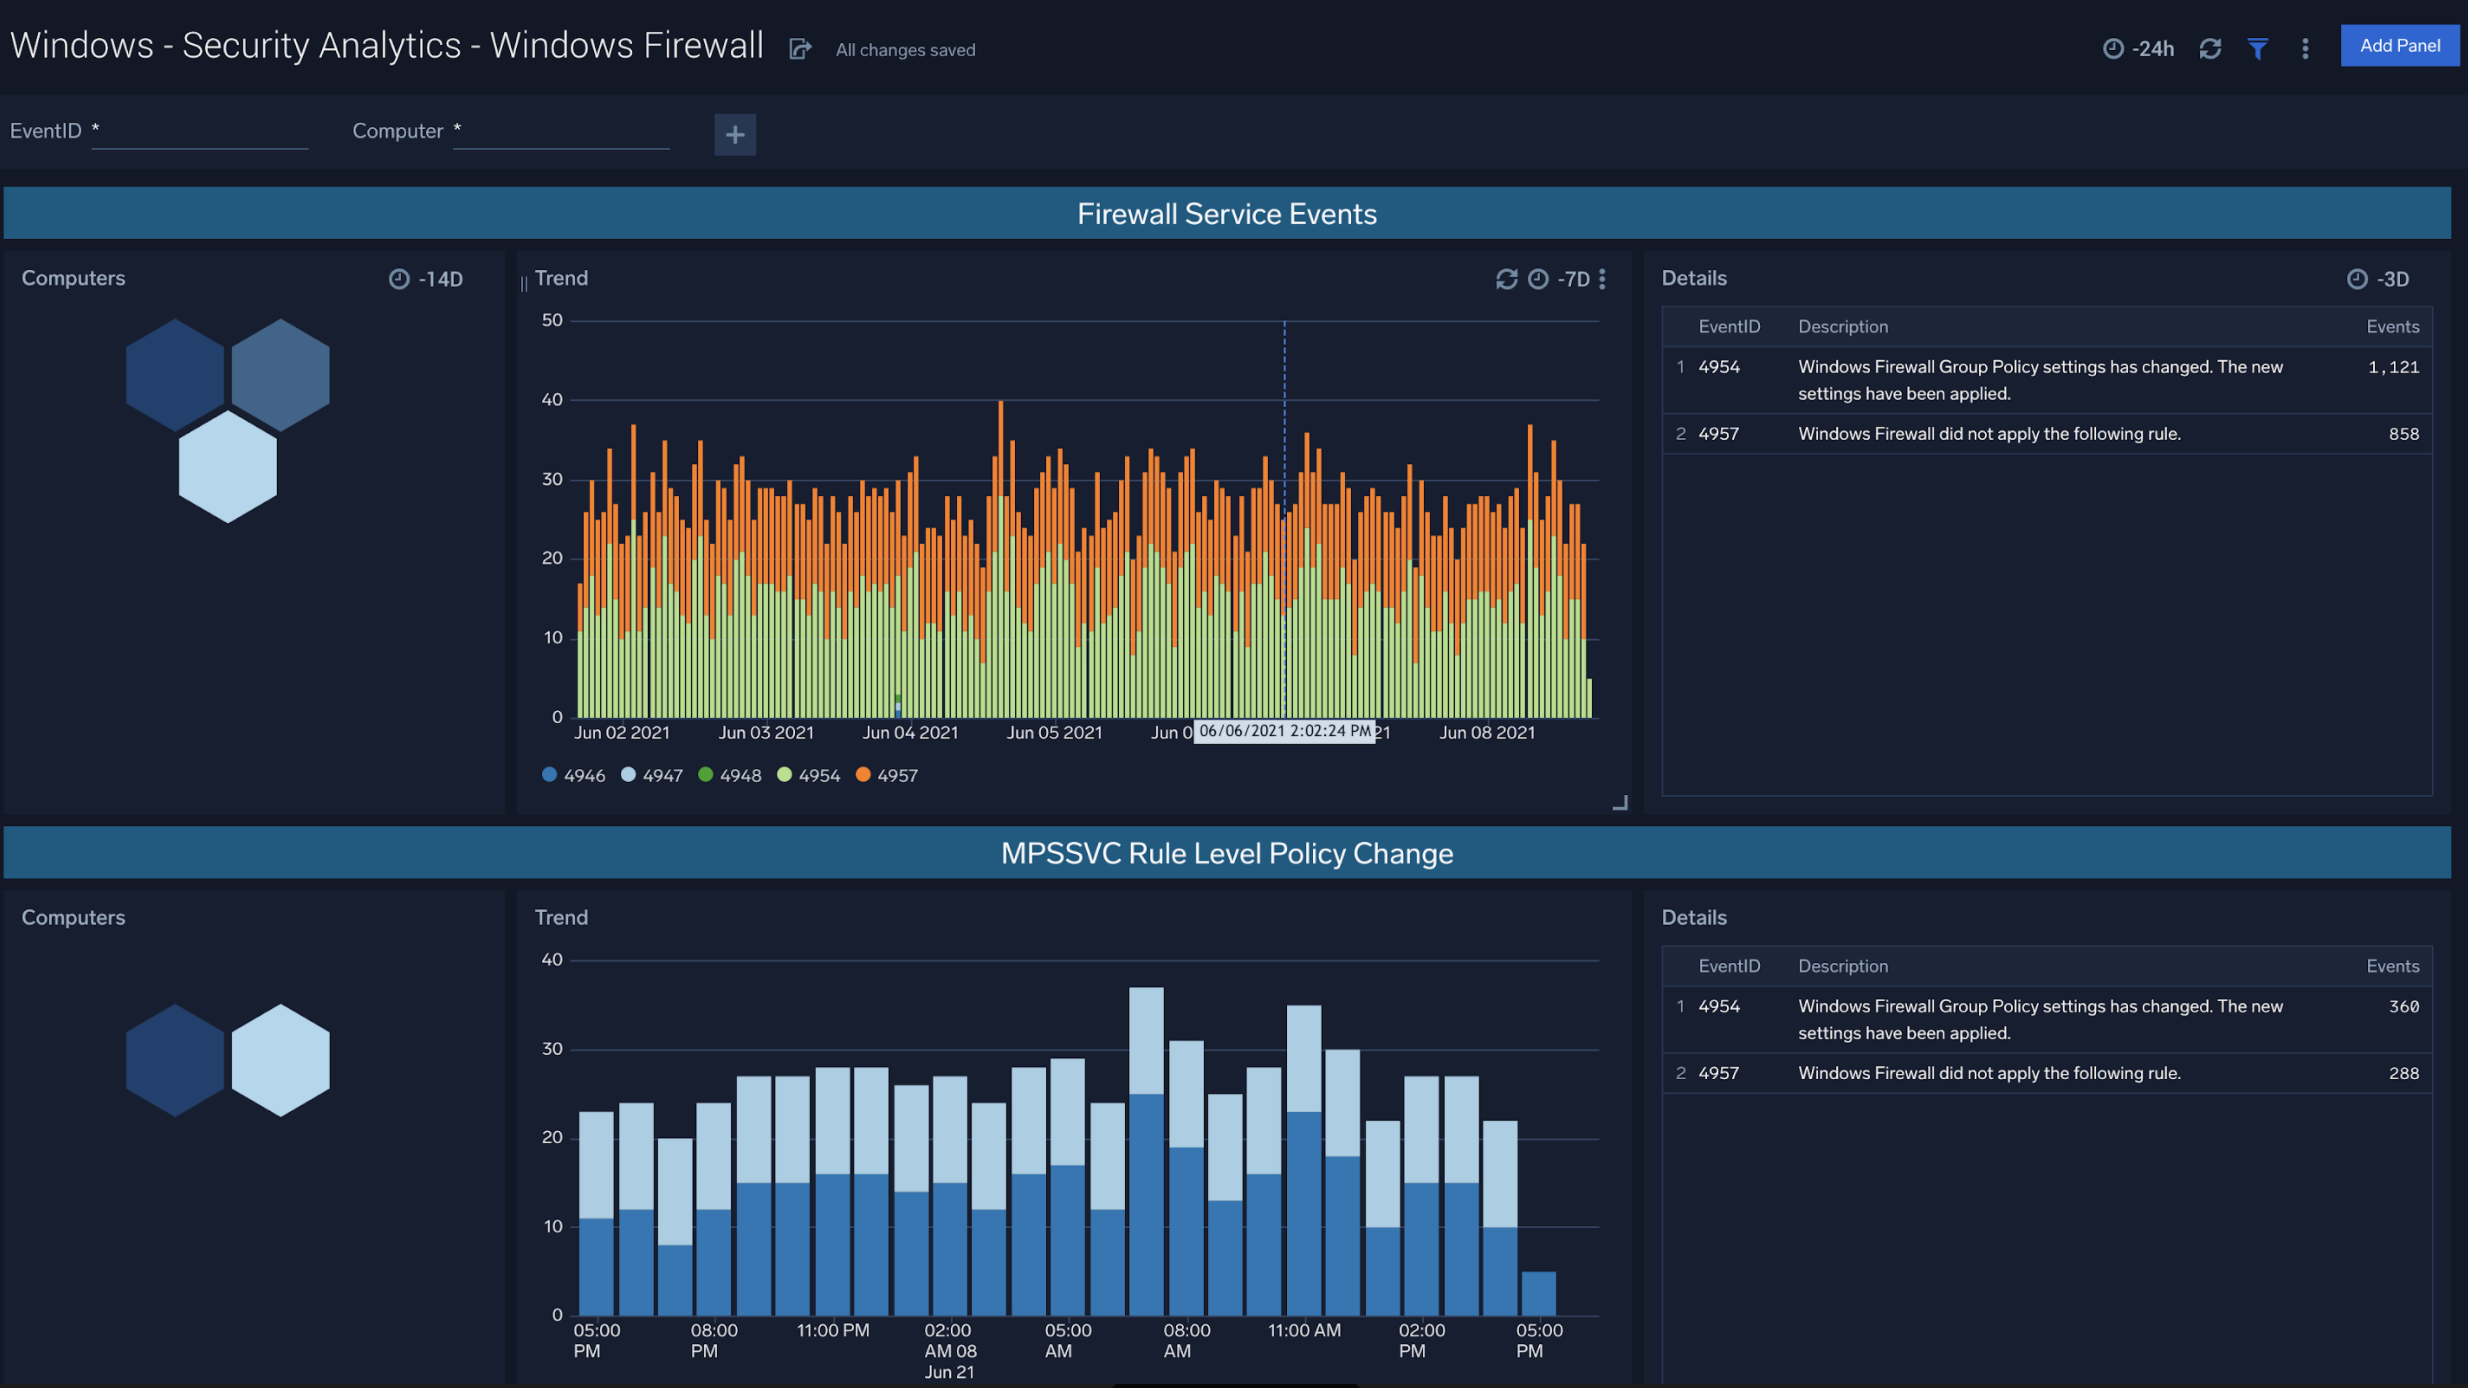
Windows Firewall
The Windows - Security Analytics - Windows Firewall dashboard allows you to view Windows Firewall activity including Firewall Service Events, MPSSVC Rule Level Policy Changes, and Filtering Platform Policy Changes.
Use case: Filter by EventID or specific device to analyze traffic patterns within your Windows environments
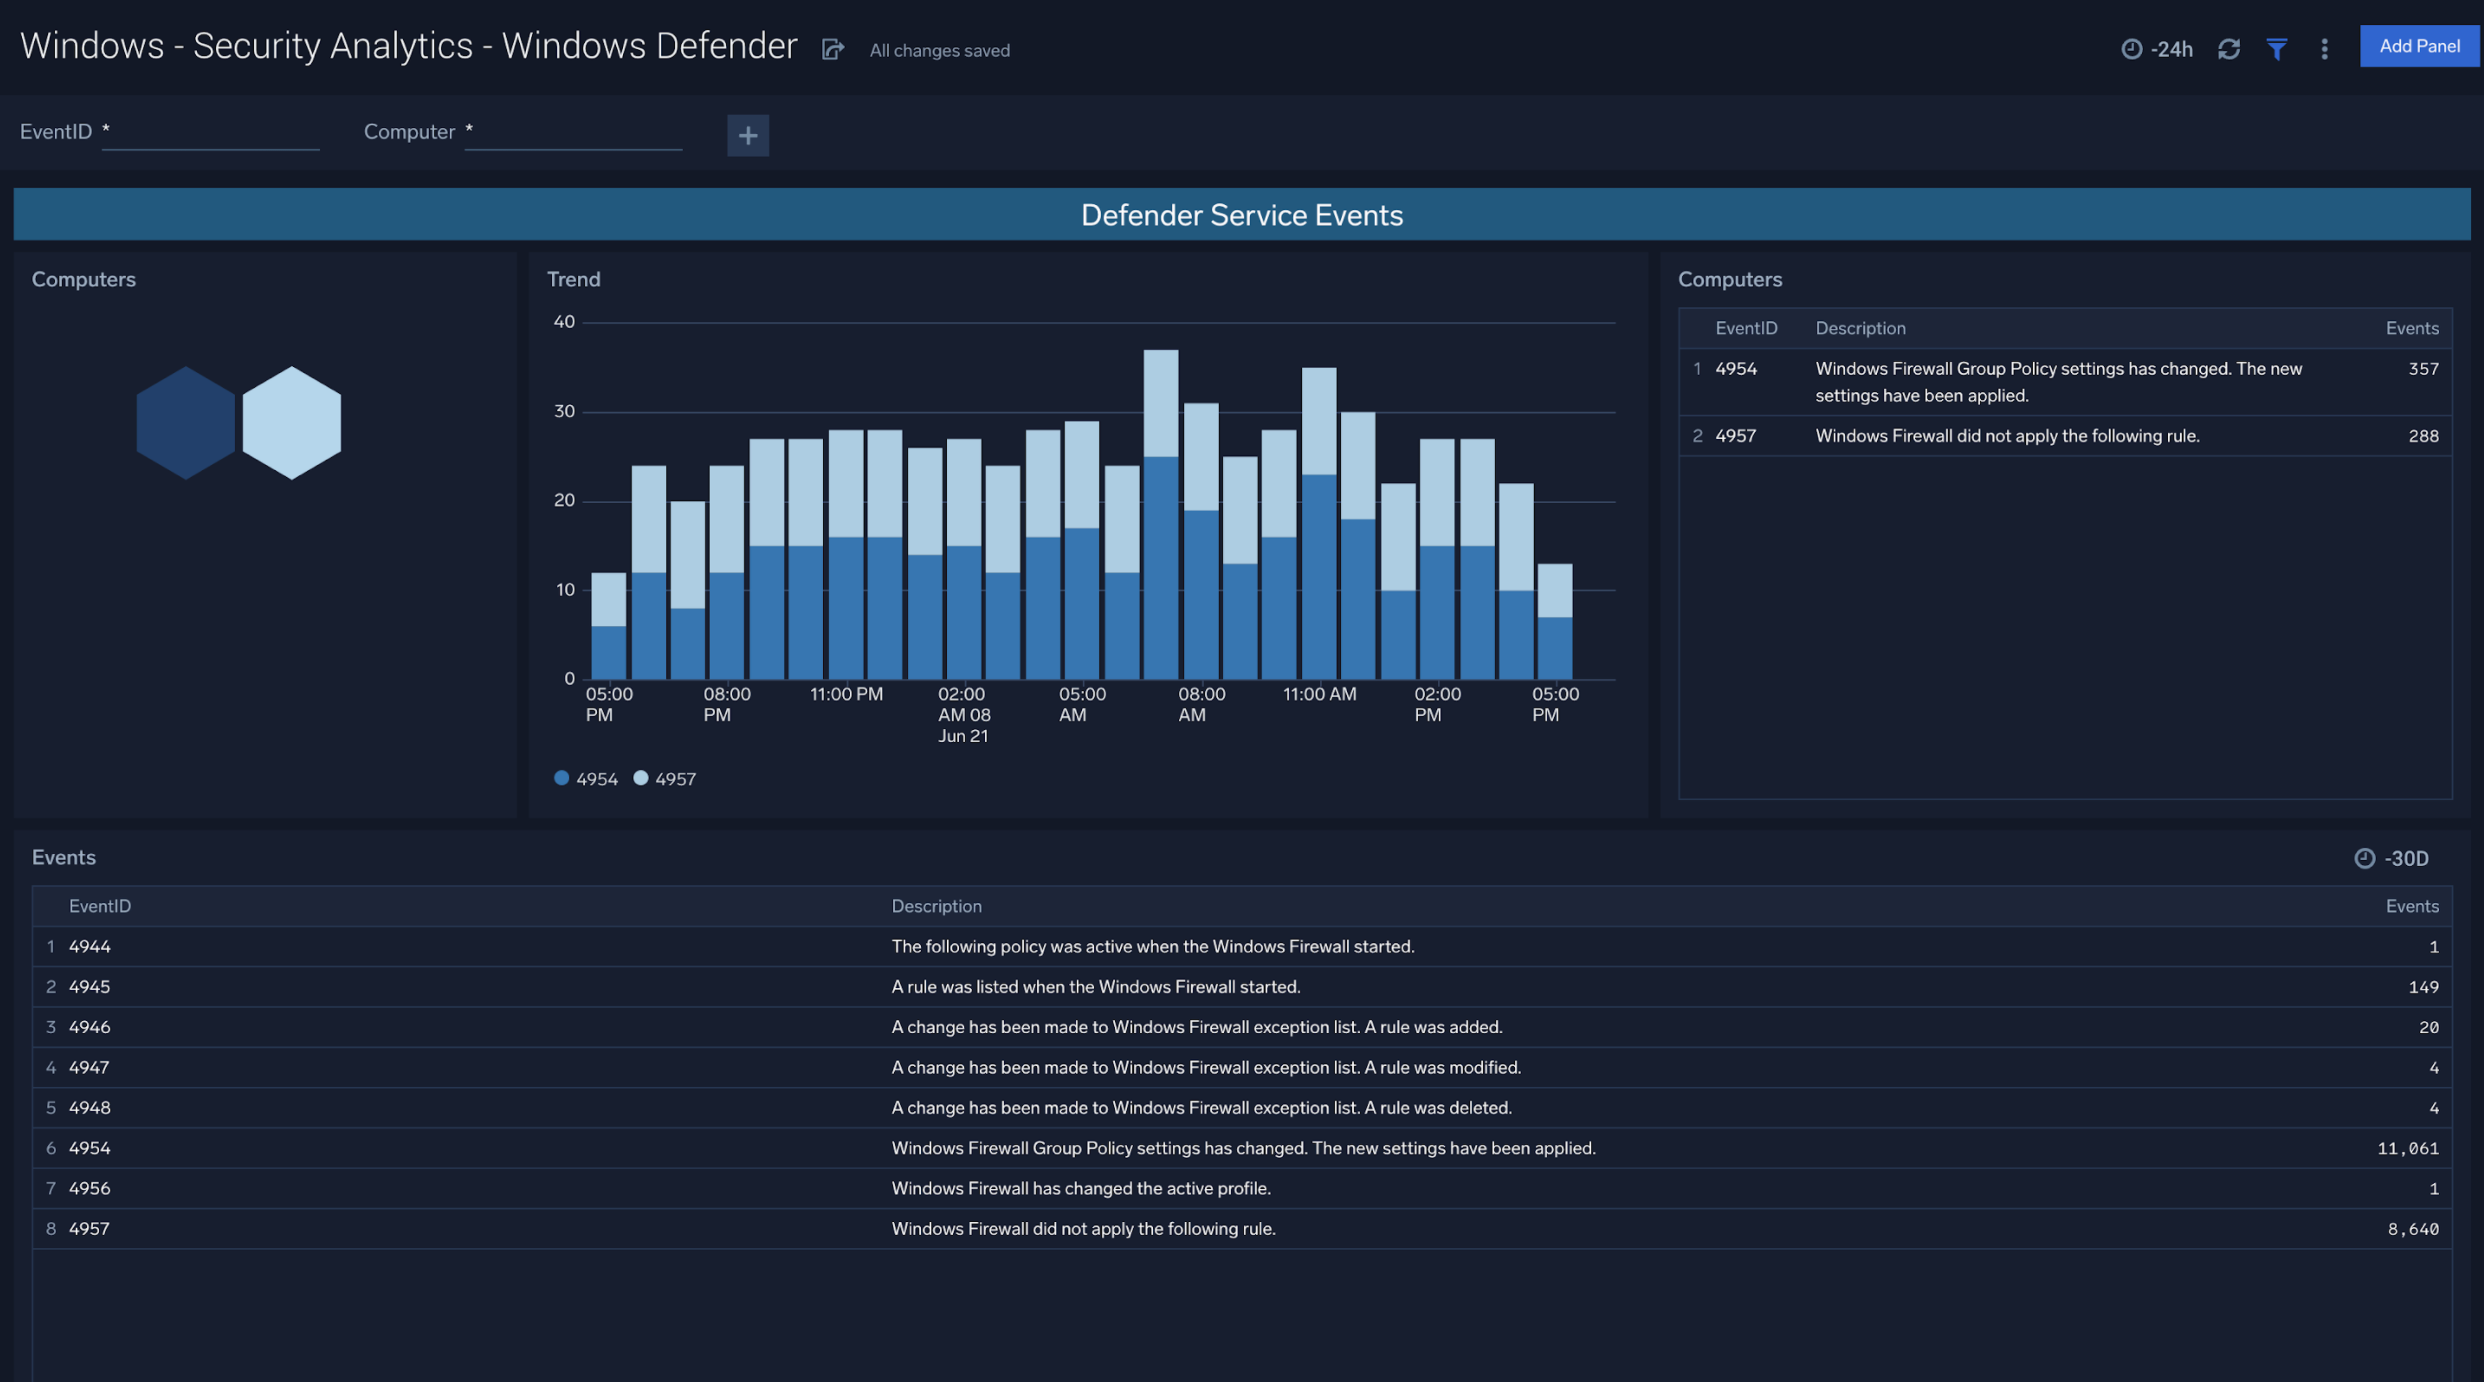
Windows Defender
The Windows - Security Analytics - Windows Defender dashboard is designed to offer visibility into Defender Service Events and Defender Threat Events at the Computer and Trend level.
Use case: Understand cross-sections of service events and threat events, filtered down by specific devices to stay ahead of changing attack surfaces.
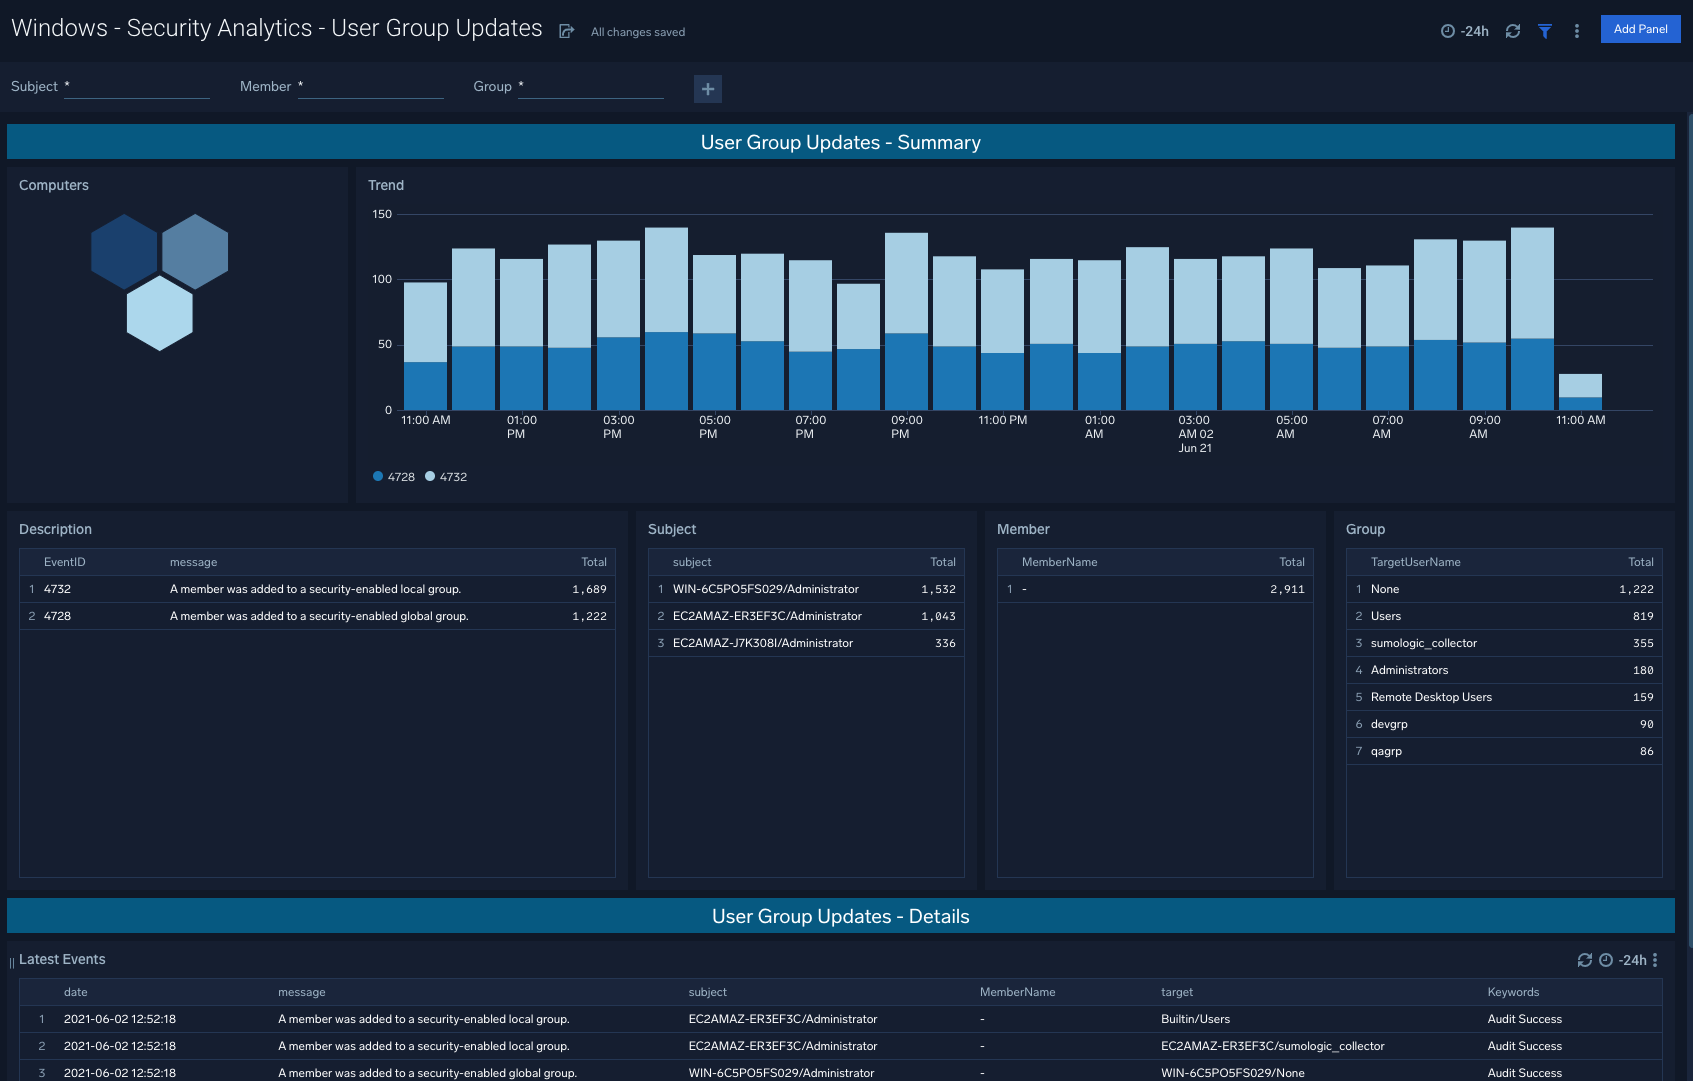
User Group Updates
The Windows - Security Analytics - User Group Updates dashboard provides User Group Updates that are generally a good litmus test for a summarized trend of how successfully Windows groups are being updated and on a correct cadence depending on policy requirements.
Use case: Aligning group update schedules to existing policies within your organization, and informing future policy changes as well based on triangulation against security events tied to update changes.
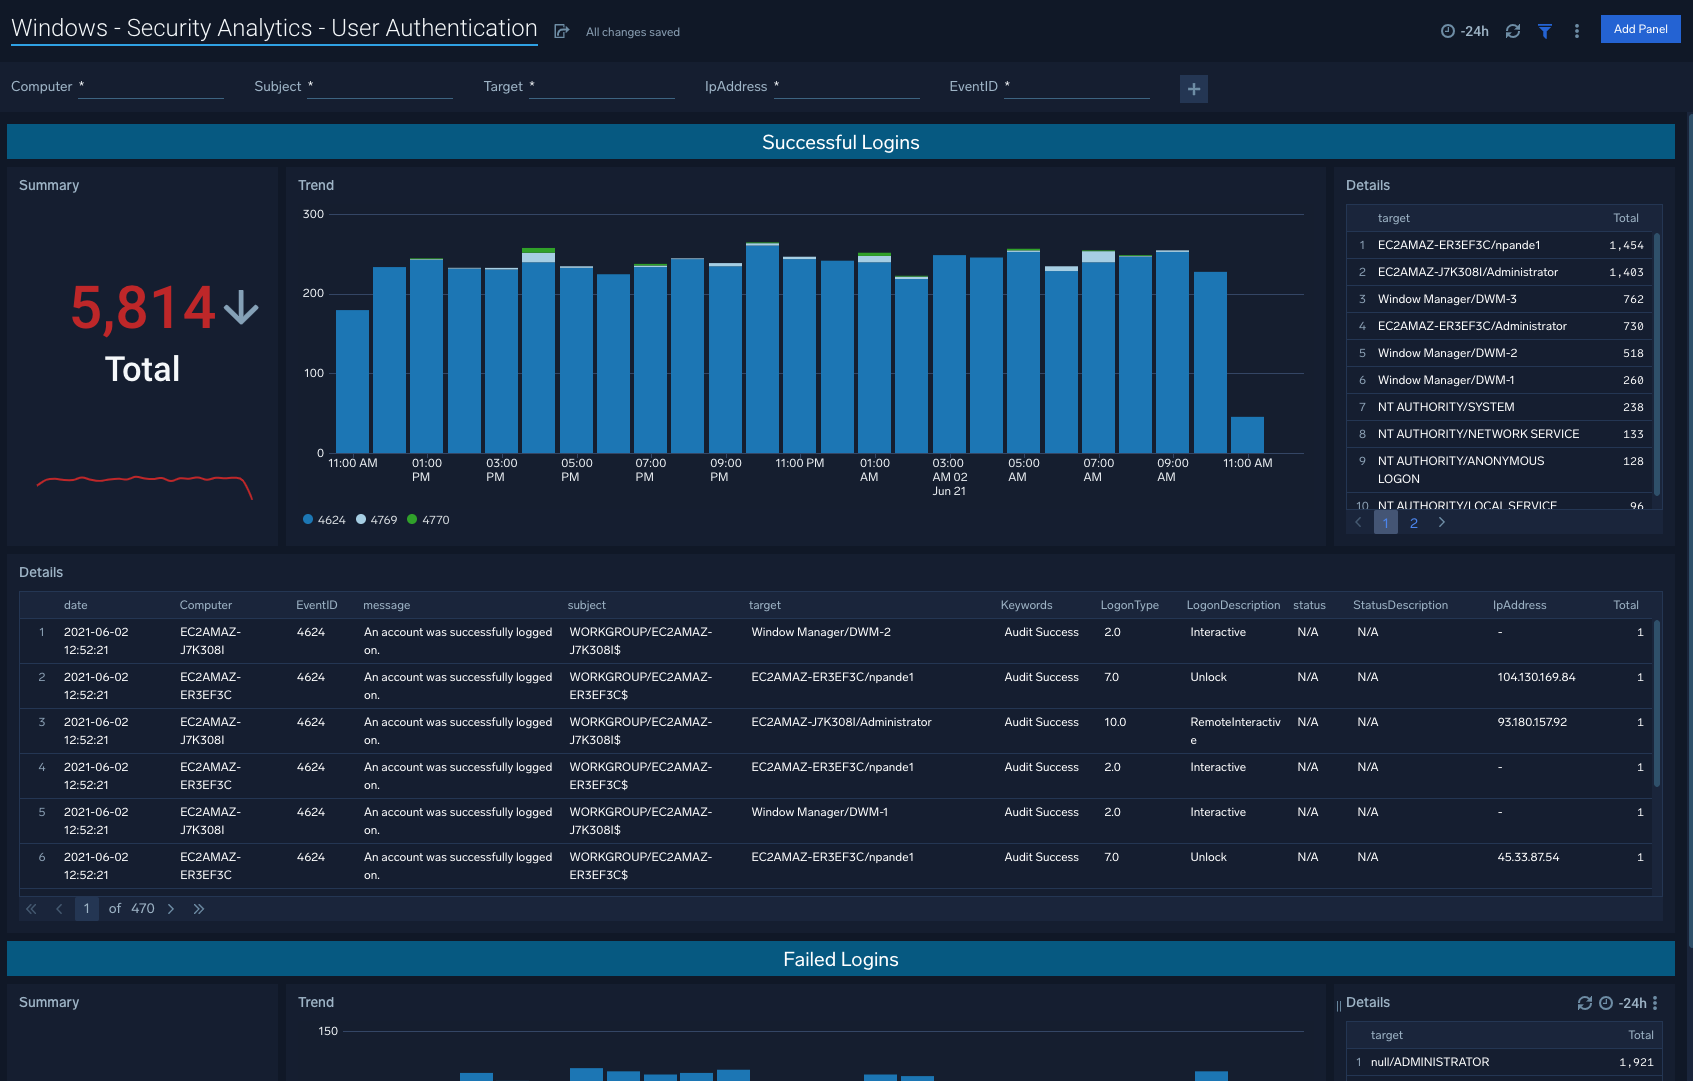
User Authentication
The Windows - Security Analytics - User Authentication dashboard points to snapshots of trends for successful logins as well as unsuccessful logins.
Use case: Unsuccessful logins in particular will indicate potential threats including brute-force attempts.
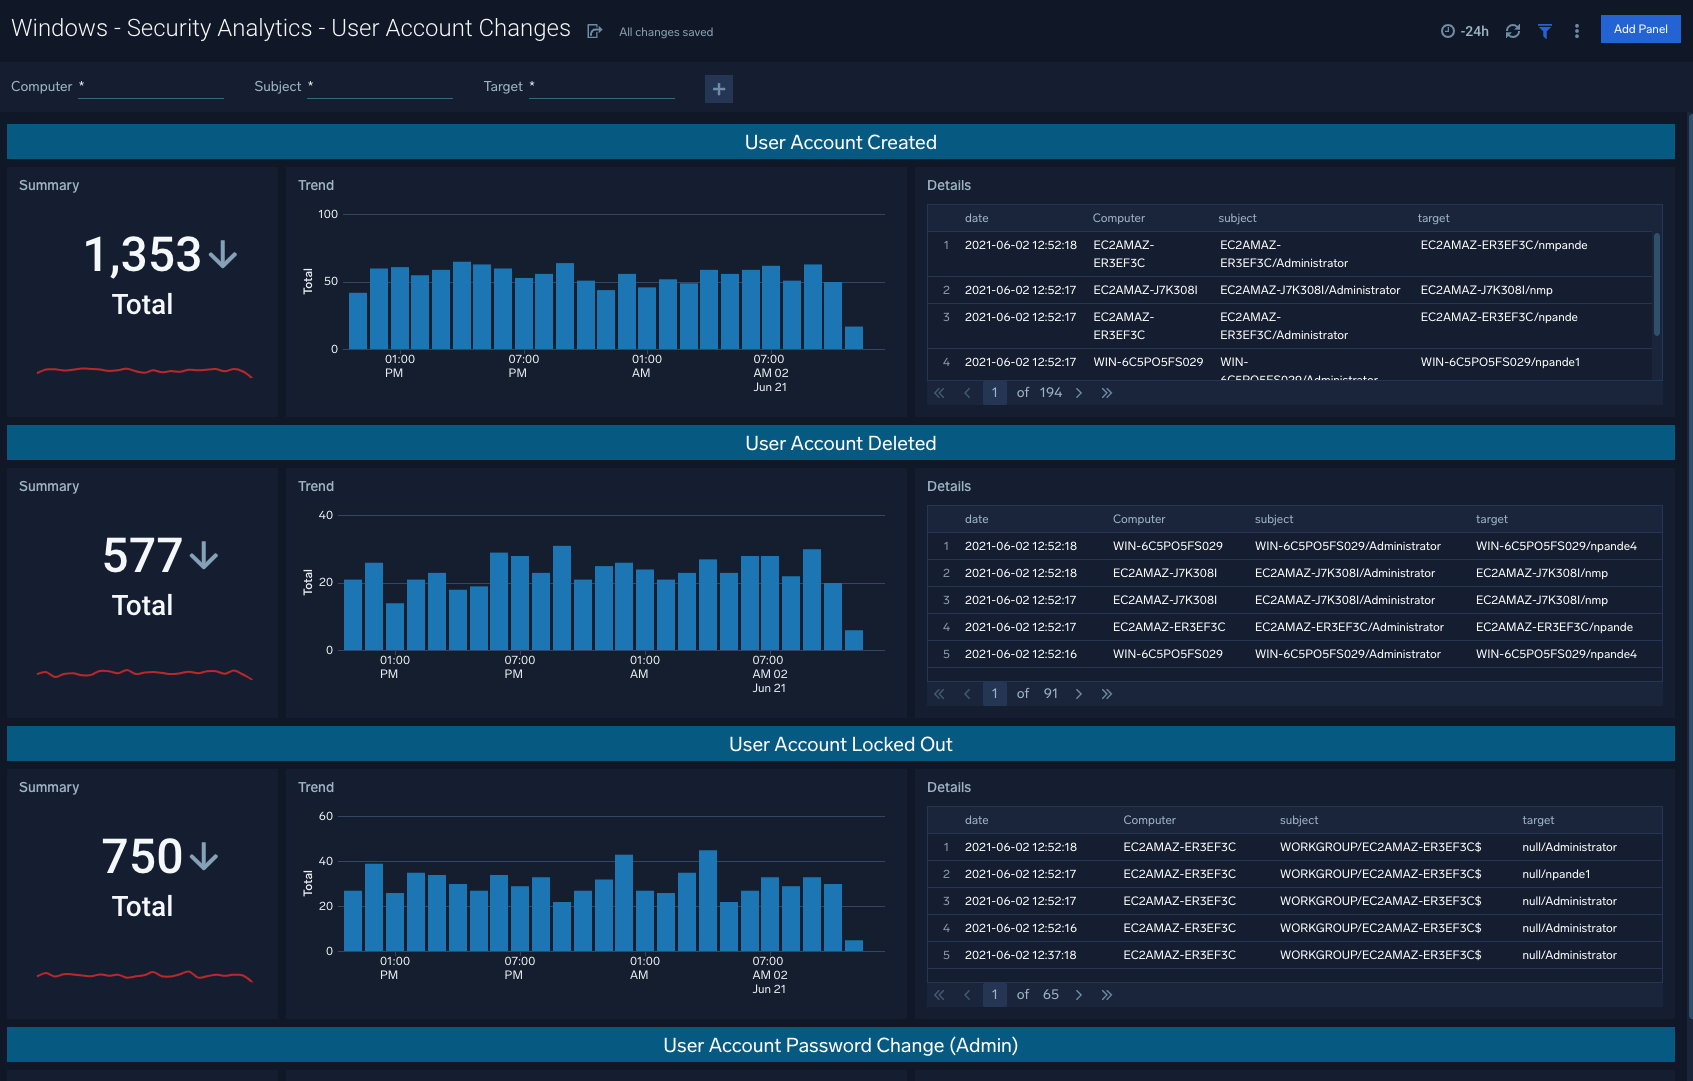
User Account Changes
The Windows - Security Analytics - User Account Changes dashboard shows user accounts created, deleted, locked out, as well as password changes for a given account.
Use case: Begin with the summarized visuals in the left columns, and navigate to the right column details to understand specific computers and subjects involved in the given activity.
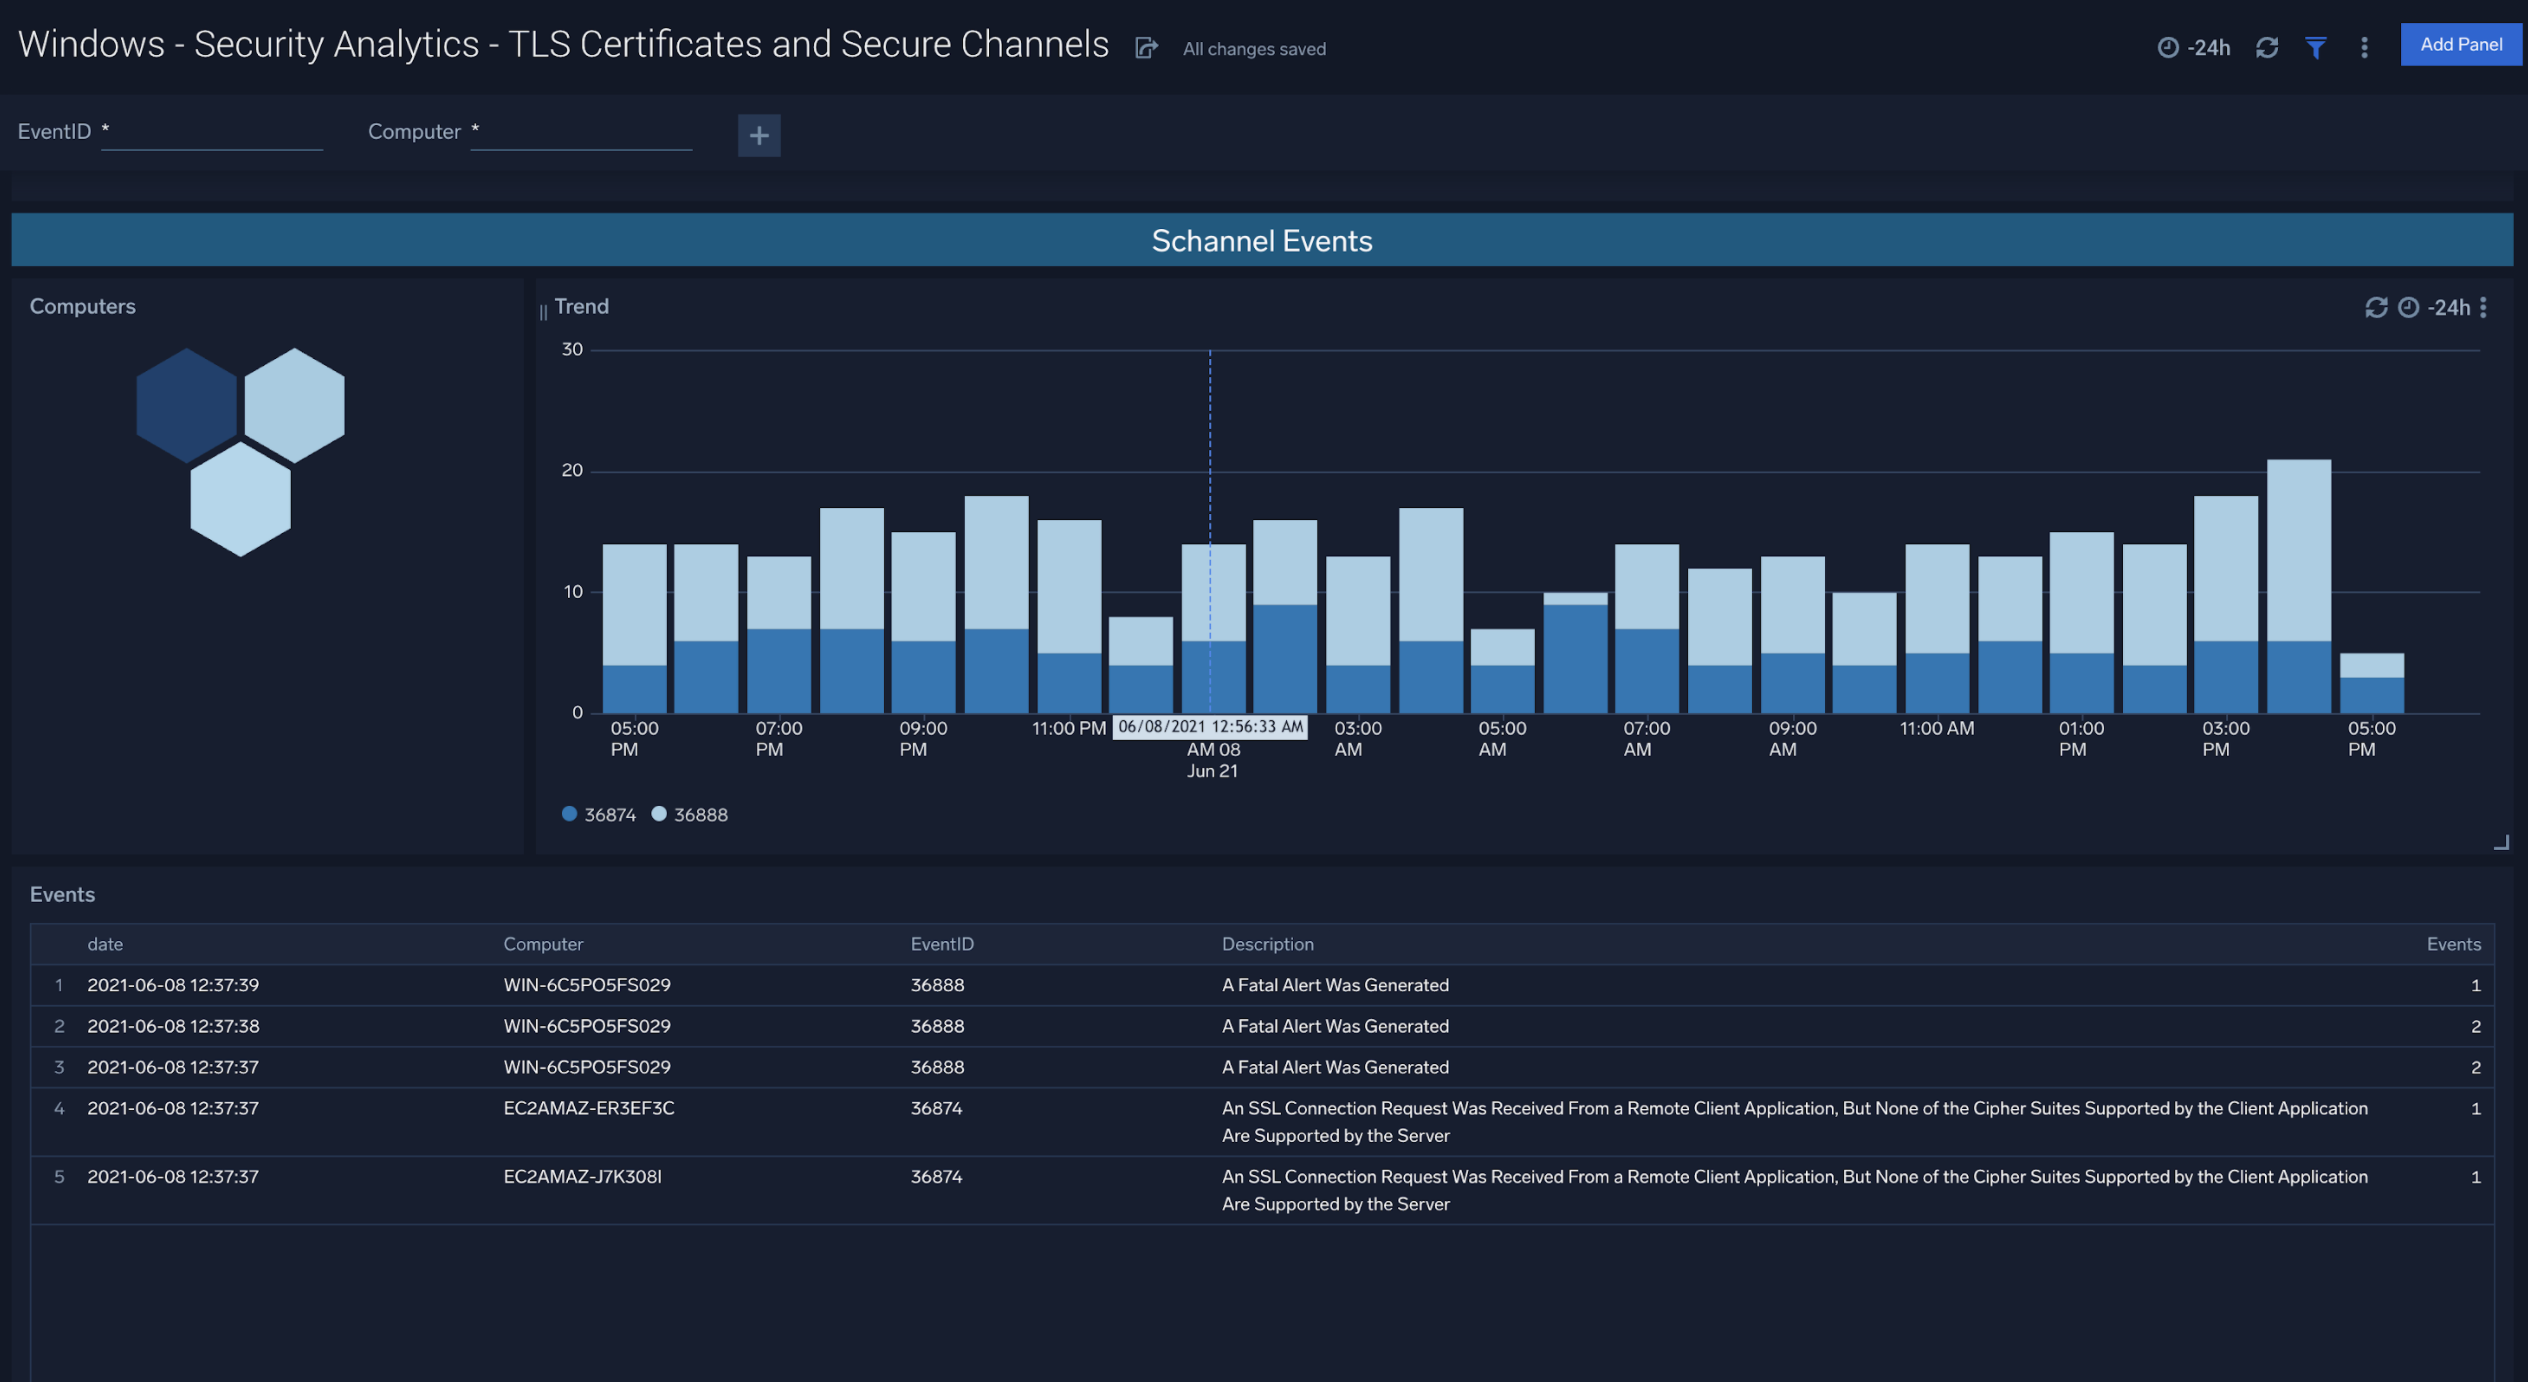
TLS Certificates and Secure Channels
The Windows - Security Analytics - TLS Certificates and Secure Channels dashboard indicates TLS Certificate and Secure Channel activity and associated computers, trends, and latest events.
Use case: By mapping changes in certificates and associated trends, teams can identify areas of improvement for current TLS Certificate deployments.
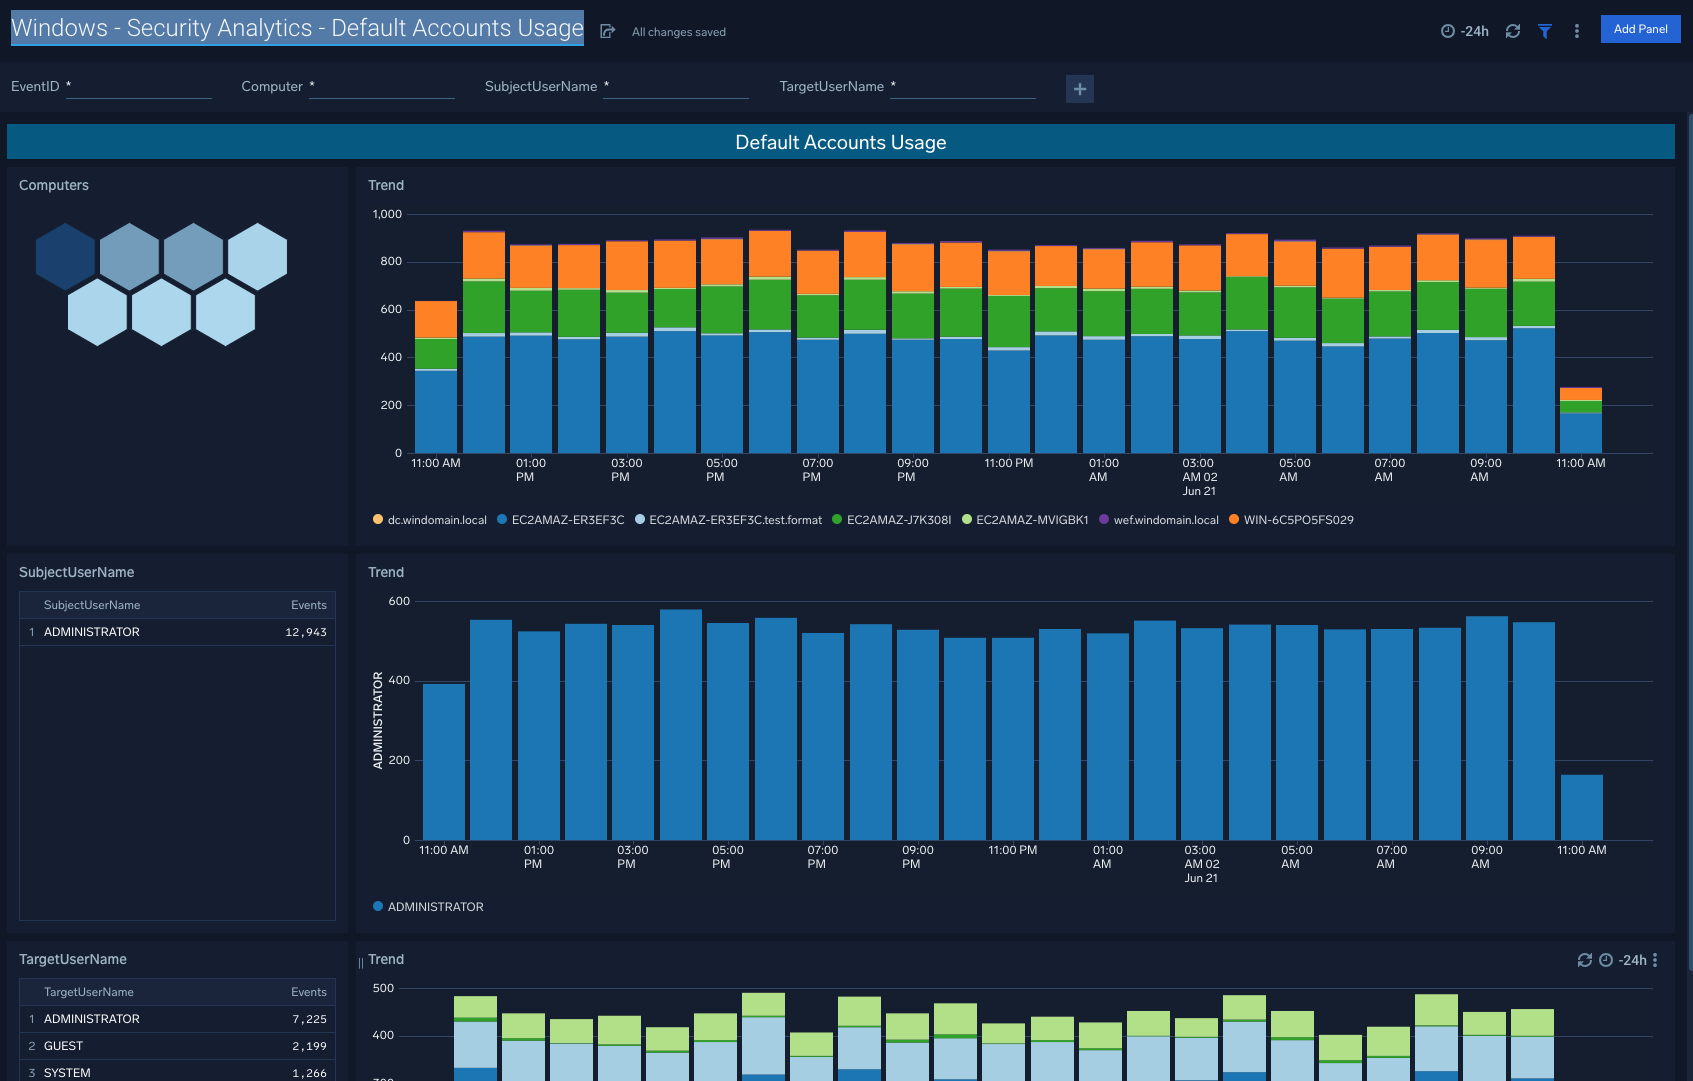
Default Accounts Usage
The Windows - Security Analytics - Default Accounts Usage dashboard allows you to filter Default Accounts Usage by EventID, Computer, SubjectUserName, and TargetUserName.
Use case: Honeycomb visuals also point to potential hotspots, or in other words specific computers that may require further attention relative to typical expected behavior within your organization.
Upgrade/Downgrade the Windows Cloud Security app (Optional)
To update the app, do the following:
Next-Gen App: To install or update the app, you must be an account administrator or a user with Manage Apps, Manage Monitors, Manage Fields, Manage Metric Rules, and Manage Collectors capabilities depending upon the different content types part of the app.
- Select App Catalog.
- In the Search Apps field, search for and then select your app.
Optionally, you can identify apps that can be upgraded in the Upgrade available section. - To upgrade the app, select Upgrade from the Manage dropdown.
- If the upgrade does not have any configuration or property changes, you will be redirected to the Preview & Done section.
- If the upgrade has any configuration or property changes, you will be redirected to the Setup Data page.
- In the Configure section of your respective app, complete the following fields.
- Field Name. If you already have collectors and sources set up, select the configured metadata field name (eg _sourcecategory) or specify other custom metadata (eg: _collector) along with its metadata Field Value.
- Click Next. You will be redirected to the Preview & Done section.
Post-update
Your upgraded app will be installed in the Installed Apps folder and dashboard panels will start to fill automatically.
See our Release Notes changelog for new updates in the app.
To revert the app to a previous version, do the following:
- Select App Catalog.
- In the Search Apps field, search for and then select your app.
- To version down the app, select Revert to < previous version of your app > from the Manage dropdown.
Uninstalling the Windows Cloud Security app (Optional)
To uninstall the app, do the following:
- Select App Catalog.
- In the 🔎 Search Apps field, run a search for your desired app, then select it.
- Click Uninstall.