Strimzi Kafka - Classic Collector

This guide provides an overview of Kafka metrics collection from Kafka pods deployed with the Strimzi Kafka operator.
The Sumo Logic App for Strimzi Kafka is a unified logs and metrics app. The app helps you to monitor the availability, performance, and resource utilization of Kafka messaging/streaming clusters. Pre-configured dashboards provide insights into the cluster status, throughput, broker operations, topics, replication, zookeepers, node resource utilization, and error logs.
This App has been tested with the following Kafka Operator versions:
- 0.35.0
This App has been tested with the following Kafka versions:
- 3.4.0
Sample log messages
{
  "timestamp":1617392000686,
  "log":"[2021-04-02 19:33:20,598] INFO [KafkaServer id=0] started (kafka.server.KafkaServer)",
  "stream":"stdout",
  "time":"2021-04-02T19:33:20.599066311Z"
}
Sample queries
This sample query string is from the Logs panel of the Strimzi Kafka - Logs dashboard.
messaging_cluster=* messaging_system="kafka" \
| json auto maxdepth 1 nodrop | if (isEmpty(log), _raw, log) as kafka_log_message \
| parse field=kafka_log_message "[*] * *" as date_time,severity,msg | where severity in ("ERROR", "FATAL") \
| count by date_time, severity, msg | sort by date_time | limit 10
Metrics
The list of metrics collected can be found here.
Collecting logs and metrics for Strimzi Kafka pods
Collection architecture is similar to Kafka and described here.
This section provides instructions for configuring log and metric collection for the Sumo Logic App for Strimzi Kafka.
Prerequisites for Kafka cluster deployment
Before configuring the collection, you will require the following items:
-
Access to the existing Kubernetes cluster where the Strimzi cluster operator is deployed. If not done, you can follow the Strimzi documentation.
-
Namespace where all the Kafka pods will be created or deployed.
-
Download the kafka-metrics-sumologic-telegraf.yaml. If you already have an existing yaml, you will have to merge the contents of both files. This file contains the Kafka resource.
Deploying Sumo Logic Kubernetes collection
- Create a new namespace to deploy resources. The below command creates a sumologiccollection namespace.
kubectl create ns sumologiccollection
-
Download sumologic_values_eks.yaml file. This file contains the remote write configuration for metrics that the app uses. You can add or remove metrics depending on your use case.
-
Generate the Sumo Logic access IDs and keys in the Sumo Logic portal.
-
Install the Sumo Logic Kubernetes Collection using sumologic_values_eks.yaml file (in folder) by following the instructions here. Ensure that you are monitoring your Kubernetes clusters with the Telegraf operator enabled. If you are not, then follow these instructions to do so. The following command enables traces and telegraf operators using the credentials generated in the previous step and deploys the 2.10.0 helm chart version.
helm upgrade --install sumologic sumologic/sumologic \
  --namespace sumologiccollection \
 --set sumologic.accessId=<access id> \
 --set sumologic.accessKey=<access key> \
 --set sumologic.clusterName="<Your Cluster Name>" \
 --set sumologic.traces.enabled=true \
 –-set telegraf-operator.enabled=true \
 --version 2.10.0 -f sumologic_values_eks.yaml
A collector will be created in your Sumo Logic org with the cluster name provided in the above command. You can verify it by referring to the collection page.
Configure metrics collection
Follow these steps to collect metrics from a Kubernetes environment:
- Preparing a custom image for running Kafka with Jolokia agent
Strimzi operator does not support Jolokia agent out of the box, so we need to update the Kafka image. To build the Kafka pod image, follow the instructions below:
-
Download the Dockerfile.
-
The above file uses container images available in the publicly available Strimzi Container Registry. Change the base image
quay.io/strimzi/kafka:latest-kafka-3.4.0to the respective Kafka version's image you want to use. -
Download the latest version of the Jolokia JVM-Agent from Jolokia, rename the file to
jolokia.jar, and place it in the same folder as the dockerfile. -
Build the Docker images using the following commands.
docker build --platform <platform> -t "${MAIN_DOCKER_TAG}:${KAFKA_APP_TAG}" .
docker tag "${MAIN_DOCKER_TAG}:${KAFKA_APP_TAG}" ${REGISTRY}/${REPOSITORY}:${KAFKA_APP_TAG}`
Example:
docker build --platform linux/amd64 -t "kafka:kafka-3.4.0" .
docker tag "kafka:kafka-3.4.0" public.ecr.aws/g0d6f4n6/strimzi-kafka-jolokia:kafka-3.4.0 -
Push the images into your container repository. Strimzi supports both private container registries and public registries. You can either configure image pull secrets at the Cluster operator level or in the PodTemplate section.
-
Update the
<<IMAGE_TAG>>in kafka-metrics-sumologic-telegraf.yaml file downloaded earlier. -
Add annotations on your Kafka pods
-
Open kafka-metrics-sumologic-telegraf.yaml in any editor and go to spec -> kafka -> template -> pod -> metadata -> annotations section.
-
In the tags sections(
[inputs.jolokia2_agent.tags]and[inputs.disk.tags]), enter values for the parameters marked with<<CLUSTER_NAME>>,<<ENVIRONMENT>>in the yaml file:environment. Replace<<ENVIRONMENT>>with the deployment environment where the Kafka cluster identified by the value of servers resides. For example: dev, prod, or qa. While this value is optional, we highly recommend setting it.messaging_cluster. Replace<<CLUSTER_NAME>>with a name to identify this Kafka cluster. This cluster name will be shown in the Sumo Logic dashboards.
Do not modify the following values as it will cause the Sumo Logic app to not function correctly.
telegraf.influxdata.com/class: sumologic-prometheus. This instructs the Telegraf operator what output to use. This should not be changed.prometheus.io/scrape: "true". This ensures our Prometheus plugin will scrape the metrics.prometheus.io/port: "9273". This tells Prometheus what ports to scrape metrics from. This should not be changed.- In the tags sections(
[inputs.jolokia2_agent.tags]and[inputs.disk.tags])component: “messaging”- This value is used by Sumo Logic apps to identify application components.messaging_system: “kafka”- This value identifies the database system.
- In the input plugins(
telegraf.influxdata.com/inputs) section:urls- The URL to the Kafka server. As telegraf will be run as a sidecar, theurlsshould always be localhost. This can be a comma-separated list to connect to multiple Kafka servers.
For more information on all other parameters, see this doc for more parameters that can be configured in the Telegraf agent globally.
For more information on configuring the Joloka input plugin for Telegraf, see this doc.
-
Configure logs collection
If your Kafka helm chart/pod is writing the logs to standard output, then the Sumologic Kubernetes Collection will automatically capture the logs from stdout and will send the logs to Sumologic. If no, then you have to use tailing-sidecar approach.
-
Add labels on your Kafka pods
- Open kafka-metrics-sumologic-telegraf.yaml in any editor and go to spec -> kafka -> template -> pod -> metadata -> labels section.
- Enter values for the parameters marked with
<<CLUSTER_NAME>>,<<ENVIRONMENT>>in the yaml file:-
environment. Replace<<ENVIRONMENT>>with the deployment environment where the Kafka cluster identified by the value of servers resides. For example: dev, prod, or qa. While this value is optional, we highly recommend setting it. -
messaging_cluster. Replace<<CLUSTER_NAME>>with a name to identify this Kafka cluster. This cluster name will be shown in the Sumo Logic dashboards. -
Do not modify the following values as it will cause the Sumo Logic app to not function correctly.
component: “messaging”- This value is used by Sumo Logic apps to identify application components.messaging_system: “kafka”- This value identifies the messaging system.
-
-
Collect Kafka logs written to log files (Optional). If your Kafka helm chart/pod is writing its logs to log files, you can use a sidecar to send log files to standard out. To do this:
- Determine the location of the Kafka log file on Kubernetes. This can be determined from the helm chart configurations.
- Install the Sumo Logic tailing sidecar operator.
- Add the following annotation to the existing annotations in kafka-metrics-sumologic-telegraf.yaml file.
annotations:
  tailing-sidecar: sidecarconfig;<mount>:<path_of_kafka_log_file>/<kafka_log_file_name>`
Example:
annotations:
  tailing-sidecar: sidecarconfig;data:/opt/Kafka/kafka_<VERSION>/logs/server.log
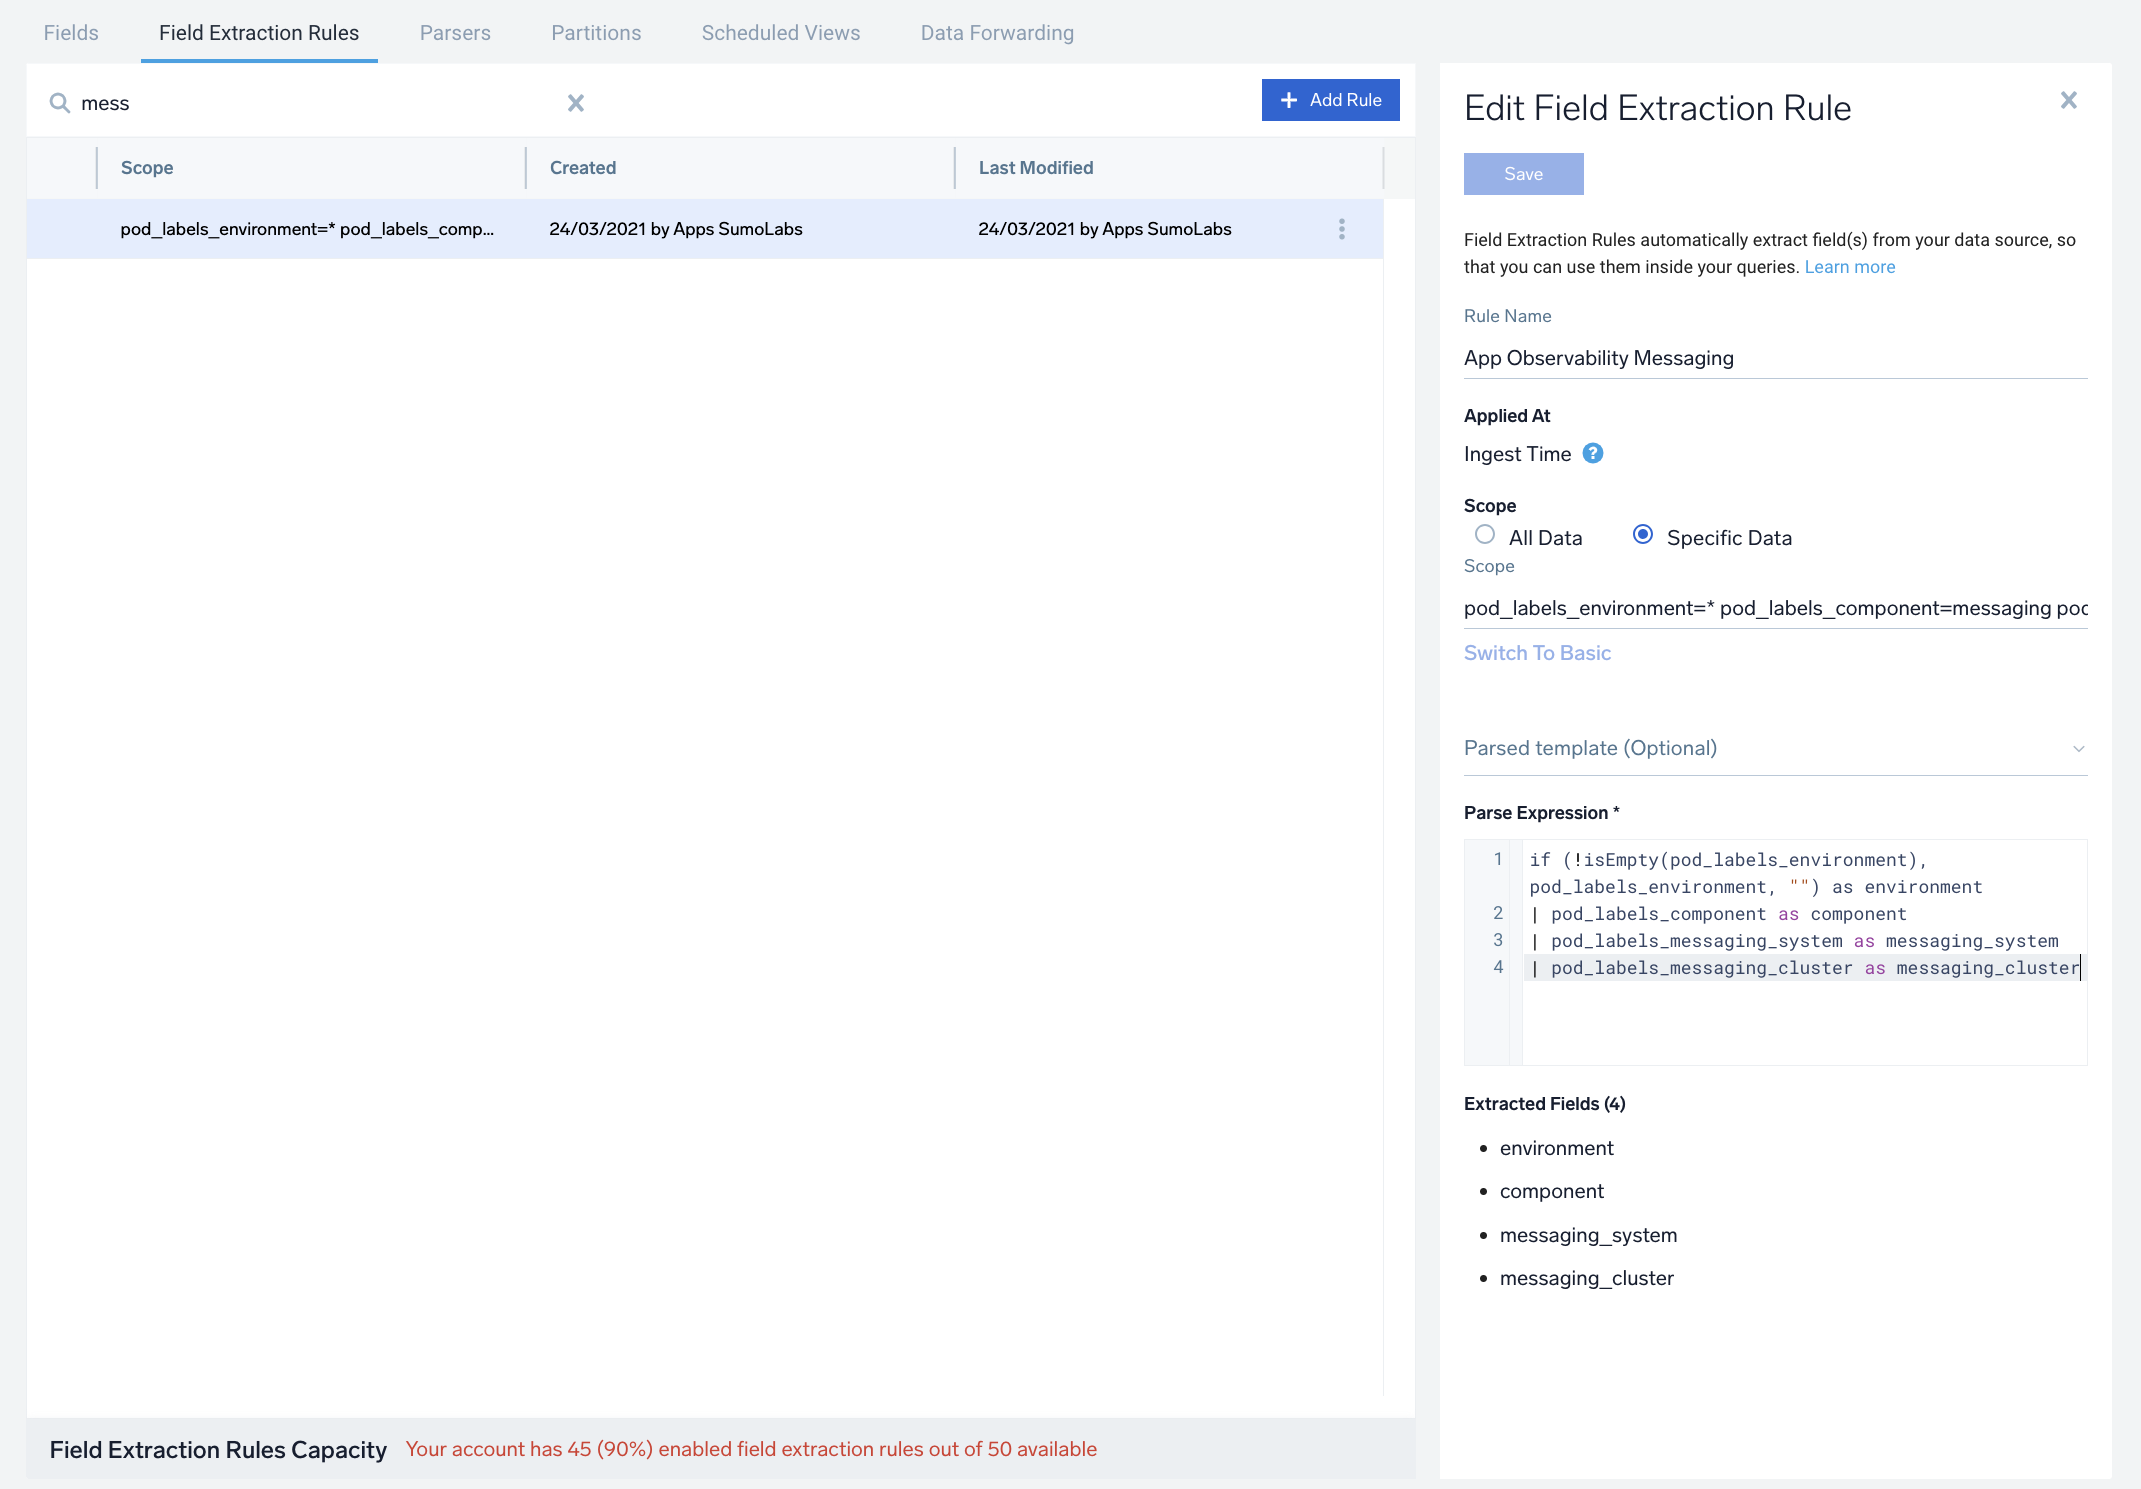
FER to normalize the fields in Kubernetes environments. Labels created in Kubernetes environments are automatically prefixed with pod_labels. To normalize these for our app to work, a Field Extraction Rule named AppObservabilityMessagingStrimziKafkaFER is automatically created for Strimzi Kafka Application Components.
Deploying Kafka pods
After updating kafka-metrics-sumologic-telegraf.yaml, you can use the below command to deploy the Kafka pods
kubectl apply -f kafka-metrics-sumologic-telegraf.yaml -n <<NAMESPACE>>
Deployment verification
-
Make sure that the Kafka pods are running and correct annotations/labels are applied by using the command:
kubectl describe pod <Kafka_pod_name> -
Verifying Metrics in Kafka pods
- You can ssh to the Kafka pod and run the following commands to make sure Telegraf (and Jolokia) are scraping metrics from your Kafka Pod:
curl localhost:9273/metrics
curl http://localhost:8778/jolokia/list
- The Sumo Logic Kubernetes collection will automatically start collecting logs and metrics from the pods having the annotations and labels defined in the previous steps. Verify logs and metrics are flowing into Sumo Logic by running the following query in Log Search and Metrics Explorer:
component="messaging" and messaging_system="kafka"
Troubleshooting
-
If you are still not seeing metrics or logs, follow the troubleshooting guide.
-
If you are seeing unhealthy targets in the Prometheus console, sometimes custom network policies may be responsible for affecting connectivity across Prometheus pods and Kafka pods.
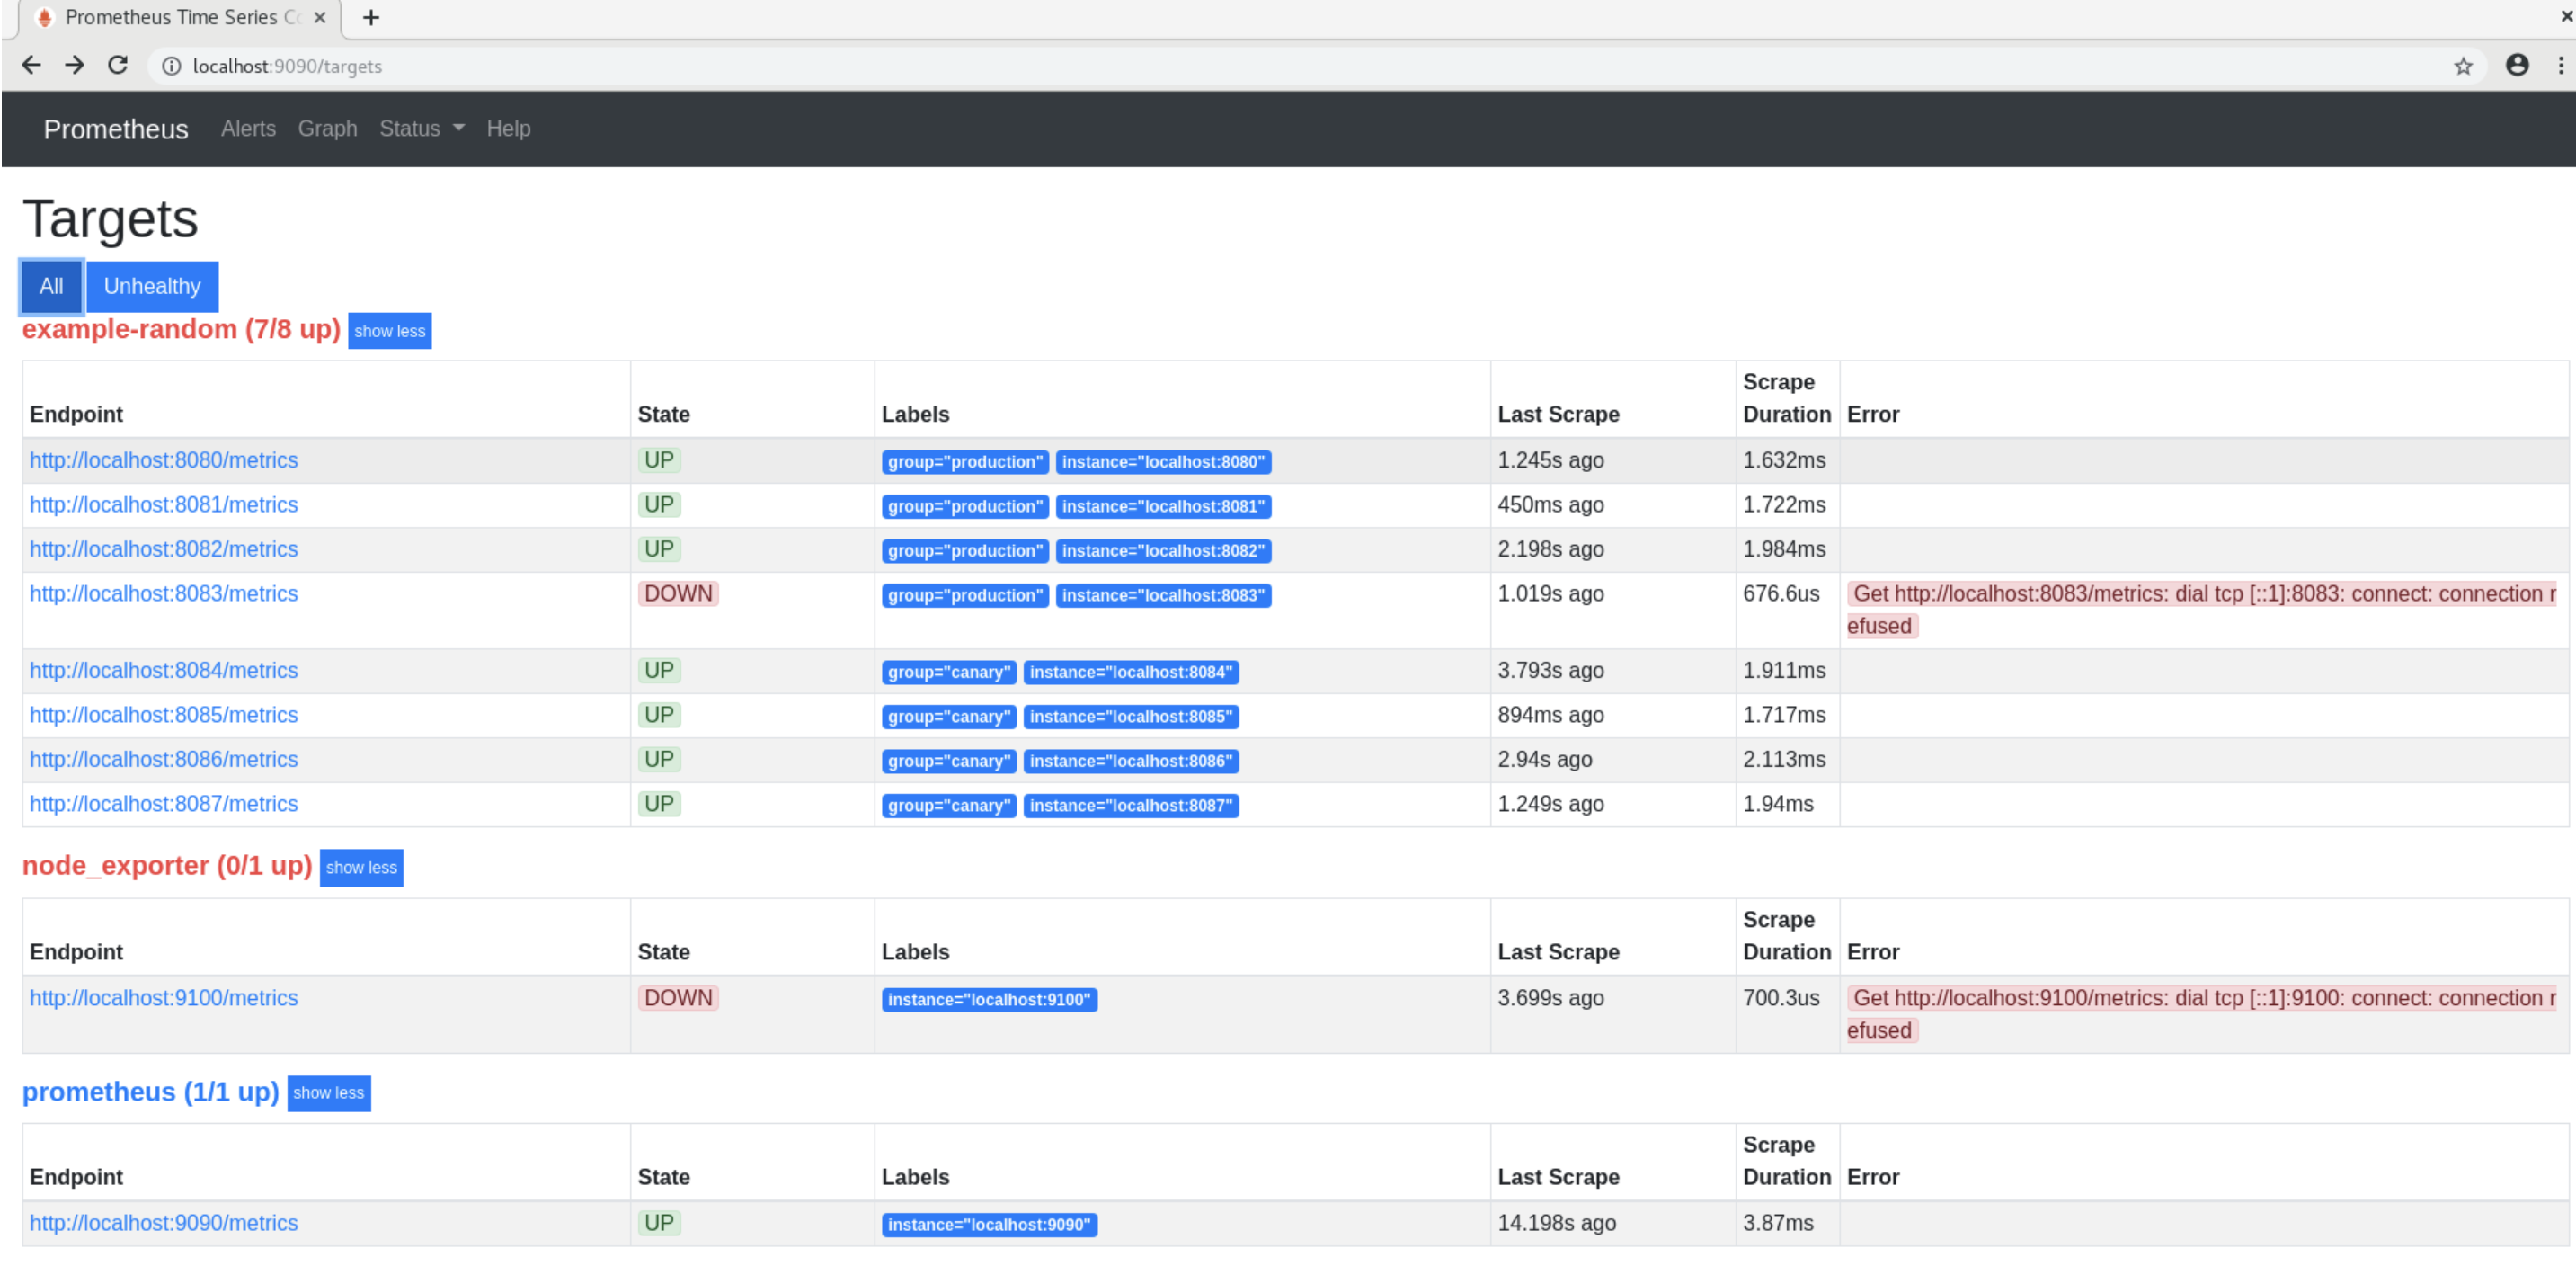
Follow the steps below to allow traffic from the sumologiccollection namespace:
- First, we need to label the sumologiccollection namespace
kubectl label namespace sumologiccollection namespace=sumologiccollection
You can validate the above by the command given below:
kubectl get namespaces sumologiccollection --show-labels
- Then add the snippet given below in your existing network policy to allow all traffic from the sumologiccollection namespace. We can restrict it from specific ports as well, but let's first start by allowing all ports. Since podSelector works for only pods in the same namespace as the network policy, we are using the namespaceSelector property.
  - from:
      - namespaceSelector:
          matchExpressions:
          - key: namespace
            operator: In
            values: ["sumologiccollection"]
Installing the Kafka app
To install the app, do the following:
Next-Gen App: To install or update the app, you must be an account administrator or a user with Manage Apps, Manage Monitors, Manage Fields, Manage Metric Rules, and Manage Collectors capabilities depending upon the different content types part of the app.
- Select App Catalog.
- In the 🔎 Search Apps field, run a search for your desired app, then select it.
- Click Install App.
note
Sometimes this button says Add Integration.
- Click Next in the Setup Data section.
- In the Configure section of your respective app, complete the following fields.
- Field Name. If you already have collectors and sources set up, select the configured metadata field name (eg _sourcecategory) or specify other custom metadata (eg: _collector) along with its metadata Field Value.
- Is K8S deployment involved. Specify if resources being monitored are partially or fully deployed on Kubernetes (K8s)
- Click Next. You will be redirected to the Preview & Done section.
Post-installation
Once your app is installed, it will appear in your Installed Apps folder, and dashboard panels will start to fill automatically.
Each panel slowly fills with data matching the time range query received since the panel was created. Results will not immediately be available but will be updated with full graphs and charts over time.
As part of the app installation process, the following fields will be created by default:
componentenvironmentmessaging_systemmessaging_clusterpod
Additionally, if you're using Squid Proxy in the Kubernetes environment, the following additional fields will be created by default during the app installation process:
pod_labels_componentpod_labels_environmentpod_labels_messaging_systempod_labels_messaging_cluster
Viewing the Kafka dashboards
All dashboards have a set of filters that you can apply to the entire dashboard. Use these filters to drill down and examine the data to a granular level.
- You can change the time range for a dashboard or panel by selecting a predefined interval from a drop-down list, choosing a recently used time range, or specifying custom dates and times. Learn more.
- You can use template variables to drill down and examine the data on a granular level. For more information, see Filtering Dashboards with Template Variables.
- Most Next-Gen apps allow you to provide the scope at the installation time and are comprised of a key (
_sourceCategoryby default) and a default value for this key. Based on your input, the app dashboards will be parameterized with a dashboard variable, allowing you to change the dataset queried by all panels. This eliminates the need to create multiple copies of the same dashboard with different queries.
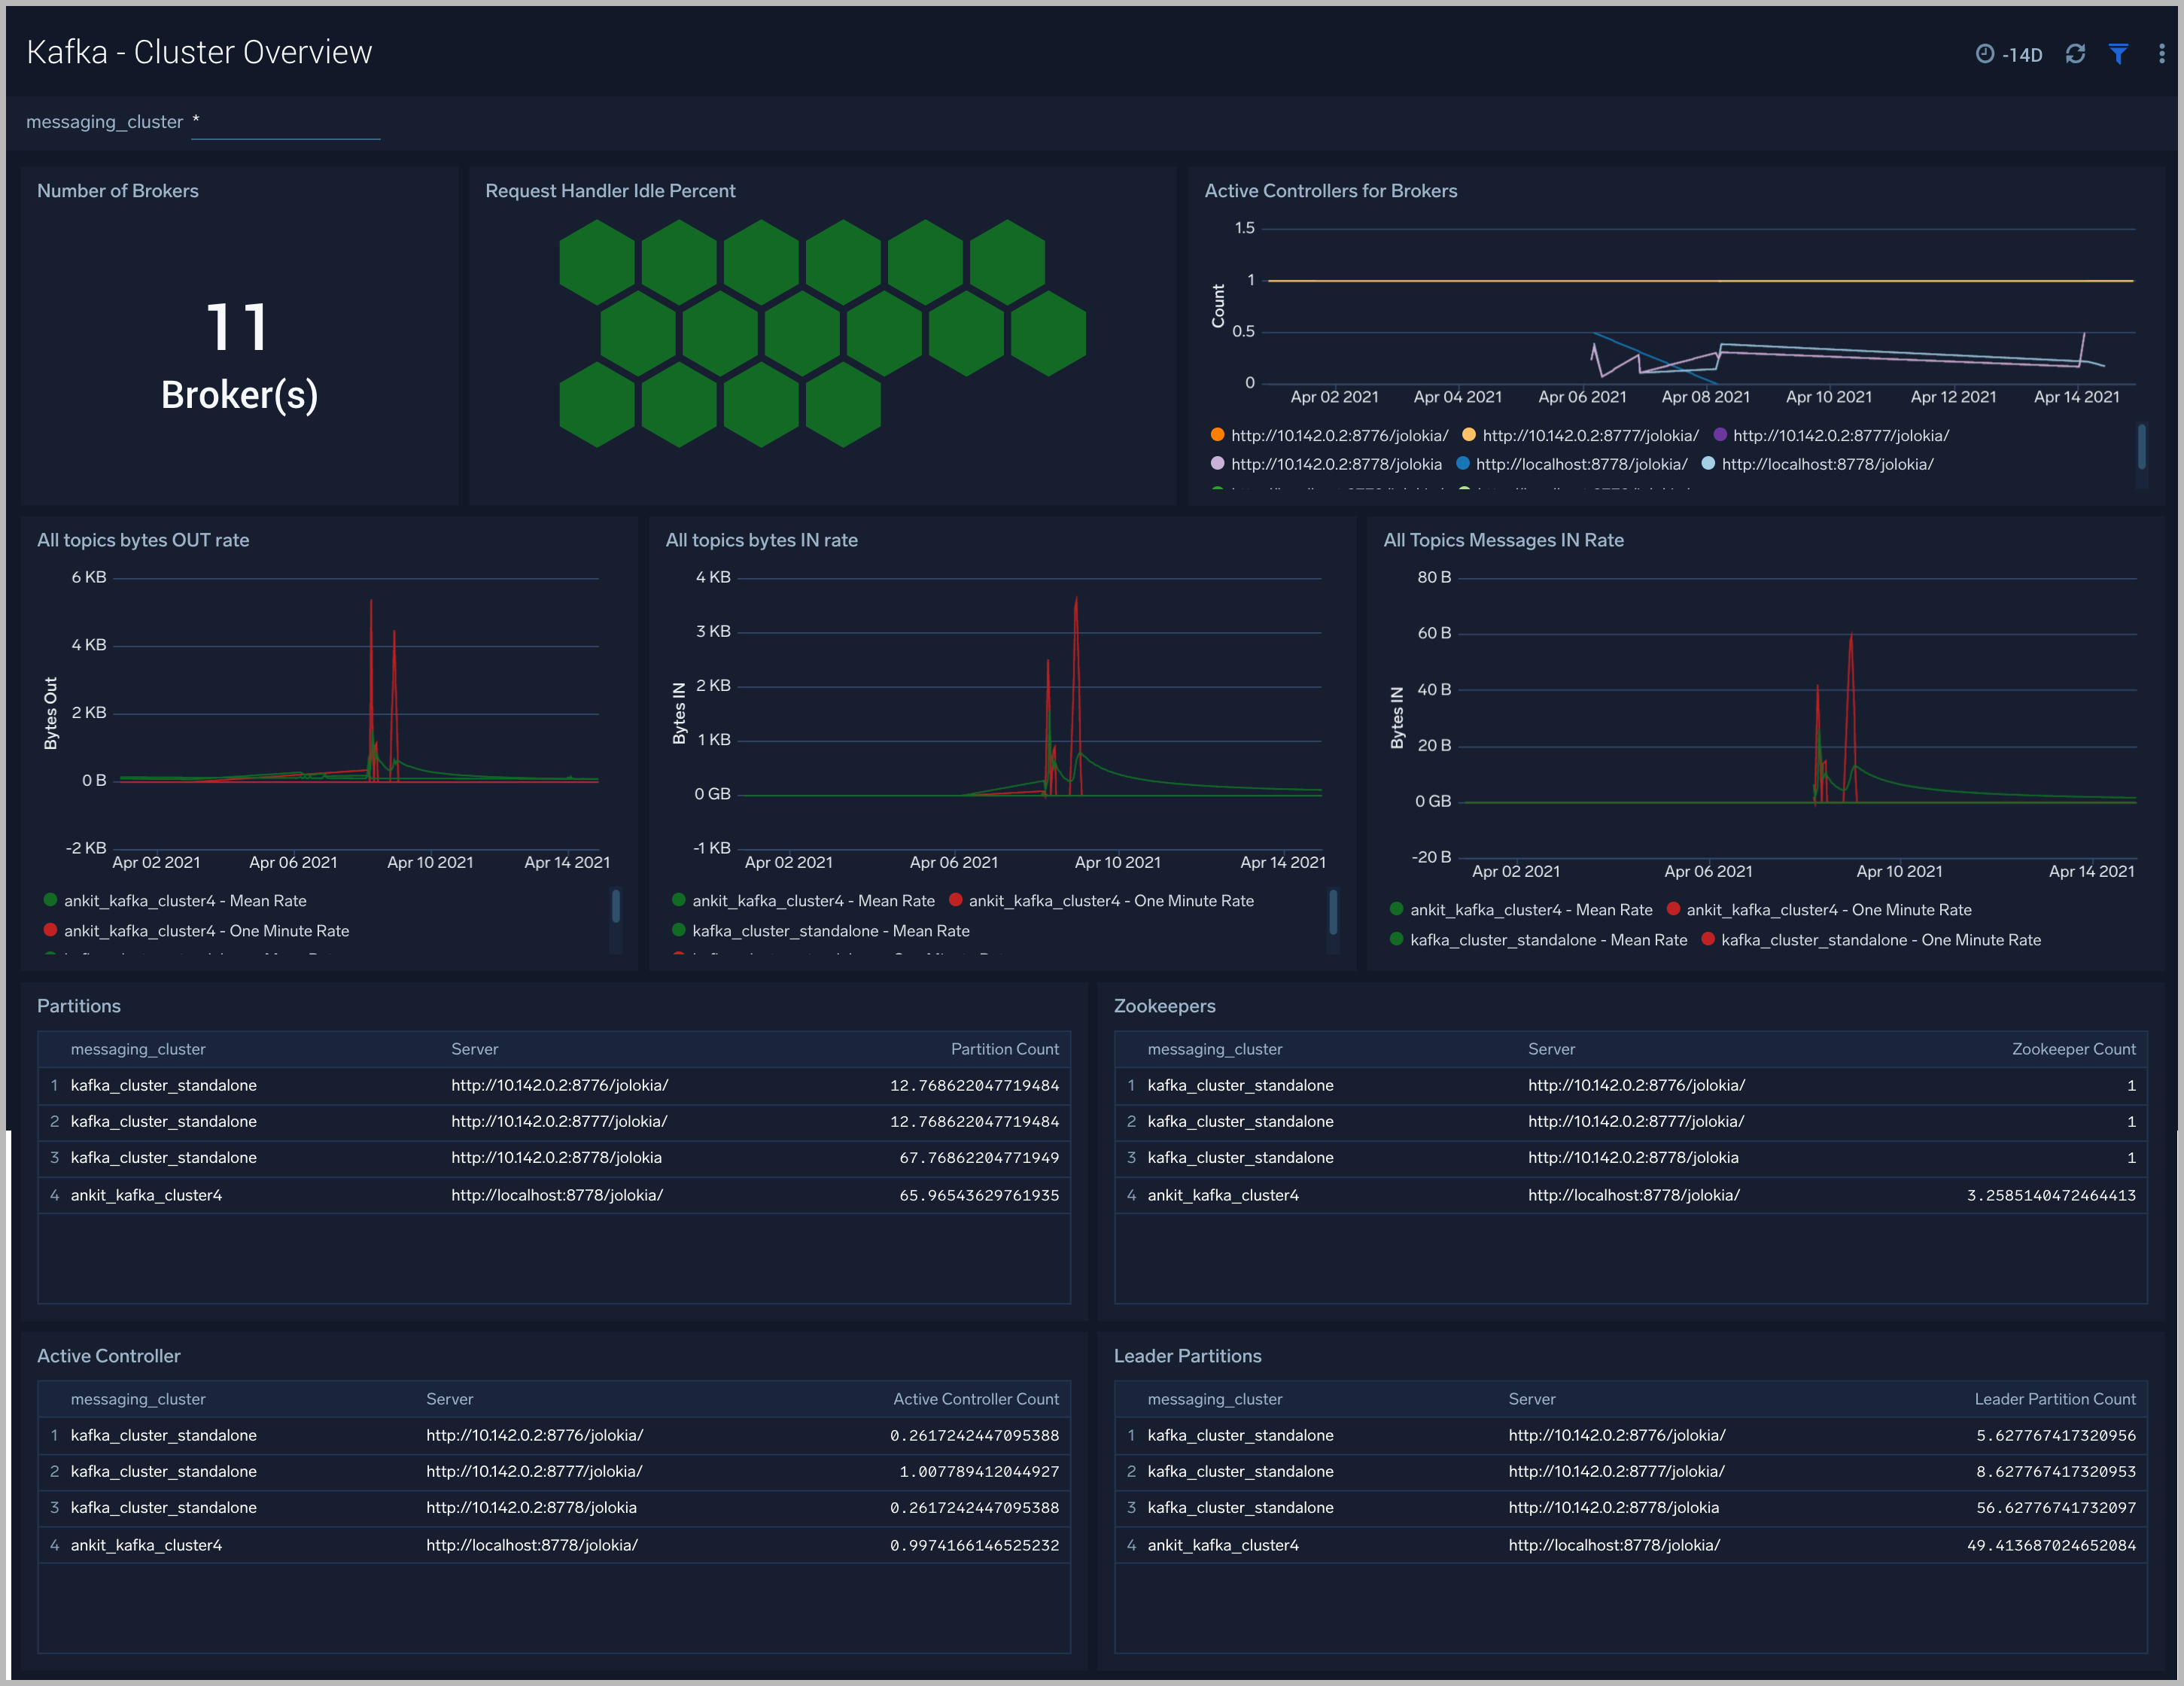
Strimzi Kafka - Cluster Overview
The Strimzi Kafka - Cluster Overview dashboard gives you an at-a-glance view of your Kafka deployment across brokers, controllers, topics, partitions, and zookeepers.
Use this dashboard to:
- Identify when brokers don’t have active controllers
- Analyze trends across Request Handler Idle percentage metrics. Kafka’s request handler threads are responsible for servicing client requests ( read/write disk). If the request handler threads get overloaded, the time taken for requests to complete will be longer. If the request handler idle percent is constantly below 0.2 (20%), it may indicate that your cluster is overloaded and requires more resources.
- Determine the number of leaders, partitions, and zookeepers across each cluster and ensure they match with expectations
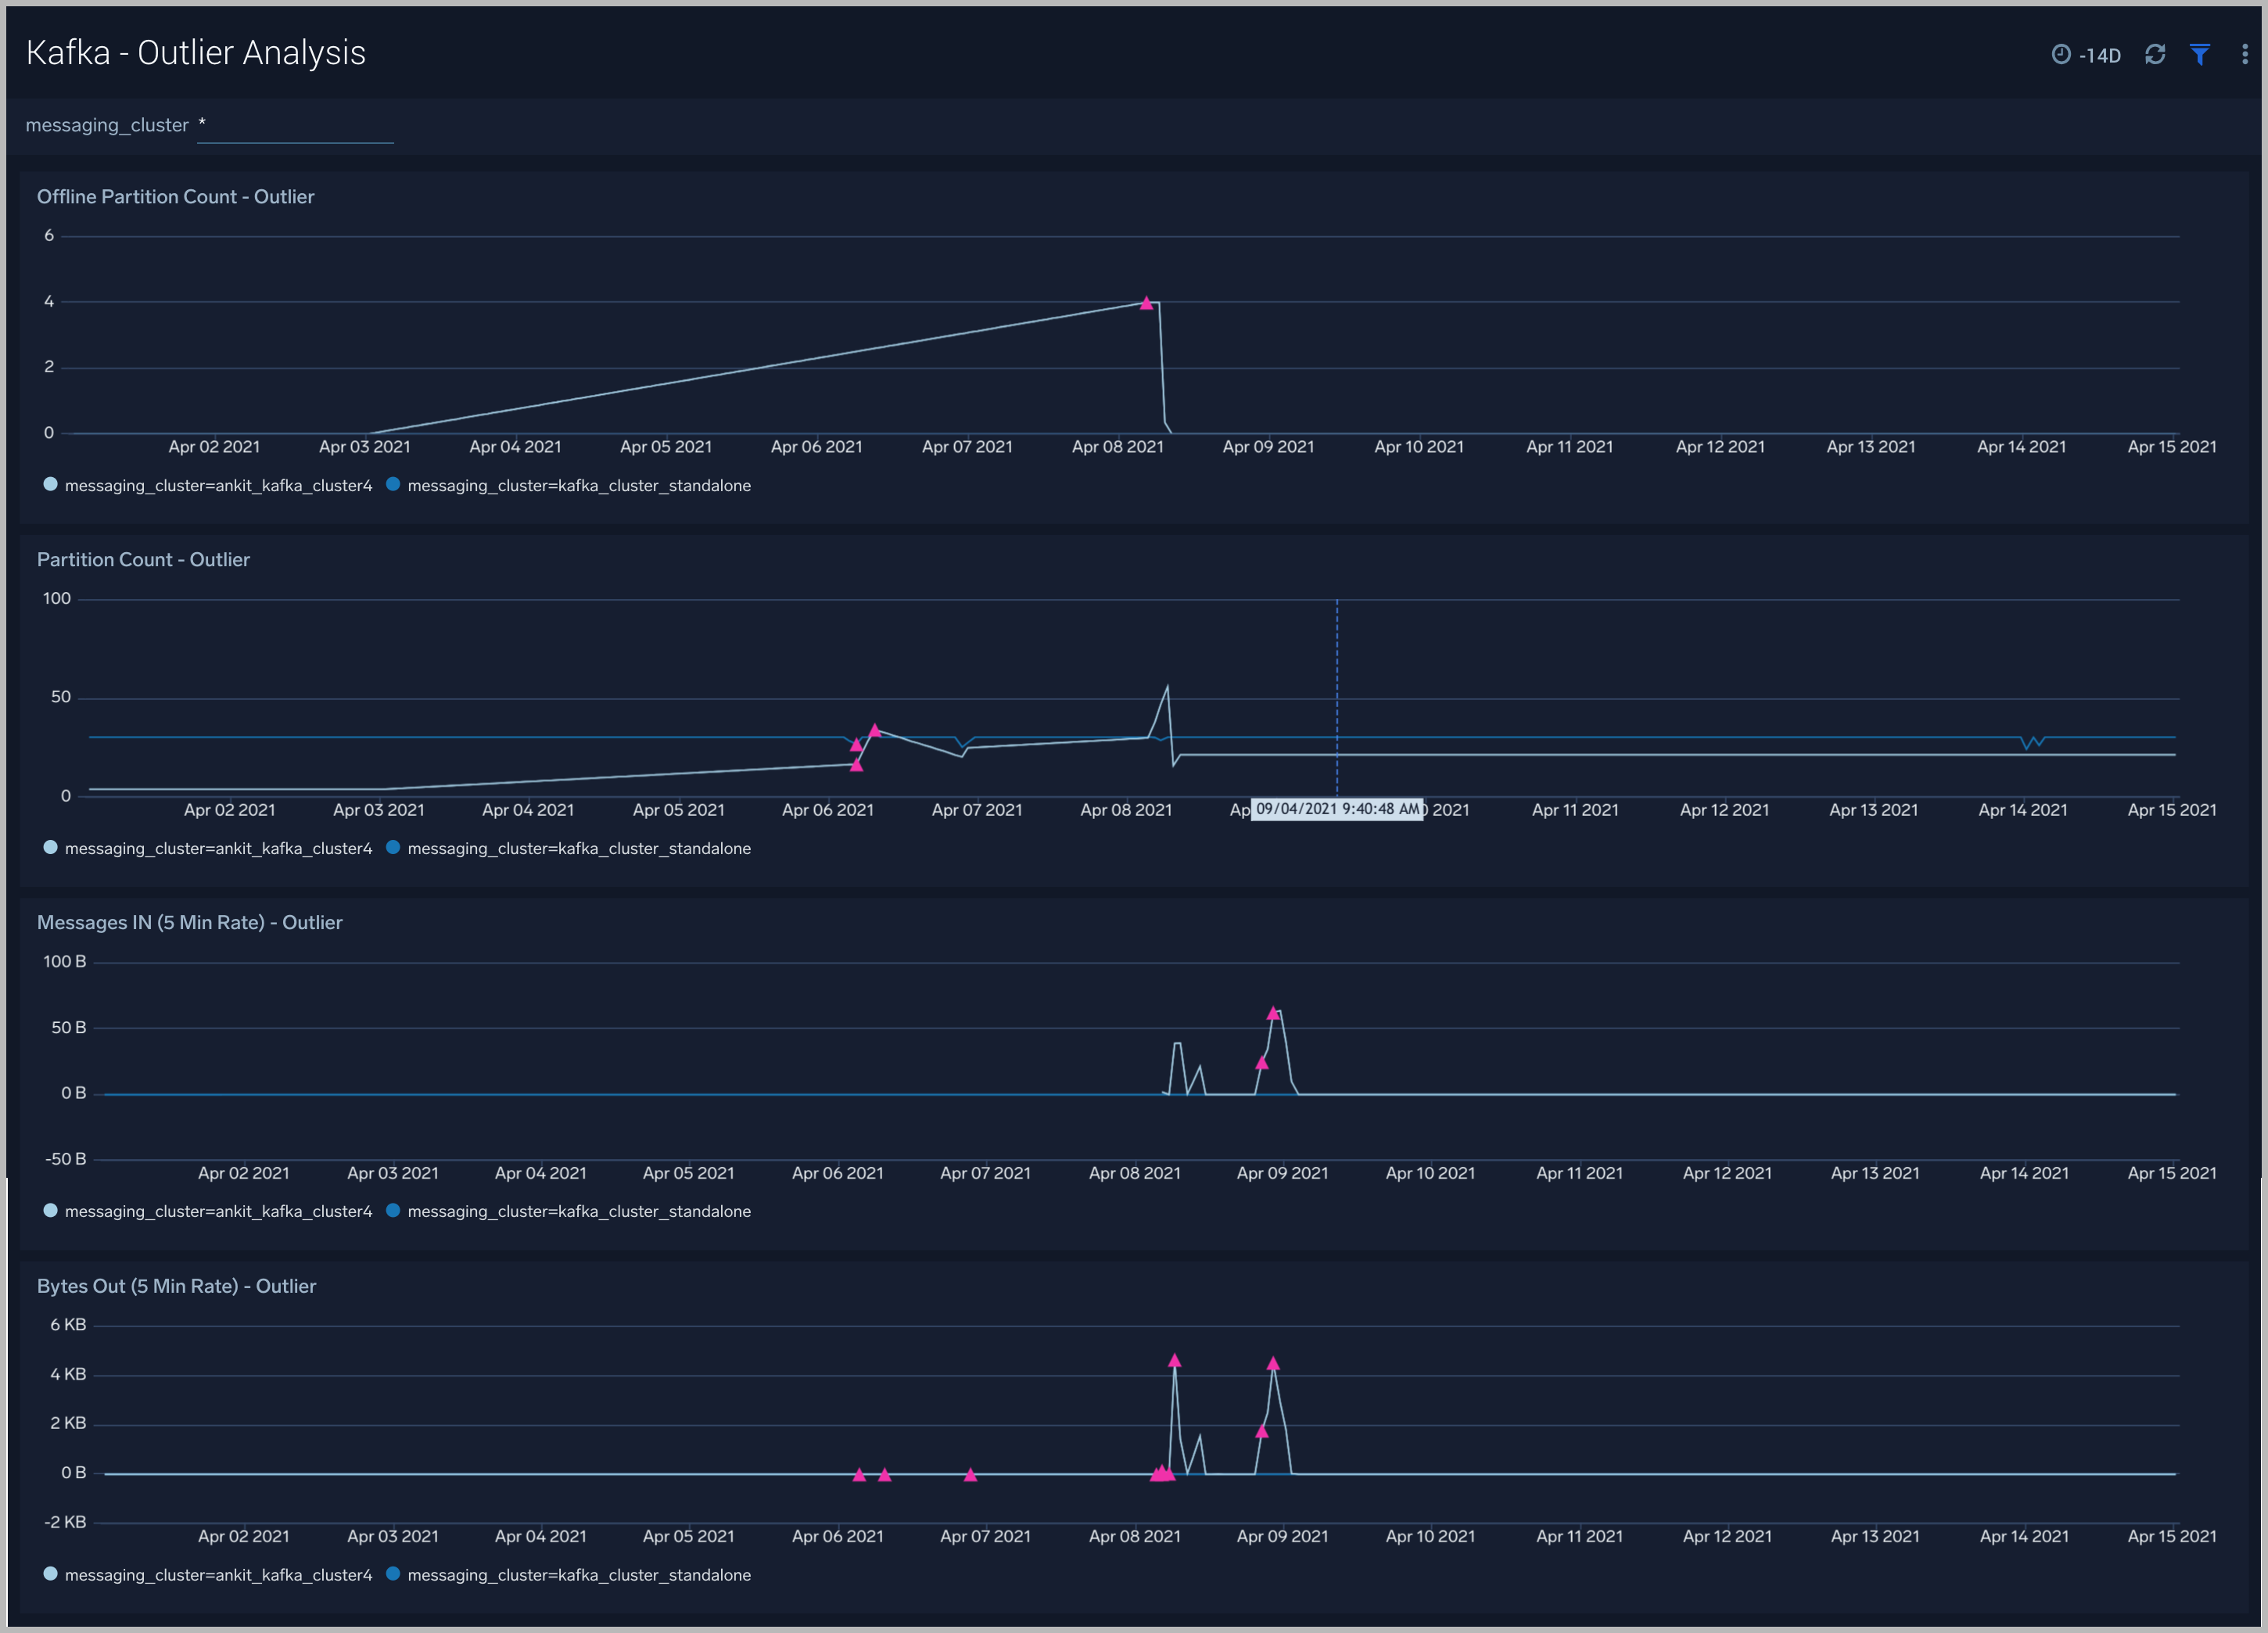
Strimzi Kafka - Outlier Analysis
The Strimzi Kafka - Outlier Analysis dashboard helps you identify outliers for key metrics across your Kafka clusters.
Use this dashboard to:
- To analyze trends and quickly discover outliers across key metrics of your Kafka clusters
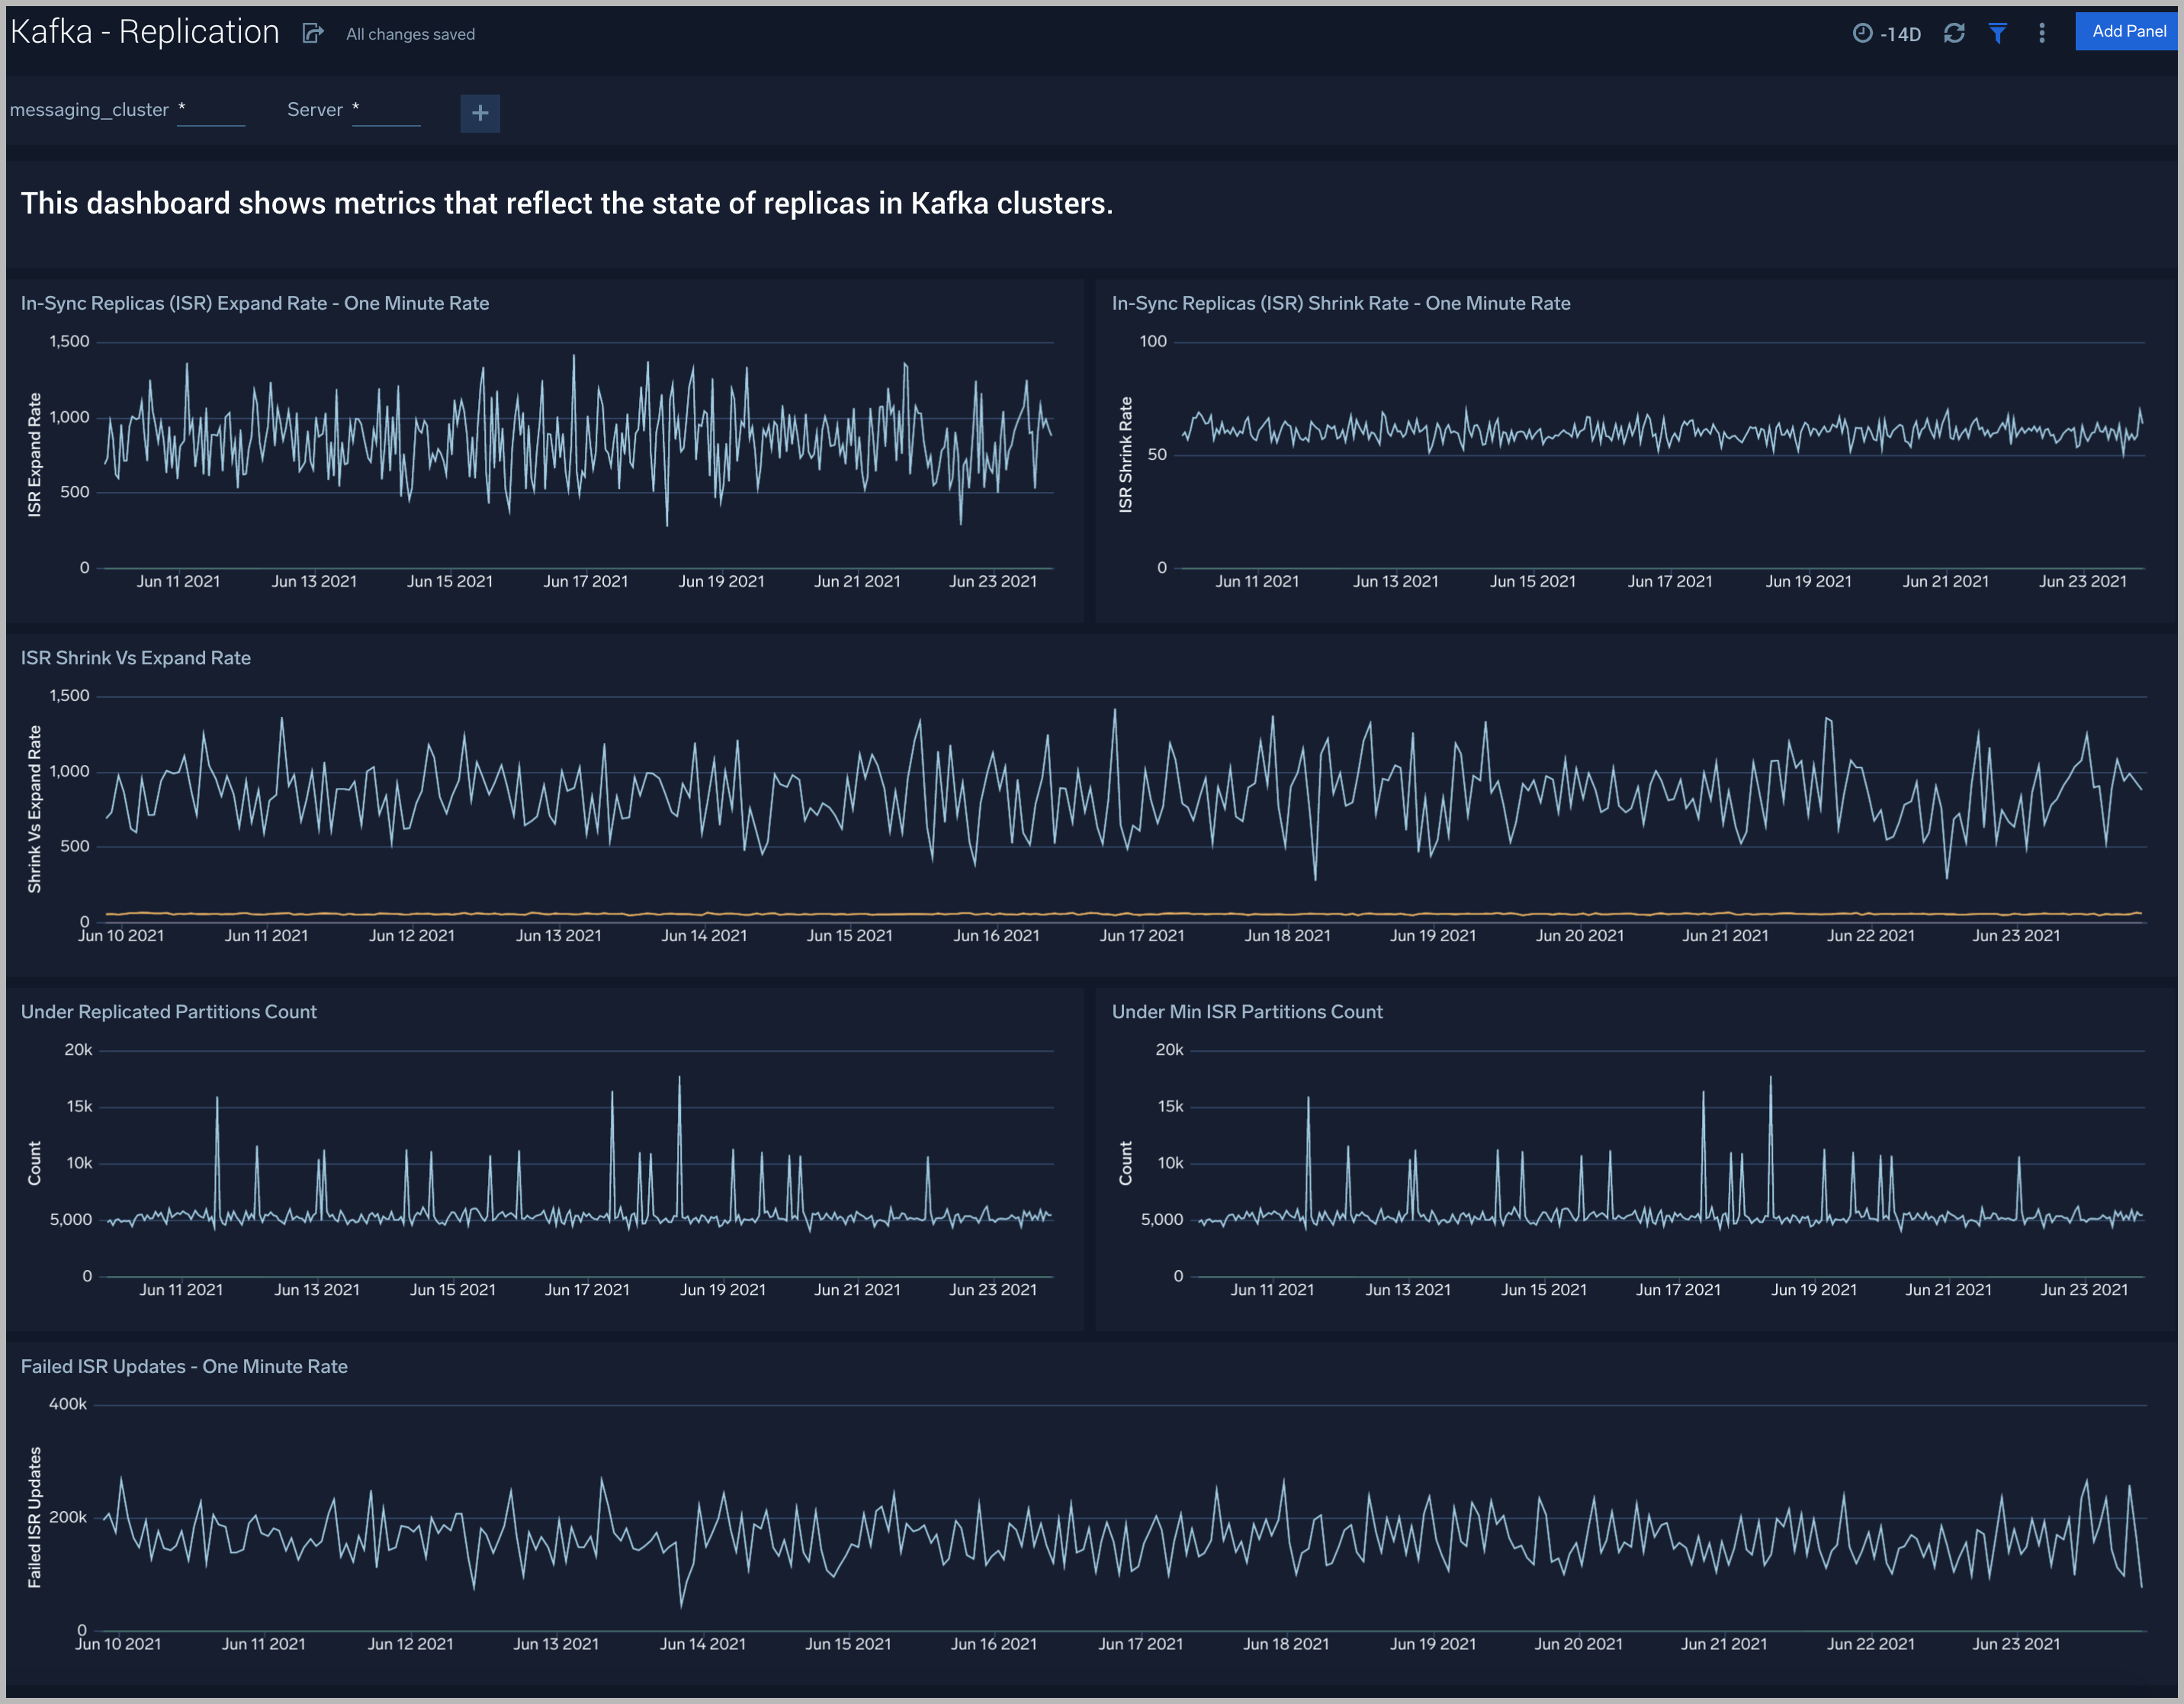
Strimzi Kafka - Replication
The Strimzi Kafka - Replication dashboard helps you understand the state of replicas in your Kafka clusters.
Use this dashboard to monitor the following key metrics:
- In-Sync Replicas (ISR) Expand Rate - The ISR Expand Rate metric displays the one-minute rate of increases in the number of In-Sync Replicas (ISR). ISR expansions occur when a broker comes online, such as when recovering from a failure or adding a new node. This increases the number of in-sync replicas available for each partition on that broker. The expected value for this rate is normally zero.
- In-Sync Replicas (ISR) Shrink Rate - The ISR Shrink Rate metric displays the one-minute rate of decreases in the number of In-Sync Replicas (ISR). ISR shrinks occur when an in-sync broker goes down, as it decreases the number of in-sync replicas available for each partition replica on that broker. The expected value for this rate is normally zero.
- ISR Shrink Vs Expand Rate - If you see a Spike in ISR Shrink followed by ISR Expand Rate, this may be because of nodes that have fallen behind replication, and they may have either recovered or are in the process of recovering now.
- Failed ISR Updates
- Under Replicated Partitions Count
- Under Min ISR Partitions Count -The Under Min ISR Partitions metric displays the number of partitions, where the number of In-Sync Replicas (ISR) is less than the minimum number of in-sync replicas specified. The two most common causes of under-min ISR partitions are that one or more brokers are unresponsive, or the cluster is experiencing performance issues, and one or more brokers are falling behind.
- The expected value for this rate is normally zero.
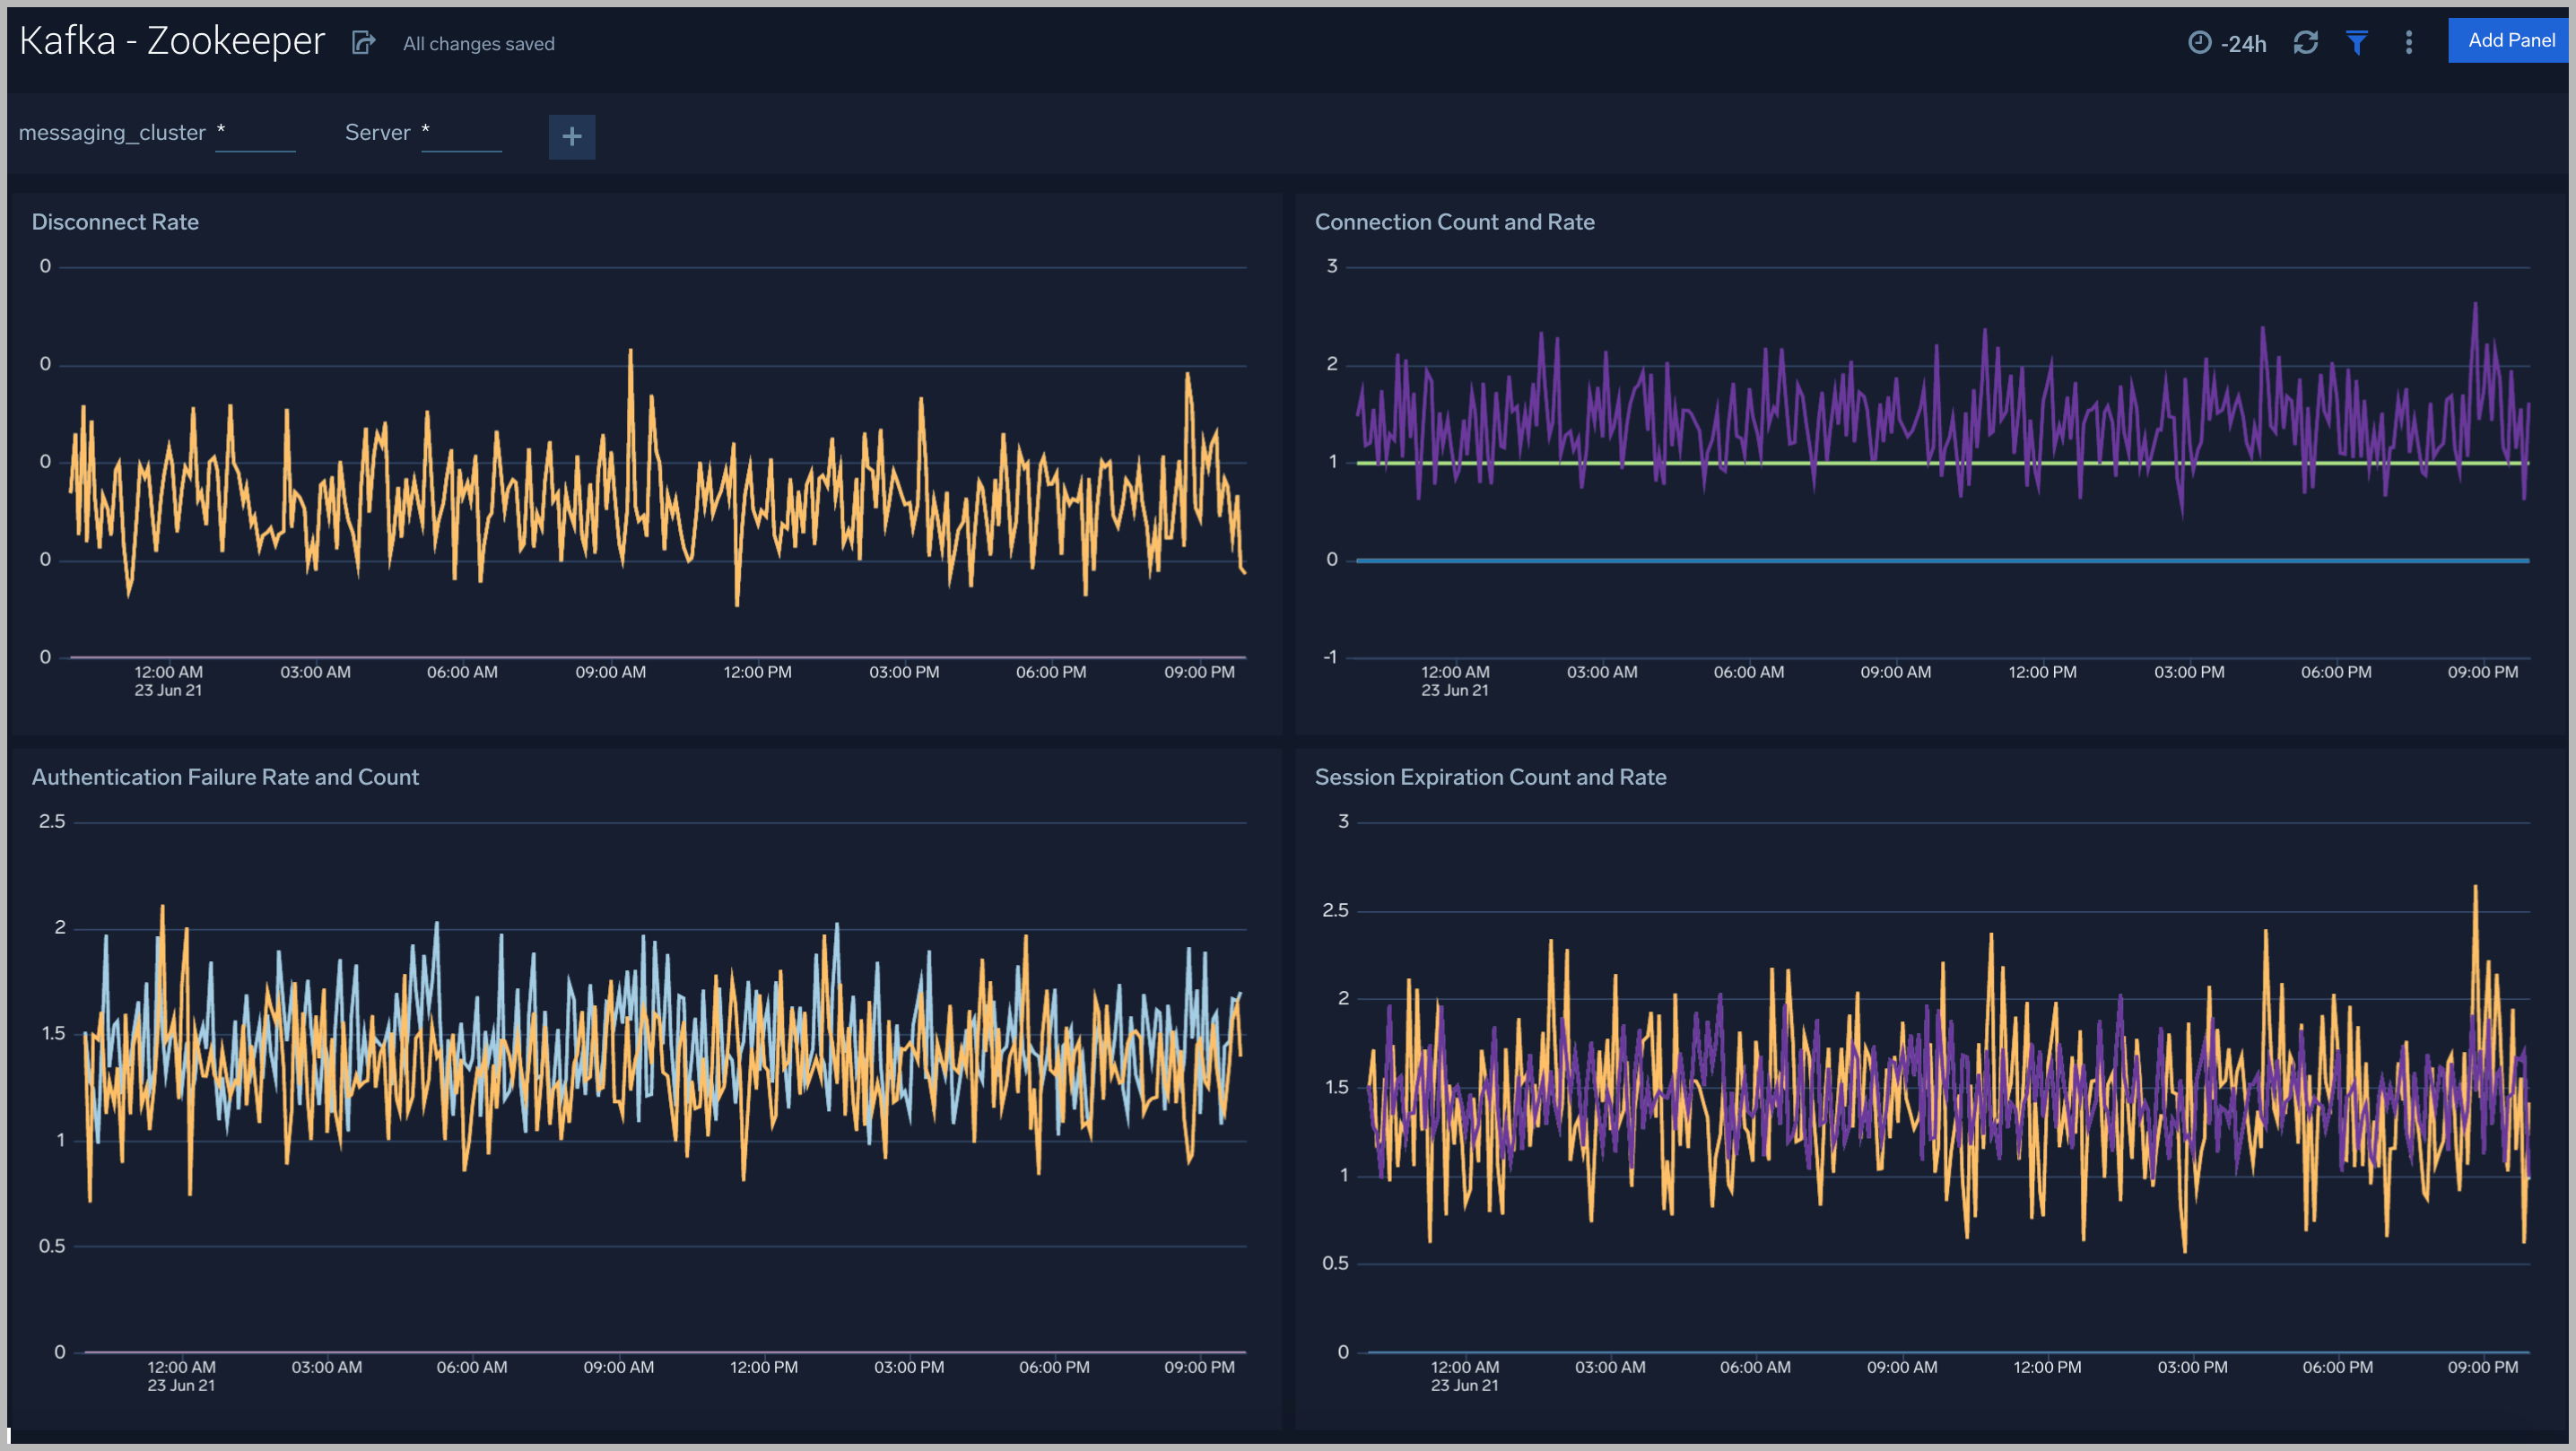
Strimzi Kafka - Zookeeper
The Strimzi Kafka -Zookeeper dashboard provides an at-a-glance view of the state of your partitions, active controllers, leaders, throughput, and network across Kafka brokers and clusters.
Use this dashboard to monitor key Zookeeper metrics such as:
- Zookeeper disconnect rate - This metric indicates if a Zookeeper node has lost its connection to a Kafka broker.
- Authentication Failures - This metric indicates a Kafka Broker is unable to connect to its Zookeeper node.
- Session Expiration - When a Kafka broker - Zookeeper node session expires, leader changes can occur, and the broker can be assigned a new controller. If this metric is increasing, we recommend you:
- Check the health of your network.
- Check for garbage collection issues and tune your JVMs accordingly.
- Connection Rate.
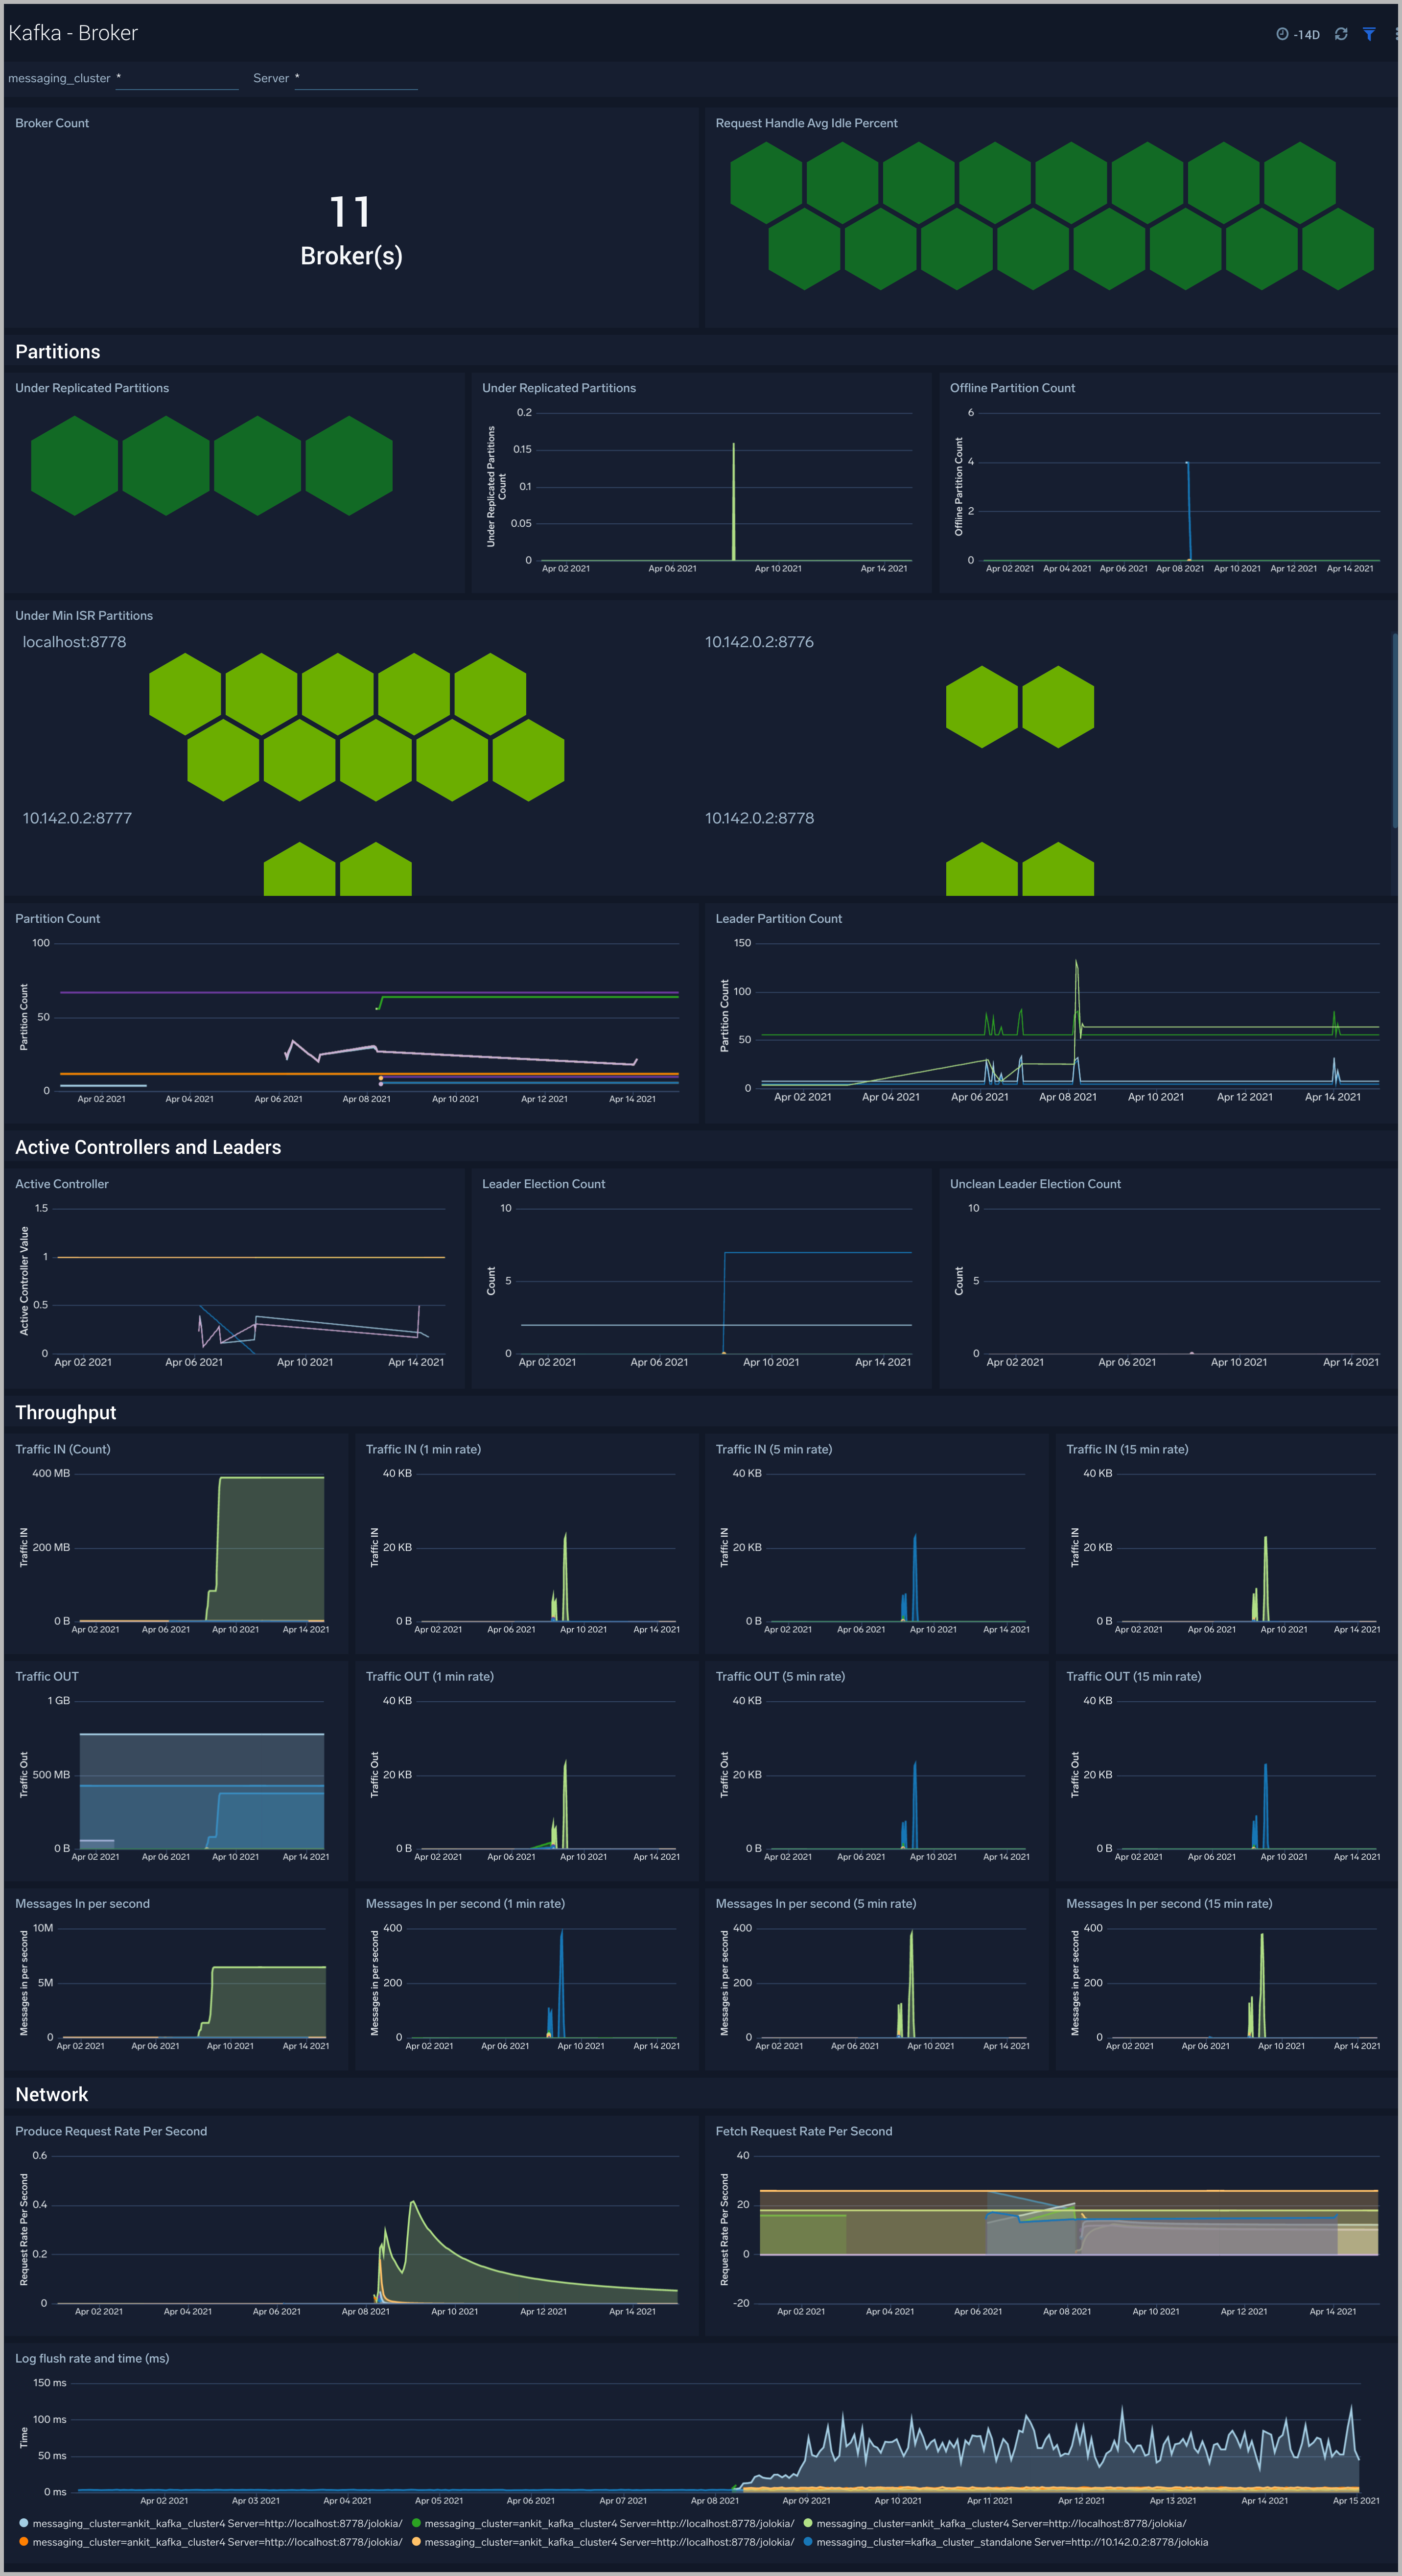
Strimzi Kafka - Broker
The Strimzi Kafka - Broker dashboard provides an at-a-glance view of the state of your partitions, active controllers, leaders, throughput, and network across Kafka brokers and clusters.
Use this dashboard to:
- Monitor Under Replicated and offline partitions to quickly identify if a Kafka broker is down or overutilized.
- Monitor Unclean Leader Election count metrics - this metric shows the number of failures to elect a suitable leader per second. Unclean leader elections are caused when there are no available in-sync replicas for a partition (either due to network issues, lag causing the broker to fall behind, or brokers going down completely), so an out-of-sync replica is the only option for the leader. When an out-of-sync replica is elected leader, all data not replicated from the previous leader is lost forever.
- Monitor producer and fetch request rates.
- Monitor Log flush rate to determine the rate at which log data is written to disk
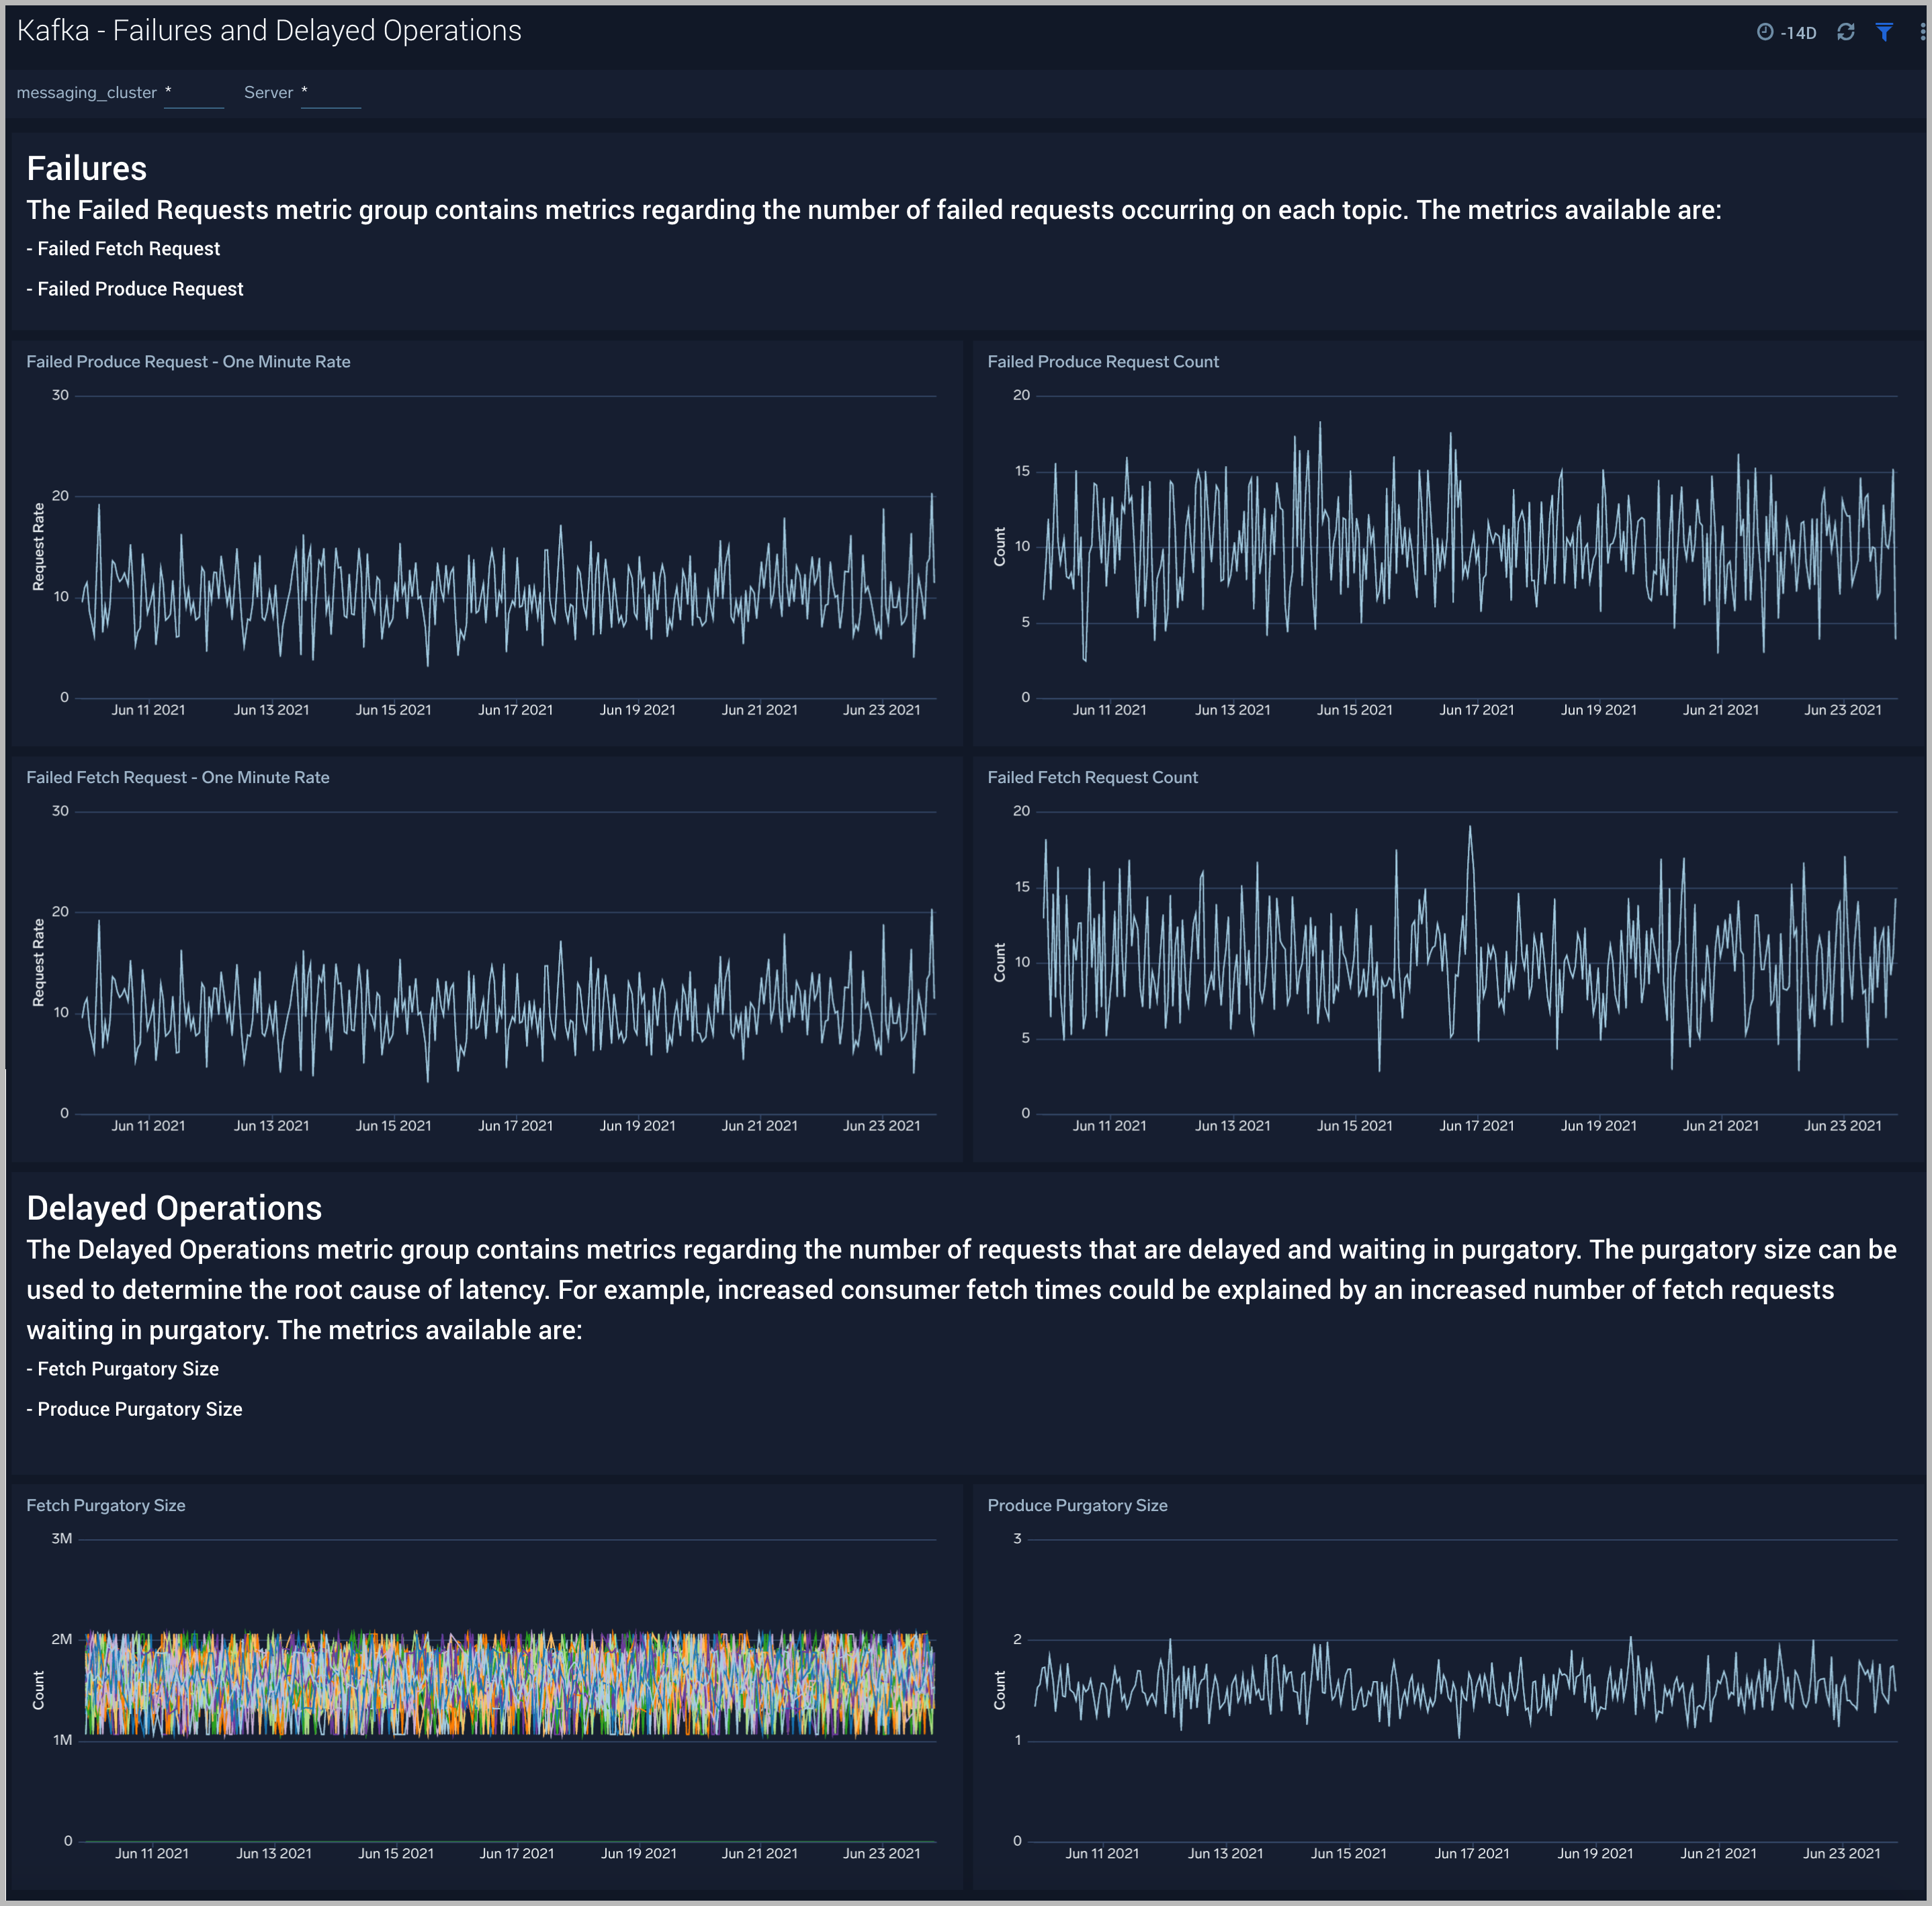
Strimzi Kafka - Failures and Delayed Operations
The Strimzi Kafka - Failures and Delayed Operations dashboard gives you insight into all failures and delayed operations associated with your Kafka clusters.
Use this dashboard to:
- Analyze failed produce requests - A failed produce request occurs when a problem is encountered when processing a produce request. This could be for a variety of reasons, however, some common reasons are:
- The destination topic doesn’t exist (if auto-create is enabled, then subsequent messages should be sent successfully).
- The message is too large.
- The producer is using request.required.acks=all or –1, and fewer than the required number of acknowledgements are received.
- Analyze failed Fetch Request - A failed fetch request occurs when a problem is encountered while processing a fetch request. This could be for a variety of reasons, but the most common cause is consumer requests timing out.
- Monitor delayed Operations metrics - This contains metrics regarding the number of requests that are delayed and waiting in purgatory. The purgatory size metric can be used to determine the root cause of latency. For example, increased consumer fetch times could be explained by an increased number of fetch requests waiting in purgatory. Available metrics are:
- Fetch Purgatory Size - The Fetch Purgatory Size metric shows the number of fetch requests currently waiting in purgatory. Fetch requests are added to purgatory if there is not enough data to fulfil the request (determined by fetch.min.bytes in the consumer configuration) and the requests wait in purgatory until the time specified by fetch.wait.max.ms is reached, or enough data becomes available.
- Produce Purgatory Size - The Produce Purgatory Size metric shows the number of produce requests currently waiting in purgatory. Produce requests are added to purgatory if request.required.acks is set to -1 or all, and the requests wait in purgatory until the partition leader receives an acknowledgement from all its followers. If the purgatory size metric keeps growing, some partition replicas may be overloaded. If this is the case, you can choose to increase the capacity of your cluster or decrease the amount of produce requests being generated.
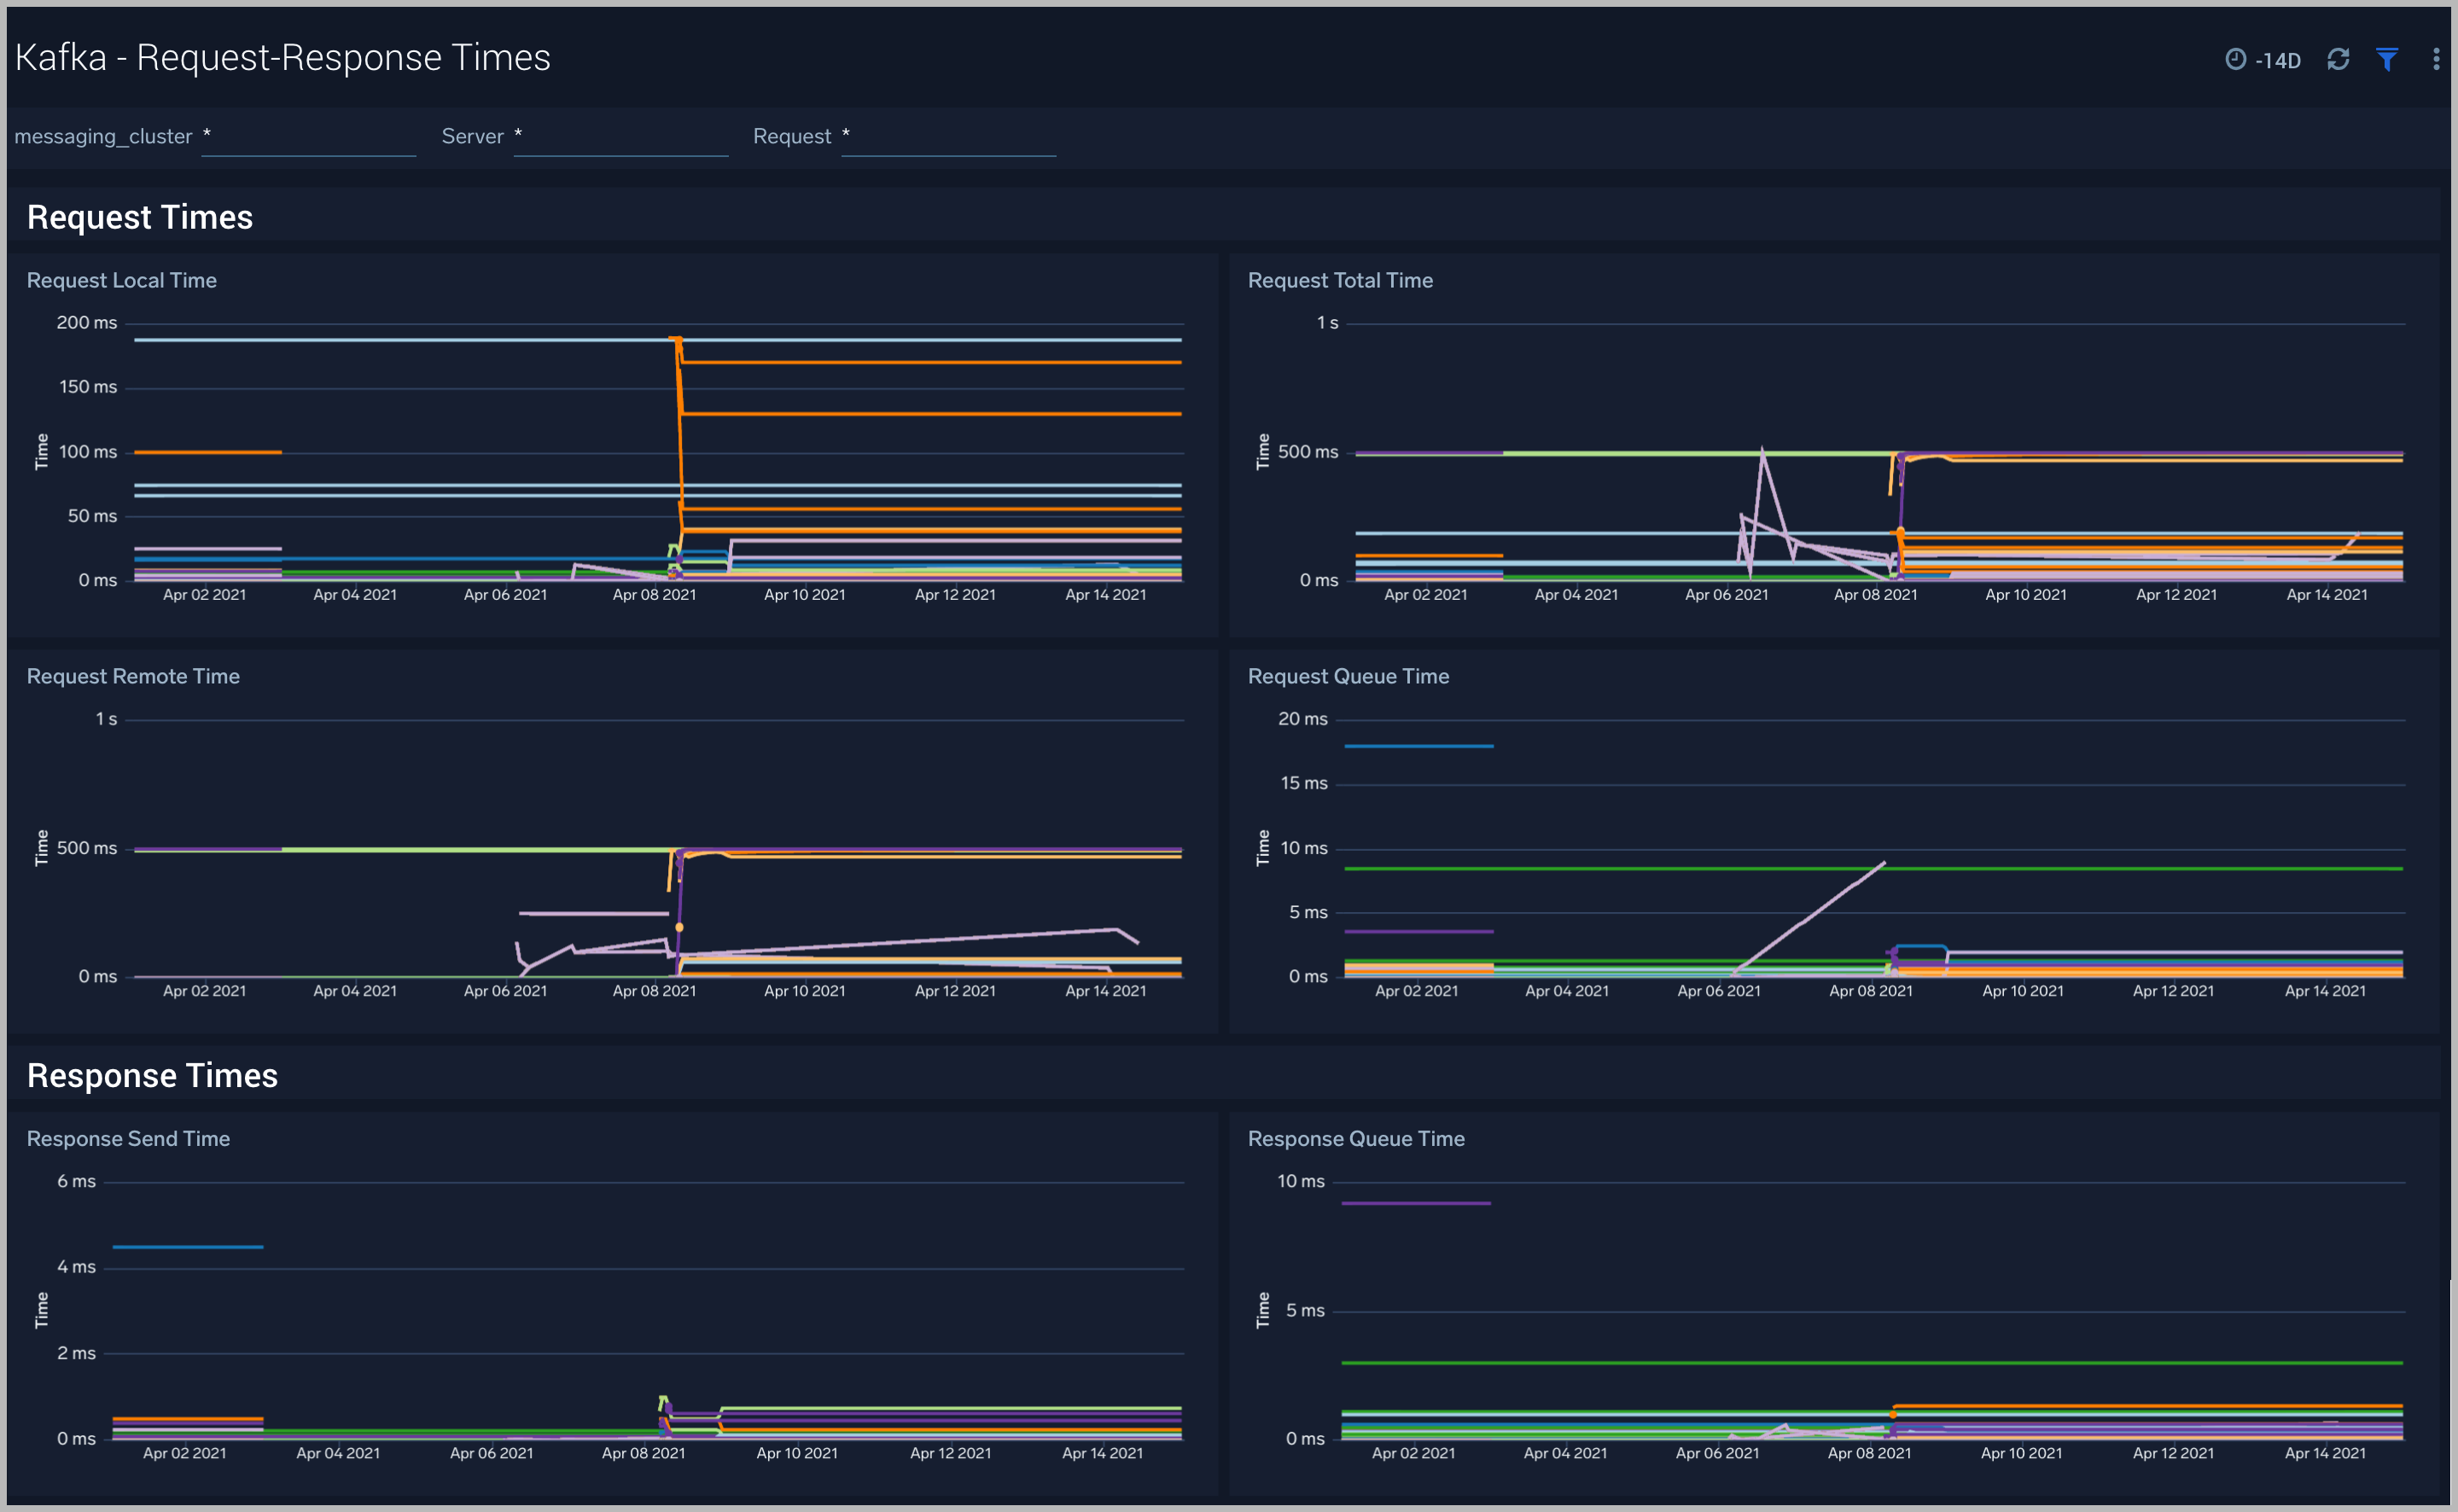
Strimzi Kafka - Request-Response Times
The Strimzi Kafka - Request-Response Times dashboard helps you get insight into key request and response latencies of your Kafka cluster.
Use this dashboard to:
- Monitor request time metrics - The Request Metrics metric group contains information regarding different types of requests to and from the cluster. Important request metrics to monitor:
- Fetch Consumer Request Total Time - The Fetch Consumer Request Total Time metric shows the maximum and mean amount of time taken for processing, and the number of requests from consumers to get new data. Reasons for increased time taken could be: increased load on the node (creating processing delays), or perhaps requests are being held in purgatory for a long time (determined by fetch.min.bytes and fetch.wait.max.ms metrics).
- Fetch Follower Request Total Time - The Fetch Follower Request Total Time metric displays the maximum and mean amount of time taken while processing, and the number of requests to get new data from Kafka brokers that are followers of a partition. Common causes of increased time taken are increased load on the node, causing delays in processing requests, or that some partition replicas may be overloaded or temporarily unavailable.
- Produce Request Total Time- The Produce Request Total Time metric displays the maximum and mean amount of time taken for processing, and the number of requests from producers to send data. Some reasons for increased time taken could be: increased load on the node causing delays in processing the requests, or perhaps requests are being held in purgatory for a long time (if the
requests.required.acksmetrics is equal to '1' or all).
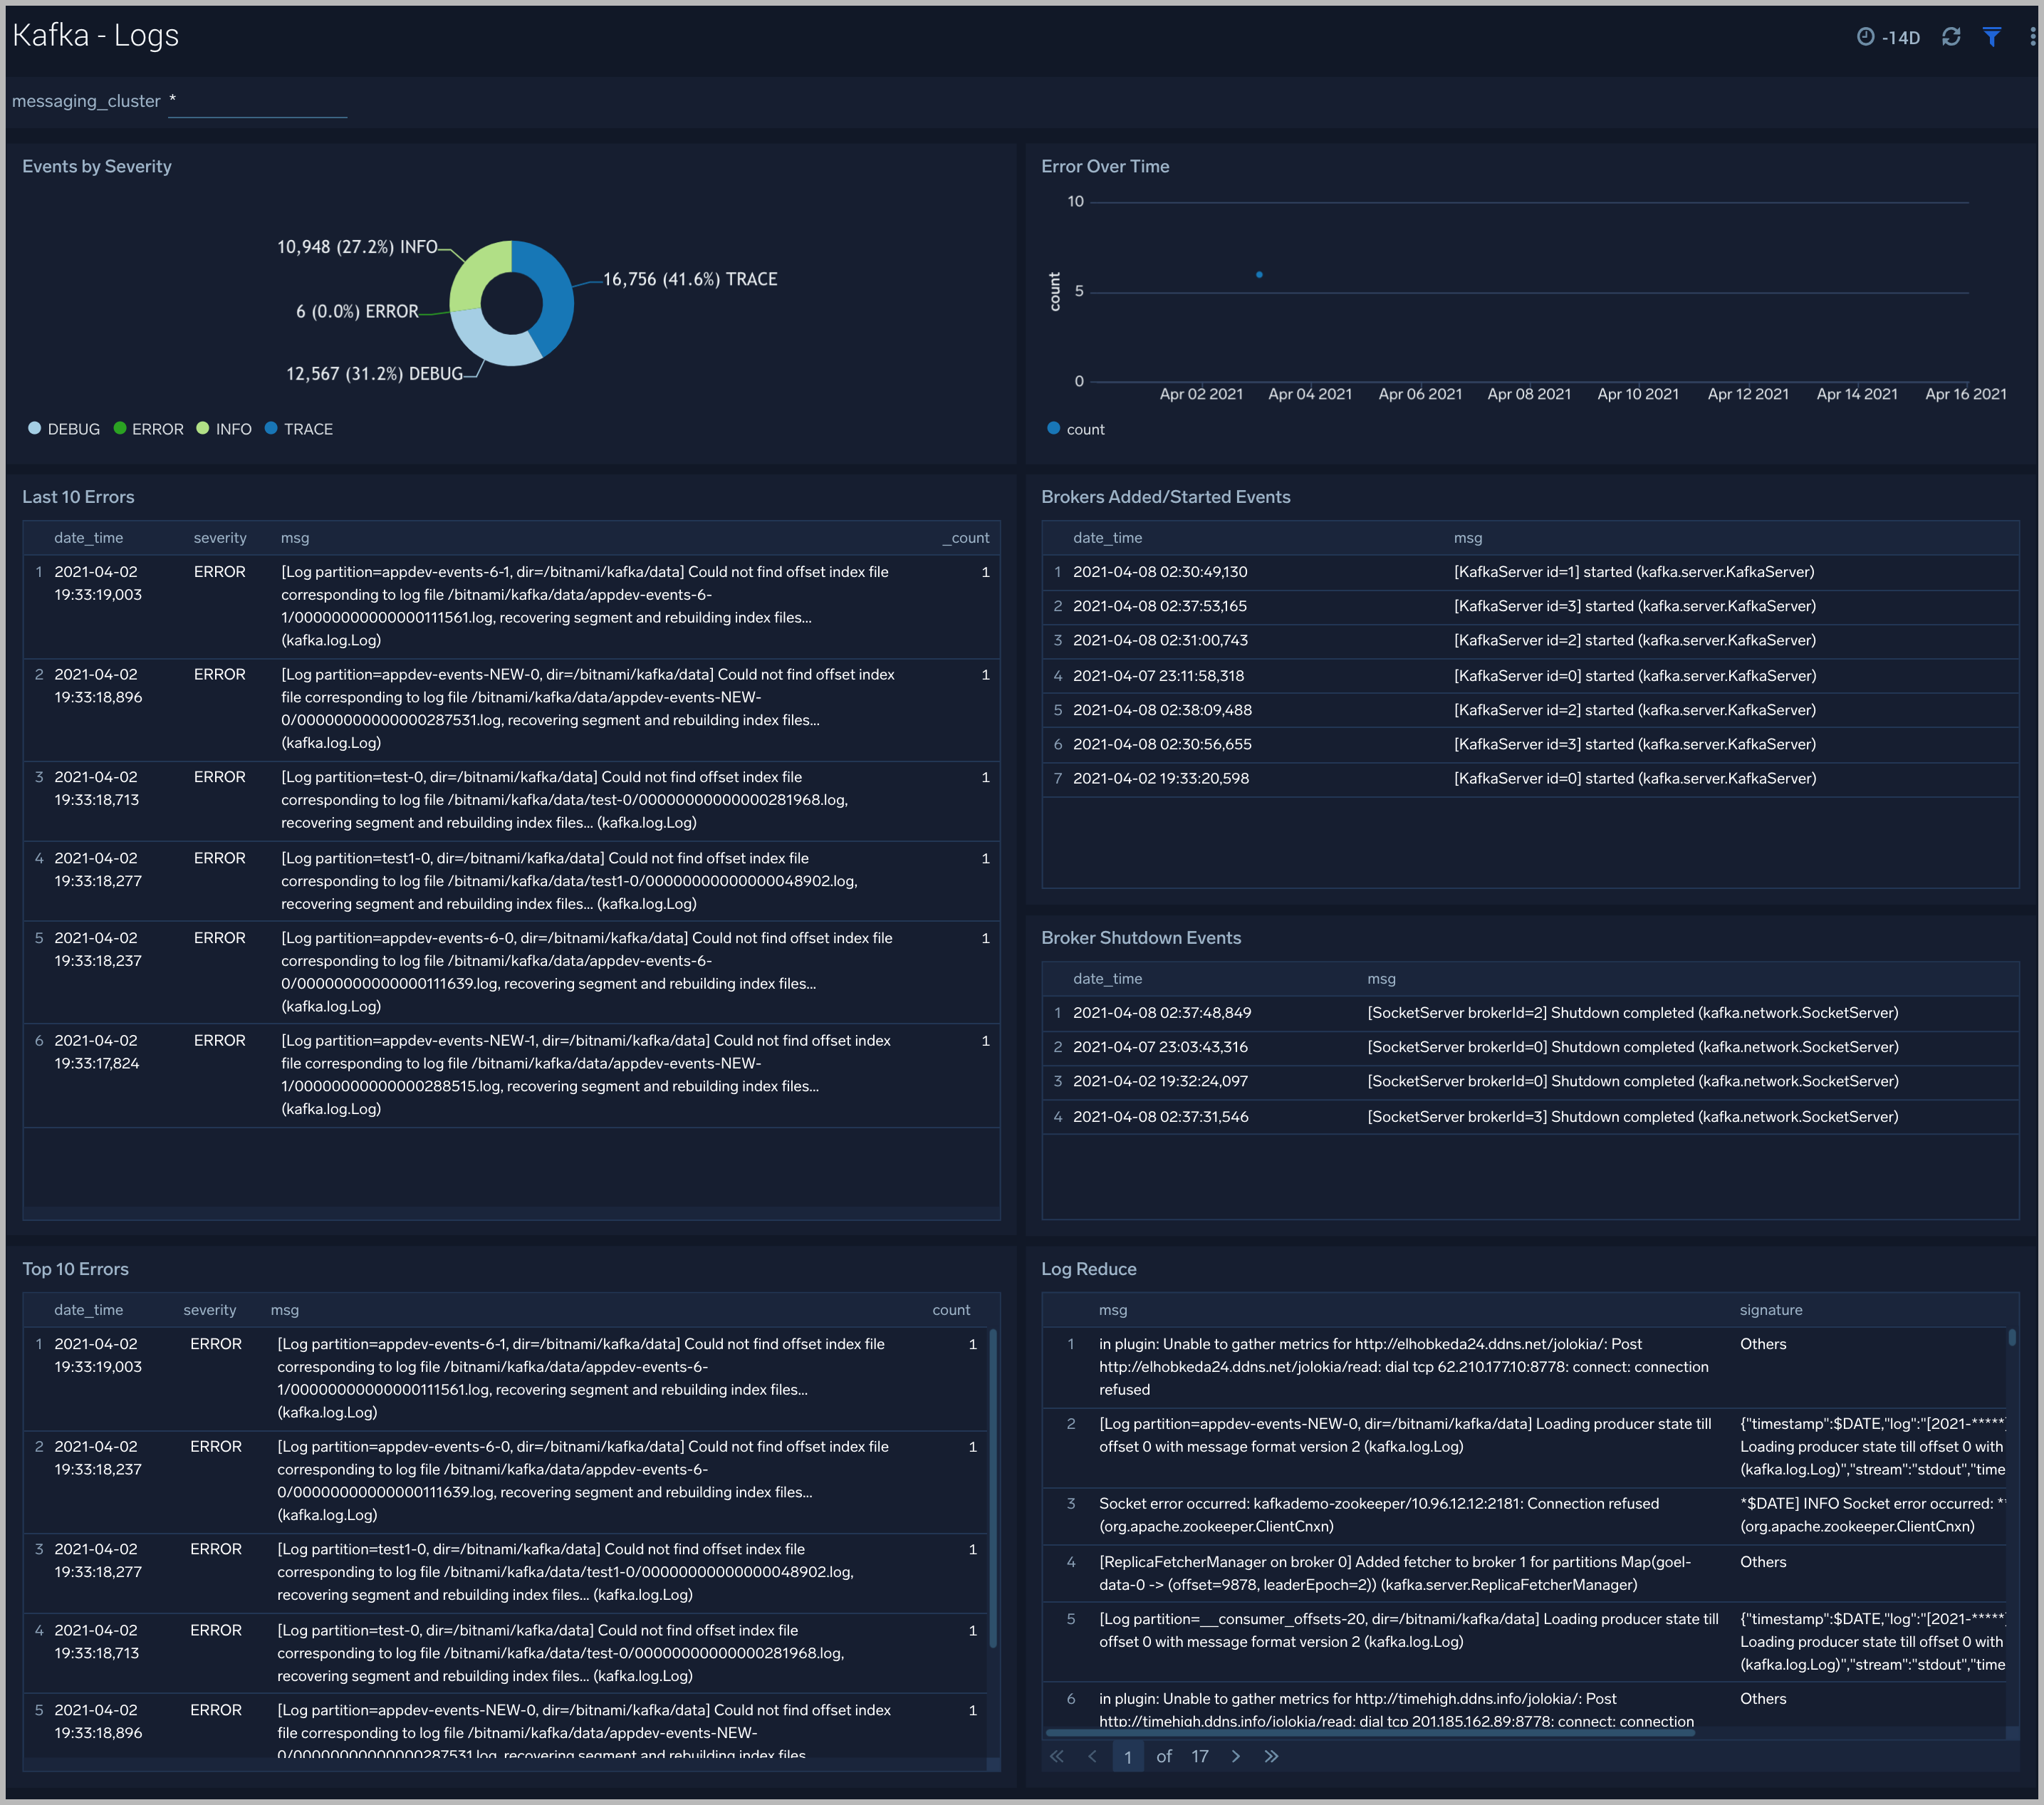
Strimzi Kafka - Logs
This dashboard helps you quickly analyze your Kafka error logs across all clusters.
Use this dashboard to:
- Identify critical events in your Kafka broker and controller logs.
- Examine trends to detect spikes in Error or Fatal events.
- Monitor Broker added/started and shutdown events in your cluster.
- Quickly determine patterns across all logs in a given Kafka cluster.
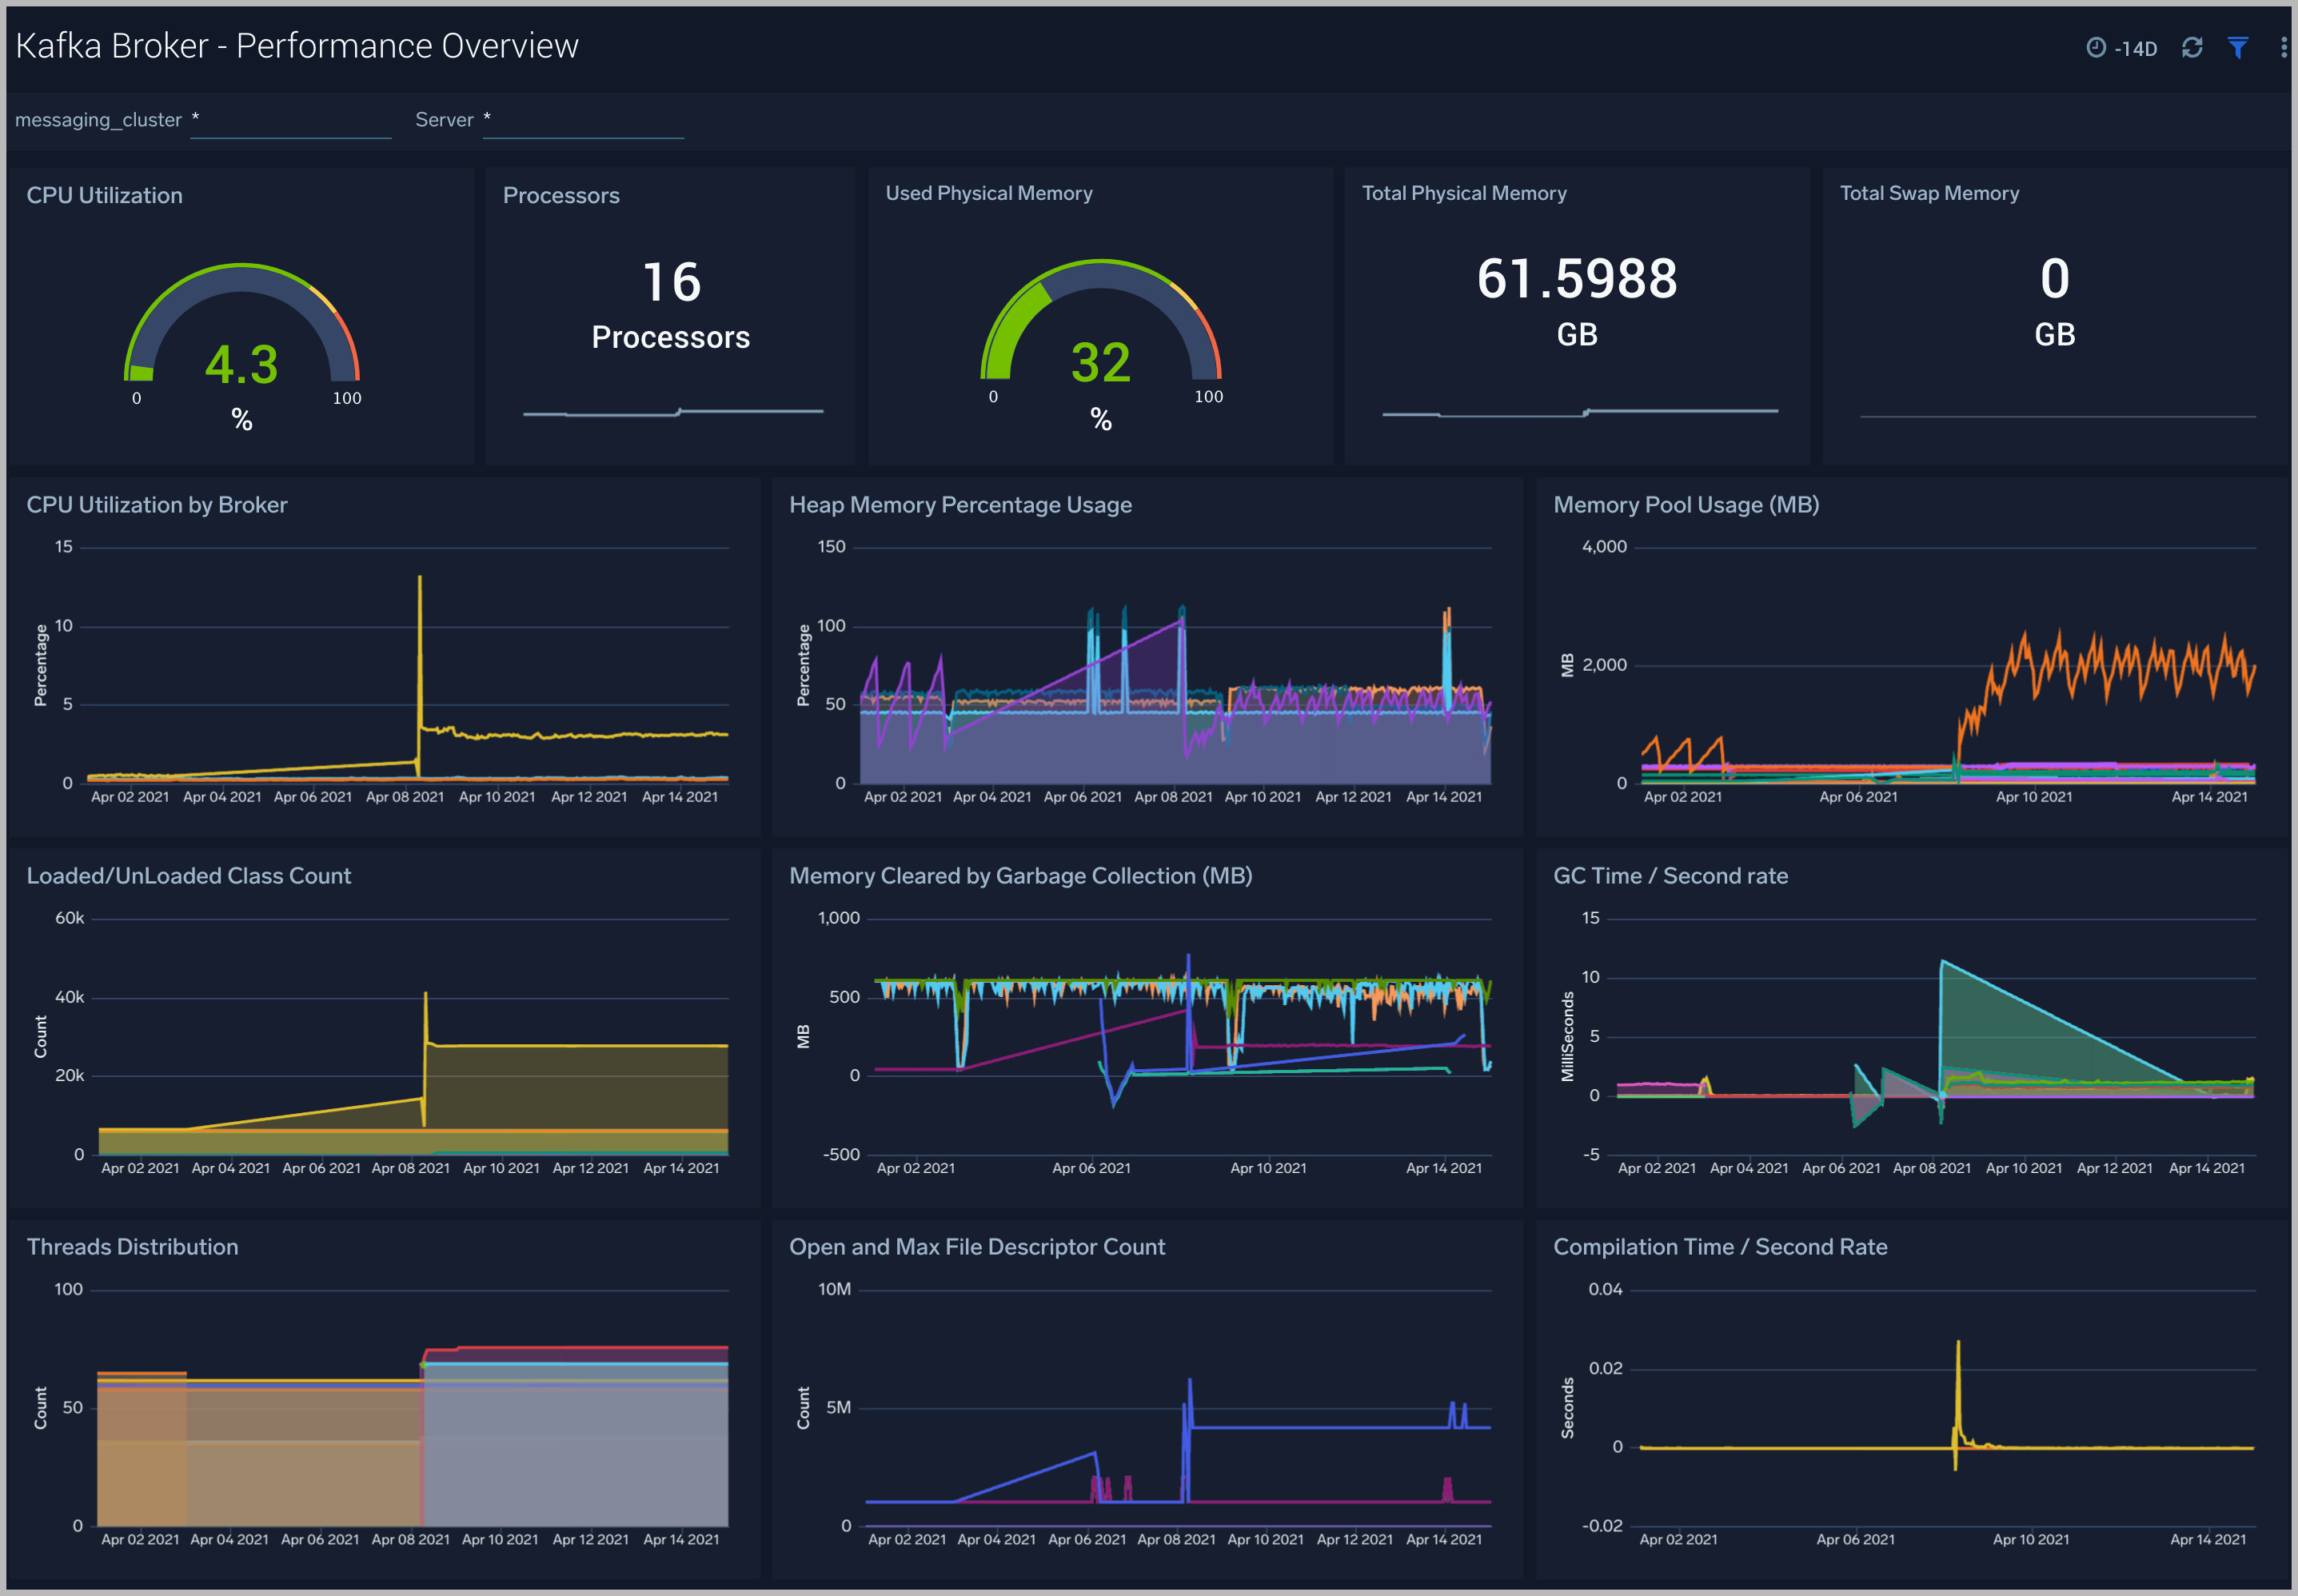
Kafka Broker - Performance Overview
The Kafka Broker - Performance Overview dashboards provide you at-a-glance view of the performance and resource utilization of your Kafka brokers and their JVMs.
Use this dashboard to:
- Monitor the number of open file descriptors. If the number of open file descriptors reaches the maximum file descriptor, it can cause an IOException error
- Get insight into Garbage collection and its impact on CPU usage and memory
- Examine how threads are distributed
- Understand the behavior of the class count. If class count keeps increasing, you may have a problem with the same classes loaded by multiple classloaders.
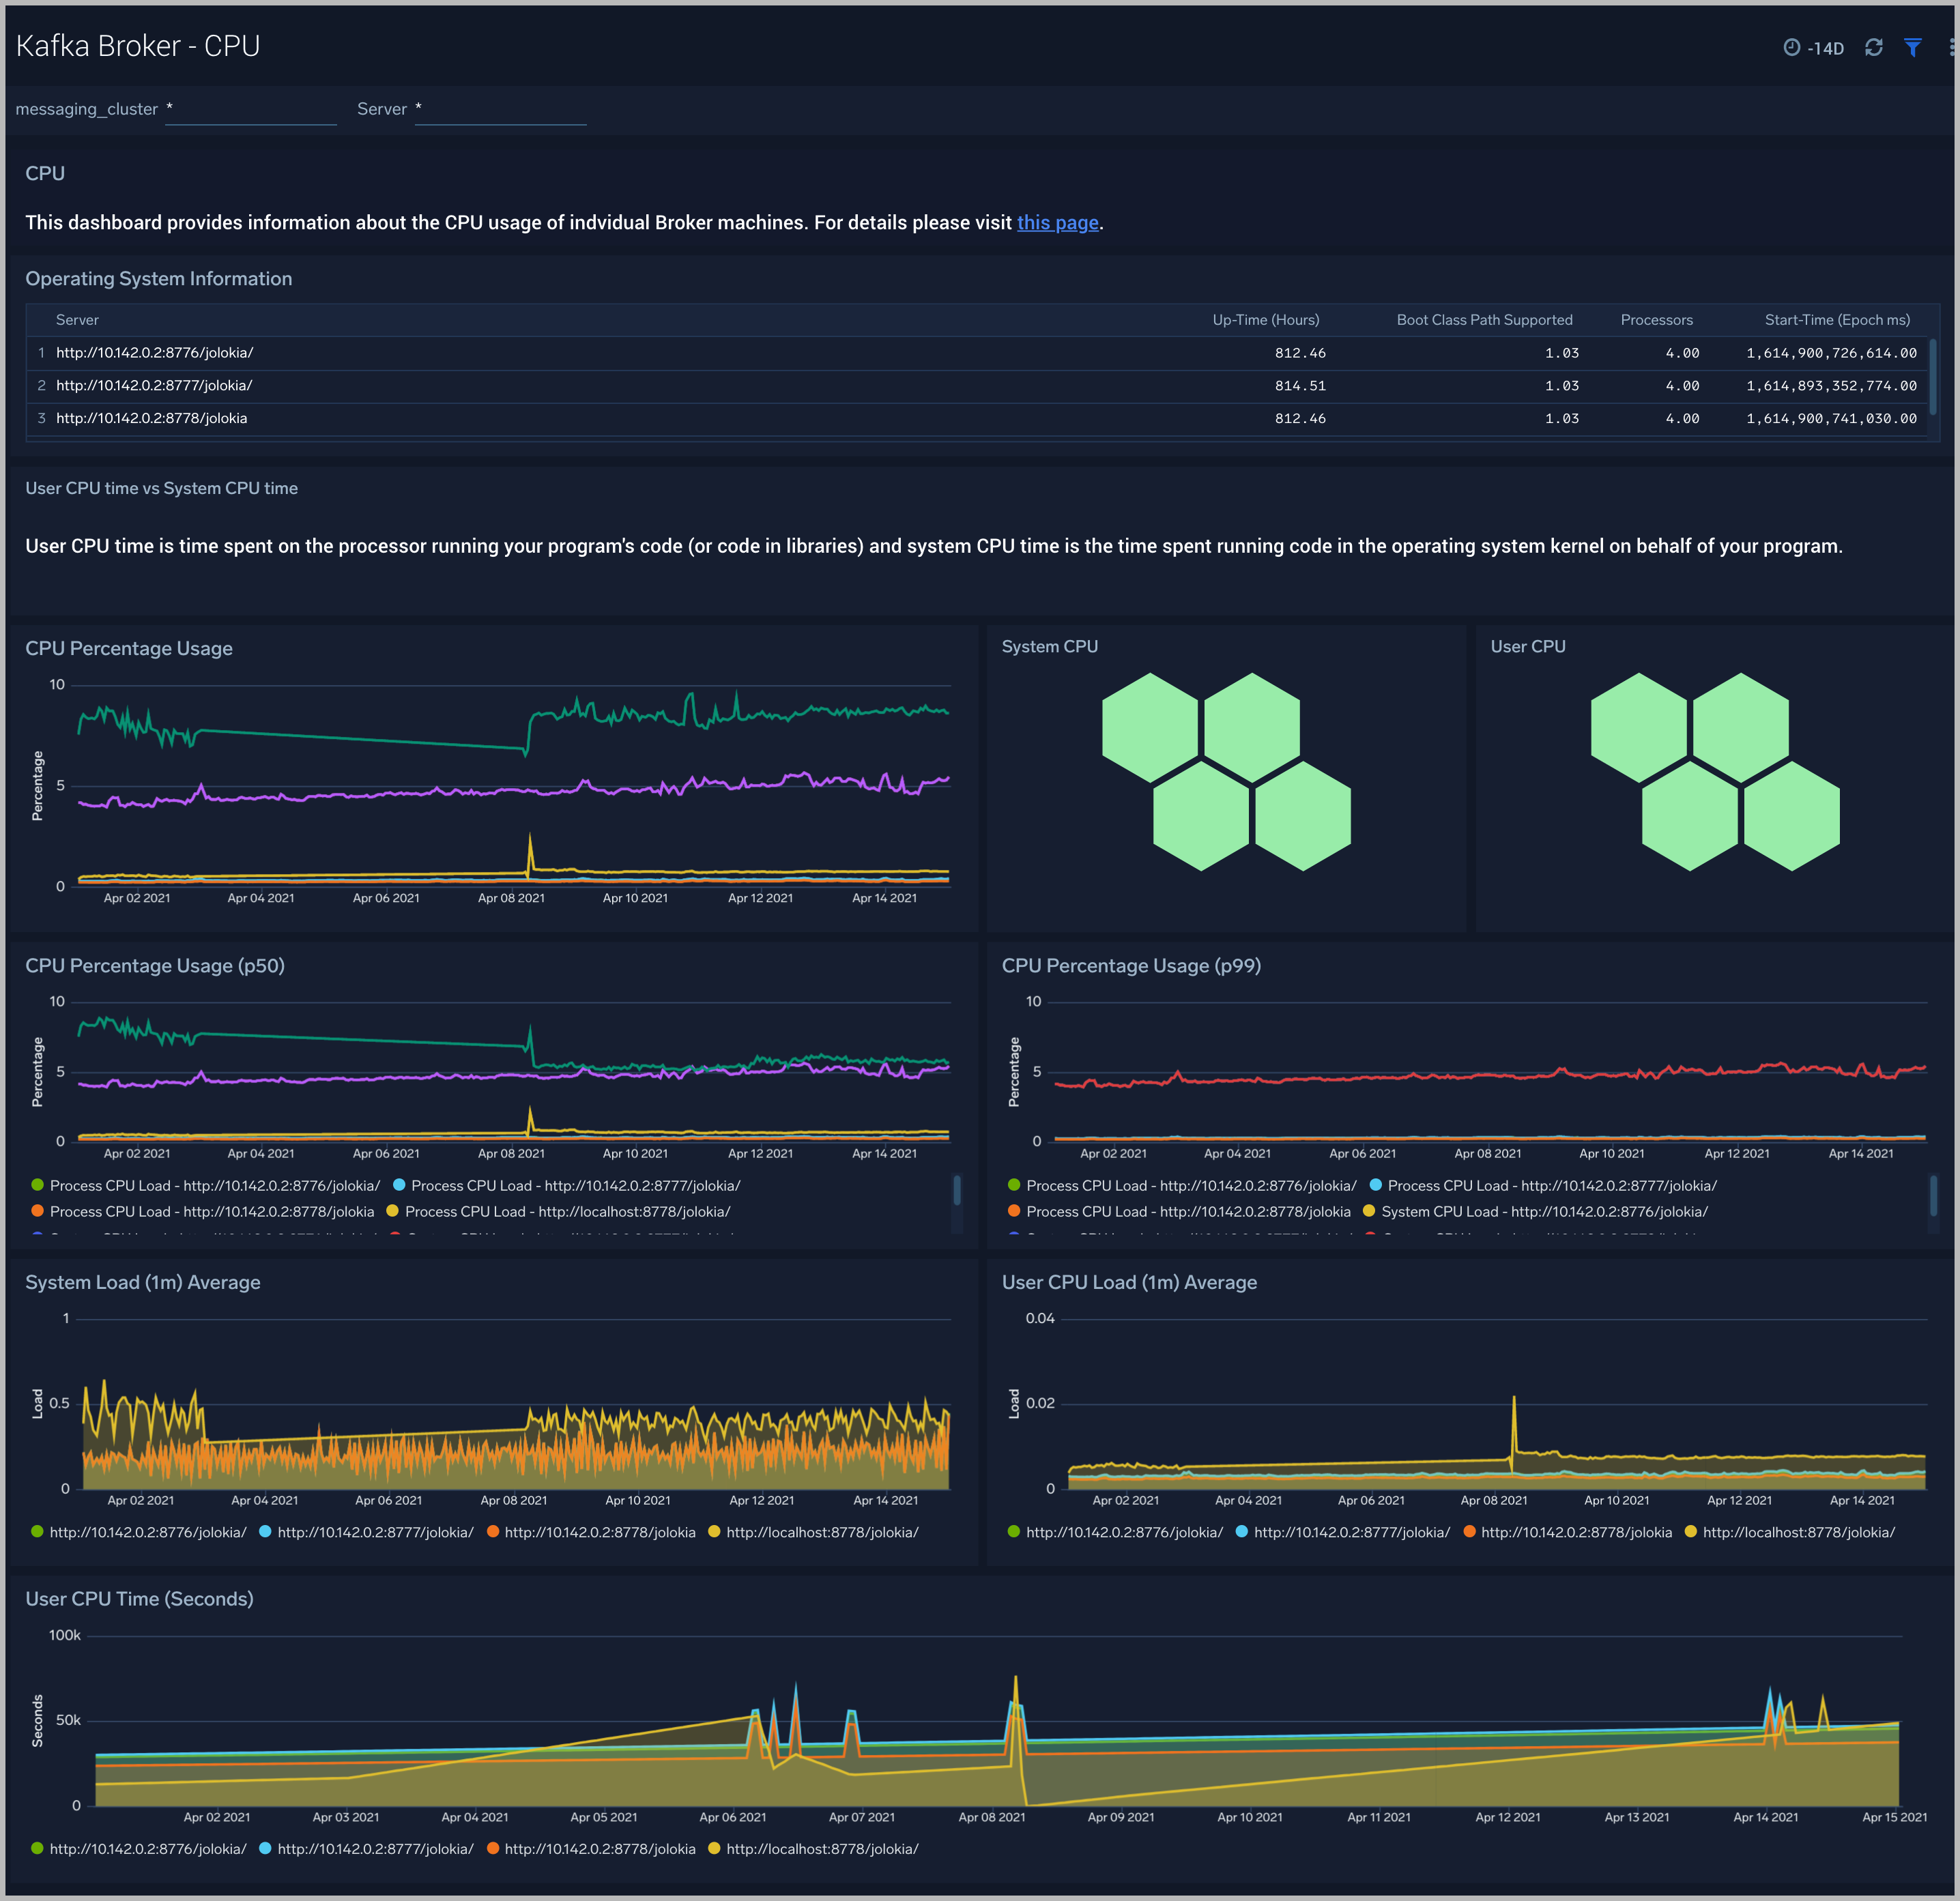
Kafka Broker - CPU
The Kafka Broker - CPU dashboard shows information about the CPU utilization of individual Broker machines.
Use this dashboard to:
- Get insights into the process and user CPU load of Kafka brokers. High CPU utilization can make Kafka flaky and can cause read/write timeouts.
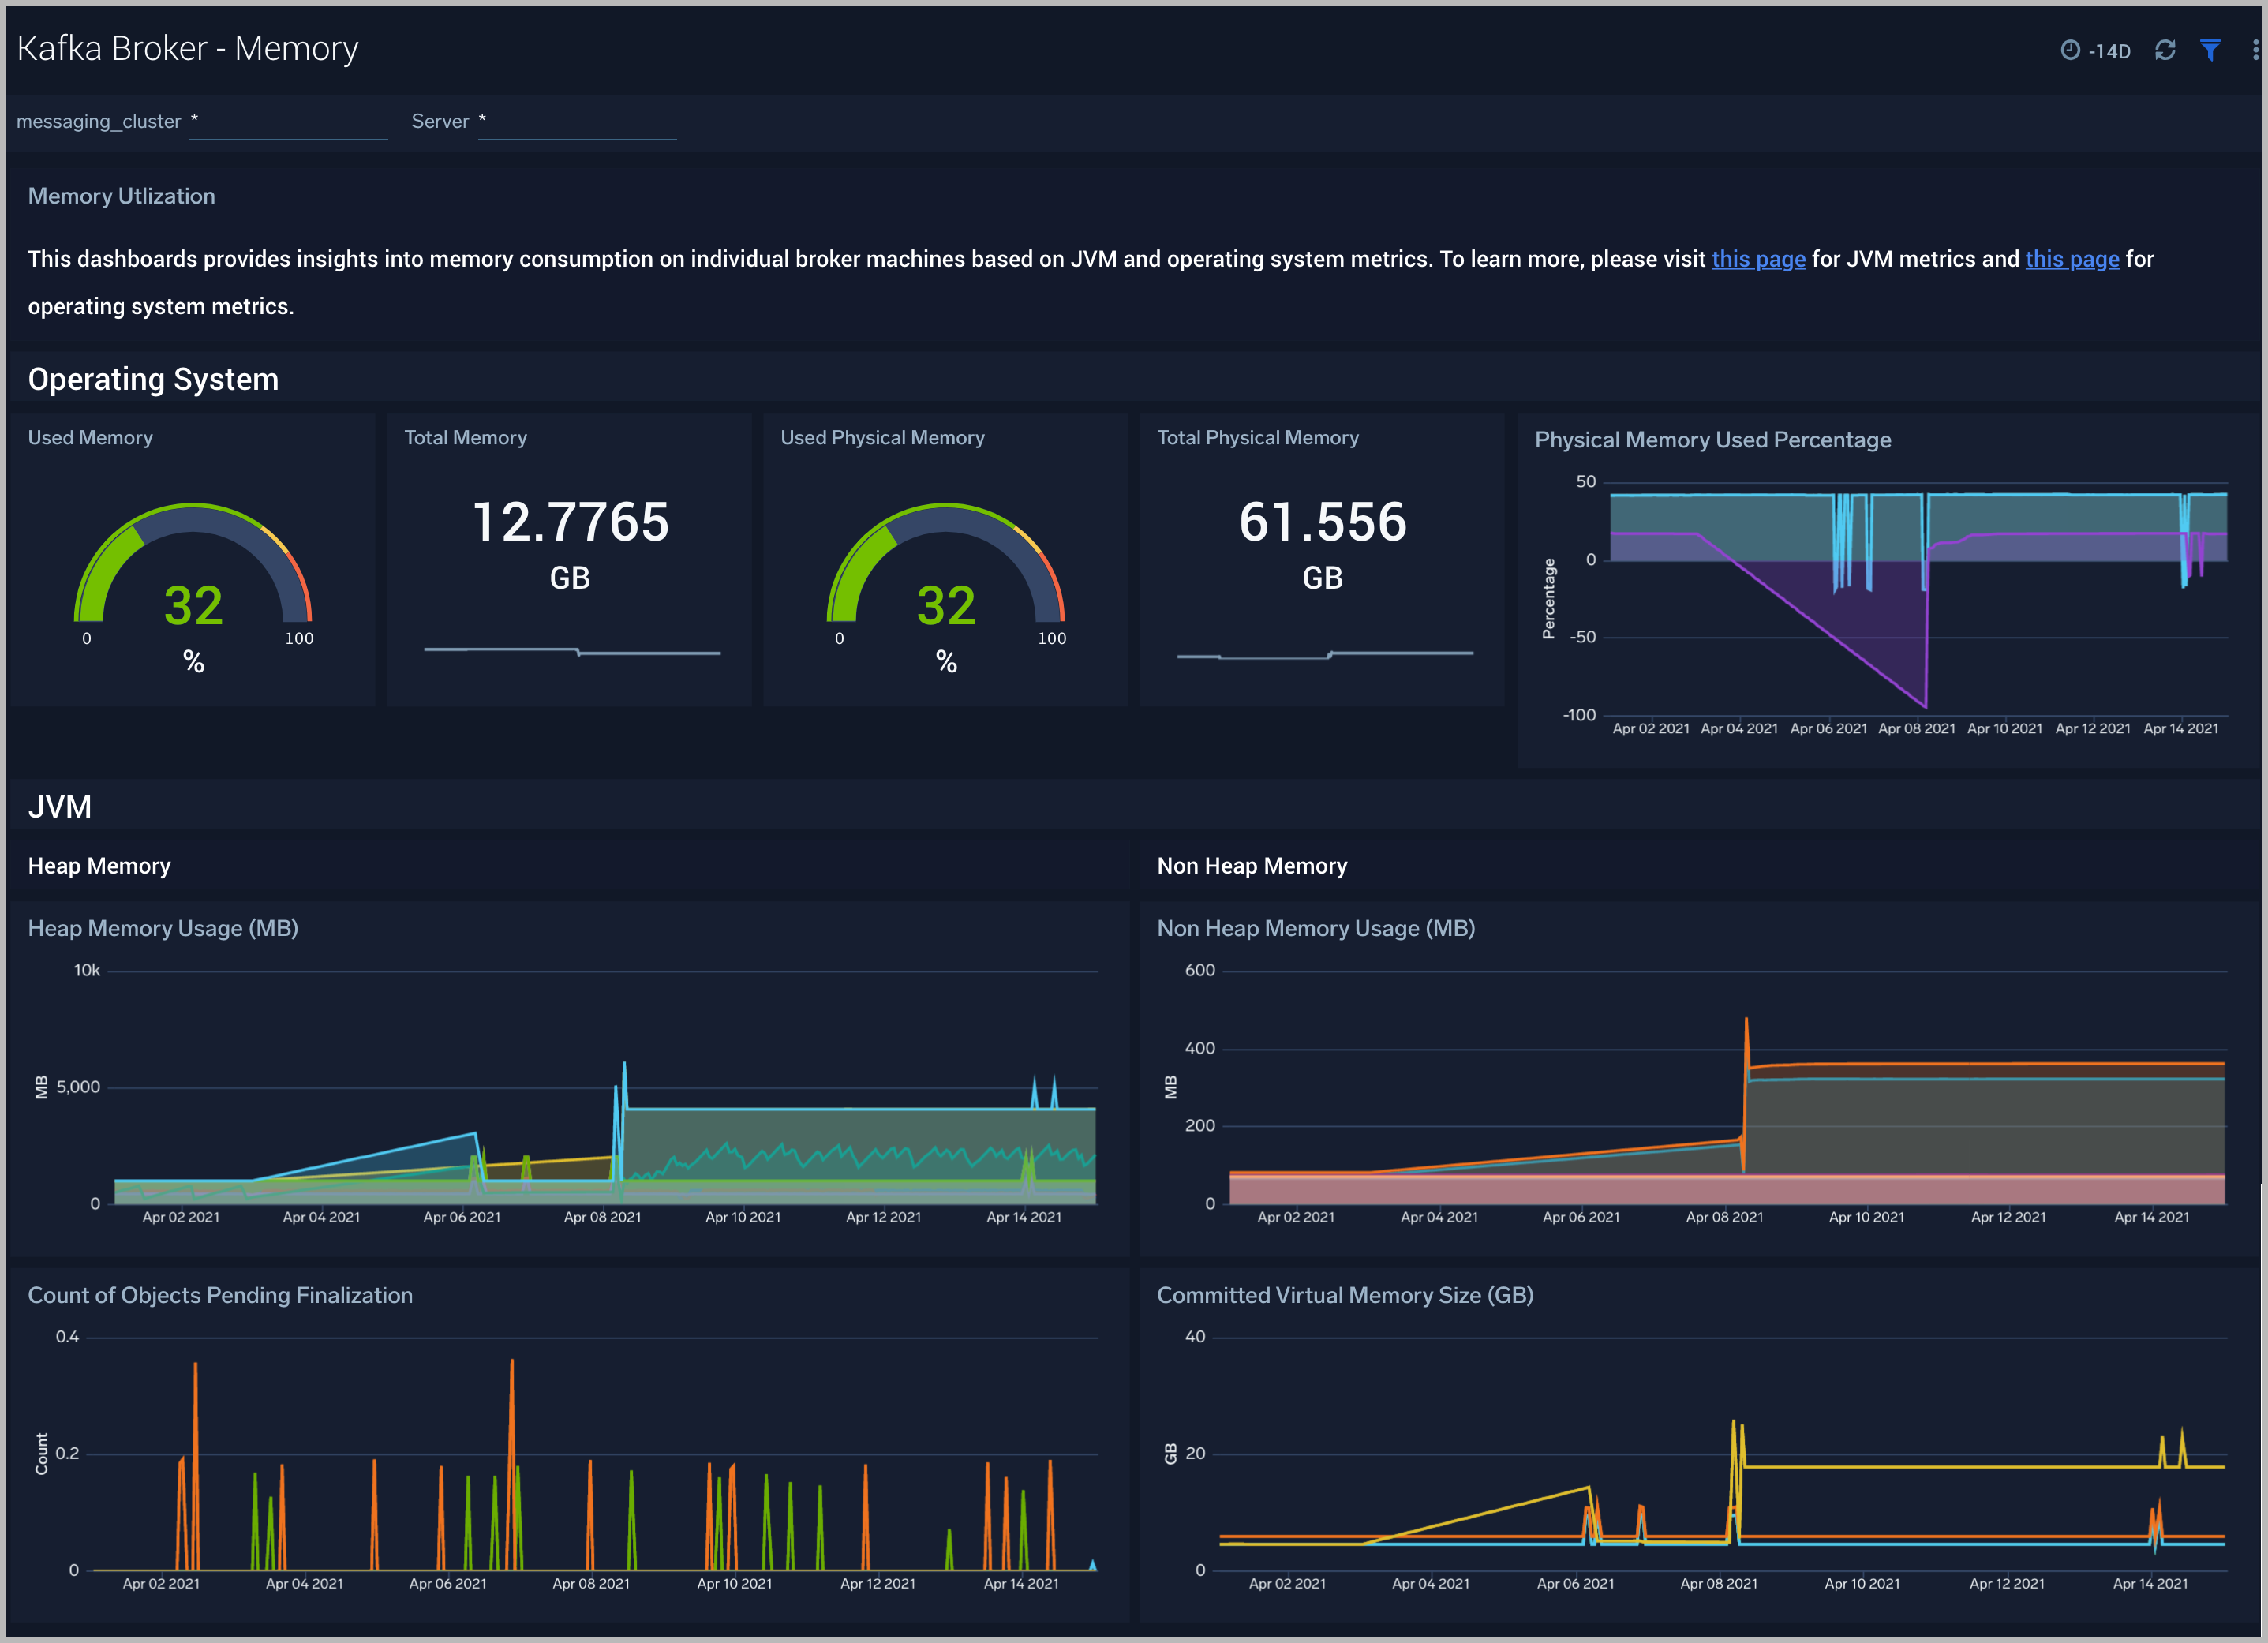
Kafka Broker - Memory
The Kafka Broker - Memory dashboard shows the percentage of the heap and non-heap memory used, physical and swap memory usage of your Kafka broker’s JVM.
Use this dashboard to:
- Understand how memory is used across Heap and Non-Heap memory.
- Examine physical and swap memory usage and make resource adjustments as needed.
- Examine the pending object finalization count, which, when high, can lead to excessive memory usage.
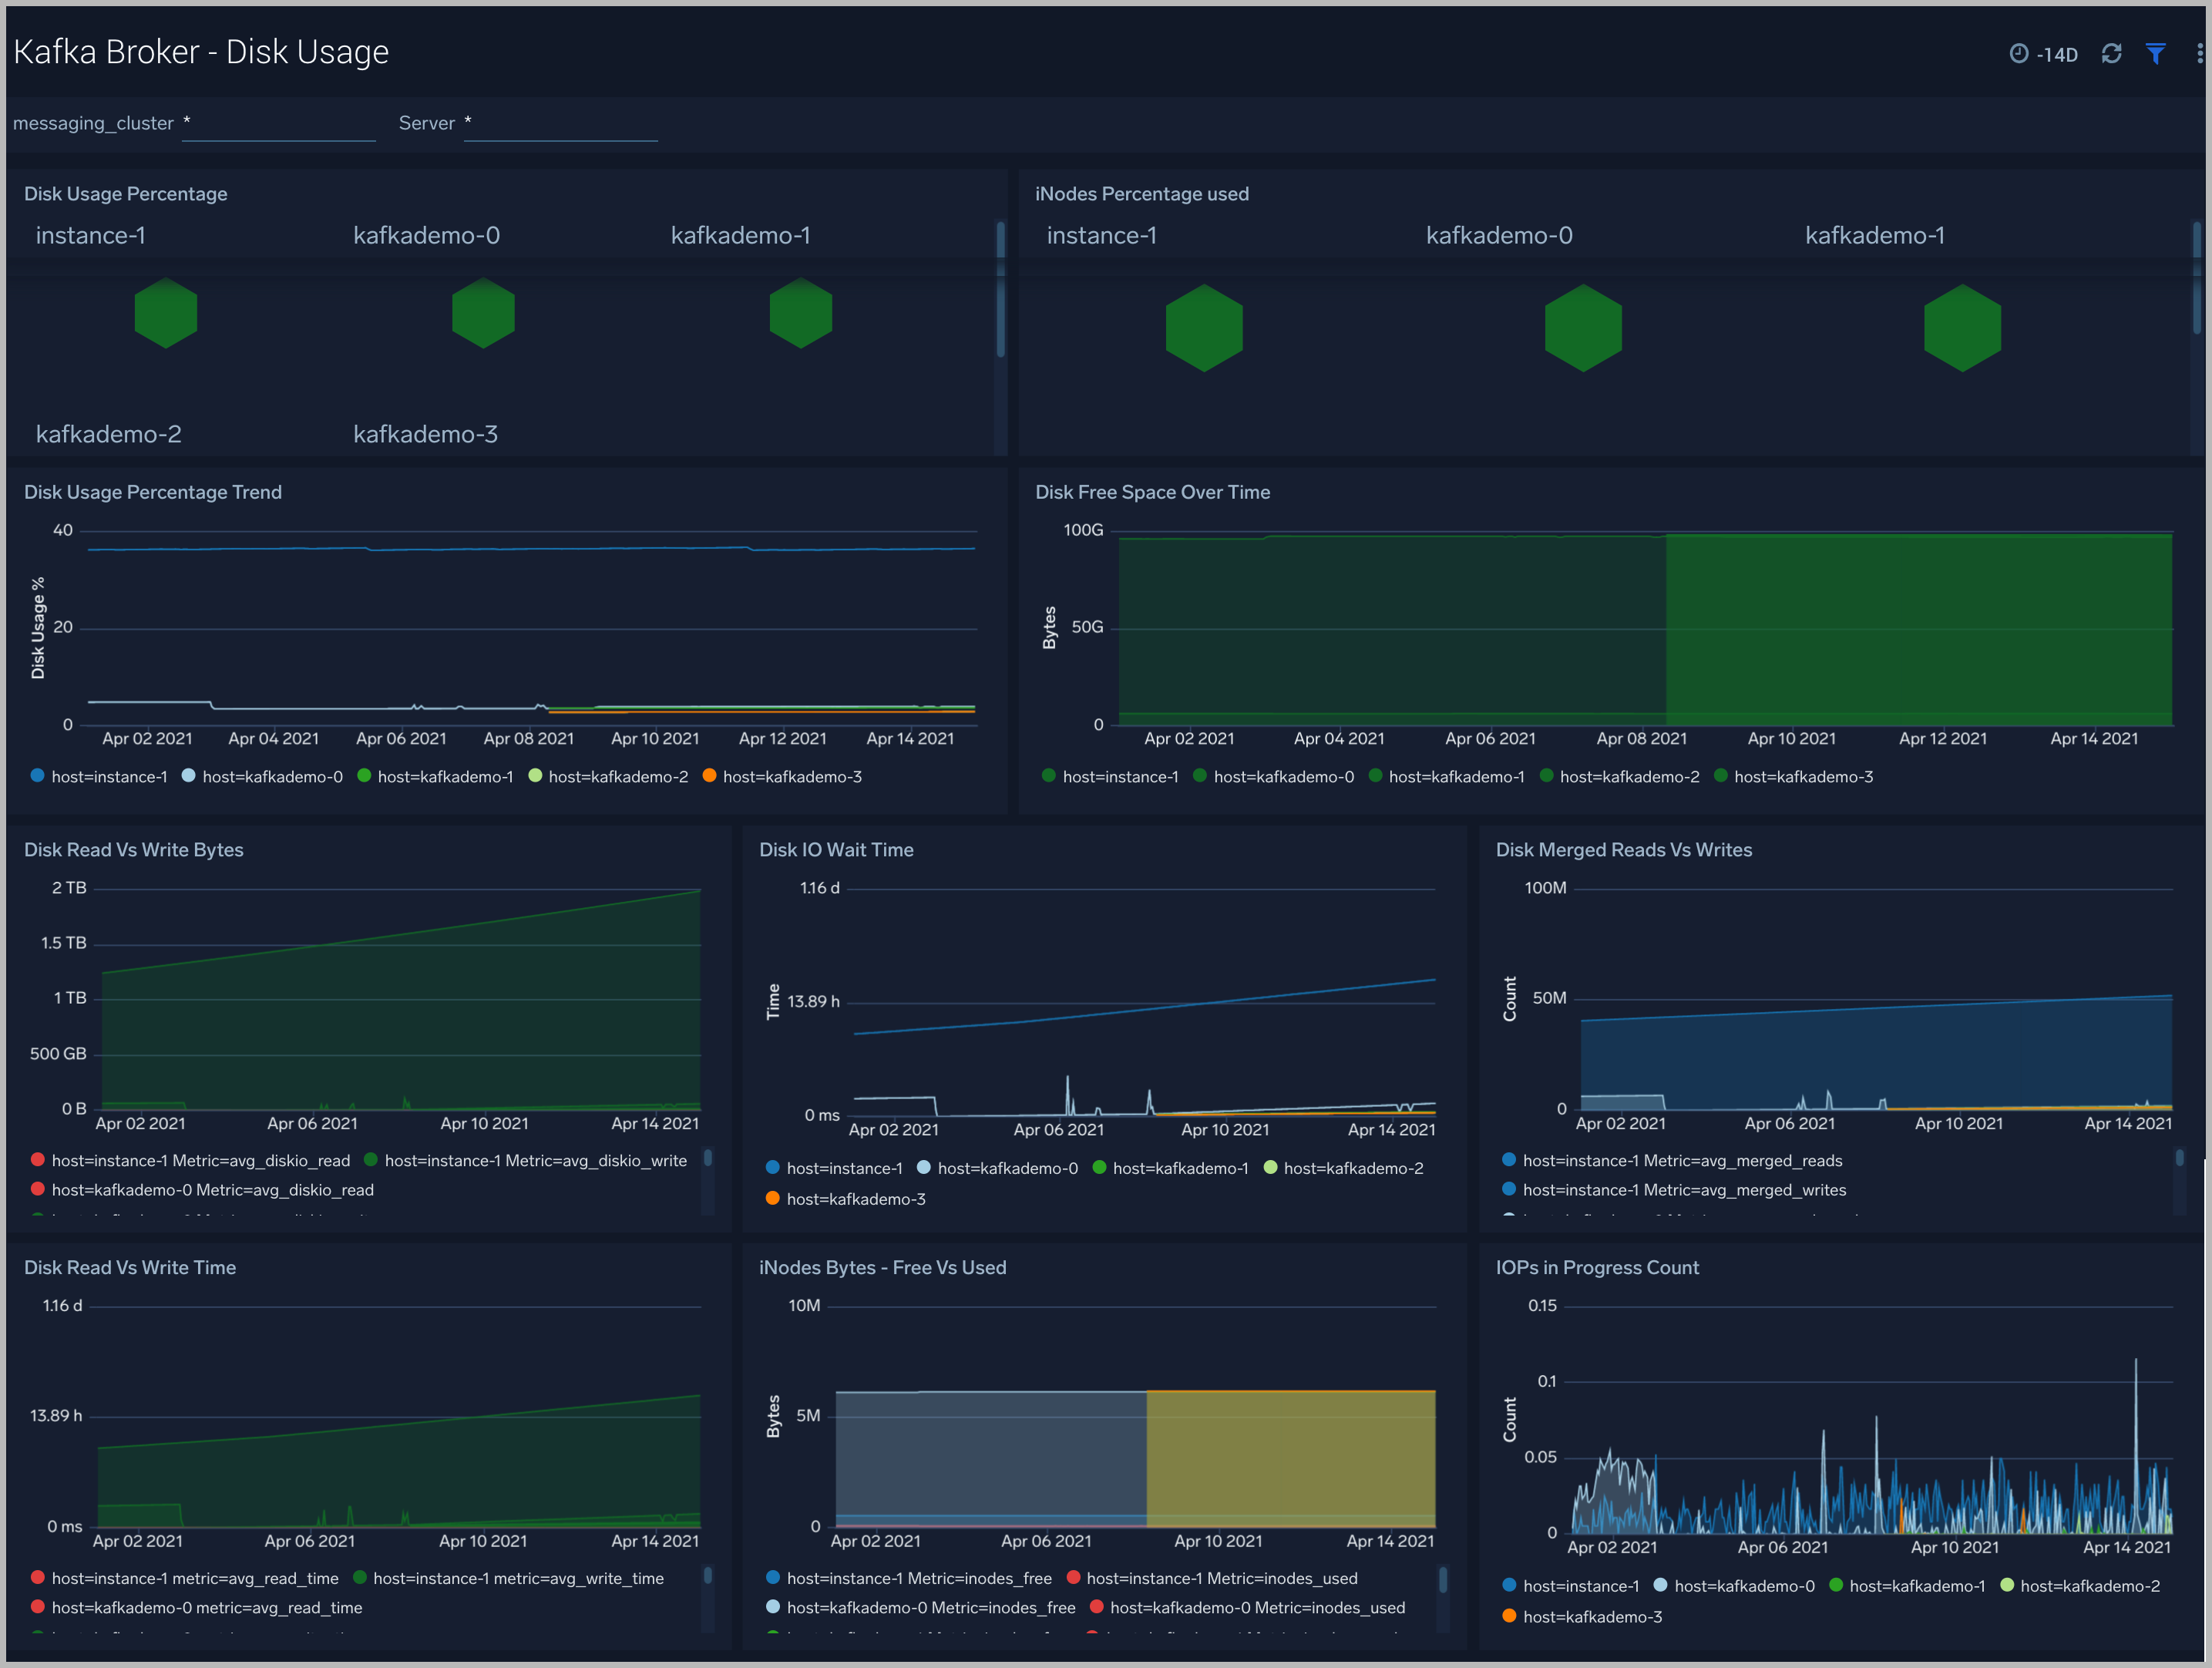
Kafka Broker - Disk Usage
The Kafka Broker - Disk Usage dashboard helps monitor disk usage across your Kafka Brokers.
Use this dashboard to:
- Monitor Disk Usage percentage on Kafka Brokers. This is critical as Kafka brokers use disk space to store messages for each topic. Other factors that affect disk utilization are:
- Topic replication factor of Kafka topics.
- Log retention settings.
- Analyze trends in disk throughput and find any spikes. This is especially important as disk throughput can be a performance bottleneck.
- Monitor iNodes bytes used, and disk read vs writes. These metrics are important to monitor as Kafka may not necessarily distribute data from a heavily occupied disk, which itself can bring Kafka down.
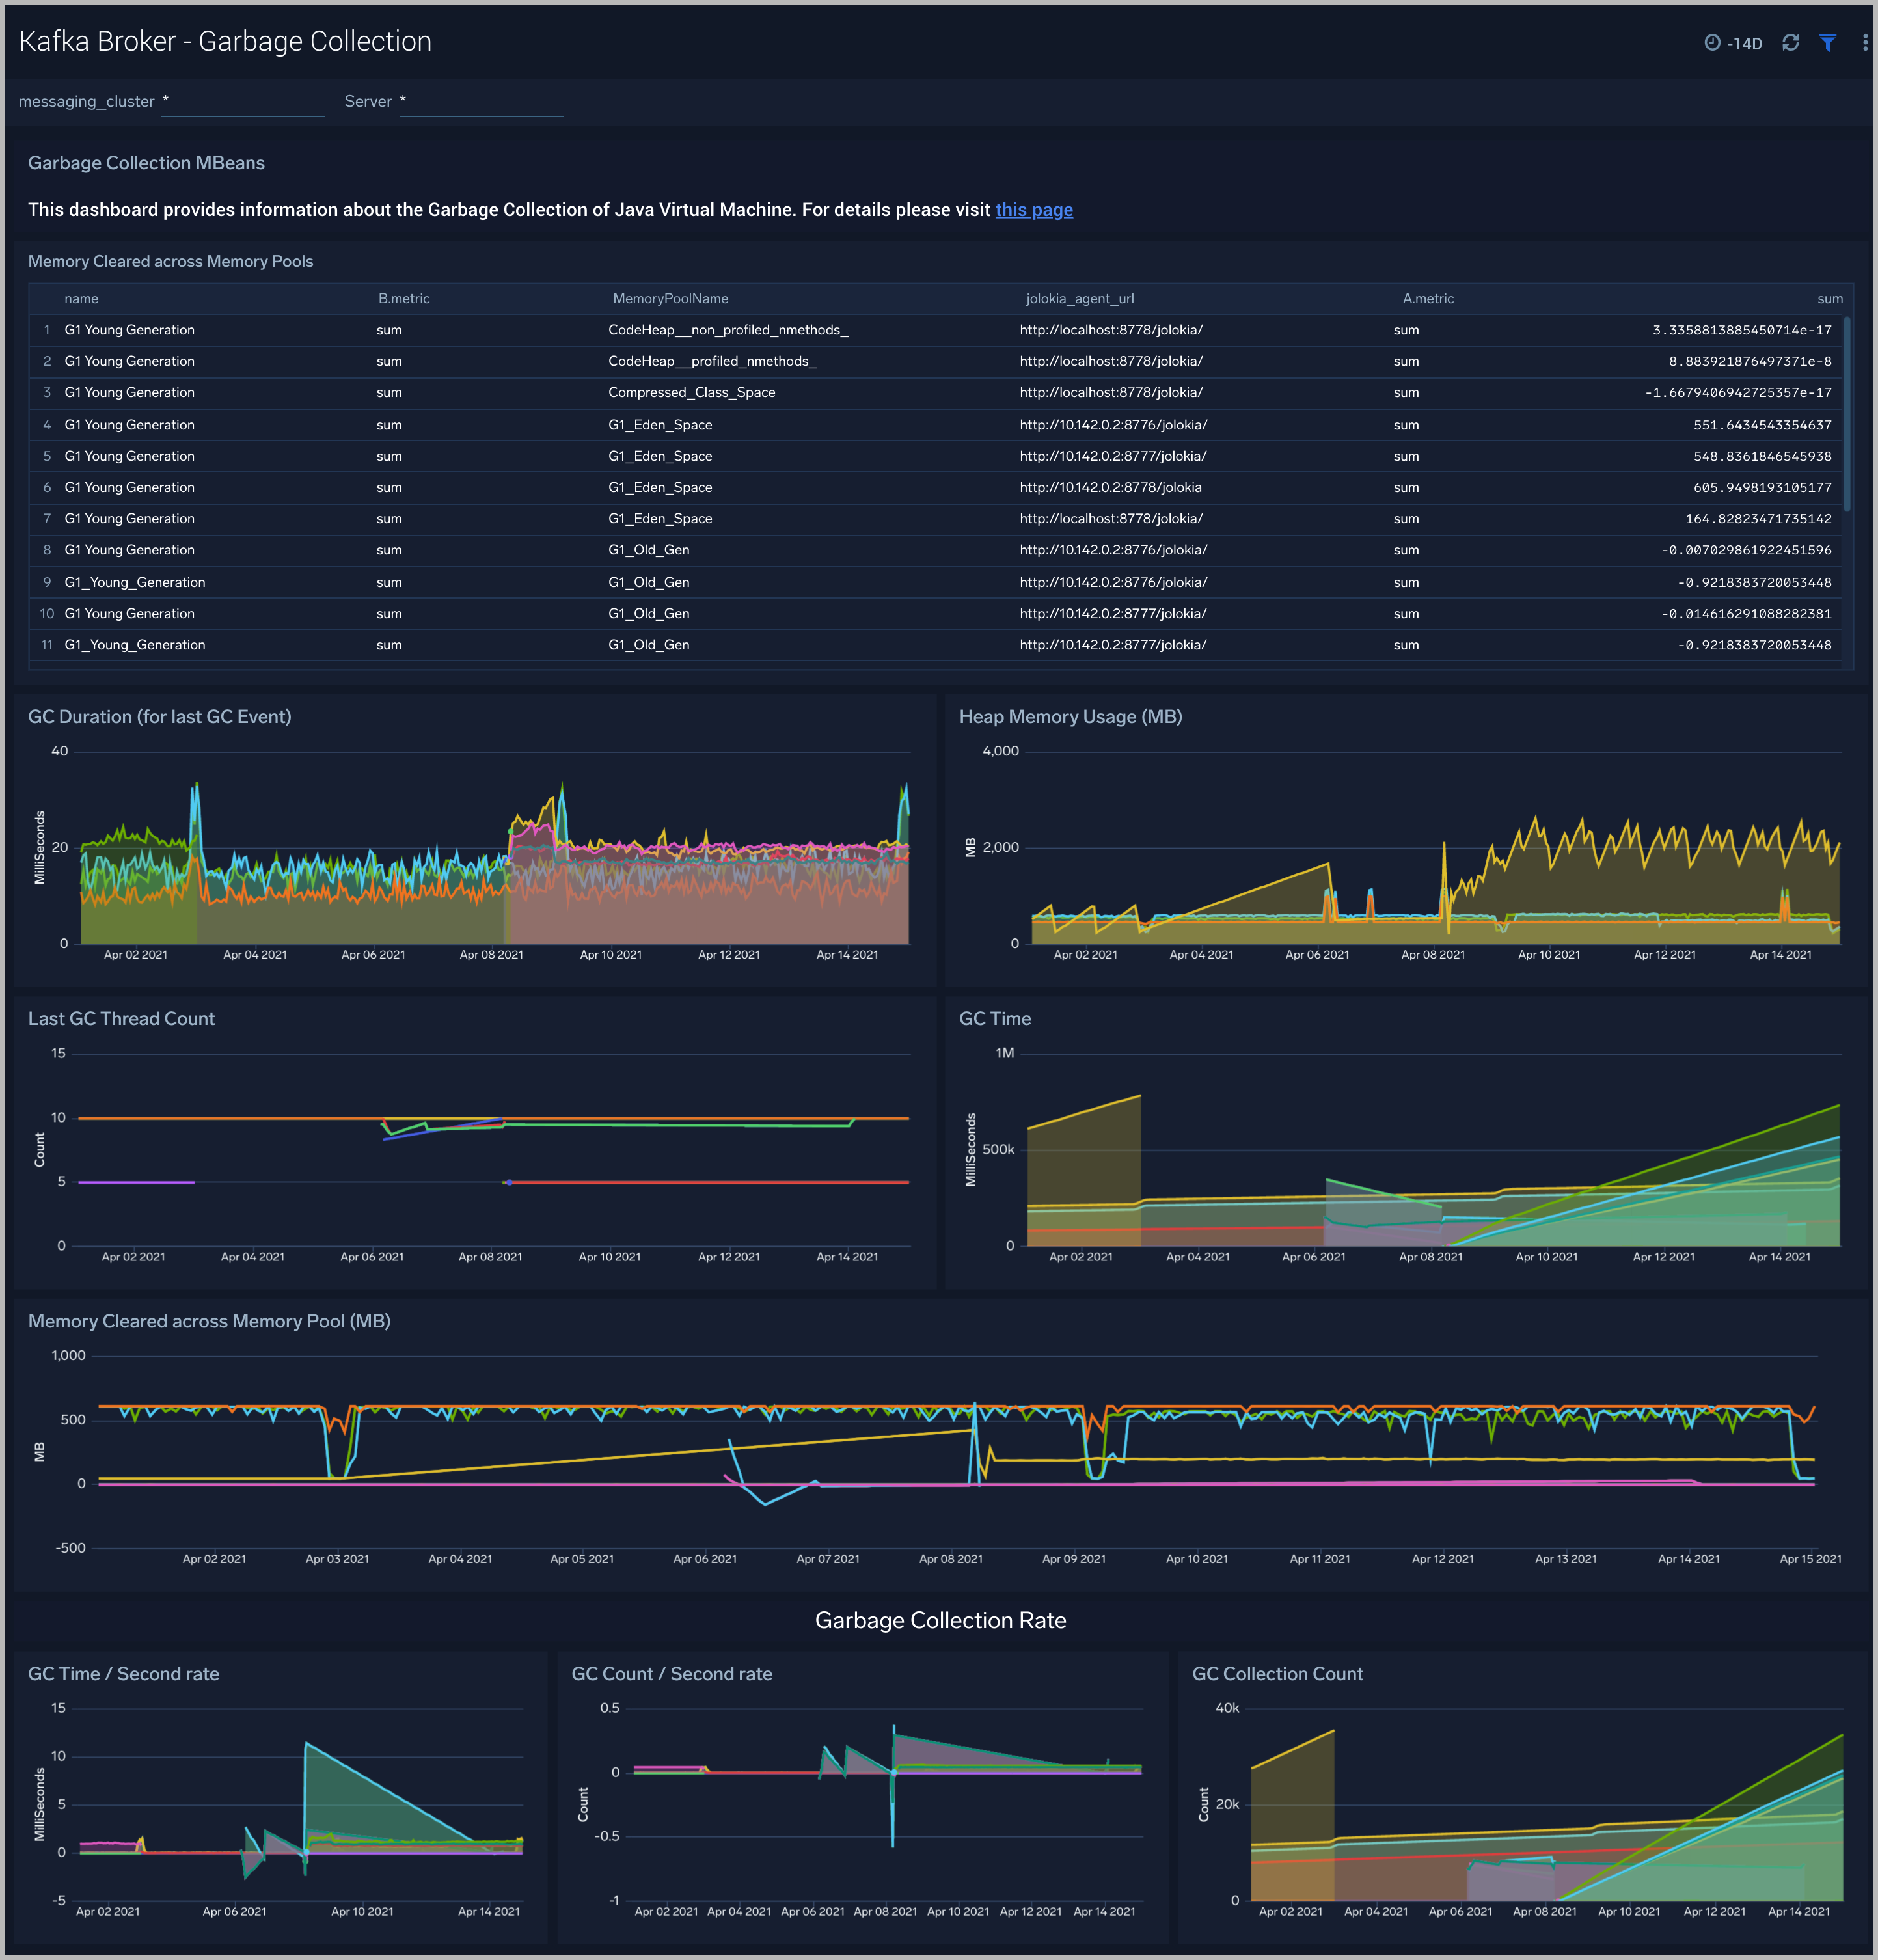
Kafka Broker - Garbage Collection
The Kafka Broker - Garbage Collection dashboard shows key Garbage Collector statistics like the duration of the last GC run, objects collected, threads used, and memory cleared in the last GC run of your Java virtual machine.
Use this dashboard to:
- Understand the amount of time spent in garbage collection. If this time keeps increasing, your Kafka brokers may have more CPU usage.
- Understand the amount of memory cleared by garbage collectors across memory pools and their impact on the Heap memory.
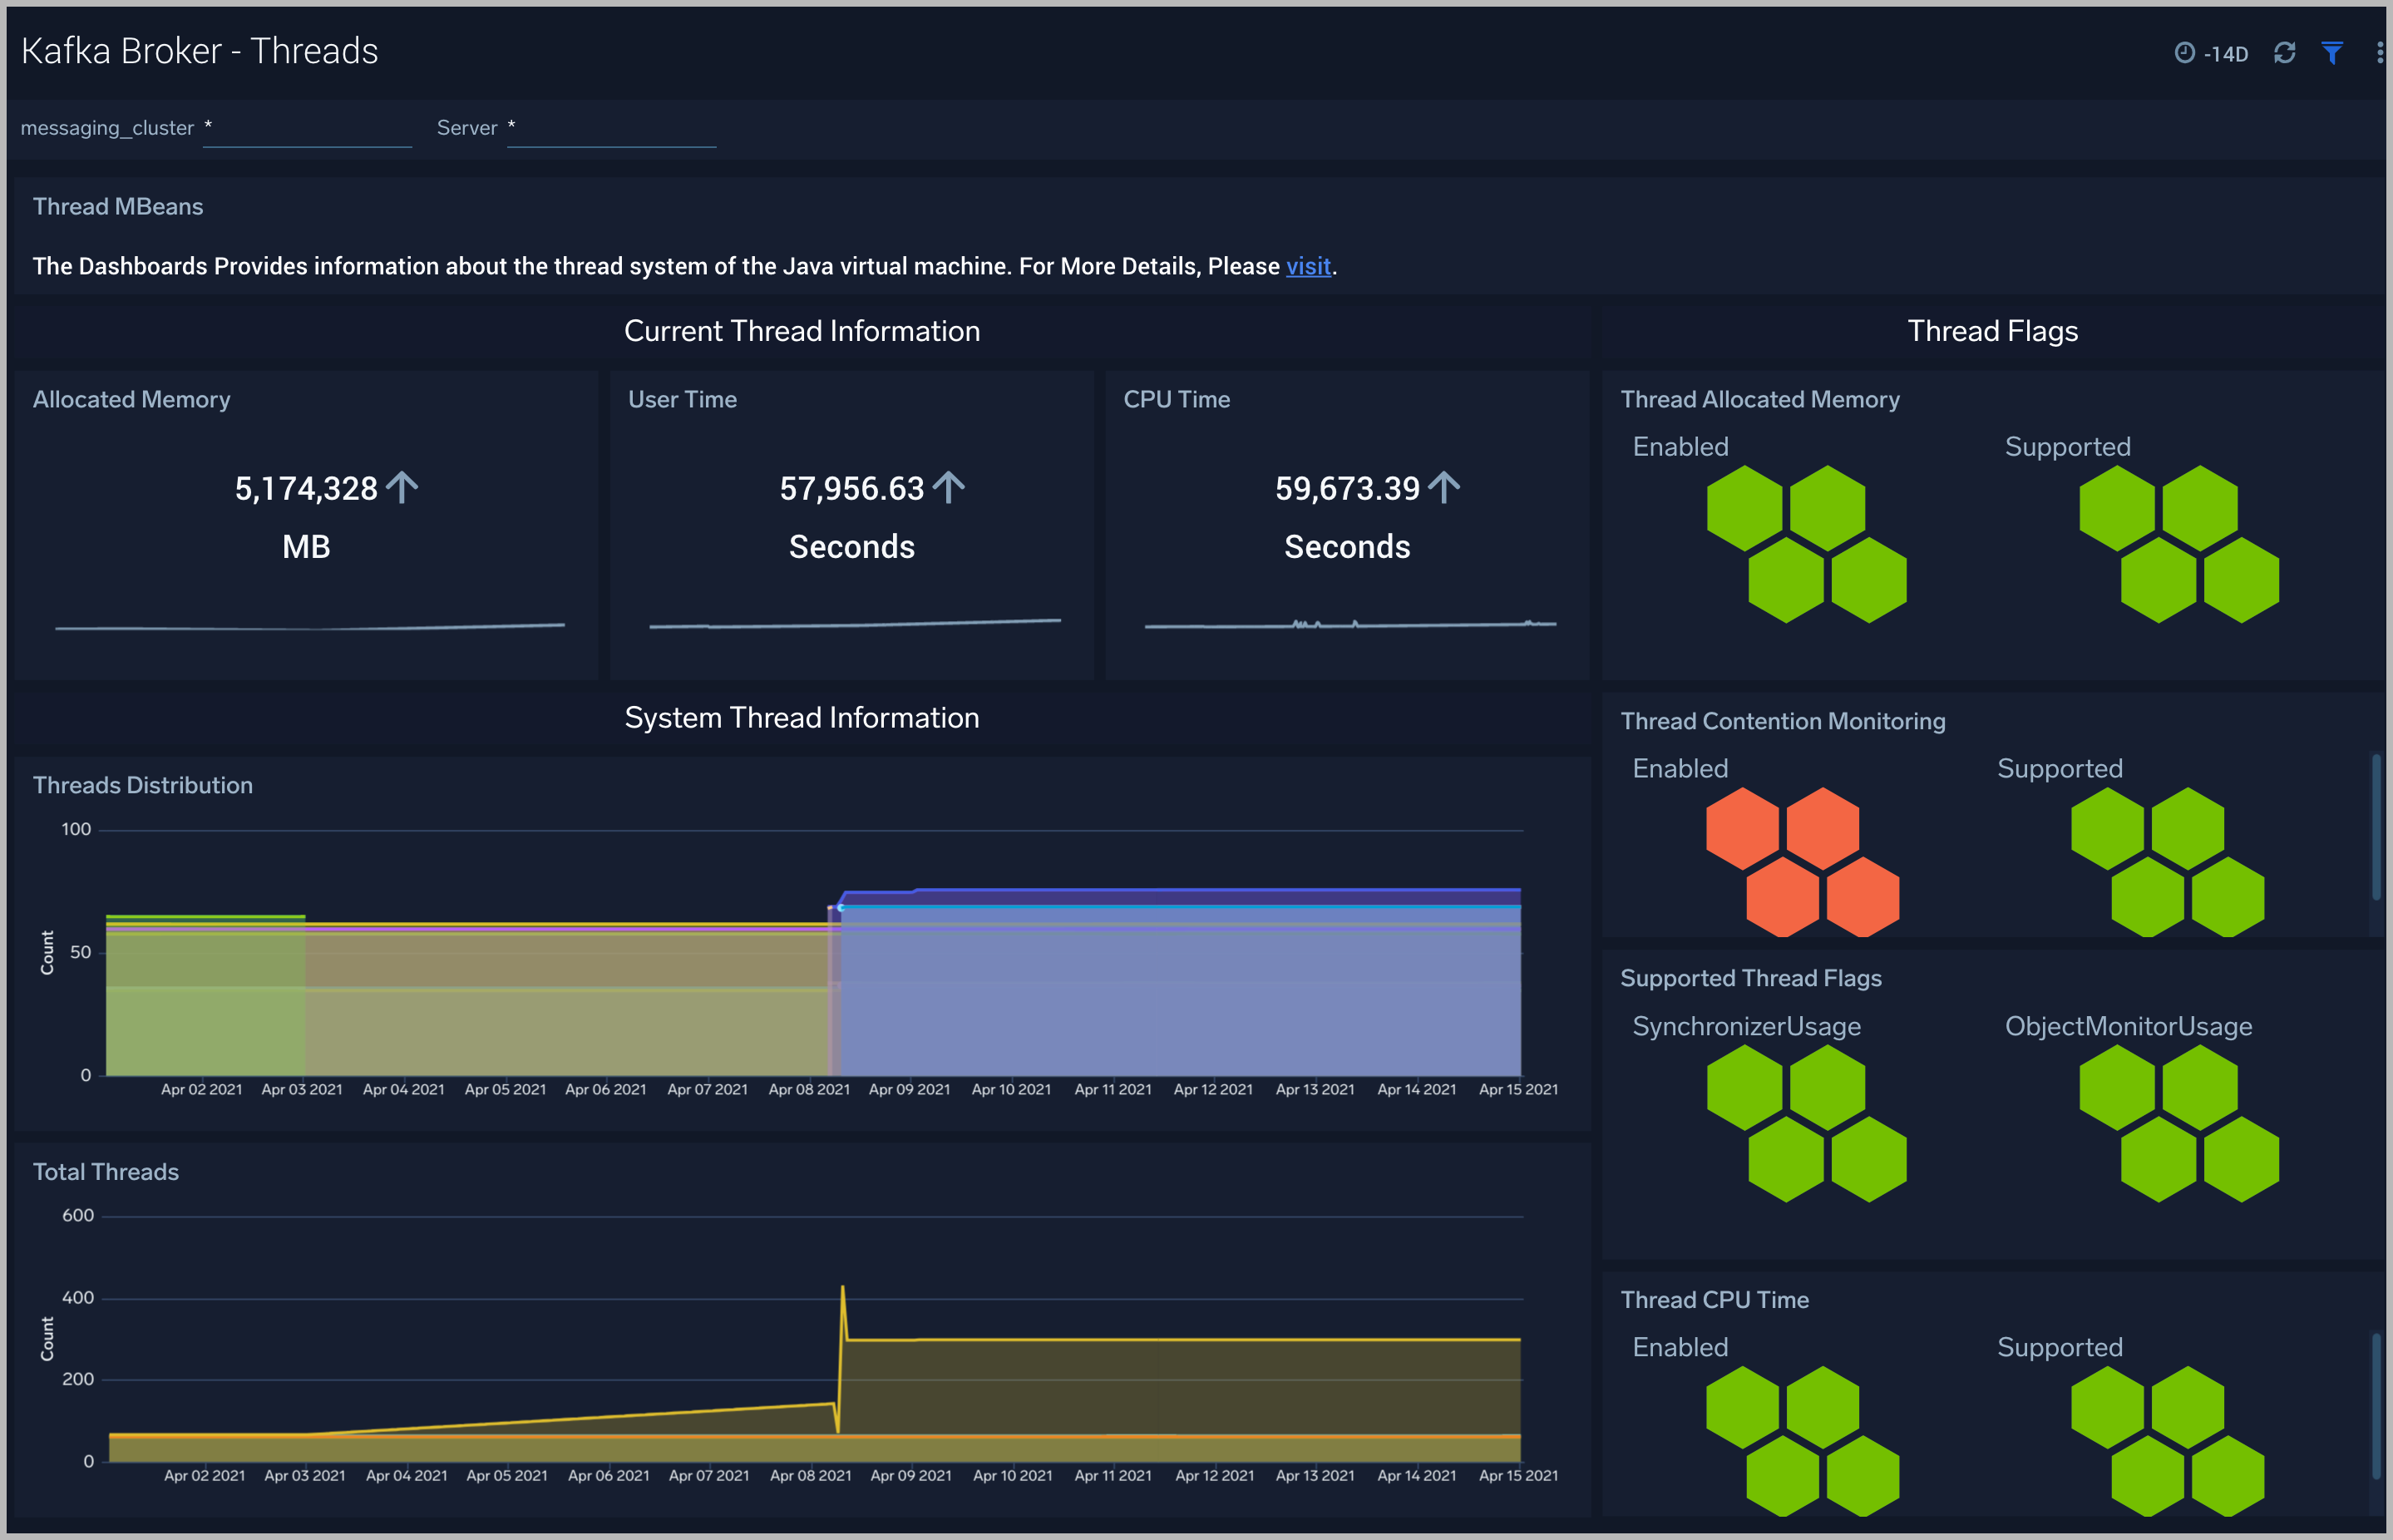
Kafka Broker - Threads
The Kafka Broker - Threads dashboard shows the key insights into the usage and type of threads created in your Kafka broker JVM
Use this dashboard to:
- Understand the dynamic behavior of the system using peak, daemon, and current threads.
- Gain insights into the memory and CPU time of the last executed thread.
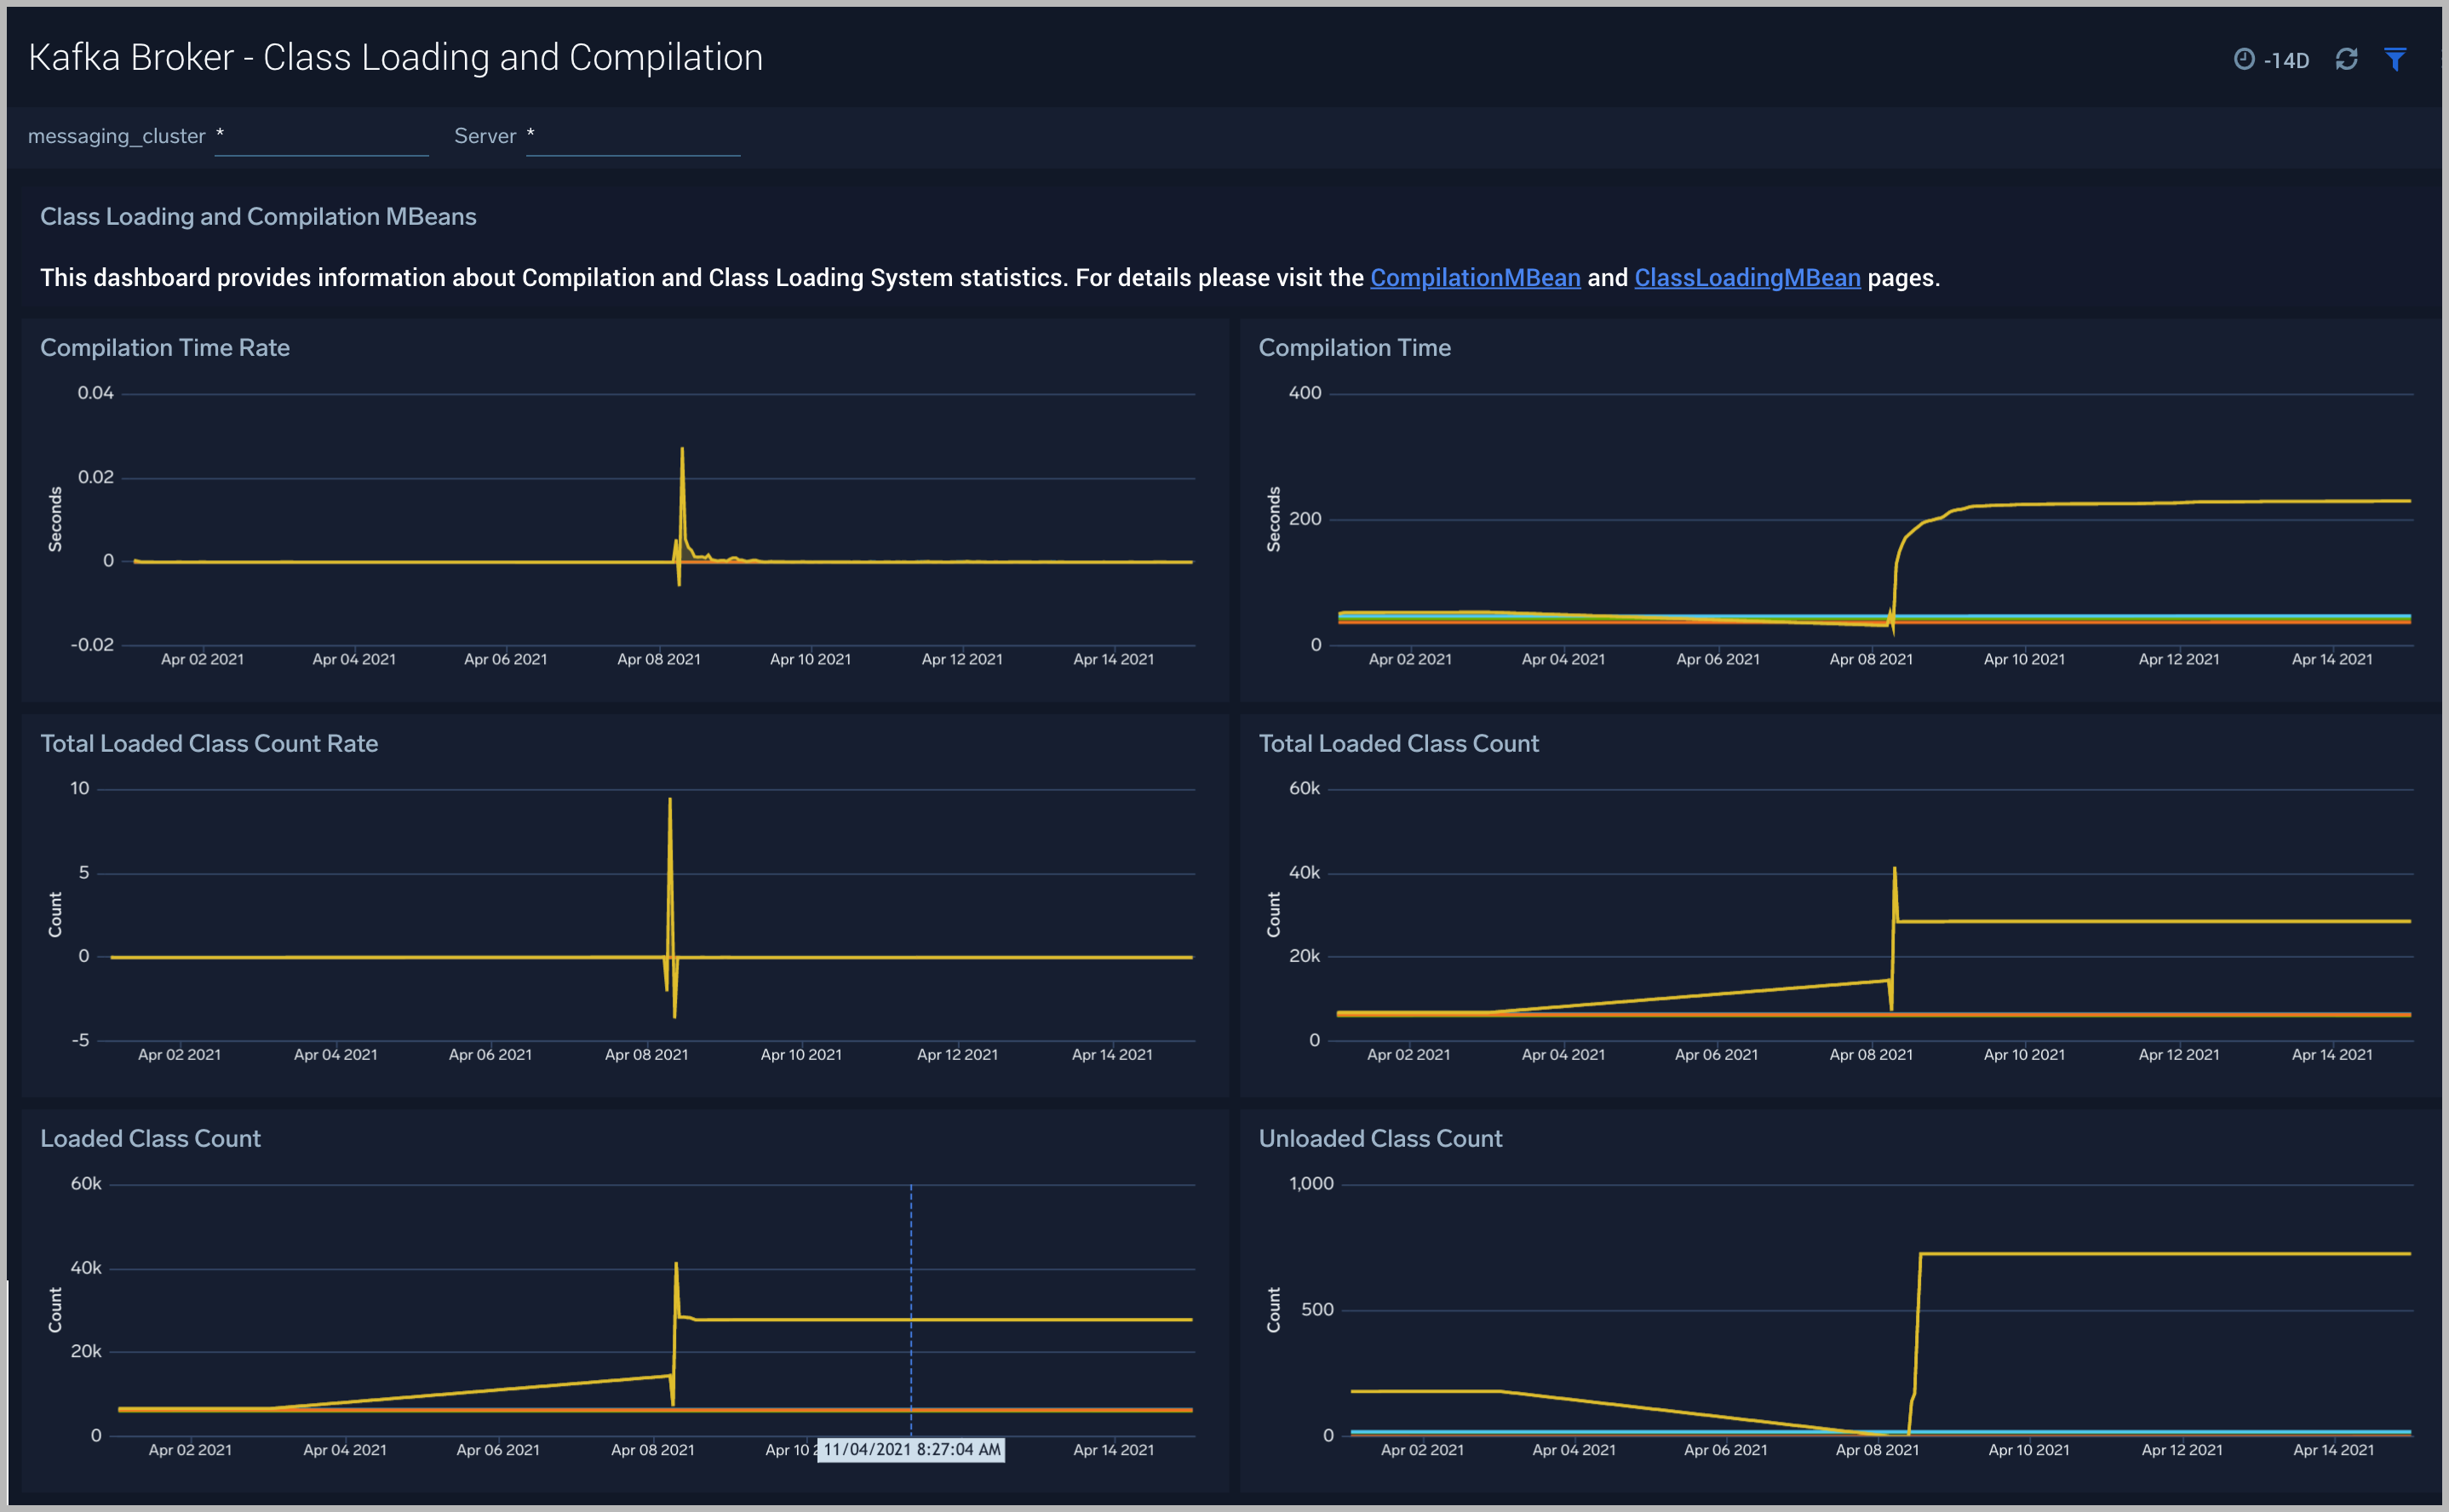
Kafka Broker - Class Loading and Compilation
The Kafka Broker - Class Loading and Compilation dashboard helps you get insights into the behavior of class count trends.
Use this dashboard to:
- Determine if the class count keeps increasing; this indicates that the same classes are loaded by multiple classloaders.
- Get insights into the time spent by Java Virtual Machines during compilation.
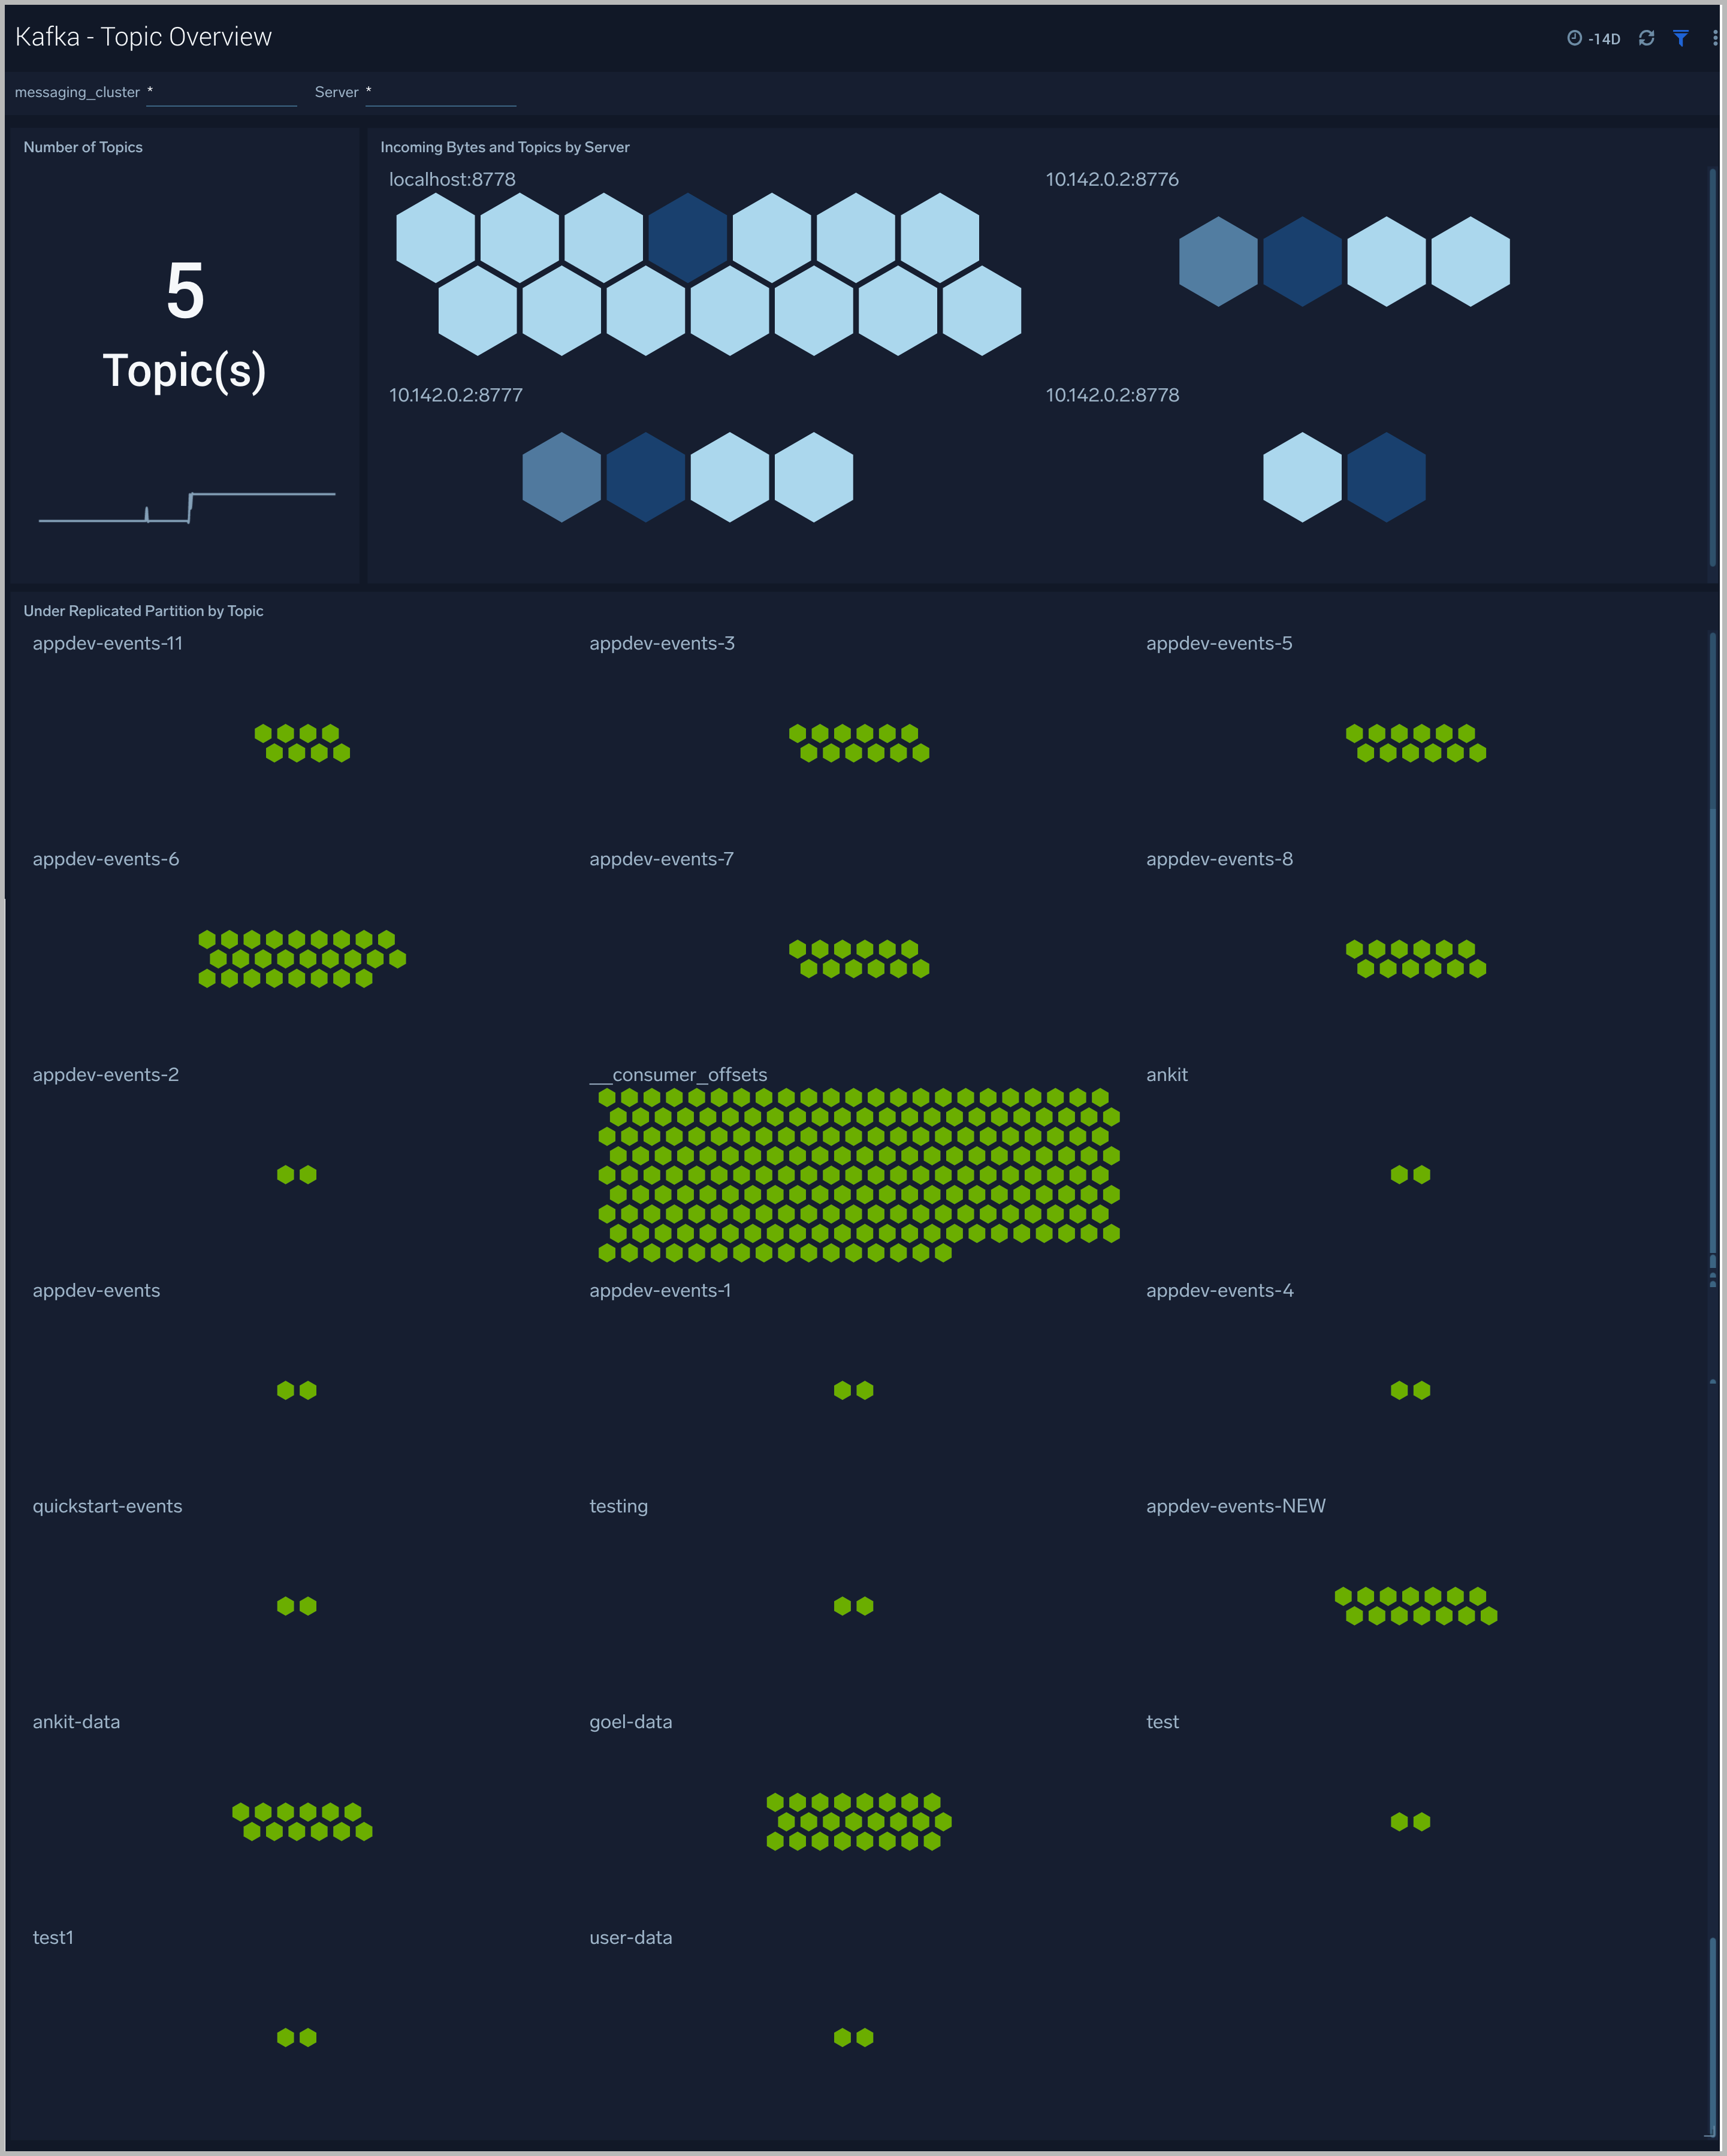
Strimzi Kafka - Topic Overview
The Strimzi Kafka - Topic Overview dashboard helps you quickly identify under-replicated partitions and incoming bytes by Kafka topic, server, and cluster.
Use this dashboard to:
-
Monitor Under Replicated partitions - The Under Replicated Partitions metric displays the number of partitions that do not have enough replicas to meet the desired replication factor. A partition will also be considered Under Replicated if the correct number of replicas exists, but one or more of the replicas have fallen significantly behind the partition leader. The two most common causes of under-replicated partitions are that one or more brokers are unresponsive, or the cluster is experiencing performance issues, and one or more brokers have fallen behind.
This metric is tagged with cluster, server, and topic info for easy troubleshooting. The colors in the Honeycomb chart are coded as follows:
- Green indicates there are no under-replicated partitions.
- Red indicates that a given partition is under-replicated.
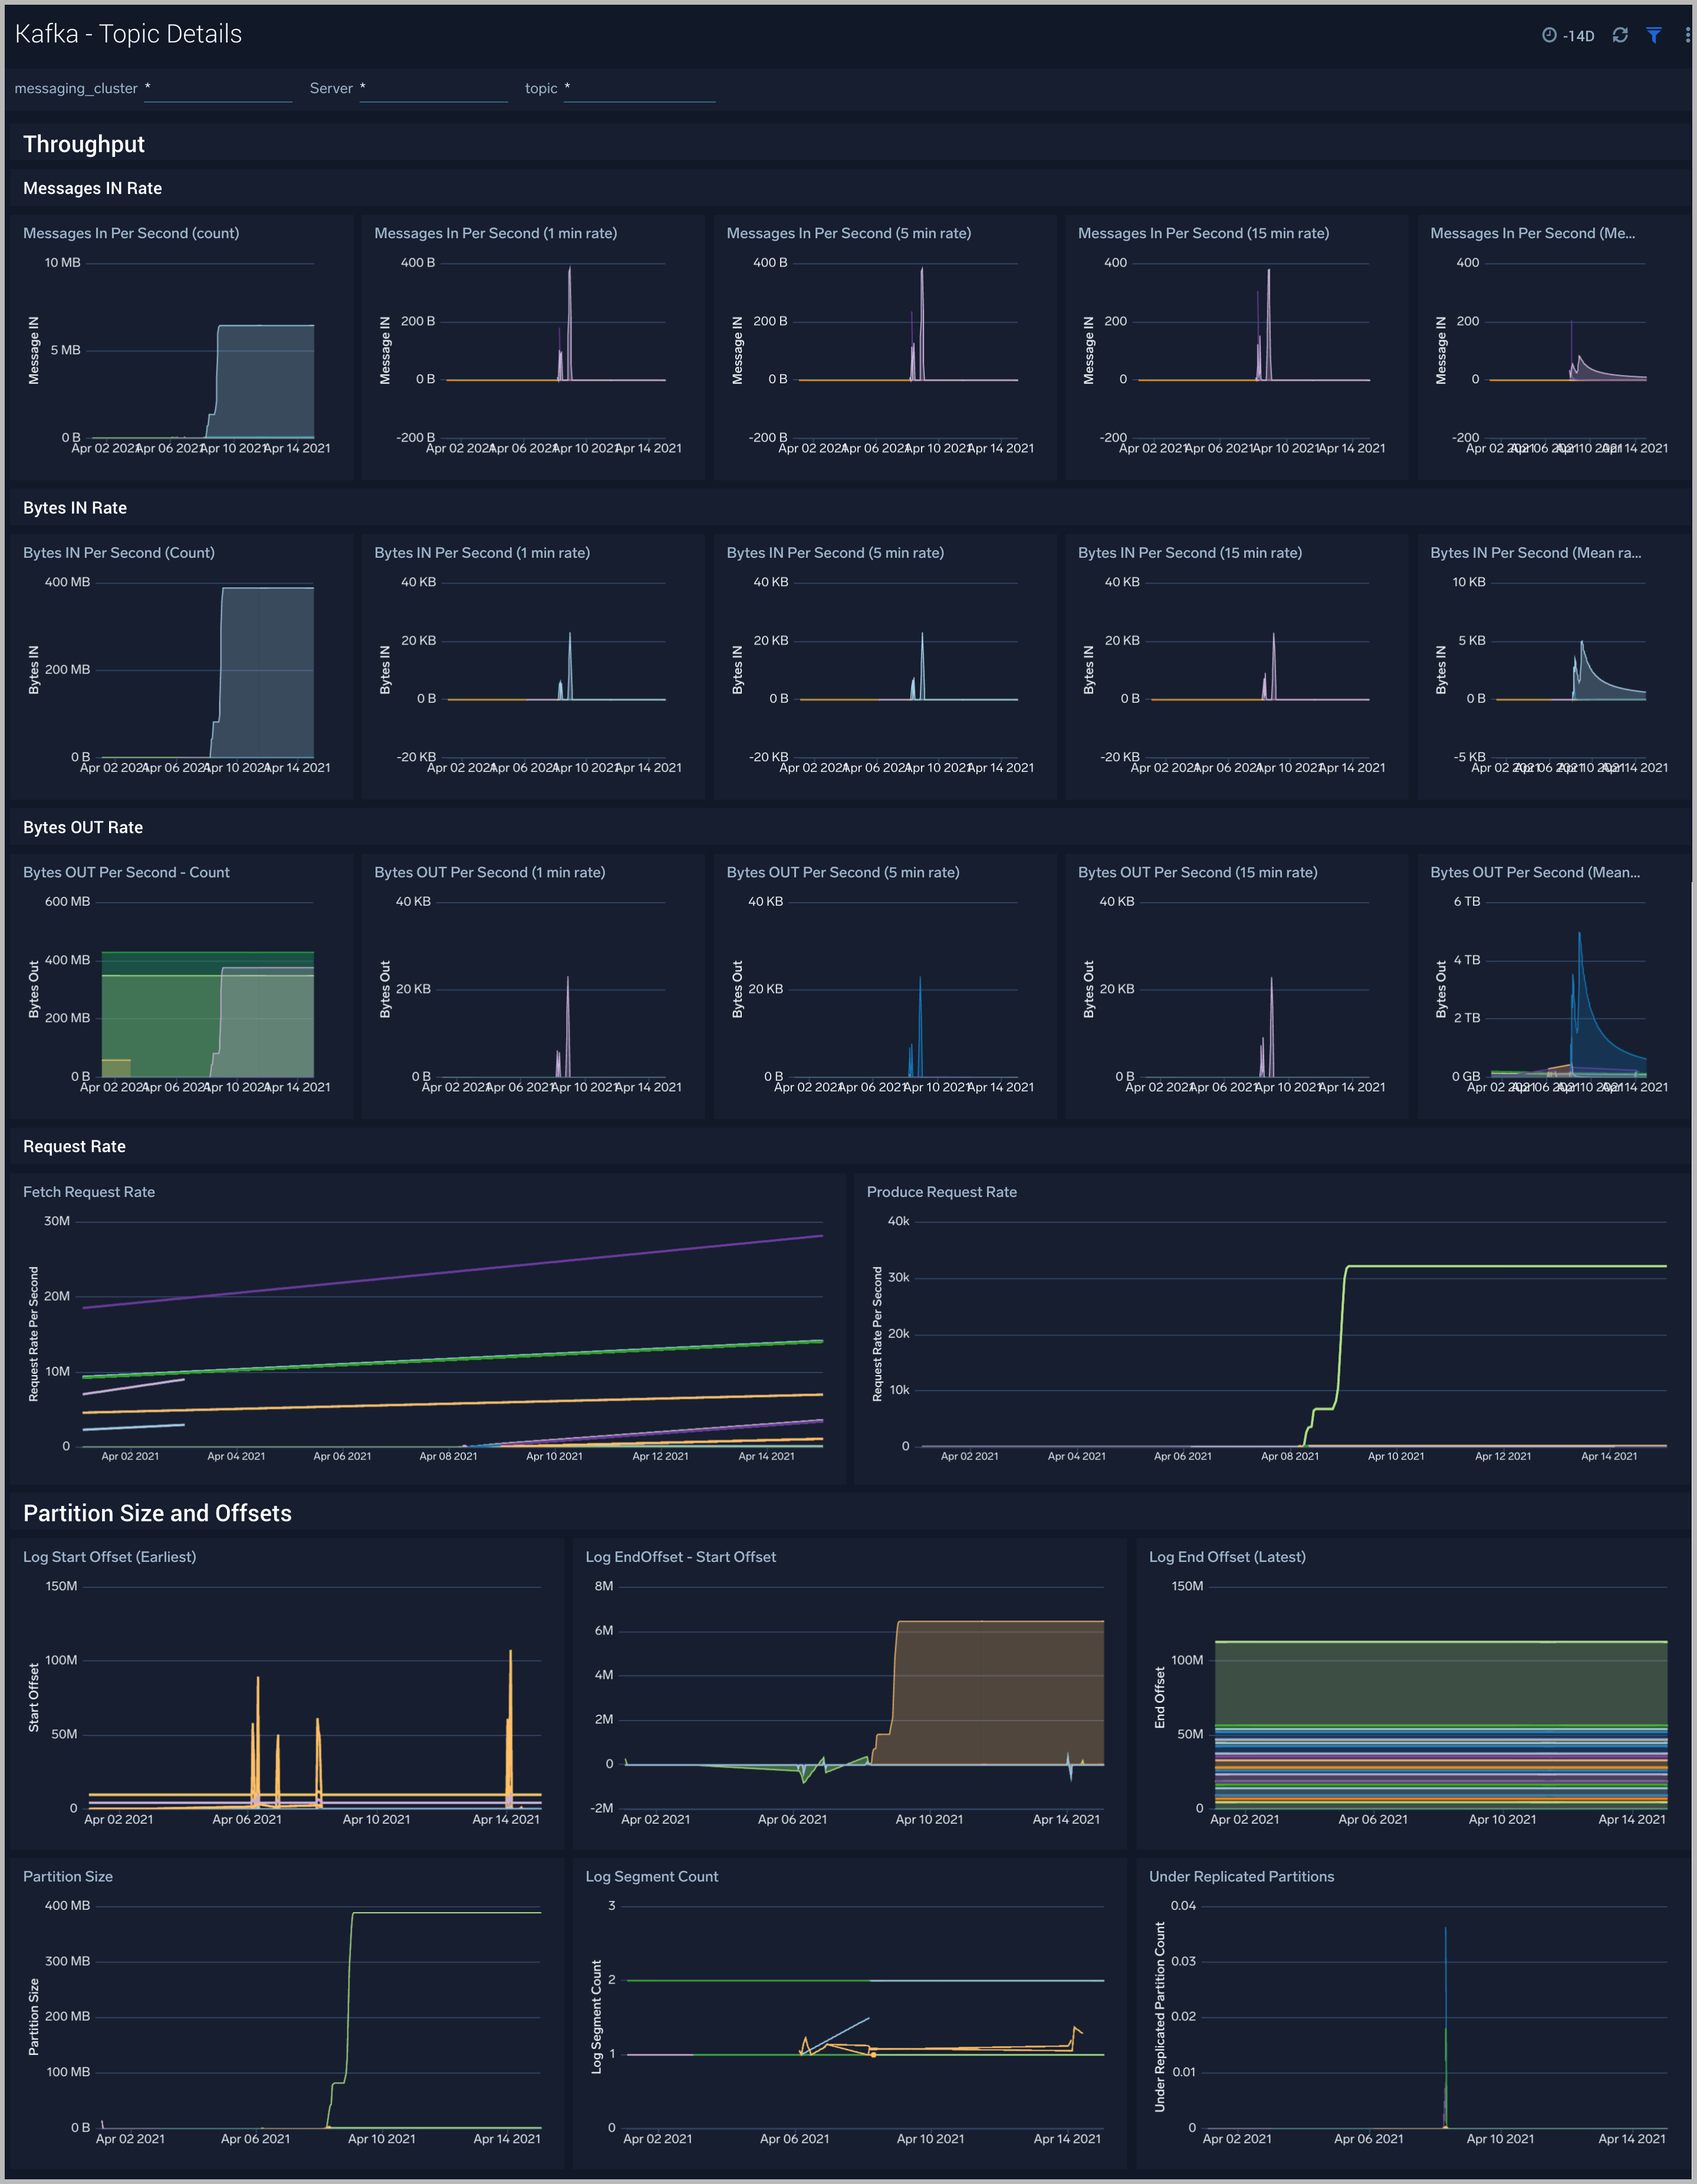
Strimzi Kafka - Topic Details
The Strimzi Kafka - Topic Details dashboard gives you insight into throughput, partition sizes, and offsets across Kafka brokers, topics, and clusters.
Use this dashboard to:
- Monitor metrics like Log partition size, log start offset, and log segment count metrics.
- Identify offline/under-replicated partitions count. Partitions can be in this state on account of resource shortages or broker unavailability.
- Monitor the In Sync replica (ISR) Shrink rate. ISR shrinks occur when an in-sync broker goes down, as it decreases the number of in-sync replicas available for each partition replica on that broker.
- Monitor In Sync replica (ISR) Expand rate. ISR expansions occur when a broker comes online, such as when recovering from a failure or adding a new node. This increases the number of in-sync replicas available for each partition on that broker.
Create monitors for Strimzi Kafka app
From your App Catalog:
- From the Sumo Logic navigation, select App Catalog.
- In the Search Apps field, search for and then select your app.
- Make sure the app is installed.
- Navigate to What's Included tab and scroll down to the Monitors section.
- Click Create next to the pre-configured monitors. In the create monitors window, adjust the trigger conditions and notifications settings based on your requirements.
- Scroll down to Monitor Details.
- Under Location click on New Folder.
note
By default, monitor will be saved in the root folder. So to make the maintenance easier, create a new folder in the location of your choice.
- Enter Folder Name. Folder Description is optional.
tip
Using app version in the folder name will be helpful to determine the versioning for future updates.
- Click Create. Once the folder is created, click on Save.
Strimzi Kafka alerts
| Alert Name | Alert Description and conditions | Alert Condition | Recover Condition |
|---|---|---|---|
| Strimzi Kafka - High Broker Disk Utilization | This alert fires when we detect that a disk on a broker node is more than 85% full. | >=85 | < 85 |
| Strimzi Kafka - Failed Zookeeper connections | This alert fires when we detect Broker to Zookeeper connection failures. | ||
| Strimzi Kafka - High Leader election rate | This alert fires when we detect a high leader election rate. | ||
| Strimzi Kafka - Garbage collection | This alert fires when we detect that the average Garbage Collection time on a given Kafka broker node over a 5-minute interval is more than one second. | > = 1 | < 1 |
| Strimzi Kafka - Offline Partitions | This alert fires when we detect offline partitions on a given Kafka broker. | ||
| Strimzi Kafka - Fatal Event on Broker | This alert fires when we detect a fatal operation on a Kafka broker node | >=1 | <1 |
| Strimzi Kafka - Underreplicated Partitions | This alert fires when we detect underreplicated partitions on a given Kafka broker. | ||
| Strimzi Kafka - Large number of broker errors | This alert fires when we detect that there are 5 or more errors on a Broker node within a time interval of 5 minutes. | ||
| Strimzi Kafka - High CPU on Broker node | This alert fires when we detect that the average CPU utilization for a broker node is high (>=85%) for 5 minutes. | ||
| Strimzi Kafka - Out of Sync Followers | This alert fires when we detect that there are Out of Sync Followers within a time interval of 5 minutes. | ||
| Strimzi Kafka - High Broker Memory Utilization | This alert fires when the average memory utilization within a 5-minute interval for a given Kafka node is high (>=85%). | >= 85 | < 85 |