VMware Legacy

A newer app, VMware ULM, is available. The App on this page is based on the vMA technology running on legacy vSphere versions 6.0 and prior. The vMA technology is no longer supported by VMware.
The Sumo Logic App for VMware allows you to:
- Collect and centralize logs from the entire VMware infrastructure, including ESX/ESXi, vCenter Server, and individual virtual machines as well as operating system and applications running ESXi, vCenter Server, and individual virtual machines as well as operating system and applications running within the virtual machine.
- Troubleshoot VMware farms and find issues related to over-provisioning VMs, "noisy neighbors", changes to configuration, and VM movement.
- Monitor the entire VMware infrastructure through real-time Dashboards that provide insight into key metrics such as VM CPU, memory and disk utilization. Determine capacity constrained and under-provisioned physical hosts and idle VMs to improve deployment strategy and optimize cost.
Software Versions
The Sumo Logic App for VMware works with vCenter and vSphere 5.0, 5.1.0.1, 5.0.0.2, 5.5, and 6.0.
- For vCenter and vSpherevMA 5.0 or its dot releases, use vMA 5.0, 5.0.0.1, or 5.0.0.2.
- For vMA version 5.1, use the vMA 5.1 Patch 1, found here
- For vCenter and vSphere 5.5, use vMA 5.5.
- For vCenter and vSphere 6.0, use vMA 6.0.
For vSphere 6.5 and later please use Sumo Logic App for VMware ULM.
Because vSphere CLI 5.1 has known issues with resxtop and SSL certifications, be sure to use vMA 5.1 Patch 1 (5.1.0.1). (The known issues in 5.1 are documented in the Release Notes.)
Log types
The Sumo Logic App for VMware collects logs from vCenter Servers to analyze vCenter Server Events and Performance Data in real time to enable monitoring and detect important events within your virtual environment.
For information on collecting unified logs and metrics for VMware, see VMware ULM.
Sample log messages
2017-09-25 22:09:45.123 +0000 2013-11-19T10:03:35.042999Z ,,, message=Task: Delete virtual machine,,,user=SUMO\USER,,,vm=VMNAME,,,host=HOSTNAME.sumolab.org
Sample queries
 _sourceCategory=esx_perf OR _sourceCategory=vcenter_log "message=User "
 | parse "message=User * *,,," as user,task
 | timeslice 5m
 | count as count by _timeslice,task
 | transpose row _timeslice column task as *
_sourceCategory=esx_perf OR _sourceCategory=vcenter_log "Memory" AND "NonKernel MBytes"
| parse "\\\\*\\Memory\\NonKernel MBytes: *" as esx_server,mbytes
| timeslice by 1h
| avg(mbytes) as mbytes by _timeslice,esx_server
| transpose row _timeslice column esx_server
Sumo Logic Scripts for VMware
The Sumo Logic scripts required to work with the app are located at sumo-vsphere-ulm.zip.
For vMA 6.0, use the script package for vSphere 5.5.
Make sure to download the package for your version of vMA and vCenter.
Collect logs for the VMware (Legacy) App
A newer app, VMware ULM, is available. The App on this page is based on the vMA technology running on legacy vSphere versions 6.0 and prior. The vMA technology is no longer supported by VMware.
The logs collected from vCenter Servers enable you to use the Sumo Logic Application for VMware search, visualize, and analyze vCenter Server Events and Performance Data in real time to enable monitoring and detect important events within your virtual environment.
Setting up a vMA Server to Collect Data
Before setting up a source to collect data, you'll need to install vMA through the vCenter Server (if it's not already installed) and then download and install a Collector.
Step 1: Install vMA
vMA is an appliance (SUSE virtual machine) that includes vSphere CLI, and vSphere SDK for Perl. It allows administrators to run scripts or agents that interact with ESXi hosts and vCenter Server systems without having to authenticate each time.
To set up vMA:
- Download vMA from VMware, and follow the accompanying instructions to deploy the OVF. Go to the vCenter Server through vSphere client, then choose File > Deploy OVF Template.
Because vSphere 5.1 has known issues with resxtop and SSL certifications, be sure to use vMA 5.1 Patch 1 (5.1.0.1). (The known issues in 5.1 are documented in the vMA 5.1 Patch 1 (5.1.0.1). (The known issues in 5.1 are documented in the Release Notes.
- Setup the authentication, timezone, and time for the vMA by following instructions in the VMware documentation.
- Take note to specify a user account in the next step that has adequate permissions on the vCenter servers. This user account will just need the Global.Service managers privilege to view only RESXTOP data. Refer this link for details.
Run credstore_admin.pl on the vMA to add credentials for each vCenter server that generates performance and event data you'd like to collect. This script comes by default with the vSphere Perl SDK. On the vMA it's located under /usr/lib/vmware-vcli/apps/general. (See this VMware KB article for more information). For example, to add a user's account on a vCenter Server you can run:
/usr/lib/vmware-vcli/apps/general/credstore_admin.pl list
In UNIX, when you pass a parameter to a script (credstore_admin.pl in this case), use quotation marks to enclose values containing spaces or special characters like backslash. For example:
vi-admin@yourservername:/usr/lib/vmware-vcli/apps/general> ./credstore_admin.pl add --server 14.3.2.11
--username "domainname\account name" --password 345345345
Run the following command to verify that authentication is set up correctly and to see a list of network interfaces:
esxcli --server <vcenter host> --vihost <esxi host> network nic list
For example, if we run the following, we'll see a list of network interfaces for the ESXi host (192.168.23.24) managed by our vCenter Server (192.168.23.242):
esxcli --server 192.168.23.242 --vihost 192.168.23.24 network nic
For vCenter 6.0, if you receive an error like the following:
Connect to <your vCenter Server> failed. Server SHA-1 thumbprint: <Your vCenter Thumbprint> (not trusted).
- Run the following command to allow the connection:
/usr/lib/vmware-vcli/apps/<wbr/>general/credstore_admin.pl add -s <your vCenter Server>
--thumbprint <Thumbprint Above>
Step 2: Download and Install the Collector on vMA
- Download the appropriate Collector executable from this topic: Download a Collector from a Static URL.
- On the vMA machine, use wget or curl to download the file from the URL. The URL must be enclosed in double-quotes to work with wget. For example:
sudo wget "https://collectors.sumologic.com/rest/download/linux/64" \
-O SumoCollector.sh
From the download directory, run the installation file SumoCollector.sh as root. First, make sure root has executable privileges for the file by running:
sudo chmod 740 SumoCollector.sh
- Run the install file on your server with root privileges:
$ sudo ./SumoCollector.sh
- The Collector runs as a service and starts automatically after installing or rebooting.
Collecting Event Messages
An event is an action that triggers an event message on a vCenter Server. Event messages are not logged, but are instead stored in the vCenter Server database. Sumo Logic for VMware retrieves these messages using the vSphere Perl SDK that comes with vMA (by default).
Step 1: Configure a Syslog Source for the Collector
A Sumo Logic Syslog Source operates like a Syslog server listening on the designated port to receive Syslog messages.
- Classic UI. In the main Sumo Logic menu, select Manage Data > Collection > Collection.
New UI. In the Sumo Logic top menu select Configuration, and then under Data Collection select Collection. You can also click the Go To... menu at the top of the screen and select Collection. - Click Add Source.
- Select Syslog for the Source type.
- Enter a Name to display for this Source. Source name metadata is stored in a searchable field called _sourceName.
- For Protocol choose TCP.
- Enter the Port number for the Source to listen to (for example, 1514, but choose the correct port for your Collector).
- For Source Category, we recommend using vcenter_log.
- Under Advanced, set the following options:
- Select Extract timestamp information from log file entries.
- Select Ignore time zone from log file and instead use and then choose UTC from the menu (as shown below).
- Click Save.
Step 2: Configure Logs to be Collected
- On the vMA, create a directory to hold all Sumo Logic scripts, found under Sumo Logic Scripts for VMware. Name the directory /var/log/vmware or something similar.
- Download the Sumo Logic VMware scripts using the vSphere5.0.gz and vSphere5.5.gz links on this page, then put them in the directory you just created.
- We will assume the user account running the Sumo Logic vmware scripts is the "vi-admin" user. This user account should not be a "root" user and should have full read write execute permissions to the directories where the vSphere5.0.gz and vSphere5.5.gz files are extracted. In the absence of adequate permissions, unexpected script errors will occur.
- Edit the cron_vcenter_events.sh script by changing the
SCRIPT_PATHvariable to reflect the absolute path where the script resides. If you have multiple vCenter servers, create a new line for each one. Make sure you add the credential for each server (as described in Install vMA). - Test running the query_vCenter.pl script (that queries the vCenter Server for events) as described in Troubleshooting and Manual Testing. Use the following example command:
query_vCenter.pl -s [vcenterserver] -f output.txt - Create a cron job to periodically run the cron_vcenter_events.sh script at the interval you'd like.
You'll need to have the LD_LIBRARY_PATH env variable in the crontab line. For example, to run the job every two minutes, you'd use something like:
*/2 * * * * LD_LIBRARY_PATH=:/opt/vmware/vma/lib64:/opt/vmware/vma/lib /var/log/vmware/cron_vcenter_events.sh
Collect Performance Logs
Collecting performance logs involves using VMware tools and scripts running on vMA to extract performance statistics.
Step 1: Configure a Local File Source
Configure a Local File Source.
- Classic UI. In the main Sumo Logic menu, select Manage Data > Collection > Collection.
New UI. In the Sumo Logic top menu select Configuration, and then under Data Collection select Collection. You can also click the Go To... menu at the top of the screen and select Collection. - Click Add Source for your vCenter Server Collector.
- Select Local File for the Source type.
- Enter a Name to display for this Source. Source name metadata is stored in a searchable field called
_sourceName. - For File Path, enter /var/log/vmware/*.perf.out.
- For Source Category, enter esx_perf.
- Under Advanced, make sure that Timestamp Parsing is selected. Then for Time Zone choose the time zone of the vMA virtual machine.
- Click Save.
Step 2: Configure Performance Logs for Collection
Before collecting can begin, you'll need to invoke scripts to transform the performance data from the resxtop utility so it's delivered in a format that Sumo Logic can consume.
- On the vMA, create a directory to hold all scripts (for example, /var/log/vmware).
- Extract all files from the Zip bundle provided by Sumo Logic to the directory you just created. Edit the vcenter.info file so one vCenter Server and one username is on each line. For example:
vcenter01.company.com "domain_name\user_name"
vcenter02.company.com "domain_name\user_name"
vcenter03.company.com "domain_name\user_name"
- Make sure there are no blank lines or header lines in the vcenter.info file.
- Run /usr/lib/vmware-vcli/apps/general/credstore_admin.pl list to get a list of all the vCenter Servers you have already configured for authentication.
- Edit the following in the cron_vcenter_perf.sh script:
- Change the SCRIPT_PATH variable to reflect the absolute path where the script resides.
- Select the method you'd like to use to collect performance data. Then, uncomment the line that calls $SCRIPT_PATH/getserver_perf.pl. For more information, see Segmenting Collection.
Test the command used in the cron script before testing the cron command and enabling it as described in Troubleshooting and Manual Testing.
$SCRIPT_PATH/getserver_perf.pl -type=vcenter -path=$SCRIPT_PATH -server_file=$SCRIPT_PATH/vcenter.info
-output_file=$SCRIPT_PATH/vcenter_all.perf.out
Run the cron_vcenter_perf.sh script. After it finishes, verify that performance logs are being collected. You should see the esxi.perf.out file in the above $SCRIPT_PATH directory; the file should have at least 7000-8000 messages per ESXi server that is managed by a vCenter.
The script collects all the default performance data returned by the resxtop utility. If however, you need to collect only certain performance related data, then invoke resxtop on the VMA machine in interactive mode, select only the panels and columns that you want to collect, and then save the configuration in the /home/vi-admin/. file. The script package also contains a configuration file (esxtop50rc) for the metrics used by the app. To use it, you add -c to the four entries in the getserver_perf5.5.pl file where you will see /usr/bin/resxtop. You will need to insert -c esxtop50rc after / usr /bin/resxtop. For information on invoking resxtop in interactive mode, refer to VMware documentation.
For example, in line 138, change:
echo \'$pwd\' | /usr/bin/resxtop --server $host --username $user -b -n $iterations > $local_csv_file `;`
to
echo \'$pwd\' | /usr/bin/resxtop --server $host -c esxtop50rc --username $user -b -n $iterations > $local_csv_file;
Another way to reduce the amount of data is to reduce the frequency of running cron_vcenter_perf.sh (see below).
If you see output that looks like the example below, this is a password echo, and not a password prompt. It is a sign that the script is working.
vi-admin@<vma-hostname>>~
/opt/SumoScripts/cron_vcenter_perf.sh
vi-admin's password:
domain_name\user_name password:
*/15 * * * * LD_LIBRARY_PATH=:/opt/vmware/vma/lib64:/opt/vmware/vma/lib /var/log/vmware/cron_vcenter_perf.sh
- Create a cron job to periodically run the cron_vcenter_perf.sh script. For example, to run the script every 15 minutes, it would look like:
Understand vCenter Scripts
In this section, we'll walk you through a few important tasks that involve the query_vCenter.pl script, or query_vCenter5.5.pl, depending on the exact version you are using. These scripts query the vCenter Server for events.
Troubleshooting and Manual Testing
Test the query_vCenter.pl script before setting up a CRON job.
To test the query_vCenter.pl script, go to the folder that holds all the scripts (for example, /var/log/vmware) and run:
query_vCenter.pl -s [vcenterserver] -f output.txt
#Replace [vCenterServer] with the name of the \
#target vCenter Server in your environment.
In the standard output, you should see the query time range and the number of events collected. The events themselves are stored inside the output.txt file. If you're prompted to enter a username or password, it means that the credentials for the target vCenter Server are not set properly. By default, the first time query_vCenter is called, events from the past 24 hours are collected. If you want to collect events older than the past 24 hours, see Collect Historical Events.
Because the above information is logged into /var/log/message for cron jobs, it's a good idea to monitor /var/log/messages to make sure the collection CRON jobs work well.
Collect Historical Events
By default, the first time query_vCenter.pl is called, events from the past 24 hours are collected. Each time the script is called, it writes the timestamp of the last read event in a file named .timelog for the next call to pick up.
If you want to collect events older than the past 24 hours, before setting up the CRON job for cron_vcenter_events.sh, do the following on the VMA machine.
To collect historical events:
- Go to the vi-admin home directory, at /home/vi-admin.
Set the SCRIPT_PATH environment variable to point to where all the Sumo Logic for VMware scripts reside. For example:
vi-admin@vma1:~> export SCRIPT_PATH=/var/log/vmware
- Run the query_vCenter.pl script as follows:
./query_vCenter.pl --server <vcenter server> --target <syslog host>:<syslog port> --bT <time in UTC>
- The syslog server should reflect the IP address or hostname of the vMA machine; the
syslog_portshould reflect the port number that you previously set up for the Source responsible for collecting vCenter Server Events. For example, to collect all events starting from 5:00pm on October 8, 2012 in the UTC timezone, you would run the following command:
./query_vCenter.pl --server 192.168.23.242 --target vmahost:1514 --bT 2012-10-08T00:17:00.00Z
Once this command completes successfully, you can begin to pick up ongoing events by setting up the CRON job as described in step 2 of Collecting Event Messages.
Segmenting Performance Collection
Performance data collection for ESXi servers associated with a vCenter server works by sequentially getting data from each ESXi server. Having a large number of servers associated with a vCenter can cause delays. To avoid delays, you can parallelize collection by creating multiple segments from the list of ESXi servers associated with a vCenter server. The number of segments would depend on the amount of data you are collecting and how often you would like to collect performance data.
For example, let's say you have a 100 ESXi servers associated with a single vCenter server; it takes more than 2 minutes for the performance collection script to collect data from all ESXi servers. If you need to collect performance data snapshots every 2 minutes, you'd segment the collection into two or more instances of the cron_vcenter_perf.sh script to parallelize collection.
Or, if you have 100ESXi servers and five segments, then each segment would have 20 servers. However, if there's an odd number of servers, say 145 servers and 6 segments, then 5 segments have 24 servers, and the last (6th) segment will have 20 servers.
The total number of segments is specified by the -segments option, and the segment number we want to run is specified by the segment_number option.
Before collecting from multiple segments, you can test how ESXi servers will be divided up into segments by using the -test option. For example, to test which servers get assigned to each segment assuming you have two segments, you would run the following command:
$SCRIPT_PATH/getserver_perf.pl -test -type=vcenter -path=$SCRIPT_PATH -server_file=$SCRIPT_PATH/vcenter.info
-output_file=$SCRIPT_PATH/vcenter_segments.perf.out -segments=2 -segment_number=1 | /bin/logger
Then to get performance data just for segment one, you can run this command:
$SCRIPT_PATH/getserver_perf.pl -type=vcenter -path=$SCRIPT_PATH -server_file=$SCRIPT_PATH/vcenter.info
-output_file=$SCRIPT_PATH/vcenter_segment-3.perf.out -segments=2 -segment_number=1 | /bin/logger
and so on.
Once you are satisfied with the time it takes for collecting data for a segment, create multiple scripts to collect data for each segment based on the cron_vcenter_perf.sh script. Schedule these scripts to run as a cron job according to the desired frequency.
Install the VMware (Legacy) App
A newer app, VMware ULM, is available. The App on this page is based on the vMA technology running on legacy vSphere versions 6.0 and prior. The vMA technology is no longer supported by VMware.
Now that you have set up collection, install the Sumo Logic App for VMware to use the preconfigured searches and dashboards that provide insight into your data.
To install the app:
- Select App Catalog.
- In the 🔎 Search Apps field, run a search for your desired app, then select it.
- Click Install App.
note
Sometimes this button says Add Integration.
- On the next configuration page, under Select Data Source for your App, complete the following fields:
- Data Source. Select one of the following options:
- Choose Source Category and select a source category from the list; or
- Choose Enter a Custom Data Filter, and enter a custom source category beginning with an underscore. For example,
_sourceCategory=MyCategory.
- Folder Name. You can retain the existing name or enter a custom name of your choice for the app.
- All Folders (optional). The default location is the Personal folder in your Library. If desired, you can choose a different location and/or click New Folder to add it to a new folder.
- Data Source. Select one of the following options:
- Click Next.
- Look for the dialog confirming that your app was installed successfully.
Post-installation
Once your app is installed, it will appear in your Personal folder or the folder that you specified. From here, you can share it with other users in your organization. Dashboard panels will automatically start to fill with data matching the time range query received since you created the panel. Results won't be available immediately, but within about 20 minutes, you'll see completed graphs and maps.
Viewing VMware Dashboards
vCenter Operations Overview
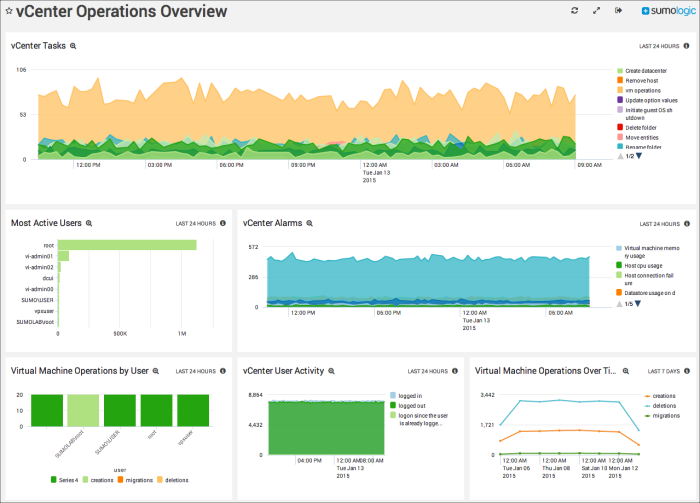
vCentervCenter Tasks. Displays the number of administrative tasks performed as an area chart on a timeline with a legend that describes each task. Provides information for the last 24 hours.
Most Active Users. Provides the top 10 most active users as a bar chart over the last 24 hours.
vCentervCenter Alarms. Displays vCenter alarms logged as an area chart on a timeline for the last 24 hours, including a legend of terms.vCenter alarms logged as an area chart on a timeline for the last 24 hours, including a legend of terms.
Virtual Machine Operations by User. Provides a column chart of operations performed by user for the last 24 hours.
vCentervCenter User Activity. Displays an area chart of vCenter user activity on a timeline for the last 24 hours.vCenter user activity on a timeline for the last 24 hours.
Virtual Machine Operations Over Time. Provides a line chart of virtual machine operations on a timeline for the last week.
System Wide ESXi Performance
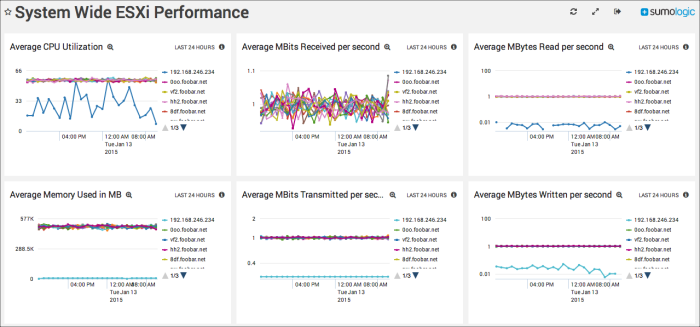
Average CPU Utilization. Displays the average CPU utilization by IP address in a line chart on a timeline for the last 24 hours.
Average MBits Received per second. Provides details on the average number of MBits received per IP address per second in a line chart on a timeline for the last 24 hours.
Average MBytes Read per second. Displays the average number of MBytes read per IP address per second in a line chart on a timeline for the last 24 hours.
Average Memory Used in MB. Provides details on the average memory used in MB per IP address in a line chart on a timeline for the last 24 hours.
Average MBits Transmitted per second. Displays the average number of MBits transmitted per IP address per second in a line chart on a timeline for the last 24 hours.
Average MBytes Written per second. Provides details on the average number of MBytes written per IP address per second in a line chart on a timeline for the last 24 hours.