MongoDB - Classic Collector
MongoDB is a source-available cross-platform document-oriented database program. The Sumo Logic app for MongoDB supports logs and metrics from the open source version of MongoDB. The app is tested on the 4.4.4 version of MongoDB.
Log types
The MongoDB logs are generated in files as configured in the configuration file /var/log/mongodb/mongodb.log. For more details on MongoDB logs, see this link.
The Sumo Logic app for MongoDB supports metrics generated by the MongoDB plugin for Telegraf. The app assumes prometheus format Metrics.
Sample log messages
{
	"t":{
		"$date":"2021-05-21T10:22:57.373+00:00"
	},
	"s":"I",
	"c":"NETWORK",
	"id":51800,
	"ctx":"conn500659",
	"msg":"client metadata",
	"attr":{
		"remote":"127.0.0.1:49472",
		"client":"conn500659",
		"doc":{
			"application":{
				"name":"MongoDB Shell"
			},
			"driver":{
				"name":"MongoDB Internal Client",
				"version":"4.4.4"
			},
			"os":{
				"type":"Linux",
				"name":"PRETTY_NAME=\"Debian GNU/Linux 10 (buster)\"",
				"architecture":"x86_64",
				"version":"Kernel 4.4.0-62-generic"
			}
		}
	}
}
Sample queries
environment=* db_cluster=* db_system=mongodb  | json "log" as _rawlog nodrop
| if (isEmpty(_rawlog), _raw, _rawlog) as _raw
| json field=_raw "t.$date" as timestamp
| json field=_raw "s" as severity
| json field=_raw "c" as component
| json field=_raw "ctx" as context
| json field=_raw "msg" as msg
| where severity in ("E")
| count by component
Collecting logs and metrics for MongoDB
This section provides instructions for configuring log and metric collection for the Sumo Logic app for MongoDB.
Configure Collection for MongoDB
- Kubernetes environments
- Non-Kubernetes environments
In Kubernetes environments, we use the Telegraf Operator, which is packaged with our Kubernetes collection. You can learn more about it here.The diagram below illustrates how data is collected from MongoDB in a Kubernetes environment. In the architecture shown below, there are four services that make up the metric collection pipeline: Telegraf, Telegraf Operator, Prometheus, and Sumo Logic Distribution for OpenTelemetry Collector.
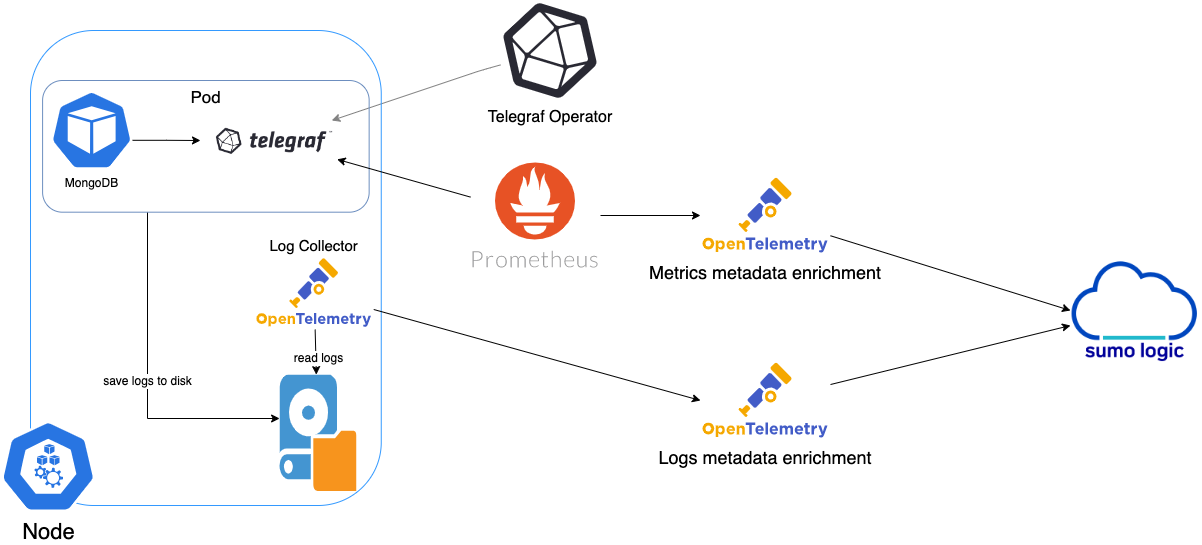
The first service in the metrics pipeline is Telegraf. Telegraf collects metrics from MongoDB. Note that we’re running Telegraf in each pod we want to collect metrics from as a sidecar deployment for example, Telegraf runs in the same pod as the containers it monitors. Telegraf uses the MongoDB input plugin to obtain metrics. (For simplicity, the diagram doesn’t show the input plugins.) The injection of the Telegraf sidecar container is done by the Telegraf Operator. Prometheus pulls metrics from Telegraf and sends them to Sumo Logic Distribution for OpenTelemetry Collector which enriches metadata and sends metrics to Sumo Logic.
In the logs pipeline, Sumo Logic Distribution for OpenTelemetry Collector collects logs written to standard out and forwards them to another instance of Sumo Logic Distribution for OpenTelemetry Collector, which enriches metadata and sends logs to Sumo Logic.
It’s assumed that you are using the latest helm chart version. If not, upgrade using the instructions here.
Configure Metrics Collection
This section explains the steps to collect MongoDB metrics from a Kubernetes environment.
- Set up Kubernetes Collection with the Telegraf Operator.
- On your MongoDB Pods, add the following annotations:
annotations:
  telegraf.influxdata.com/class: sumologic-prometheus
  prometheus.io/scrape: "true"
  prometheus.io/port: "9273"
  telegraf.influxdata.com/inputs: |+
[[inputs.mongodb]]
  servers = ["mongodb://<username-CHANGEME>:<password-CHANGEME>@127.0.0.1:27017"]
  gather_perdb_stats = true
  gather_col_stats = true
  [inputs.mongodb.tags]
    environment ="ENV_TO_BE_CHANGED"
    component ="database"
    db_system ="mongodb"
    db_cluster ="ENV_TO_BE_CHANGED"
    db_cluster_address = "ENV_TO_BE_CHANGED"
    db_cluster_port = "ENV_TO_BE_CHANGED"
- Please enter values for the following parameters (marked
ENV_TO_BE_CHANGEDabove):telegraf.influxdata.com/inputs. This contains the required configuration for the Telegraf MongoDB Input plugin. Please refer to this doc for more information on configuring the MongoDB input plugin for Telegraf. Note: As telegraf will be run as a sidecar the host should always be localhost.- In the input plugins section (
[inputs.MongoDB]):servers- The URL to the MongoDB server. This can be a comma-separated list to connect to multiple MongoDB servers. Please see this doc for more information on additional parameters for configuring the MongoDB input plugin for Telegraf.
- In the tags section (
[inputs.MongoDB.tags]):environment. This is the deployment environment where the MongoDB cluster identified by the value of servers resides. For example: dev, prod or qa. While this value is optional we highly recommend setting it.db_cluster. Enter a name to identify this MongoDB cluster. This cluster name will be shown in the Sumo Logic dashboards.db_cluster_address- Enter the cluster hostname or ip address that is used by the application to connect to the database. It could also be the load balancer or proxy endpoint.db_cluster_port- Enter the database port. If not provided, a default port will be used.
- In the input plugins section (
db_cluster_address and db_cluster_port should reflect the exact configuration of DB client configuration in your application, especially if you instrument it with OT tracing. The values of these fields should match exactly the connection string used by the database client (reported as values for net.peer.name and net.peer.port metadata fields).
For example, if your application uses “mongodb-prod.sumologic.com:3306” as the connection string, the field values should be set as follows: db_cluster_address=mongodb-prod.sumologic.com db_cluster_port=3306
If your application connects directly to a given mongodb node, rather than the whole cluster, use the application connection string to override the value of the “host” field in the Telegraf configuration: host=mongodb-prod.sumologic.com
Pivoting to Tracing data from Entity Inspector is possible only for “MongoDB address” Entities.
- Do not modify the following values as it will cause the Sumo Logic app to not function correctly.
telegraf.influxdata.com/class: sumologic-prometheus. This instructs the Telegraf operator what output to use. This should not be changed.prometheus.io/scrape: "true". This ensures our Prometheus will scrape the metrics.prometheus.io/port: "9273". This tells prometheus what ports to scrape on. This should not be changed.telegraf.influxdata.com/inputs- In the tags section (
[inputs.mongodb.tags]):component: “database”- This value is used by Sumo Logic apps to identify application components.db_system: “mongodb”- This value identifies the database system.
- In the tags section (
- See this doc for more parameters that can be configured in the Telegraf agent globally.
- Sumo Logic Kubernetes collection will automatically start collecting metrics from the pods having the labels and annotations defined in the previous step.
- Verify metrics in Sumo Logic.
Configure Logs Collection
This section explains the steps to collect MongoDB logs from a Kubernetes environment.
- Add labels on your MongoDB pods to capture logs from standard output on Kubernetes. Make sure that the logs from MongoDB are sent to stdout. For more details, see this doc.
- Apply following labels to the MongoDB pods:
labels:
    environment: "prod"
    component: "database"
    db_system: "mongodb"
db_cluster: "mongodb_prod_cluster01"- Enter in values for the following parameters:
environment. This is the deployment environment where the MongoDB cluster identified by the value of servers resides. For example: dev, prod or qa. While this value is optional we highly recommend setting it.db_cluster. Enter a name to identify this MongoDB cluster. This cluster name will be shown in the Sumo Logic dashboards.db_cluster_address- Enter the cluster hostname or ip address that is used by the application to connect to the database. It could also be the load balancer or proxy endpoint.db_cluster_port- Enter the database port. If not provided, a default port will be used.
db_cluster_address and db_cluster_port should reflect exact configuration of DB client configuration in your application, especially if you instrument it with OT tracing. The values of these fields should match exactly the connection string used by the database client (reported as values for net.peer.name and net.peer.port metadata fields).
For example, if your application uses “mongodb-prod.sumologic.com:3306” as the connection string, the field values should be set as follows: db_cluster_address=mongodb-prod.sumologic.com db_cluster_port=3306
If your application connects directly to a given mongodb node, rather than the whole cluster, use the application connection string to override the value of the “host” field in the Telegraf configuration: host=mongodb-prod.sumologic.com.
Pivoting to Tracing data from Entity Inspector is possible only for “MongoDB address” Entities.
- Do not modify the following values as they will cause the Sumo Logic apps to not function correctly.
component: “database”. This value is used by Sumo Logic apps to identify application components.db_system: “mongodb”. This value identifies the database system.
- See this doc for more parameters that can be configured in the Telegraf agent globally.
- Collecting MongoDB Logs from a Log File (Optional). Follow the steps below to capture MongoDB logs from a log file on Kubernetes.
- Determine the location of the MongoDB log file on Kubernetes. This can be determined from the MongoDB.conf for your MongoDB cluster along with the mounts on the MongoDB pods.
- Install the Sumo Logic tailing sidecar operator.
- Add the following annotation in addition to the existing annotations.
Example:annotations:
tailing-sidecar: sidecarconfig;<mount>:<path_of_MongoDB_log_file>/<MongoDB_log_file_name>annotations:
tailing-sidecar: sidecarconfig;data:/mongo-prim-data/MongoDB.log- Make sure that the MongoDB pods are running and annotations are applied by using the command:
kubectl describe pod <MongoDB_pod_name>- Sumo Logic Kubernetes collection will automatically start collecting logs from the pods having the annotations defined above.
FER to normalize the fields in Kubernetes environments. Labels created in Kubernetes environments automatically are prefixed with pod_labels. To normalize these for our app to work, a Field Extraction Rule named AppObservabilityMongoDBDatabaseFER is automatically created for Database Application Components.
In non-Kubernetes environments, we use the Telegraf operator for MongoDB metric collection and Sumo Logic Installed Collector for collecting MongoDB logs. The diagram below illustrates the components of the MongoDB collection in a non-Kubernetes environment. Telegraf runs on the same system as MongoDB, and uses the MongoDB input plugin to obtain MongoDB metrics, and the Sumo Logic output plugin to send the metrics to Sumo Logic. Logs from MongoDB on the other hand are sent to either a Sumo Logic Local File source or Syslog source.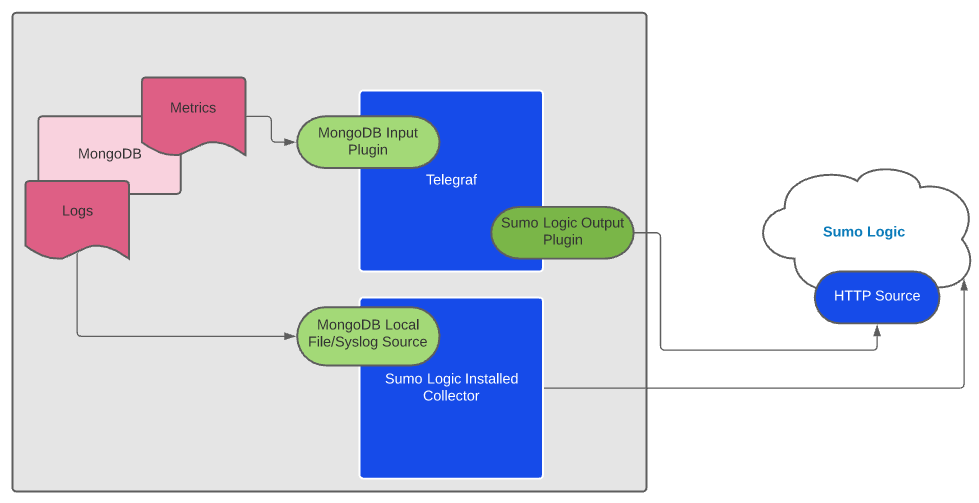
This section provides instructions for configuring metrics collection for the Sumo Logic app for MongoDB.
Configure Metrics Collection
- Configure a Hosted Collector. To create a new Sumo Logic hosted collector, perform the steps in the Configure a Hosted Collector section of the Sumo Logic documentation.
- Configure an HTTP Logs and Metrics Source. Create a new HTTP Logs and Metrics Source in the hosted collector created above by following these instructions. . Make note of the HTTP Source URL.
- Install Telegraf. Use the following steps install Telegraf.
- Configure and start Telegraf. As part of collecting metrics data from Telegraf, we will use the MongoDB input plugin to get data from Telegraf and the Sumo Logic output plugin to send data to Sumo Logic. Create or modify telegraf.conf and copy and paste the text below:
[[inputs.mongodb]]
  servers = ["mongodb://<username-CHANGEME>:<password-CHANGEME>@127.0.0.1:27017"]
  gather_perdb_stats = true
  gather_col_stats = true
	  [inputs.mongodb.tags]
    environment="ENV_TO_BE_CHANGED"
    component="database"
    db_system="mongodb"
    db_cluster="ENV_TO_BE_CHANGED"
    db_cluster_address = "ENV_TO_BE_CHANGED"
    db_cluster_port = "ENV_TO_BE_CHANGED"
	[[outputs.sumologic]]
	url = "<CHANGEME>" -- HTTP Source URL you created in previous step
data_format = "prometheus"- Enter values for the following parameters (marked ENV_TO_BE_CHANGED above):
- In the input plugins section,
[inputs.mongodb]:servers- The URL to the MongoDB server. This can be a comma-separated list to connect to multiple MongoDB servers. Please see this doc for more information on additional parameters for configuring the MongoDB input plugin for Telegraf.
- In the tags section,
[inputs.mongodb.tags]environment. This is the deployment environment where the MongoDB cluster identified by the value of servers resides. For example: dev, prod or qa. While this value is optional we highly recommend setting it.db_cluster. Enter a name to identify this MongoDB cluster. This cluster name will be shown in the Sumo Logic dashboards.- db_cluster_address - Enter the cluster hostname or ip address that is used by the application to connect to the database. It could also be the load balancer or proxy endpoint.
db_cluster_port- Enter the database port. If not provided, a default port will be used.
db_cluster_address and db_cluster_port should reflect the exact configuration of DB client configuration in your application, especially if you instrument it with OT tracing. The values of these fields should match exactly the connection string used by the database client (reported as values for net.peer.name and net.peer.port metadata fields).
For example, if your application uses “mongodb-prod.sumologic.com:3306” as the connection string, the field values should be set as follows: db_cluster_address=mongodb-prod.sumologic.com db_cluster_port=3306
If your application connects directly to a given MongoDB node, rather than the whole cluster, use the application connection string to override the value of the “host” field in the Telegraf configuration: host=mongodb-prod.sumologic.com
Pivoting to Tracing data from Entity Inspector is possible only for “MongoDB address” Entities.
- In the output plugins section,
[outputs.sumologic]:url- This is the HTTP source URL created in step 3. Please see this doc for more information on additional parameters for configuring the Sumo Logic Telegraf output plugin.
- Do not modify the following values as it will cause the Sumo Logic app to not function correctly.
data_format - “prometheus”In the output plugins section,[outputs.sumologic], metrics are sent in the Prometheus format to Sumo Logiccomponent: “database”- In the input plugins section,[inputs.MongoDB], this value is used by Sumo Logic apps to identify application components.gather_perdb_stats: “true”- When true, collect per database stats.gather_col_stats: “true”- When true, collect per collection stats.
- See this doc for more parameters that can be configured in the Telegraf agent globally.
- Once you have finalized your telegraf.conf file, you can start or reload the telegraf service using instructions from the doc.
At this point, MongoDB metrics should start flowing into Sumo Logic.
Configure Logs Collection
This section provides instructions for configuring log collection for MongoDB running on a non-Kubernetes environment for the Sumo Logic app for MongoDB. By default, MongoDB logs are stored in a log file. MongoDB also supports forwarding logs via Syslog.
Sumo Logic supports collecting logs both via Syslog and a local log file. Utilizing Sumo Logic Cloud Syslog will require TCP TLS Port 6514 to be open in your network. Local log files can be collected via Installed collectors. Installed collector will require you to allow outbound traffic to Sumo Logic endpoints for collection to work. For more information, see Installed Collector Requirements.
Based on your infrastructure and networking setup choose one of these methods to collect MongoDB logs and follow the instructions below to set up log collection:
-
Configure logging in MongoDB. MongoDB supports logging via the following methods: syslog, local text log files and stdout. MongoDB logs have four levels of verbosity. All logging settings are located in MongoDB.conf. To select a level, set
loglevelto one of:- 0 is the MongoDB's default log verbosity level, to include Informational messages.
- 1 to 5 increases the verbosity level to include Debug messages.
-
Configure MongoDB to log to a Local file or syslog.
- Configuring MongoDB logs to go to log files. By default, MongoDB logs are stored in /var/log/mongodb/mongodb.log. The default directory for log files is listed in the MongoDB.conf file. To configure the log output destination to a log file, use one of the following settings, either in the configuration file or command line:
- Configuration file: The systemLog.destination option for file.
- Command line:
- The
--logpathoption for mongod for file. - The
--logpathoption for mongos for file. Logs from the MongoDB log file can be collected via a Sumo Logic Installed collector and a Local File Source as explained in the next section.
- The
- Configuring MongoDB logs to stream via syslog. To configure the log output destination to syslog, use one of the following settings, either in the configuration file or command line:
- Configuration file: the systemLog.destination option for syslog.
- Command line:
To capture MongoDB logs using syslog, configure a syslog source on an Installed collector as explained in the next section.
- Configuring MongoDB logs to go to log files. By default, MongoDB logs are stored in /var/log/mongodb/mongodb.log. The default directory for log files is listed in the MongoDB.conf file. To configure the log output destination to a log file, use one of the following settings, either in the configuration file or command line:
-
Configuring a Collector. To add an Installed collector, perform the steps as defined on the page Configure an Installed Collector.
-
Configuring a Source. To collect logs directly from your MongoDB machine, use a Local File Source and an Installed Collector.
-
To add a Local File Source source for MongoDB, do the following:
-
Add a Local File Source.
-
Configure the Local File Source fields as follows:
- Name. (Required)
- Description. (Optional)
- File Path (Required). Enter the path to your error.log or access.log. The files are typically located in /var/log/mongodb/mongodb.log. If you're using a customized path, check the MongoDB.conf file for this information.
- Source Host. Sumo Logic uses the hostname assigned by the OS unless you enter a different host name
- Source Category. Enter any string to tag the output collected from this Source, such as MongoDB/Logs. (The Source Category metadata field is a fundamental building block to organize and label Sources. For details, see Best Practices.)
- Fields. Set the following fields:
component = databasedb_system = mongodbdb_cluster = <Your_MongoDB_Cluster_Name>environment = <Environment_Name>, such as Dev, QA or Proddb_cluster_address- Enter the cluster hostname or ip address that is used by the application to connect to the database. It could also be the load balancer or proxy endpoint.db_cluster_port- Enter the database port. If not provided, a default port will be used.
notedb_cluster_addressanddb_cluster_portshould reflect the exact configuration of DB client configuration in your application, especially if you instrument it with OT tracing. The values of these fields should match exactly the connection string used by the database client (reported as values for net.peer.name and net.peer.port metadata fields).For example, if your application uses “mongodb-prod.sumologic.com:3306” as the connection string, the field values should be set as follows:
db_cluster_address=mongodb-prod.sumologic.com db_cluster_port=3306If your application connects directly to a given MongoDB node, rather than the whole cluster, use the application connection string to override the value of the
“host”field in the Telegraf configuration:host=mongodb-prod.sumologic.comPivoting to Tracing data from Entity Inspector is possible only for “MongoDB address” Entities
-
Configure the Advanced section:
- Enable Timestamp Parsing. Select Extract timestamp information from log file entries.
- Time Zone. Choose the option, Ignore time zone from log file and instead use, and then select your MongoDB Server’s time zone.
- Timestamp Format. The timestamp format is automatically detected.
- Encoding Select UTF-8 (Default).
- Enable Multiline Processing. Detect messages spanning multiple lines
- Infer Boundaries - Detect message boundaries automatically
-
Click Save.
-
-
To add a Syslog Source source for MongoDB, do the following:
- Add a Syslog source in the installed collector configured in the previous step.
- Configure the Syslog Source fields as follows:
- Name. (Required)
- Description. (Optional)
- Protocol: UDP
- Port: 514 (as entered while configuring logging in Step b.)
- Source Category. Enter any string to tag the output collected from this Source, such as MongoDB/Logs. (The Source Category metadata field is a fundamental building block to organize and label Sources. For details, see Best Practices.)
- Fields. Set the following fields:
component = databasedb_system = MongoDBdb_cluster = <Your_MongoDB_Cluster_Name>environment = <Environment_Name>, such as Dev, QA or Proddb_cluster_address- Enter the cluster hostname or ip address that is used by the application to connect to the database. It could also be the load balancer or proxy endpoint.db_cluster_port- Enter the database port. If not provided, a default port will be used.
notedb_cluster_addressanddb_cluster_portshould reflect the exact configuration of DB client configuration in your application, especially if you instrument it with OT tracing. The values of these fields should match exactly the connection string used by the database client (reported as values fornet.peer.nameandnet.peer.portmetadata fields).For example, if your application uses “mongodb-prod.sumologic.com:3306” as the connection string, the field values should be set as follows:
db_cluster_address=mongodb-prod.sumologic.com db_cluster_port=3306If your application connects directly to a given MongoDB node, rather than the whole cluster, use the application connection string to override the value of the “host” field in the Telegraf configuration:
host=mongodb-prod.sumologic.comPivoting to Tracing data from Entity Inspector is possible only for “MongoDB address” Entities.
- Configure the Advanced section:
- Enable Timestamp Parsing. Select Extract timestamp information from log file entries.
- Time Zone. Choose the option, Ignore time zone from log file and instead use, and then select your MongoDB Server’s time zone.
- Timestamp Format. The timestamp format is automatically detected.
- Encoding. Select UTF-8 (Default).
- Click Save.
-
At this point, MongoDB logs should start flowing into Sumo Logic.
Installing the MongoDB app
To install the app:
- Select App Catalog.
- In the 🔎 Search Apps field, run a search for your desired app, then select it.
- Click Install App.
note
Sometimes this button says Add Integration.
- On the next configuration page, under Select Data Source for your App, complete the following fields:
- Data Source. Select one of the following options:
- Choose Source Category and select a source category from the list; or
- Choose Enter a Custom Data Filter, and enter a custom source category beginning with an underscore. For example,
_sourceCategory=MyCategory.
- Folder Name. You can retain the existing name or enter a custom name of your choice for the app.
- All Folders (optional). The default location is the Personal folder in your Library. If desired, you can choose a different location and/or click New Folder to add it to a new folder.
- Data Source. Select one of the following options:
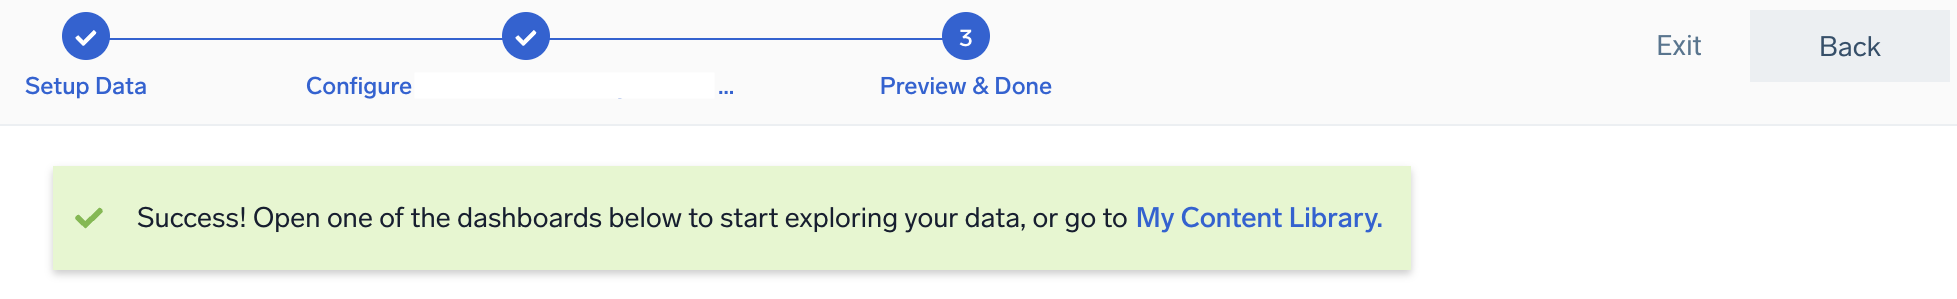
- Click Next.
- Look for the dialog confirming that your app was installed successfully.
Post-installation
Once your app is installed, it will appear in your Personal folder or the folder that you specified. From here, you can share it with other users in your organization. Dashboard panels will automatically start to fill with data matching the time range query received since you created the panel. Results won't be available immediately, but within about 20 minutes, you'll see completed graphs and maps.
As part of the app installation process, the following fields will be created by default:
componentenvironmentdb_systemdb_clusterdb_cluster_addressdb_cluster_port
Additionally, if you're using MongoDB in the Kubernetes environment, the following additional fields will be created by default during the app installation process:
pod_labels_componentpod_labels_environmentpod_labels_db_systempod_labels_db_clusterpod_labels_db_cluster_addresspod_labels_db_cluster_port
For information on setting up fields, see Fields.
Viewing MongoDB Dashboards
All dashboards have a set of filters that you can apply to the entire dashboard. Use these filters to drill down and examine the data to a granular level.
- You can change the time range for a dashboard or panel by selecting a predefined interval from a drop-down list, choosing a recently used time range, or specifying custom dates and times. Learn more.
- You can use template variables to drill down and examine the data on a granular level. For more information, see Filtering Dashboards with Template Variables.
- Most Next-Gen apps allow you to provide the scope at the installation time and are comprised of a key (
_sourceCategoryby default) and a default value for this key. Based on your input, the app dashboards will be parameterized with a dashboard variable, allowing you to change the dataset queried by all panels. This eliminates the need to create multiple copies of the same dashboard with different queries.
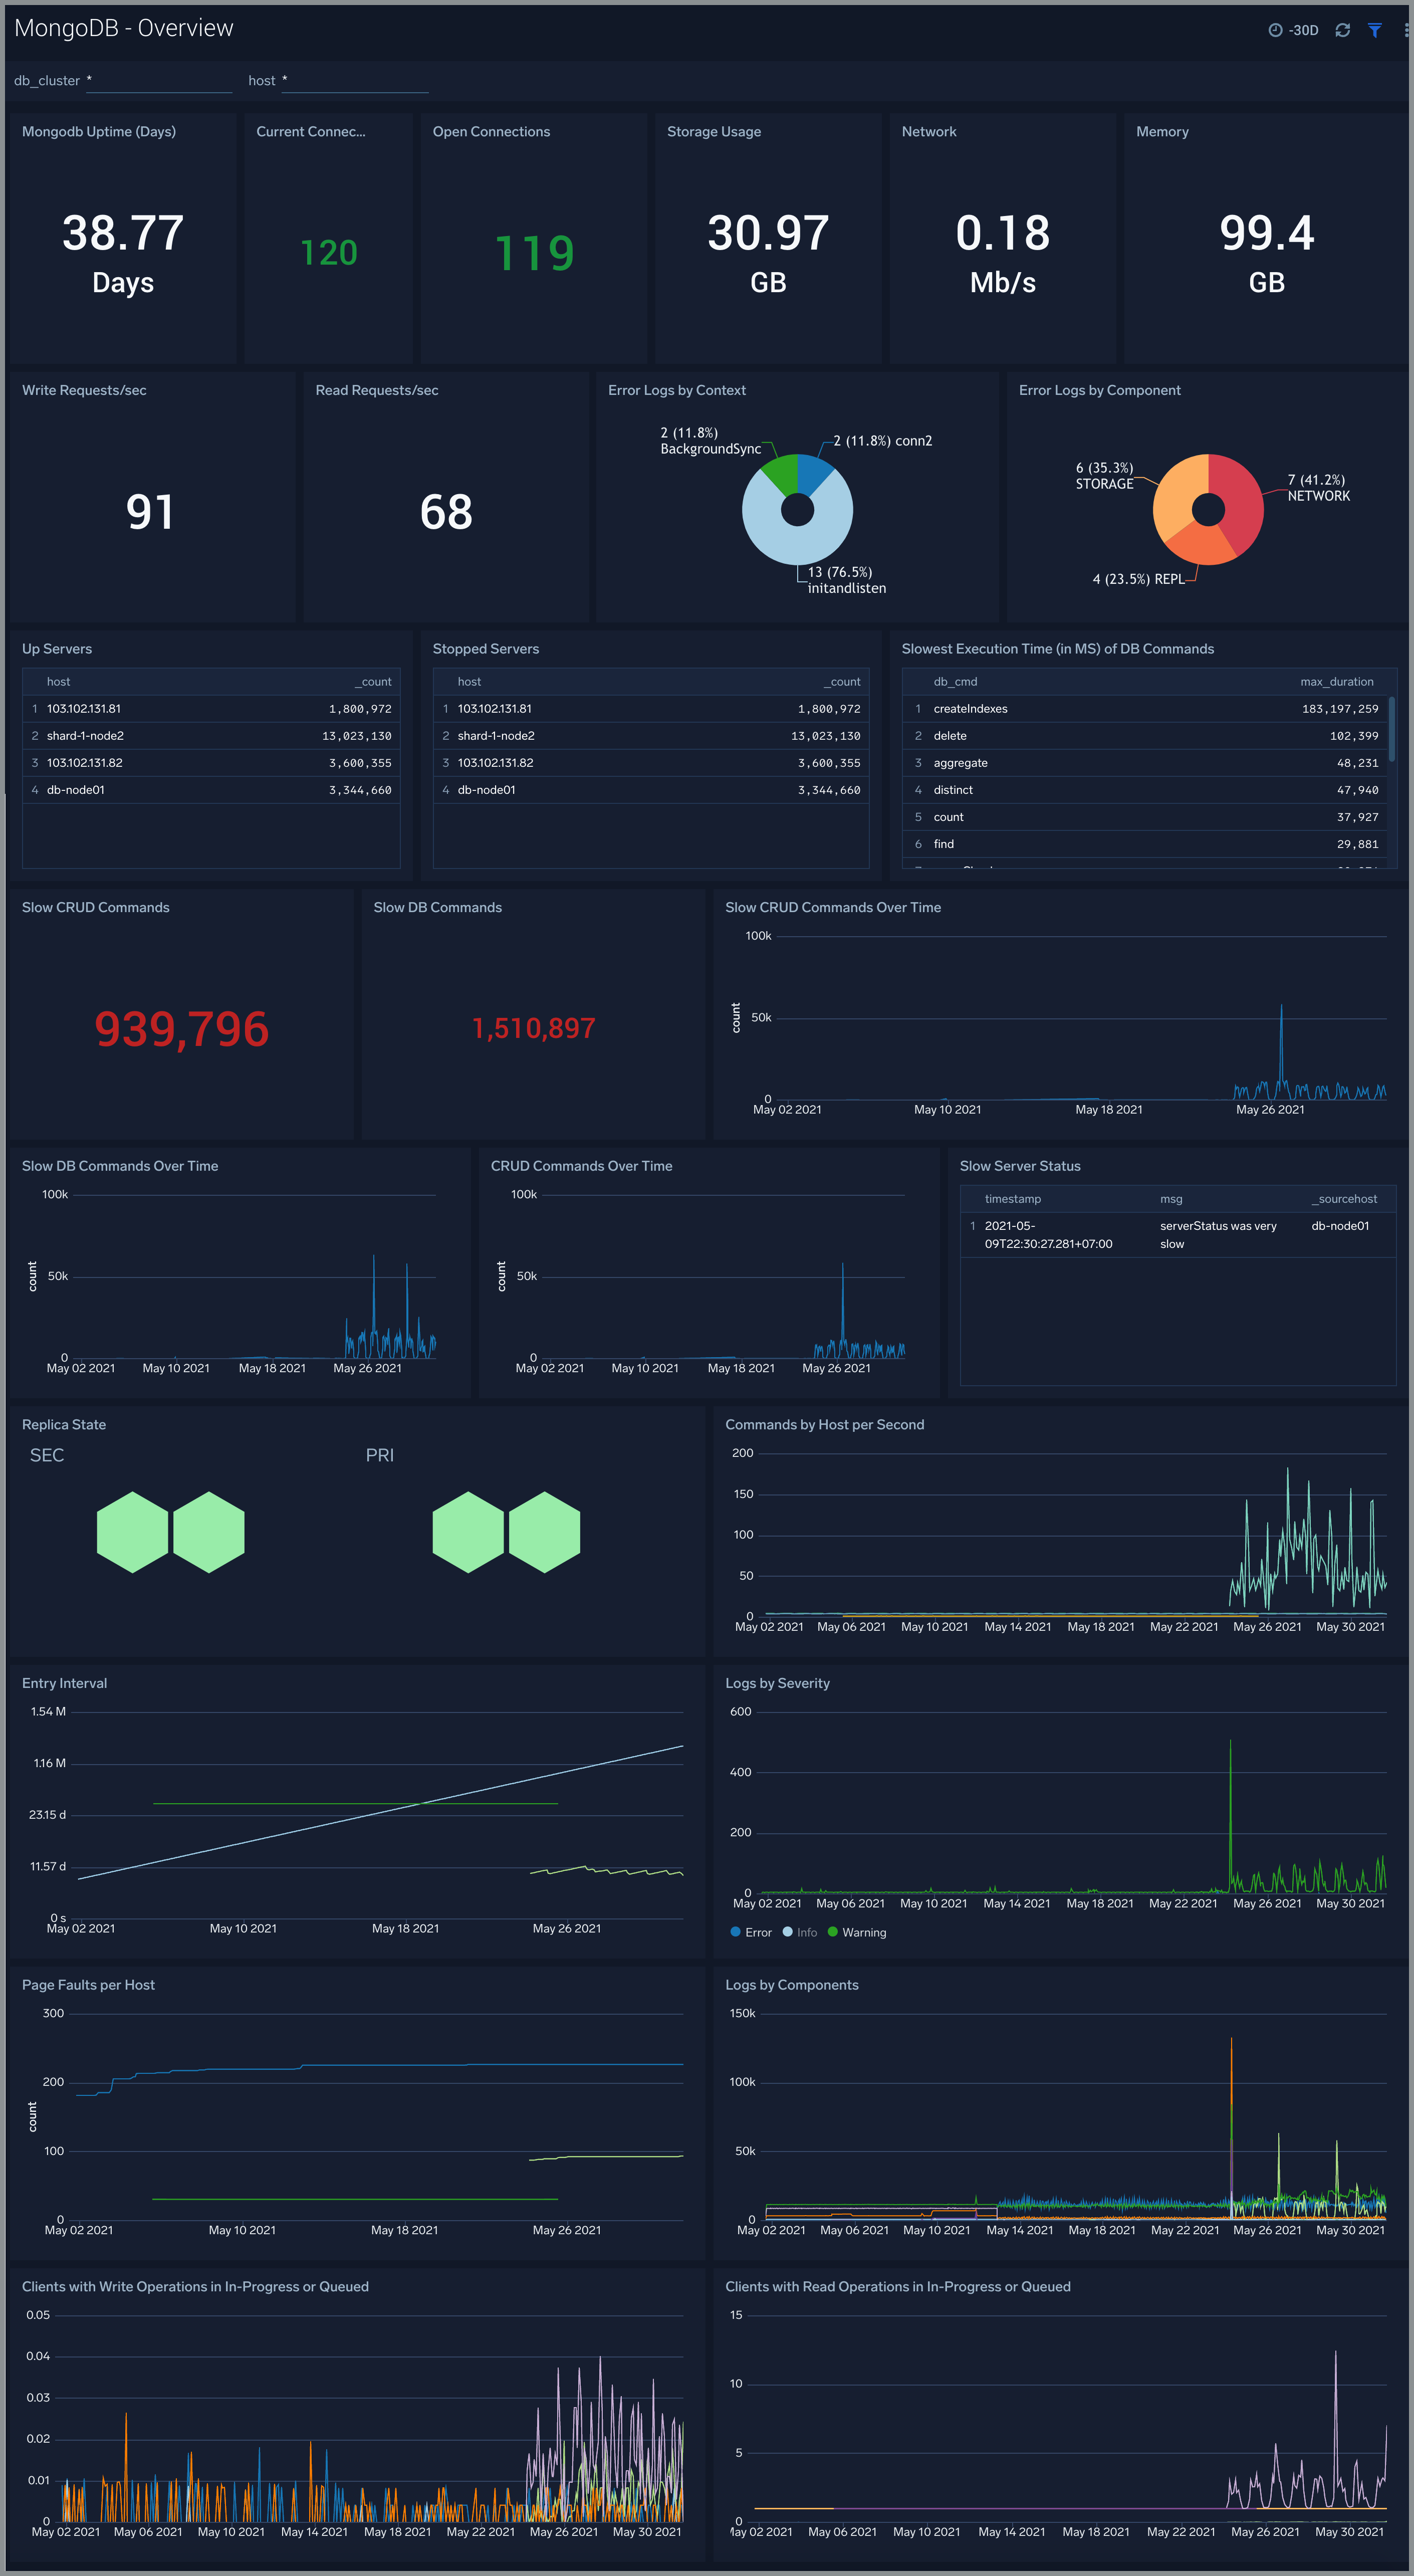
Overview
The MongoDB - Overview dashboard provides an at-a-glance view of MongoDB health, performance and problems causing errors.
Use this dashboard to:
- Identify Slow Queries impacting the performance.
- Gain insights into Replication and Sharding operations.
- Verify Page Faults generated to determine the root cause of the problems.
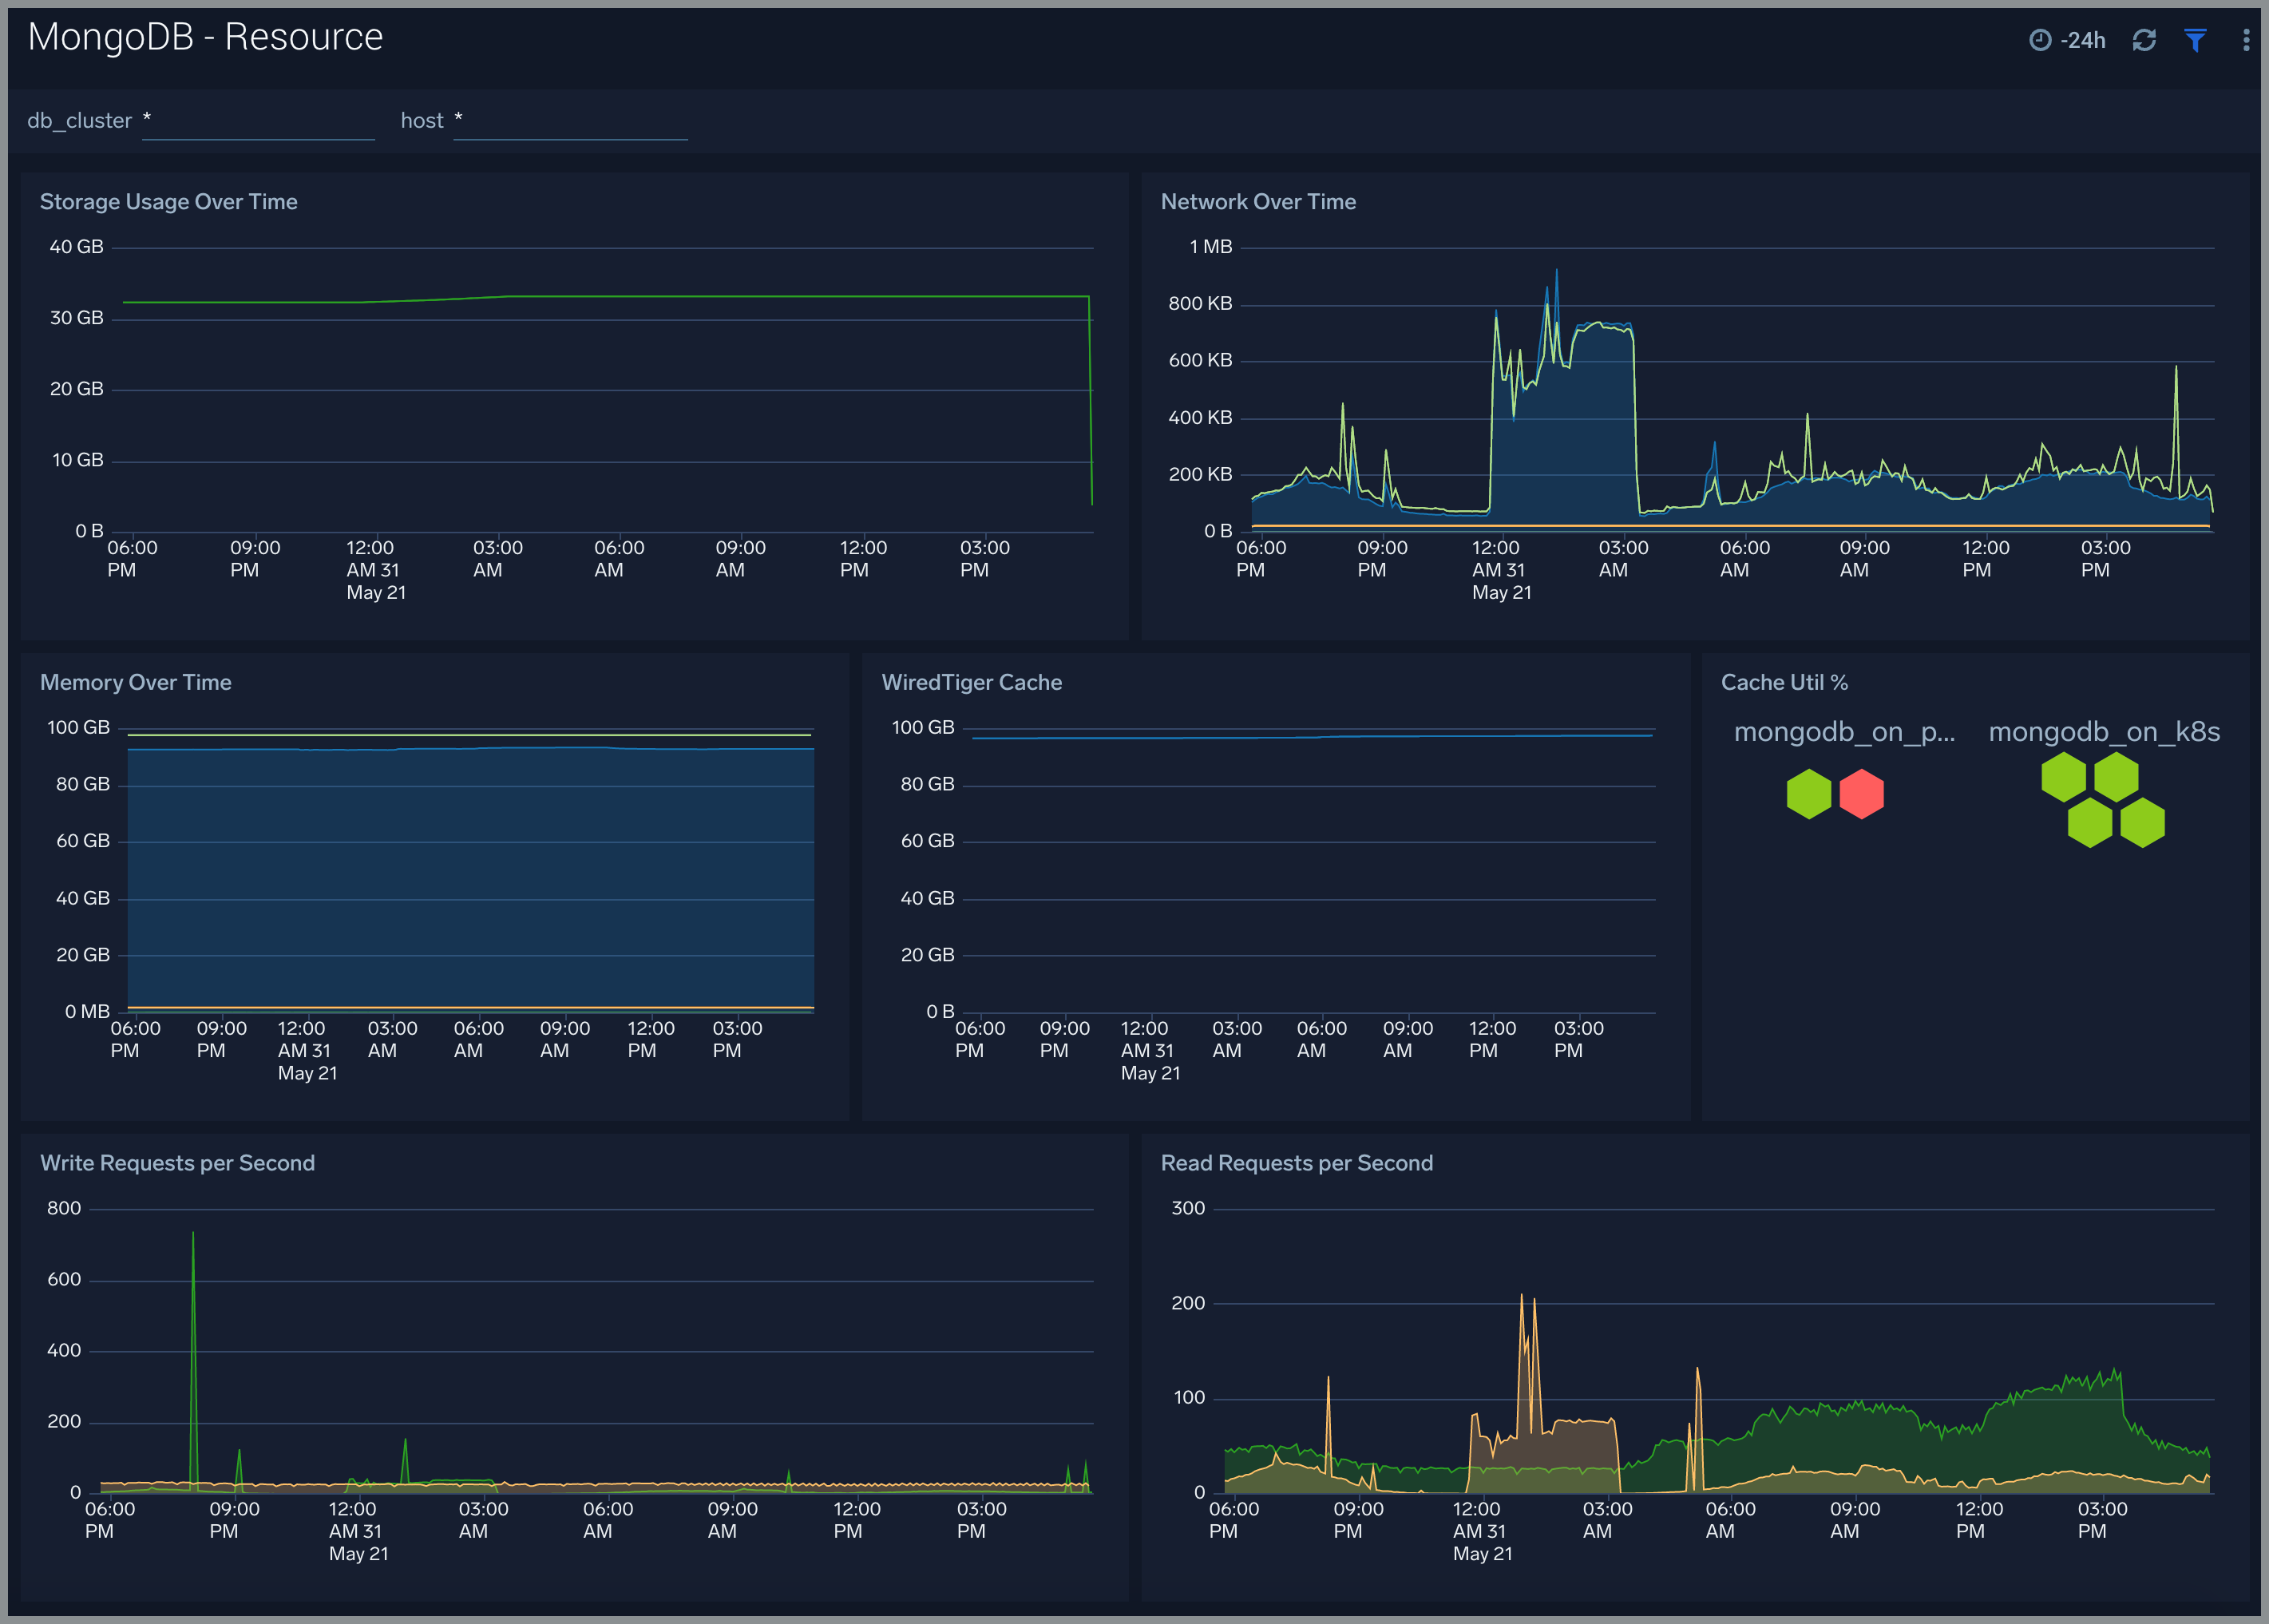
Resource
The MongoDB - Resource dashboard shows resource utilization by the MongoDB component.
Use this dashboard to:
- Determine Memory and Disk Usage.
- Identify potential resource constraints and issues.
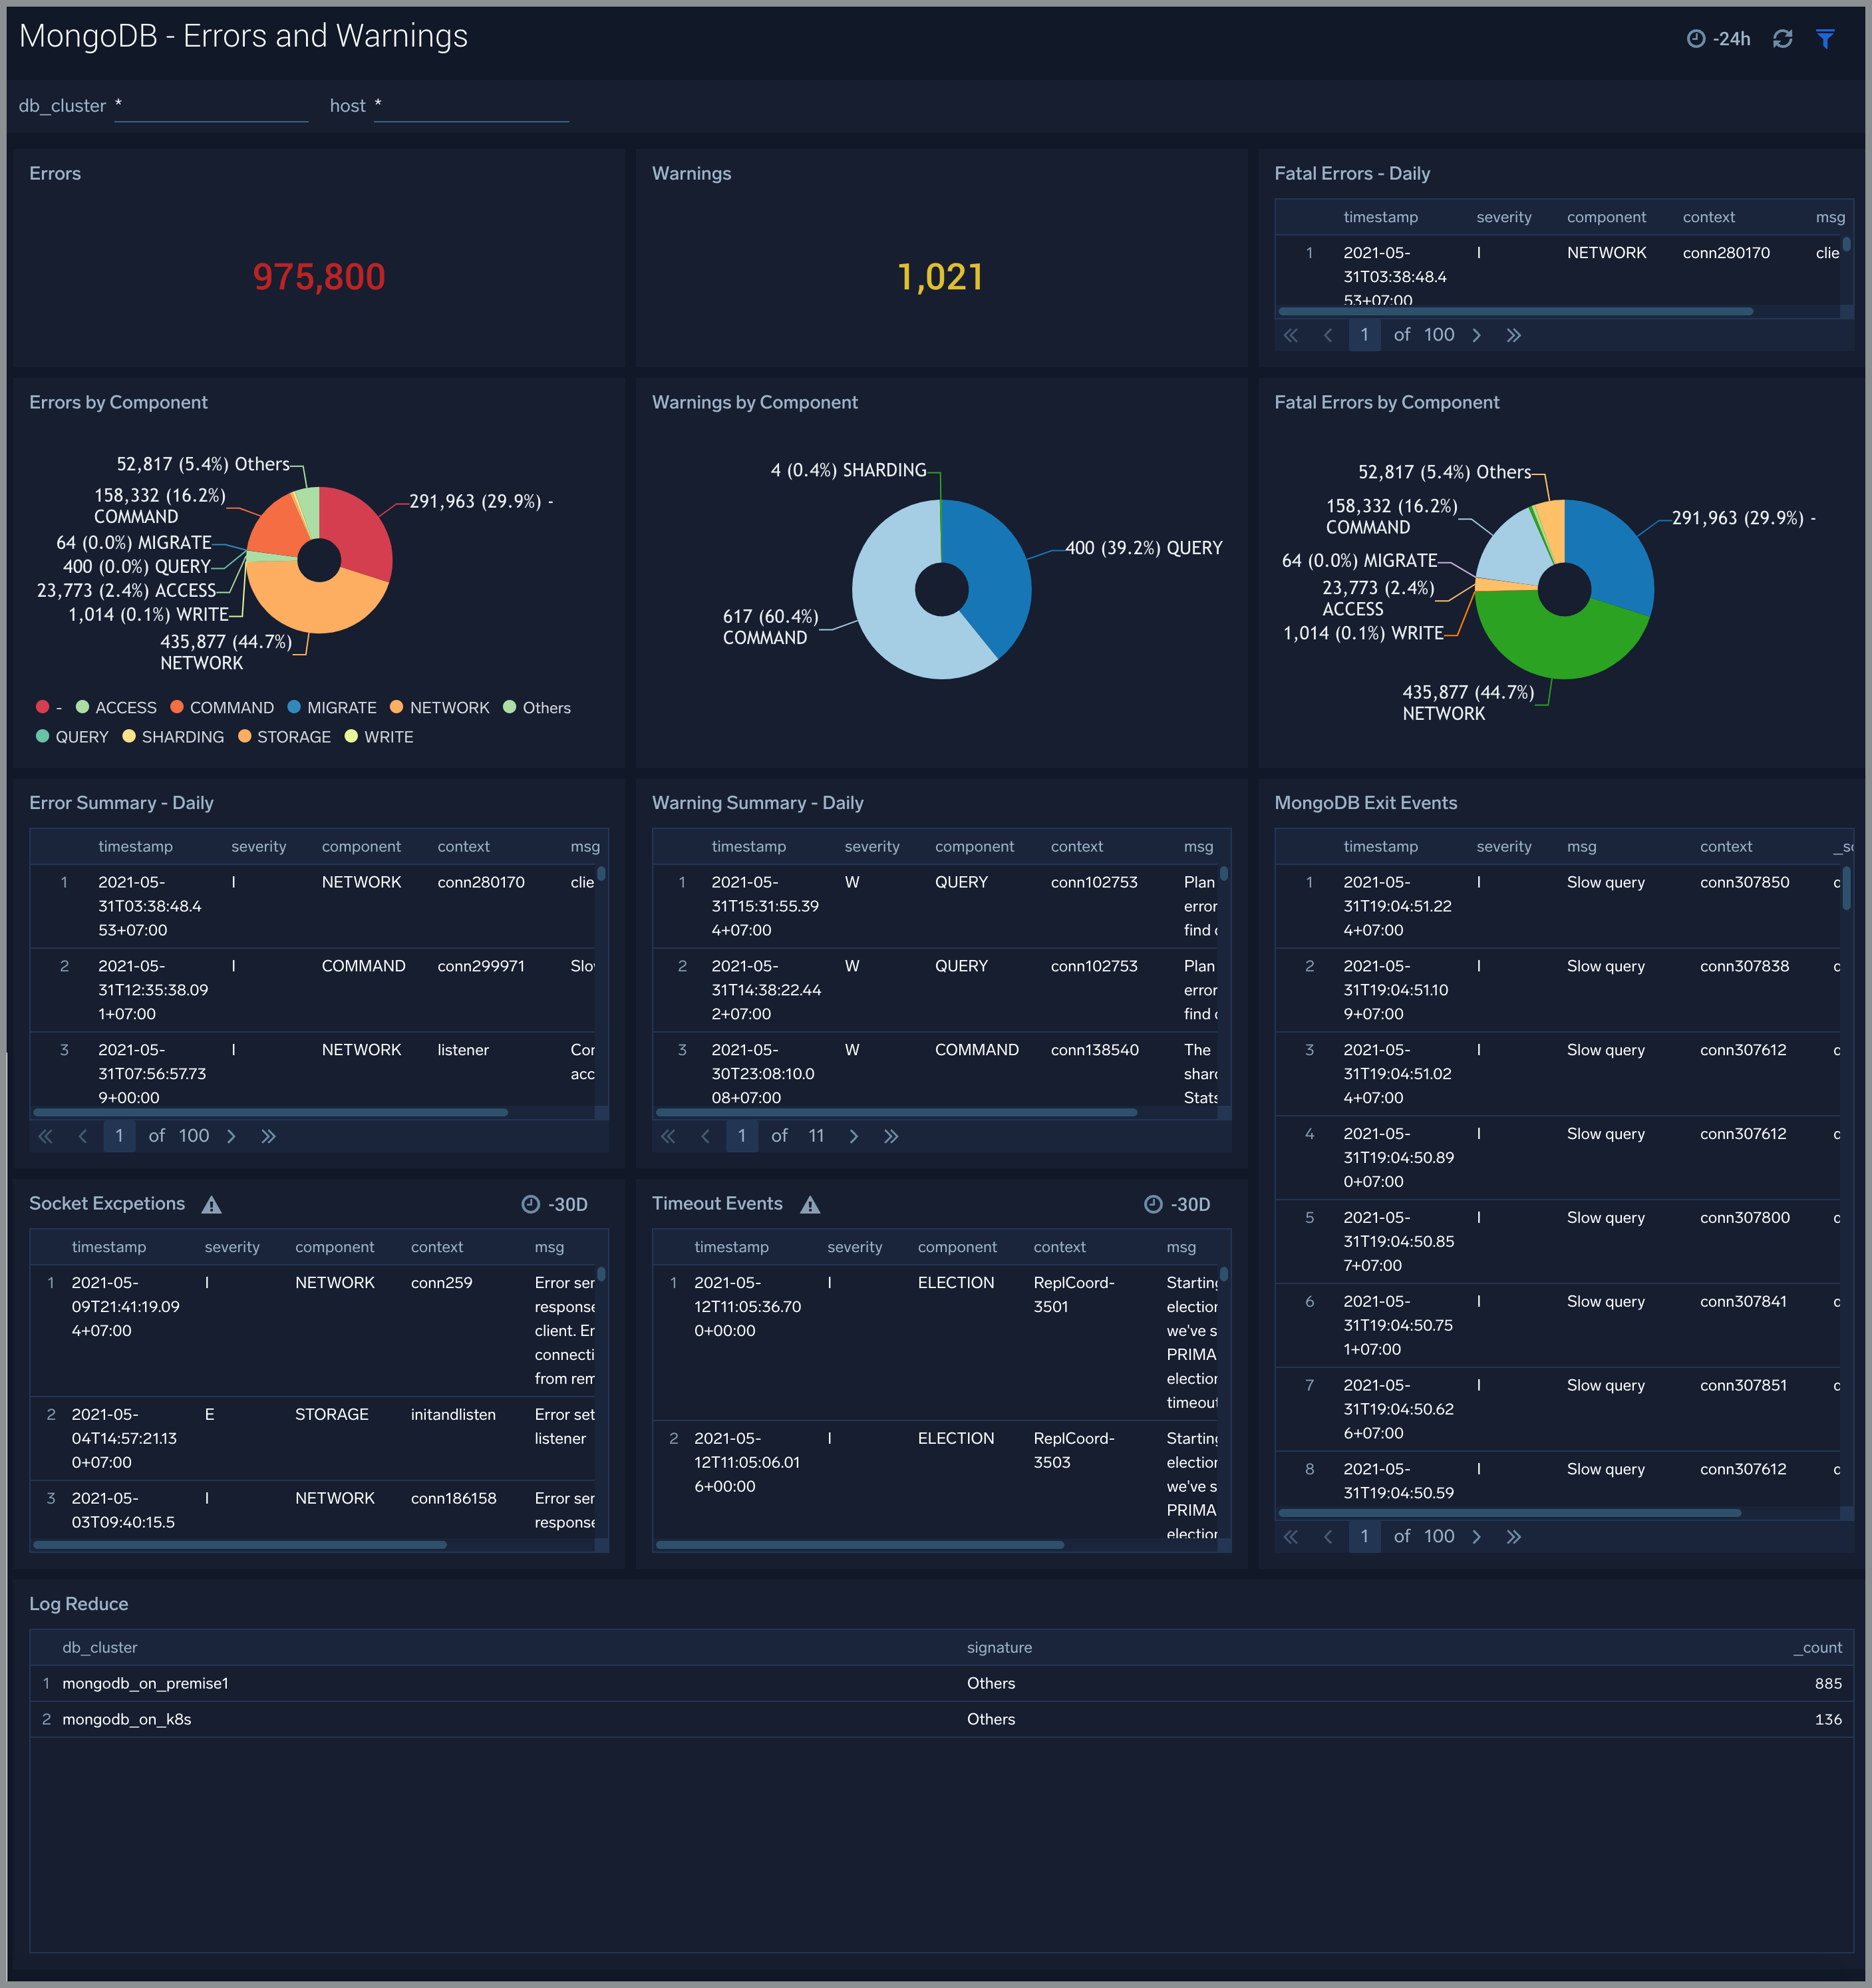
Errors and Warnings
The MongoDB - Errors and Warnings dashboard shows errors and warnings by the MongoDB component.
Use this dashboard to:
- Determine components producing multiple errors or warnings.
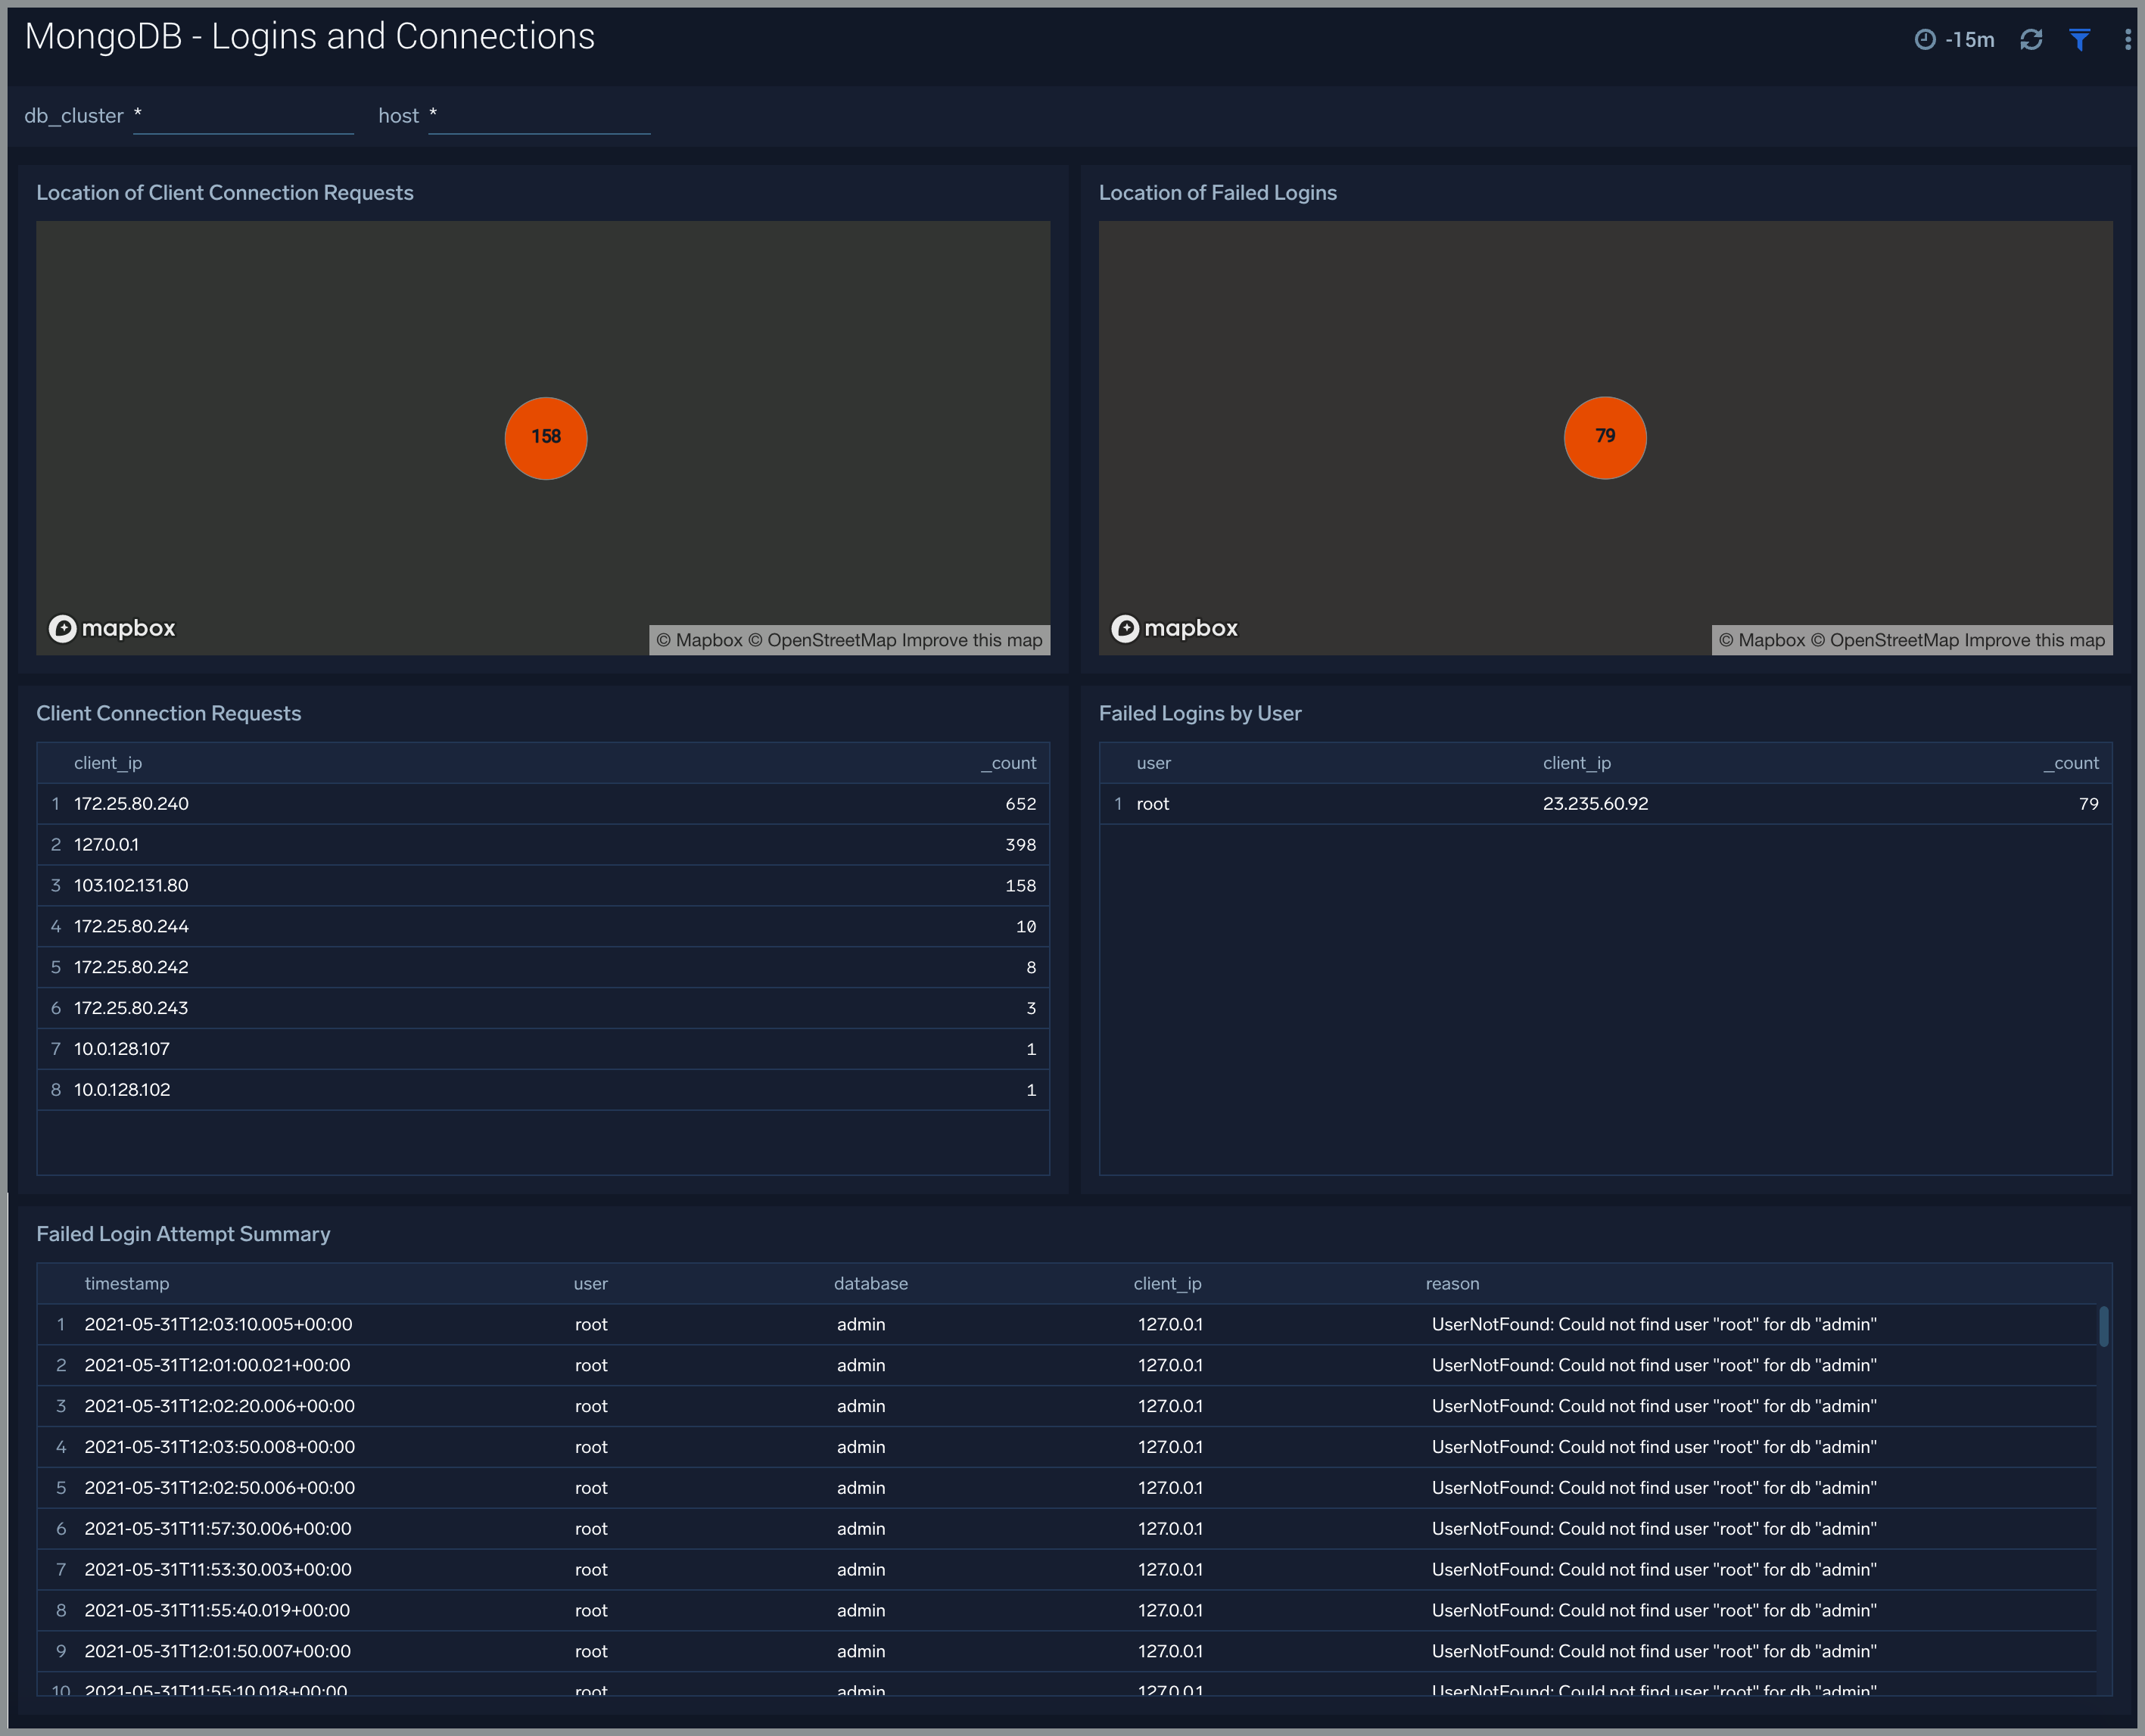
Logins and Connections
The MongoDB - Logins and Connections dashboard shows geo location of client connection requests, failed connection logins by geo location, and count of failed login attempts.
Use this dashboard to:
- Determine potential hacking attempts.
- Determine location of attacks.
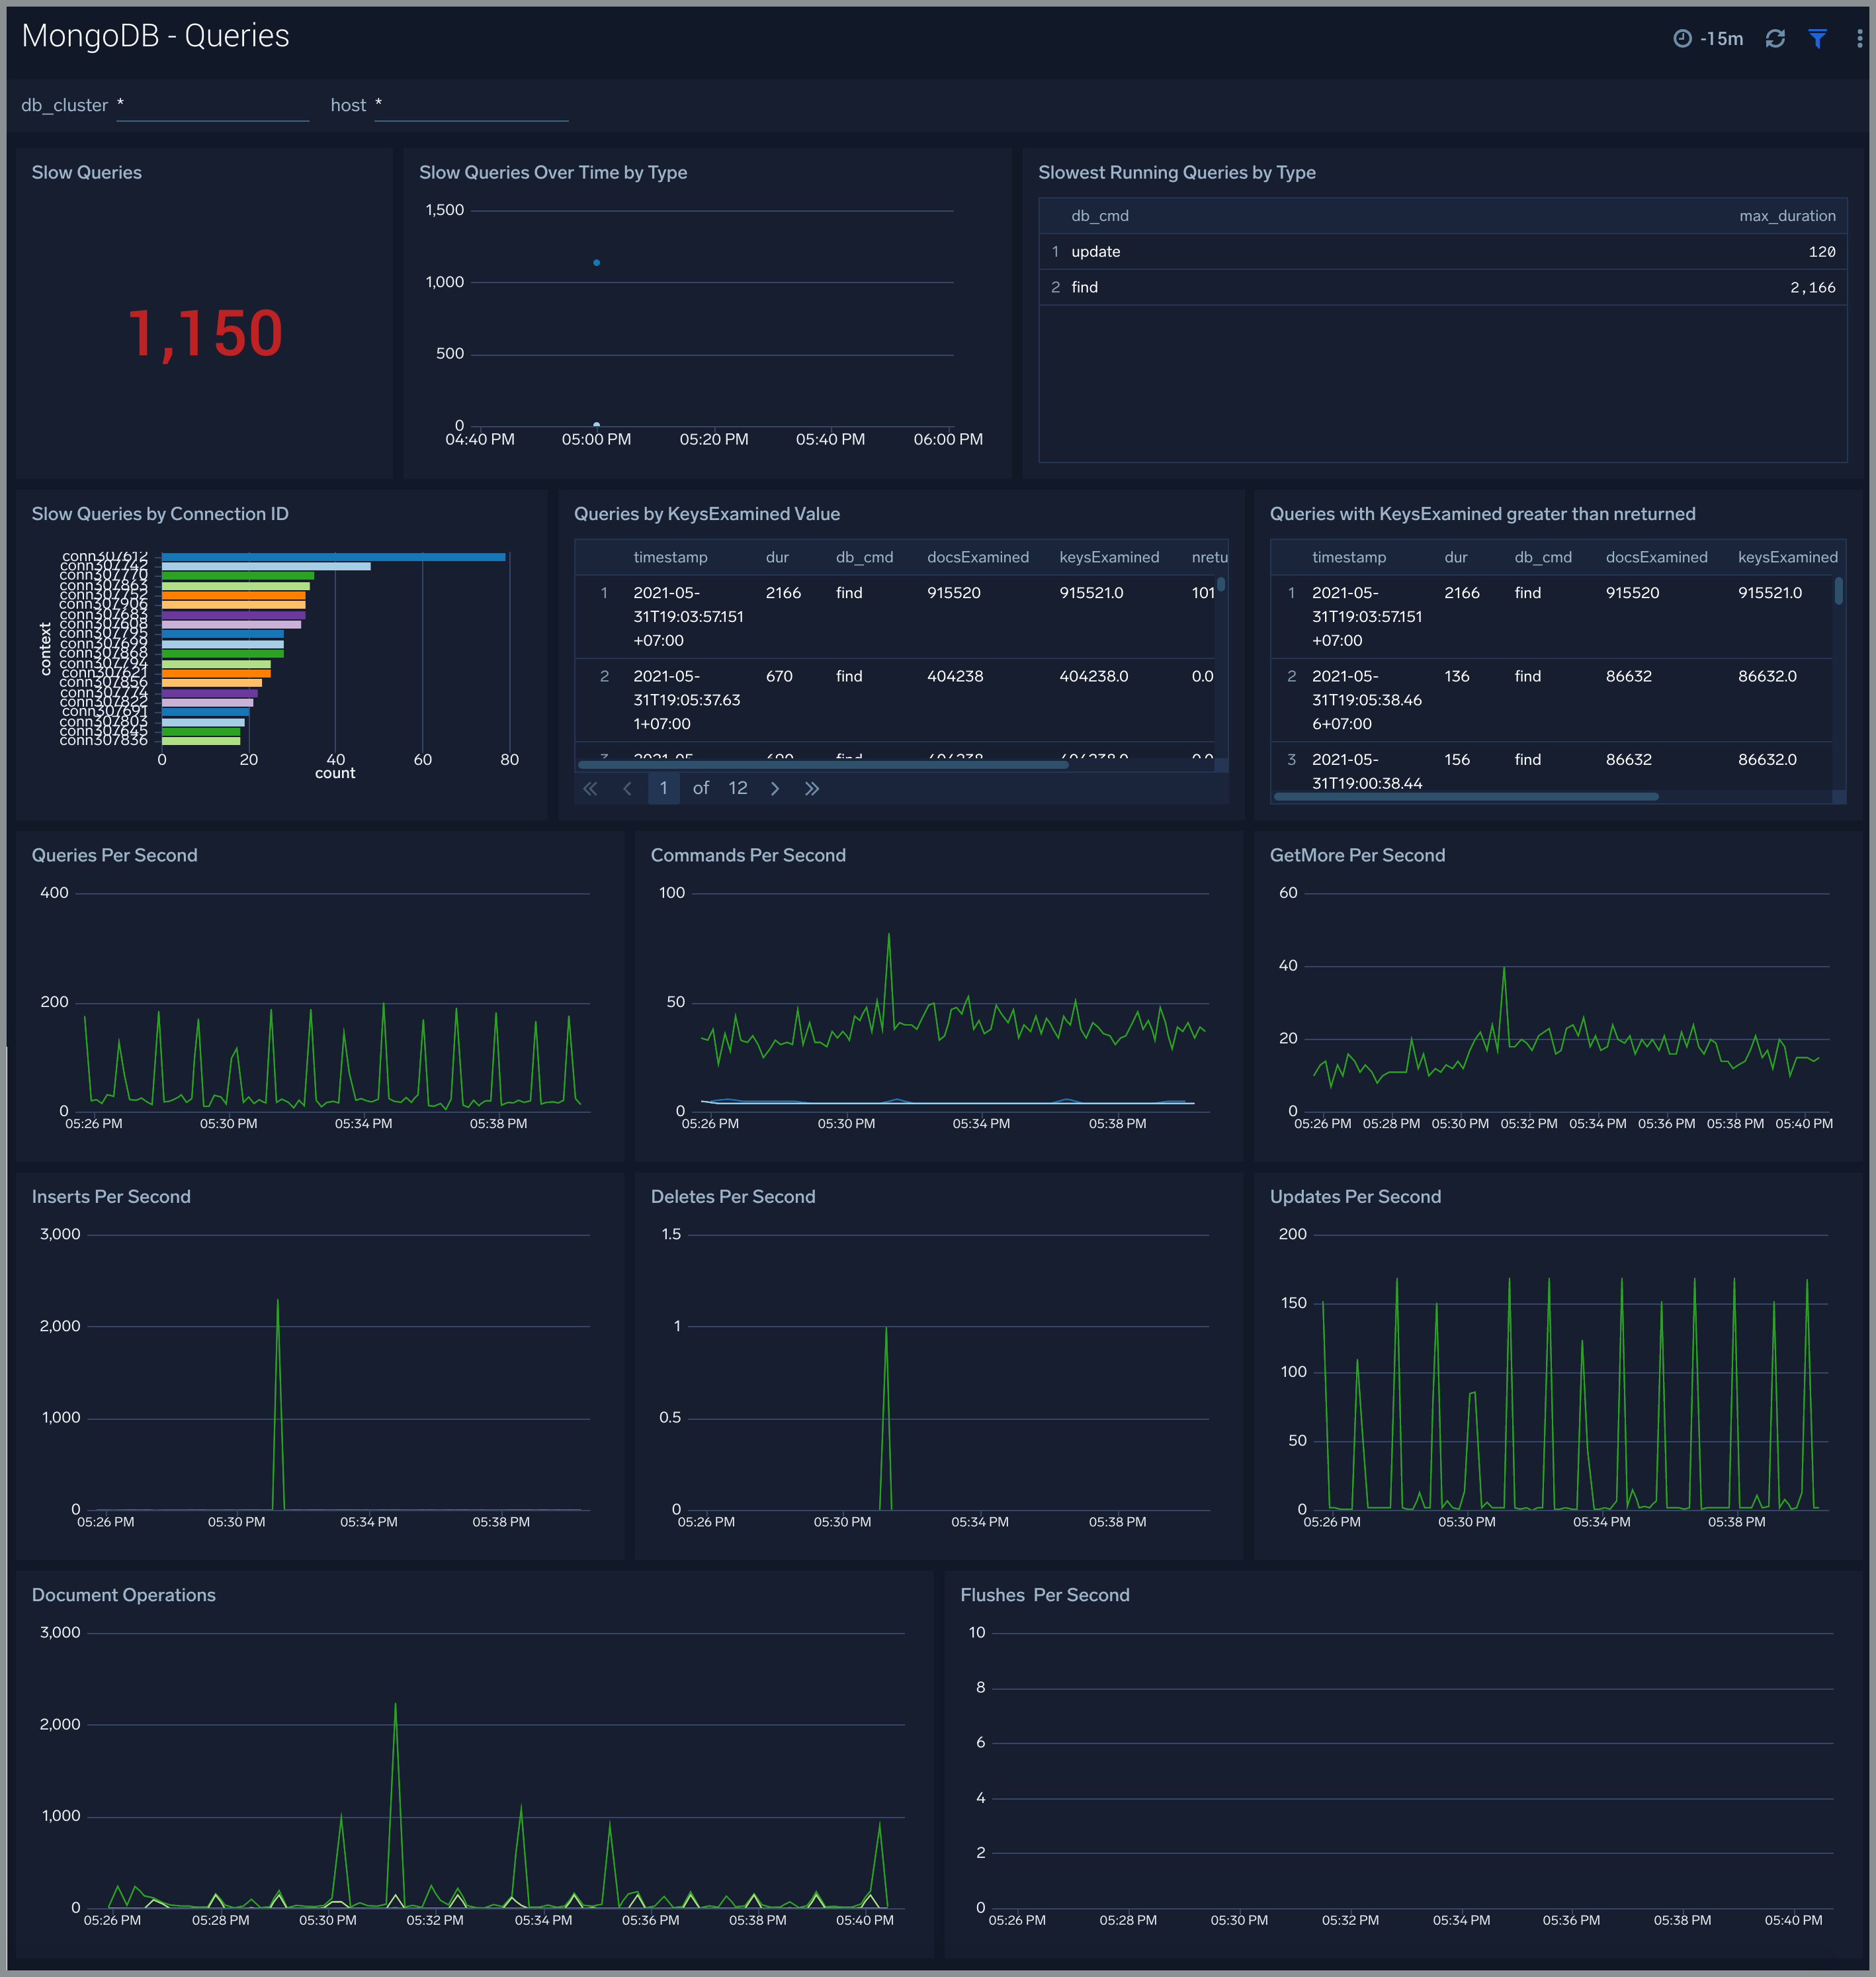
Query Logs
The MongoDB - Query Logs dashboard shows read and write query trends.
Use this dashboard to:
- Monitor abnormal spikes in Query volume.
- Identify the read versus write ratio of your application queries. ing or adjusting indexes to improve query performance.
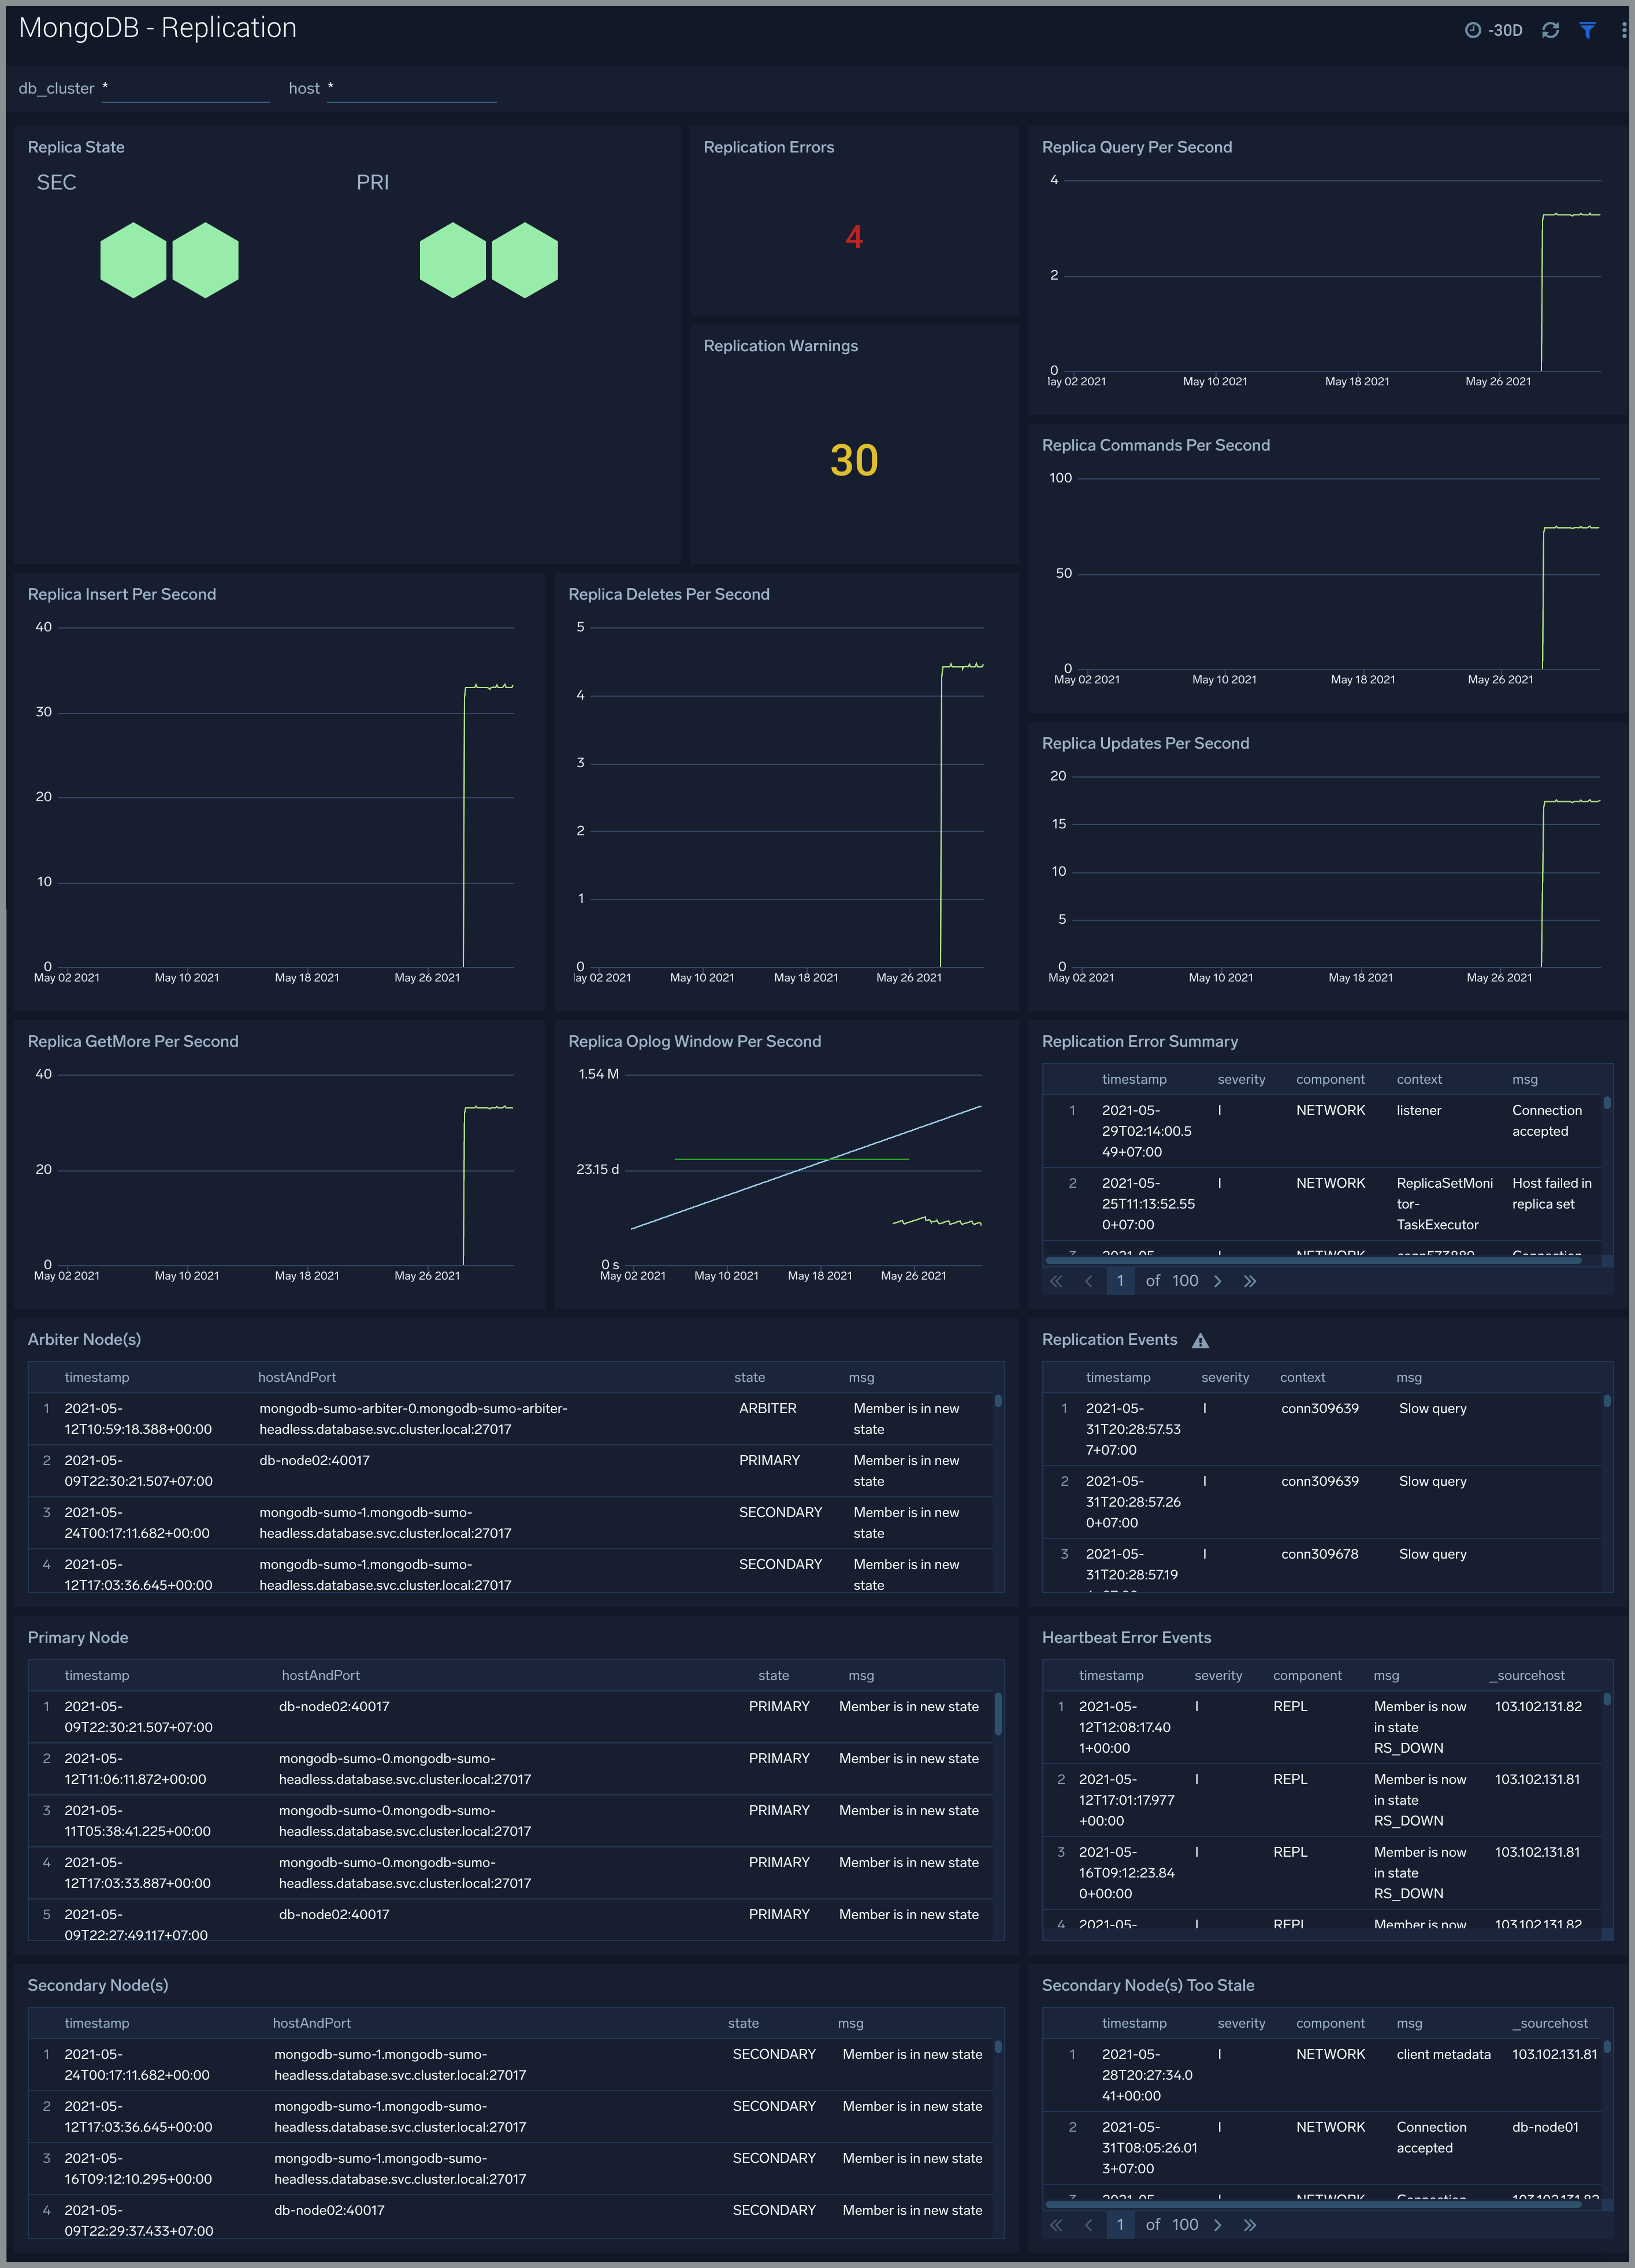
Replication Logs
The MongoDB - Replication Logs dashboard shows replica deletes/updates/inserts trend and replica state.
Use this dashboard to:
- Monitor replication state and replication events like inserts/updates/commands per second.
- Track Replication Oplog window to identify replication delay.
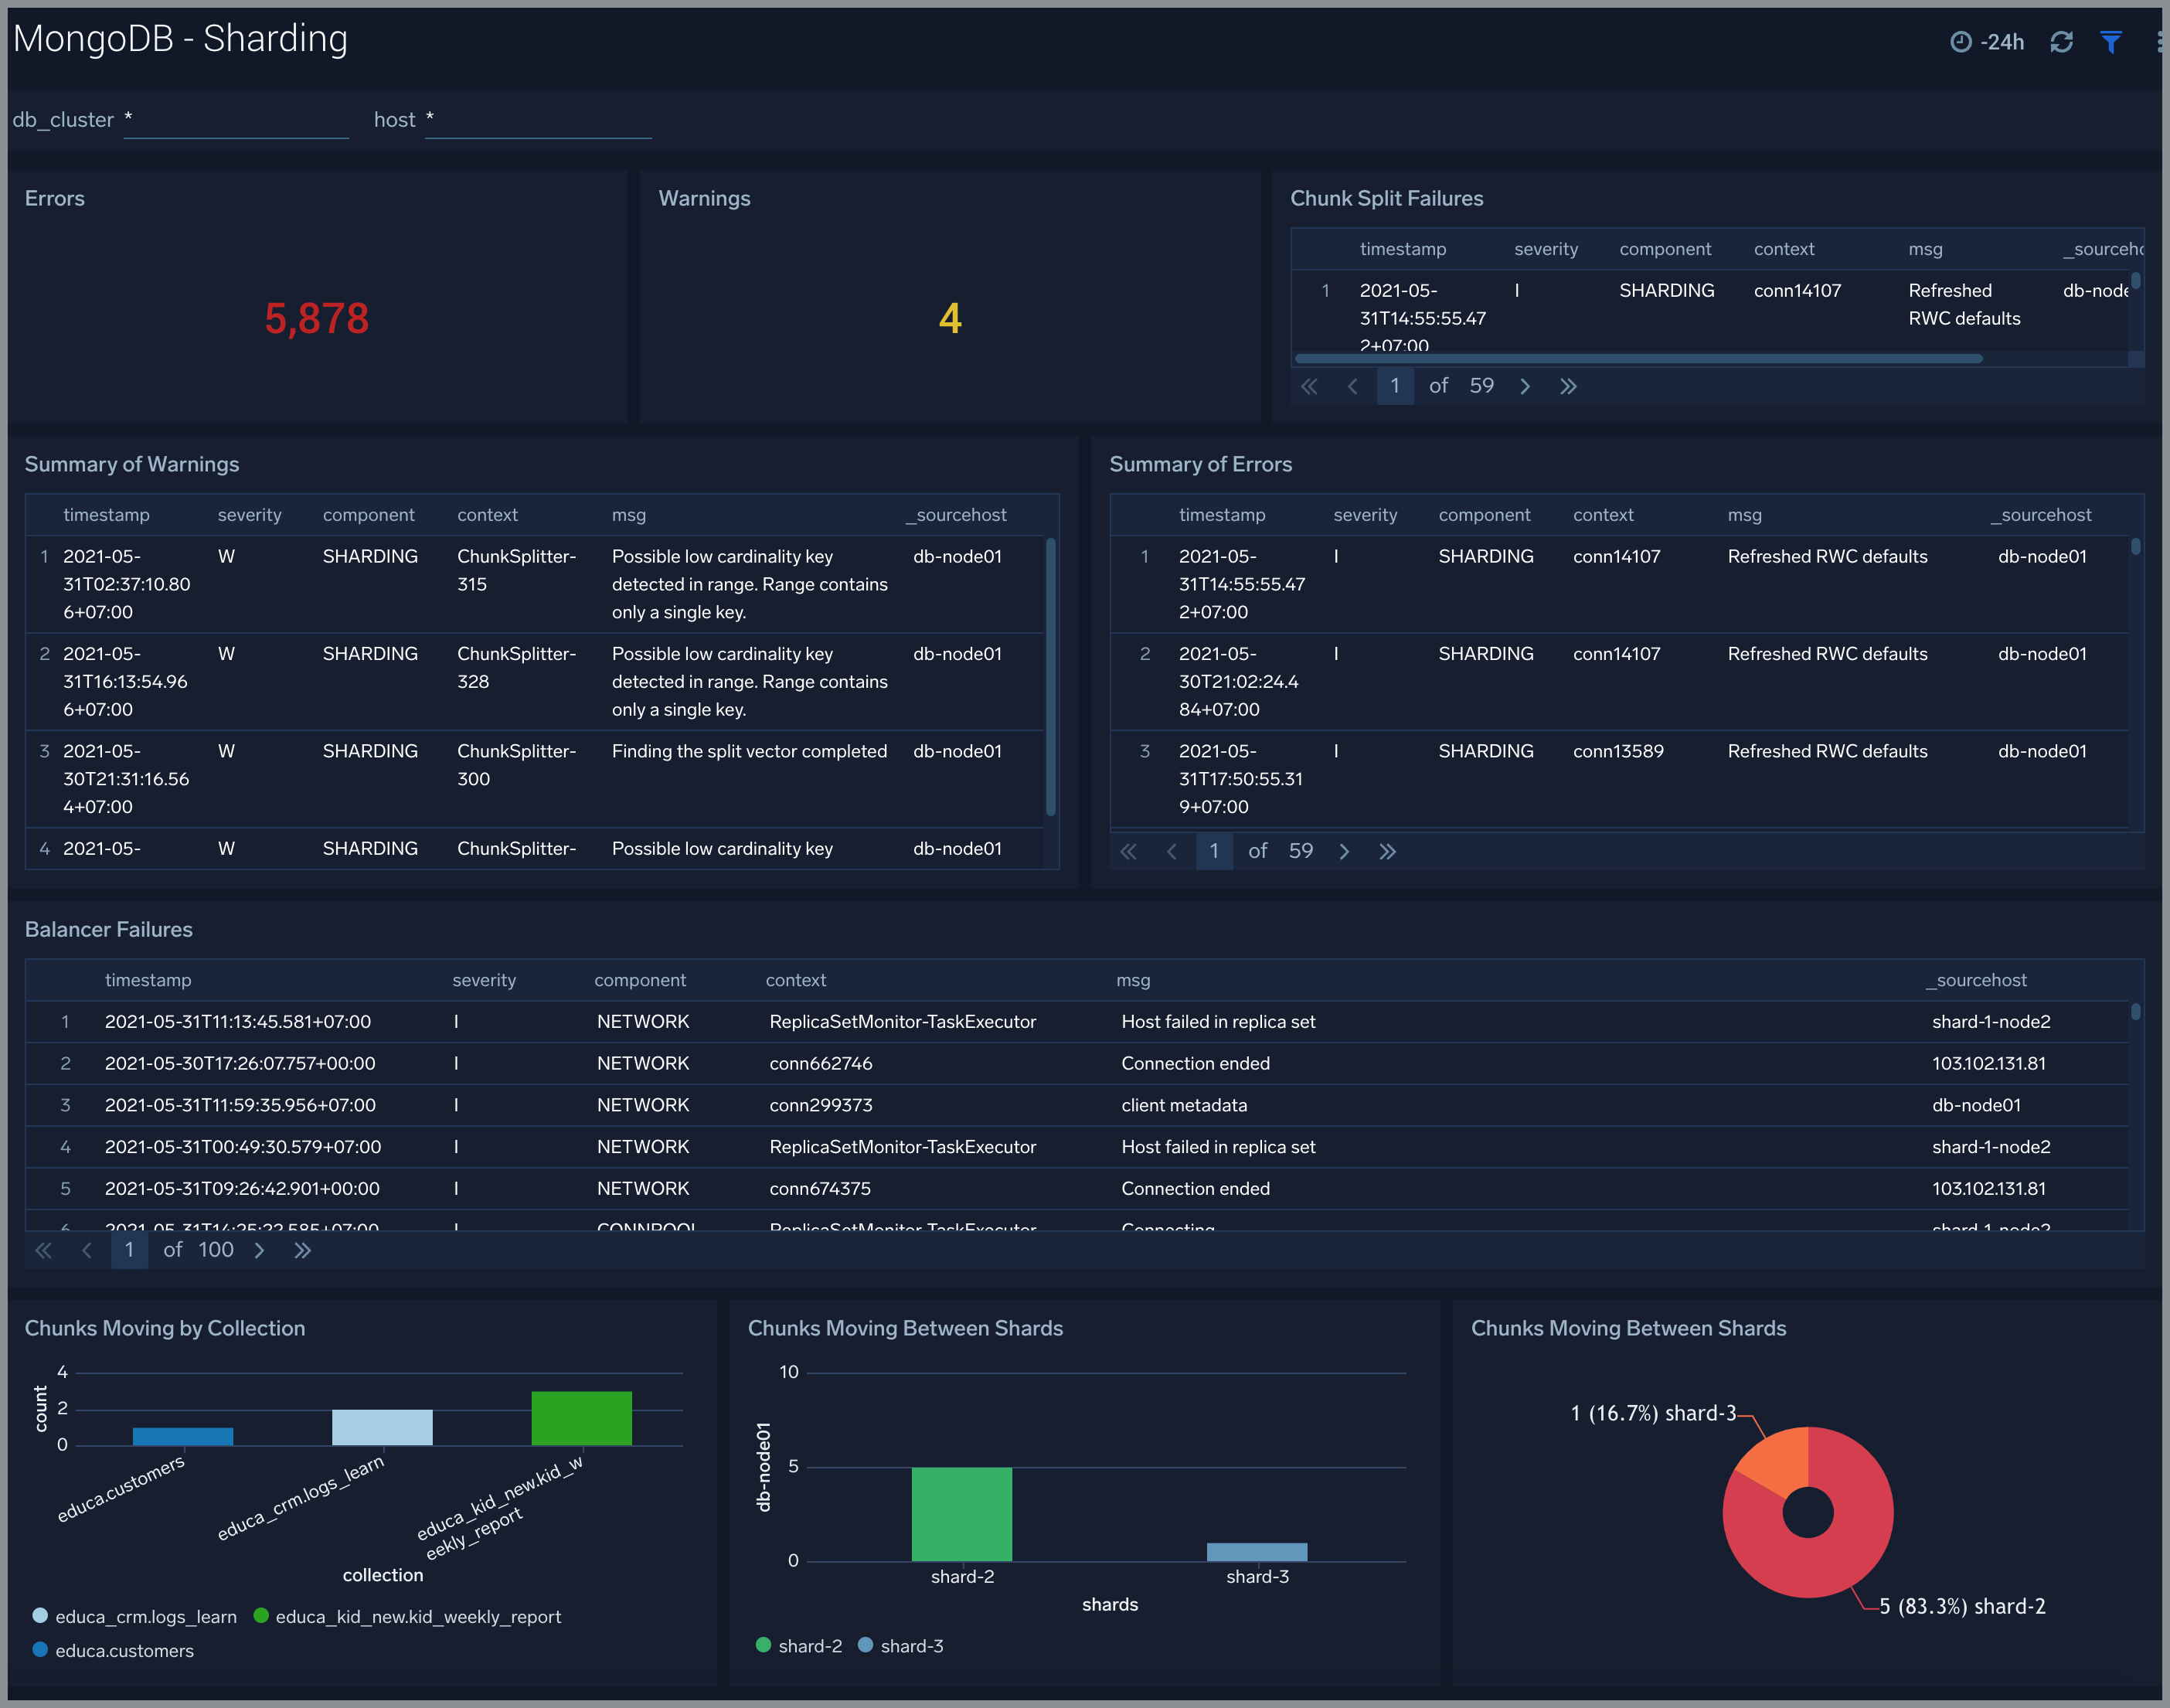
Sharding
The MongoDB - Sharding dashboard dashboard shows sharding related errors, events, failures and number of chunks moving between shards.
Use this dashboard to:
- Identify Sharding errors and warnings.
- Gain insights into Chunk operations.
Create monitors for MongoDB app
From your App Catalog:
- From the Sumo Logic navigation, select App Catalog.
- In the Search Apps field, search for and then select your app.
- Make sure the app is installed.
- Navigate to What's Included tab and scroll down to the Monitors section.
- Click Create next to the pre-configured monitors. In the create monitors window, adjust the trigger conditions and notifications settings based on your requirements.
- Scroll down to Monitor Details.
- Under Location click on New Folder.
note
By default, monitor will be saved in the root folder. So to make the maintenance easier, create a new folder in the location of your choice.
- Enter Folder Name. Folder Description is optional.
tip
Using app version in the folder name will be helpful to determine the versioning for future updates.
- Click Create. Once the folder is created, click on Save.
MongoDB alerts
| Name | Description | Trigger Type | Alert Conditions | Recover Conditions |
|---|---|---|---|---|
| MongoDB - Too Many Cursors Timeouts | This alert fires when we detect that there are too many cursors (100) timing out on a MongoDB server within a 5 minute time interval. | Warning | >= 100 | < 100 |
| MongoDB - Too Many Cursors Open | This alert fires when we detect that there are too many cursors (>10K) opened by MongoDB. | Warning | >= 10000 | < 10000 |
| MongoDB - Missing Primary | This alert fires when we detect that a MongoDB cluster has no node marked as primary. | Critical | <= 0 | > 0 |
| MongoDB - Instance Down | This alert fires when we detect that the MongoDB instance is down. | Missing Data | :-- | :-- |
| MongoDB - Replication Lag | This alert fires when we detect that the replica lag for a given MongoDB cluster is greater than 60 seconds. Please review the replication configuration. | Warning | > 60 | <= 60 |
| MongoDB - Replication Heartbeat Error | This alert fires when we detect that the MongoDB Replication Heartbeat request has errors, which indicates replication is not working as expected. | Warning | > 0 | <= 0 |
| MongoDB - Too Many Connections | This alert fires when we detect a given MongoDB server has too many connections (over 80% of capacity). | Warning | >= 80 | < 80 |
| MongoDB - Secondary Node Replication Failure | This alert fires when we detect that a MongoDB secondary node is out of sync for replication. | Warning | > 0 | <= 0 |
| MongoDB - Slow Queries | This alert fires when we detect that a MongoDB cluster is executing slow queries. | Warning | > 0 | <= 0 |
| MongoDB - Sharding Warning | This alert fires when we detect warnings in MongoDB sharding operations. | Warning | > 0 | <= 0 |
| MongoDB - Sharding Chunk Split Failure | This alert fires when we detect that a MongoDB chunk not been split during sharding. | Warning | > 0 | <= 0 |
| MongoDB - Sharding Error | This alert fires when we detect errors in MongoDB sharding operations. | Critical | > 0 | <= 0 |
| MongoDB - Replication Error | This alert fires when we detect errors in MongoDB replication operations. | Warning | > 0 | <= 0 |
| MongoDB - Sharding Balancer Failure | This alert fires when we detect that data balancing failed on a MongoDB Cluster with 1 mongos instance and 3 mongod instances. | Warning | > 0 | <= 0 |