MySQL - Classic Collector

The Sumo Logic app for MySQL is a unified logs and metrics app that helps you monitor the availability, performance and resource utilization of MySQL database clusters. Preconfigured dashboards and searches provide insight into the health of your MySQL clusters, replication status, error logs, query performance, slow queries, Innodb operations, failed logins and error logs.
The MySQL app supports following versions:
- MySQL 5.5.35-1 and later
- Percona MySQL 5.6.17 and later
- MySQL 8.0.x
MySQL app Searches
The predefined searches in the MySQL app are based on the following log types.
Searches based on Error logs
- MySQL - Crash Recovery Attempts by Host
- MySQL - Number of Replication Completion Events by Host
- MySQL - Replication Failures by Host
- MySQL - Server Latest Replication State
- MySQL - Server Latest Running State
- MySQL - Server Up-Down Events by Host
Searches based on Slow Query logs
- Slow Query Server Location. If your servers are not using private IP addresses, you can use the Slow Query Server Location search to visualize their locations on a map of the world.
Log and Metrics Types
The Sumo Logic app for MySQL assumes the default MySQL Error log file format for error logs, and the MySQL Slow Query file format for slow query logs. For a list of metrics that are collected and used by the app, see MySQL Metrics.
- The MySQL - Overview dashboard is based on logs from both the Error and Slow Query log formats, so as to correlate information between the two.
- Dashboards in the Metrics folder are based on MySQL metrics.
- Dashboards in the Logs folder are based on MySQL logs from both the Error and Slow Query log formats.
- Dashboards based on the Error format:
- MySQL - Error Logs
- MySQL - Failed Logins
- MySQL - Replication
- Dashboard based on Slow Query format:
- MySQL - Slow Queries
- Dashboards based on the Error format:
- MySQL General Health is based on logs from the MySQL Error log format.
- MySQL Replication is based on logs from the MySQL Error log format.
- MySQL Slow Queries is based on logs from the MySQL Slow Queries log format.
The MySQL app dashboards dependent on error logs are based on the message types ERROR, NOTE, Warning, and Info. For more details on the MySQL log file format, see http://dev.mysql.com/doc/refman/5.5/en/server-logs.html.
Sample log messages
- Kubernetes environments
- Non-Kubernetes environments
{
  "timestamp":1617810938497,
  "log":"2021-04-07T15:55:34.261220Z 0 [System] [MY-010931] [Server] /opt/bitnami/mysql/bin/mysqld: ready for connections. Version: '8.0.23'  socket: '/opt/bitnami/mysql/tmp/mysql.sock'  port: 3306  Source distribution.",
  "stream":"stdout",
  "time":"2021-04-07T15:55:34.261397194Z"
}
210408 00:00:19 [Note] /usr/sbin/mysqld: ready for connections.
Sample queries
This sample query is from the MySQL - Logs dashboard > Logs panel.
- Kubernetes environments
- Non-Kubernetes environments
db_system=mysql db_cluster={{db_cluster}} "User@Host" "Query_time"
| parse regex "(?<query_block># User@Host:[\S\s]+?SET timestamp=\d+;[\S\s]+?;)" multi
| parse regex field=query_block "# User@Host: \S+?\[(?<user>\S*?)\] @ (?<host_name>\S+)\s\[(?<ip_addr>\S*?)\]" nodrop // Pttrn1-vrtn1
| parse regex field=query_block "# User@Host: \S+?\[(?<user>\S*?)\] @\s+\[(?<ip_addr>\S*?)\]\s+Id:\s+(?<Id>\d{1,10})" nodrop // Pttrn1-vrtn2
| parse regex field=query_block "# User@Host: \S+?\[(?<user>\S*?)\] @ (?<host_name>\S+)\s\[(?<ip_addr>\S*?)\]\s+Id:\s+(?<Id>\d{1,10})" // Pttrn1-vrtn3
| parse regex field=query_block "Schema: (?<schema>(?:\S*|\s)?)\s*Last_errno[\s\S]+?Query_time:\s+(?<query_time>[\d.]*)\s+Lock_time:\s+(?<lock_time>[\d.]*)\s+Rows_sent:\s+(?<rows_sent>[\d.]*)\s+Rows_examined:\s+(?<rows_examined>[\d.]*)\s+Rows_affected:\s+(?<rows_affected>[\d.]*)\s+Rows_read:\s+(?<rows_read>[\d.]*)\n" nodrop // Pttrn2-vrtn1
| parse regex field=query_block "Schema: (?<schema>(?:\S*|\s)?)\s*Last_errno[\s\S]+?\s+Killed:\s+\d+\n" nodrop // Pttrn2-vrtn2
| parse regex field=query_block "Query_time:\s+(?<query_time>[\d.]*)\s+Lock_time:\s+(?<lock_time>[\d.]*)\s+Rows_sent:\s+(?<rows_sent>[\d]*)\s+Rows_examined:\s+(?<rows_examined>[\d]*)\s+Rows_affected:\s+(?<rows_affected>[\d]*)\s+" nodrop // Pttrn2-vrtn3
| parse regex field=query_block "Query_time:\s+(?<query_time>[\d.]*)\s+Lock_time:\s+(?<lock_time>[\d.]*)\s+Rows_sent:\s+(?<rows_sent>[\d]*)\s+Rows_examined:\s+(?<rows_examined>[\d]*)" // Pttrn2-vrtn4
| parse regex field=query_block "# Bytes_sent:\s+(?<bytes_sent>\d*)\s+Tmp_tables:\s+(?<tmp_tables>\d*)\s+Tmp_disk_tables:\s+(?<temp_disk_tables>\d*)\s+Tmp_table_sizes:\s+(?<tmp_table_sizes>\d*)\n" nodrop // Pttrn3-vrtn1
| parse regex field=query_block "# Bytes_sent:\s+(?<bytes_sent>\d*)\n" nodrop // Pttrn3-vrtn2
| parse regex field=query_block "SET timestamp=(?<set_timestamp>\d*);(?:\\n|\n)(?<sql_cmd>[\s\S]*);" nodrop
| fields -query_block
| avg(query_time) as avg_time, sum(query_time) as total_time, min(query_time) as min_time, max(query_time) as max_time, avg(rows_examined) as avg_rows_examined, avg(rows_sent) as avg_rows_sent, avg(Lock_Time) as avg_lock_time, count as frequency group by sql_cmd, db_cluster
| sort by avg_time | limit 10
Collecting logs and metrics for MySQL
Configuring log and metric collection for the MySQL app includes the following tasks.
Configure MySQL Logs and Metrics Collection
- Kubernetes environments
- Non-Kubernetes environments
In Kubernetes environments, we use the Telegraf Operator, which is packaged with our Kubernetes collection. For more information, see Telegraf Collection Architecture.
The diagram below illustrates how data is collected from MySQL in Kubernetes environments. In the architecture shown below, there are four services that make up the metric collection pipeline: Telegraf, Telegraf Operator, Prometheus, and Sumo Logic Distribution for OpenTelemetry Collector.
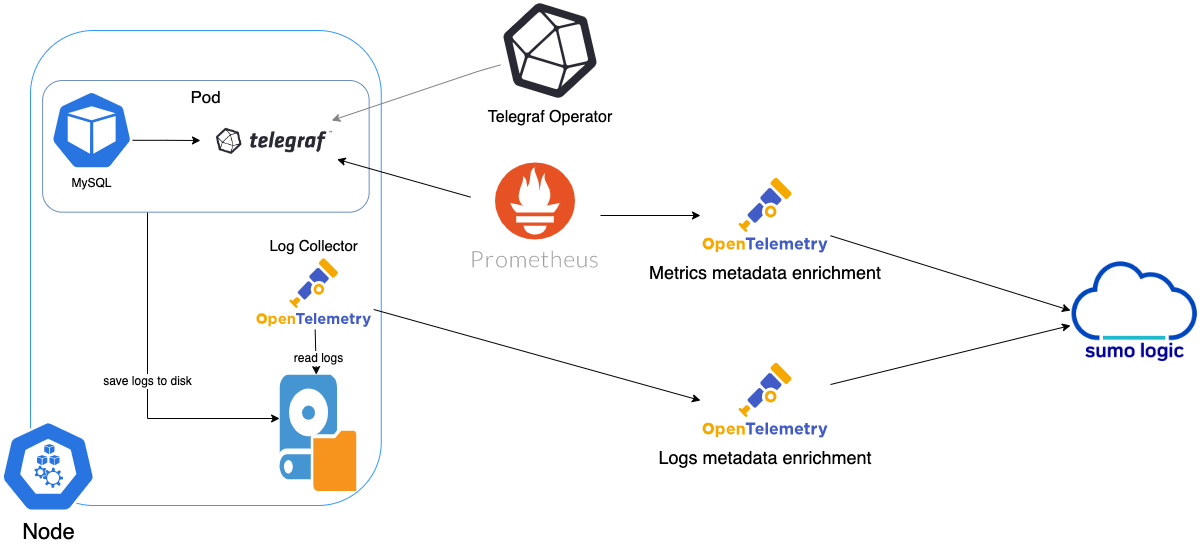
The first service in the metrics pipeline is Telegraf. Telegraf collects metrics from MySQL. Note that we’re running Telegraf in each pod we want to collect metrics from as a sidecar deployment: that is, Telegraf runs in the same pod as the containers it monitors. Telegraf uses the MySQL input plugin to obtain metrics. (For simplicity, the diagram doesn’t show the input plugins.) The injection of the Telegraf sidecar container is done by the Telegraf Operator. Prometheus pulls metrics from Telegraf and sends them to Sumo Logic Distribution for OpenTelemetry Collector which enriches metadata and sends metrics to Sumo Logic.
In the logs pipeline, Sumo Logic Distribution for OpenTelemetry Collector collects logs written to standard out and forwards them to another instance of Sumo Logic Distribution for OpenTelemetry Collector, which enriches metadata and sends logs to Sumo Logic.
Ensure that you are monitoring your Kubernetes clusters with the Telegraf operator. If you're not, see Install Telegraf.
Step 1: Configure Metrics collection
This configures metrics collection from Kubernetes.
- Add the following annotations to your MySQL pods, and make the edits described below:
primary:
  podAnnotations:
    telegraf.influxdata.com/class: sumologic-prometheus
    prometheus.io/scrape: "true"
    prometheus.io/port: "9273"
    telegraf.influxdata.com/inputs: |+
      [[inputs.mysql]]
       servers = ["user:passwd@tcp(localhost:3306)/?tls=false"]
        table_schema_databases = []
        gather_slave_status = true
        gather_global_variables = true
        gather_table_io_waits = true
        gather_table_lock_waits = true
        gather_index_io_waits = true
        gather_event_waits = true
        gather_file_events_stats = true
        gather_perf_events_statements = true
        [inputs.mysql.tags]
          environment = "ENV_TO_BE_CHANGED"
          component = "database"
          db_system = "mysql"
          db_cluster = "ENV_TO_BE_CHANGED"
          db_cluster_address = "ENV_TO_BE_CHANGED"
          db_cluster_port = "ENV_TO_BE_CHANGED"
    tailing-sidecar: sidecarconfig;slowlog:data:/bitnami/mysql/data/mysql-release-0-slow.log
- Enter values for the following parameters in your annotations:
telegraf.influxdata.com/inputs. This contains the required configuration for the Telegraf MySQL Input plugin. For information on configuring the MySQL input plugin for Telegraf, see the MySQL Input Plugin Readme. Because Telegraf will be run as a sidecar the host should always be localhost.- In
[[inputs.mysql]]:servers.The URL to the MySQL server- Configure metrics to collect by uncommenting or setting the following parameters. For more information, see the MySQL Input Plugin README.
table_schema_databases = []gather_slave_status = truegather_global_variables = truegather_table_io_waits = truegather_table_lock_waits = truegather_index_io_waits = truegather_event_waits = truegather_file_events_stats = truegather_perf_events_statements = true
- In
[inputs.mysql.tags]:environment. This is the deployment environment where the MySQL cluster identified by the value ofserversresides. For example: dev, prod or qa. While this value is optional we highly recommend setting it.db_cluster. Enter a name to uniquely identify this MySQL cluster. This cluster name will be shown in the Sumo Logic dashboards.db_cluster_address- Enter the cluster hostname or ip address that is used by the application to connect to the database. It could also be the load balancer or proxy endpoint.db_cluster_port- Enter the database port. If not provided, a default port will be used.
db_cluster_address and db_cluster_port should reflect the exact configuration of DB client configuration in your application, especially if you instrument it with OT tracing. The values of these fields should match exactly the connection string used by the database client (reported as values for net.peer.name and net.peer.port metadata fields).
For example, if your application uses “mysql-prod.sumologic.com:3306” as the connection string, the field values should be set as follows: db_cluster_address=mysql-prod.sumologic.com db_cluster_port=3306
If your application connects directly to a given MySQL node, rather than the whole cluster, use the application connection string to override the value of the “host” field in the Telegraf configuration: host=mysql-prod.sumologic.com
Pivoting to Tracing data from Entity Inspector is possible only for “MySQL address” Entities.
- Do not modify the following values as it will cause the Sumo Logic app to not function correctly.
telegraf.influxdata.com/class: sumologic-prometheusinstructs the Telegraf operator what output to use.prometheus.io/scrape: "true"ensures Prometheus will scrape the metrics.prometheus.io/port: "9273"tells Prometheus what ports to scrape on.telegraf.influxdata.com/inputs- In the
[inputs.mysql.tags]section: component: "database"is used by the Sumo Logic app to identify application components.db_system: "mysql"identifies the database system.
- In the
- For information about properties that can be configured globally in the Telegraf agent, see the Configuration documentation for Telegraf.
- Sumo Logic Kubernetes collection will automatically start collecting metrics from the pods with the labels and annotations you added in the previous step.
- To verify the metrics have been ingested, run this metrics query:
db_cluster=<your_mysql_cluster_name> component="database" and db_system="mysql"
Configure Logs collection
This section explains the steps to collect MySQL logs from a Kubernetes environment.
- Follow the steps in Method A or Method B, depending on whether your logs are being written to standard output or to log files.
Method A: Collect MySQL logs written to standard output
If your MySQL Helm chart/pod is writing the logs to standard output, follow these steps:
Apply the following labels to your MySQL pods:
labels:
    environment: "prod"
    component: "database"
    db_system: "mysql"
    db_cluster: "your_mysql_cluster_name"
Enter in values for the following parameters (marked CHANGEME in the snippet above):
environment.This is the deployment environment where the MySQL cluster identified by the value ofserversresides. For example: dev, prod or qa. While this value is optional we highly recommend setting it.db_cluster. Enter a name to identify this MySQL cluster. This cluster name will be shown in the Sumo Logic dashboards.
There are additional configuration options that you should not modify, as changing them will prevent the MySQL app from functioning correctly. The settings you should not modify are:
component: "database"is used by Sumo Logic apps to identify application components.db_system: "mysql"identifies the database system.
For information about properties that can be configured globally in the Telegraf agent, see the Configuration documentation for Telegraf.
The Sumo Logic Kubernetes Collection process will automatically capture the logs from stdout and send the logs to Sumo Logic. For more information on deploying the sumologic-kubernetes-collection, see Collect Logs and Metrics for the Kubernetes app.
Method B: Collect MySQL logs written to log files
This method is recommend for Slow Query Logs. If your MySQL helm chart/pod is writing its logs to log files, you can use a sidecar to send log files to standard out. To do so:
- Determine the location of the MySQL log file on Kubernetes. You can determine this from the
my.cnffile for your MySQL cluster along with the volume mounts on the MySQL pods. - Install the Sumo Logic tailing sidecar operator.
- Add the following annotation in addition to the existing annotations.
   primary:
     podAnnotations:
      tailing-sidecar: sidecarconfig;container_name:<mount_volume>:<path_of_mysql_log_file>/<mysql_log_file_name>
For example:
 primary:
   podAnnotations:
    tailing-sidecar: sidecarconfig;slowlog:data:/bitnami/mysql/data/mysql-release-0-slow.log
To verify that the MySQL pods are running and annotations are applied, run this command:
kubectl describe pod <mysql_pod_name>
Sumo Logic Kubernetes collection will automatically start collecting logs from the pods having the annotations defined above.
FER to normalize the fields in Kubernetes environments. Labels created in Kubernetes environments automatically are prefixed with pod_labels. To normalize these for our app to work, a Field Extraction Rule named AppObservabilityMySQLDatabaseFER is automatically created for Database Application Components.
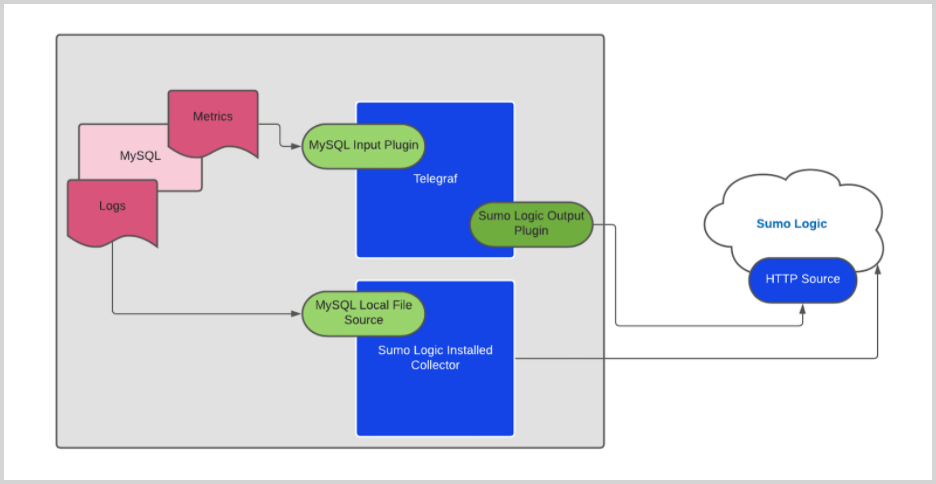
In non-Kubernetes environments, we use the Telegraf Operator for MySQL metric collection and a Sumo Logic Installed Collector for collecting MySQL logs.
The diagram below illustrates the components of the MySQL collection in a non-Kubernetes environment for each database server. Telegraf runs on the same host as MySQL, and uses the MySQL input plugin to obtain MySQL metrics, and the Sumo Logic output plugin to send the metrics to Sumo Logic. MySQL logs are sent to a Sumo Logic Local File source on an Installed Collector.
Configure Metrics collection
- Configure a Hosted Collector. For instructions, see Configure a Hosted Collector.
- Configure an HTTP Logs and Metrics Source. For instructions, see HTTP Logs and Metrics Source. Make a note of the HTTP Source URL.
- Install Telegraf. For instructions see Install Telegraf.
- Configure and start Telegraf. As part of collecting metrics data from Telegraf, we use the MySQL input plugin to get data from Telegraf and the Sumo Logic output plugin to send data to Sumo Logic.
- Create or modify the
telegraf.conffile, and copy the following into the relevant sections.
[[inputs.mysql]]
  servers = ["user:passwd@tcp(127.0.0.1:3306)/?tls=false"]
  table_schema_databases = []
  gather_slave_status = true
  gather_global_variables = true
  gather_table_io_waits = true
  gather_table_lock_waits = true
  gather_index_io_waits = true
  gather_event_waits = true
  gather_file_events_stats = true
  gather_perf_events_statements = true
  [inputs.mysql.tags]
   environment = "ENV_TO_BE_CHANGED"
   component = "database"
   db_system = "mysql"
   db_cluster = "ENV_TO_BE_CHANGED"
   db_cluster_address = "ENV_TO_BE_CHANGED"
   db_cluster_port = "ENV_TO_BE_CHANGED"
[[outputs.sumologic]]
   url = "CHANGEME"--HTTP Source URL created in Step 2
   data_format = "prometheus"

[agent]
  interval = "60s"
  flush_interval = "60s"
- Follow the instructions in the Setting values in telegraf.conf step below to configure the settings in the
.conffile. - After updating the
telegraf.conffile, start or reload the telegraf service using the instructions in Telegraf documentation. - At this point, MySQL metrics should start flowing into Sumo Logic.
- Setting values in telegraf.conf. Make the following updates to
telegraf.conf.- In the
[[inputs.mysql]]section, setserversto the URL of your MySQL server. For information about additional input plugin configuration options, see the Readme for the MySQL input plugin. - Configure the metrics to collect by uncommenting the following lines. For more information, see this section of the Readme.
[[inputs.mysql]]
 table_schema_databases = []
 gather_slave_status = true
 gather_global_variables = true
 gather_table_io_waits = true
 gather_table_lock_waits = true
 gather_index_io_waits = true
 gather_event_waits = true
 gather_file_events_stats = true
gather_perf_events_statements = true- In the
[inputs.mysql.tags]section:environment. Specify the deployment environment where the MySQL cluster identified by the value ofserversresides. For example: dev, prod or qa. While this value is optional we highly recommend setting it.db_cluster. Enter a name to uniquely identify the MySQL cluster. This cluster name will be shown in the Sumo Logic dashboards.db_cluster_address- Enter the cluster hostname or ip address that is used by the application to connect to the database. It could also be the load balancer or proxy endpoint.db_cluster_port- Enter the database port. If not provided, a default port will be used.
- In the
db_cluster_address and db_cluster_port should reflect the exact configuration of DB client configuration in your application, especially if you instrument it with OT tracing. The values of these fields should match exactly the connection string used by the database client (reported as values for net.peer.name and net.peer.port metadata fields).
For example, if your application uses “mysql-prod.sumologic.com:3306” as the connection string, the field values should be set as follows: db_cluster_address=mysql-prod.sumologic.com db_cluster_port=3306.
If your application connects directly to a given MySQL node, rather than the whole cluster, use the application connection string to override the value of the “host” field in the Telegraf configuration: host=mysql-prod.sumologic.com
Pivoting to Tracing data from Entity Inspector is possible only for “MySQL address” Entities.
- In the
[[outputs.sumologic]]section, seturlto the HTTP source URL created in Step 2 (Configure an HTTP Logs and Metrics Source). For information about additional output plugin configuration options, see Configure Telegraf Output Plugin for Sumo Logic. - In the
[agent]section, setintervalandflush_intervalto“60s”to collect metrics every 60 seconds.
Do not modify these configuration options. Changing them will prevent the MySQL app from functioning correctly.
data_format = "prometheus", in the output plugins section, causes metrics to be sent in the Prometheus format to Sumo Logic.component = "database", in the input plugins section, is used by the Sumo Logic app to identify application components.db_system = "mysql", in the input plugins section, identifies the database system.
For information about properties that can be configured globally in the Telegraf agent, see the Configuration documentation for Telegraf.
Configure Log Collection
This section provides instructions for configuring collection of logs for MySQL running on a non-Kubernetes environment. MySQL logs are stored in log files. Slow query logs must be explicitly enabled to be able to be written to a log file.
Sumo Logic supports collecting logs via a local log file. Local log files can be collected by Sumo Logic Installed Collectors, which requires you to allow outbound traffic to Sumo Logic endpoints for collection to work.
- Configure MySQL to log to a local file(s). MySQL logs written to a log file can be collected via the Local File Source of a Sumo Logic Installed Collector. To configure the MySQL log file(s), locate your local
my.cnfconfiguration file in the database directory.- Open
my.cnfin a text editor. - Set the following parameters in the
[mysqld]section:
[mysqld]
    log_error = /var/log/mysql/error.log
    slow_query_log=1
    slow_query_log_file = /var/log/mysql/mysql-slow.log
long_query_time=2- Error Logs. By default, error logs are enabled and are logged at file specified by the
log_errorkey. - Slow Query Logs.
slow_query_log=1enables logging of slow queries to the file specified byslow_query_log_file. Settinglong_query_time=2will cause queries that take more than two seconds to execute to be logged. The default value oflong_query_timeis 10 seconds. - General Query Logs. We do not recommend enabling
general_logfor performance reasons. These logs are not used by the Sumo Logic MySQL app.
- Save the
my.cnffile. - Restart the MySQL server:
sudo mysql.server restart - Open
- Configure an Installed Collector.
- Add a Local File Source for MySQL error logs.
-
Add a Local File Source in the installed collector configured in the previous step. Configure the Local File Source fields as follows:
- Name. (Required)
- Description. (Optional)
- File Path (Required). Enter the path to your error.log. The files are typically located in
/var/log/mysql/error.log. If you're using a customized path, check themy.cnffile for this information. - Source Host. Sumo Logic uses the hostname assigned by the OS unless you enter a different host nameSource Category. Enter any string to tag the output collected from this Source, such as Prod/MySQL/Error. (The Source Category metadata field is a fundamental building block to organize and label Sources. For details, see Best Practices.)
- Fields. Set the following fields. For more information, see Fields.
component = databasedb_system = mysqldb_cluster = <your_mysql_cluster_name>environment = <Environment_Name>, such as dev, qa, or prod.db_cluster_address- Enter the cluster hostname or ip address that is used by the application to connect to the database. It could also be the load balancer or proxy endpoint.db_cluster_port- Enter the database port. If not provided, a default port will be used. The values ofdb_clusterandenvironmentshould match those configured in the Setting values in telegraf.conf step above.
notedb_cluster_addressanddb_cluster_portshould reflect the exact configuration of DB client configuration in your application, especially if you instrument it with OT tracing. The values of these fields should match exactly the connection string used by the database client (reported as values fornet.peer.nameandnet.peer.portmetadata fields).For example, if your application uses
“mysql-prod.sumologic.com:3306”as the connection string, the field values should be set as follows:db_cluster_address=mysql-prod.sumologic.com db_cluster_port=3306.If your application connects directly to a given MySQL node, rather than the whole cluster, use the application connection string to override the value of the “host” field in the Telegraf configuration:
host=mysql-prod.sumologic.comPivoting to Tracing data from Entity Inspector is possible only for “MySQL address” Entities.
-
In the Advanced Options for Logs section:
- Enable Timestamp Parsing. Select "Extract timestamp information from log file entries".
- Time Zone. Select "Use time zone form log file, if none is detected use Use Collector Default”.
- Timestamp Format. Select "Automatically detect the format."
- Encoding. Select UTF-8 (Default).
- Enable Multiline Processing
- Detect Messages Spanning Multiple Lines. True
- Infer Boundaries - Detect message boundaries automatically. False
- Boundary Regex.
- If error messages starts like
2021-05-11T10:12:55.421100Zthen use boundary regex as below^\d{4}-\d{2}-\d{2}T\d{1,2}:\d{1,2}:\d{1,2}.* - If error messages starts like
210511 11:20:40then use boundary regex as below^\d{6}\s+\d{1,2}:\d{1,2}:\d{1,2}.*
- If error messages starts like
-
Click Save.
-
At this point, MySQL error logs should start flowing into Sumo Logic.
- Configuring a Local File Source for slow query log.
-
Add a Local File Source in the installed collector configured in the previous step. Configure the Local File Source fields as follows:
- Name. (Required)
- Description. (Optional)
- File Path (Required). Enter the path to your
mysql-slow.log. The file is typically located in/var/log/mysql/mysql-slow.log. If you're using a customized path, checkmy.cnffile for this information. - Source Host. Sumo Logic uses the hostname assigned by the OS unless you enter a different host name
- Source Category. Enter any string to tag the output collected from this Source, such as Prod/MySQL/Error. (The Source Category metadata field is a fundamental building block to organize and label Sources. For details, see Best Practices.)
- Fields. Set the following fields. For more information, see Fields.
component = databasedb_system = mysqldb_cluster = <your_mysql_cluster_name>environment = <Environment_Name>, such as dev, qa, or prod.db_cluster_address- Enter the cluster hostname or ip address that is used by the application to connect to the database. It could also be the load balancer or proxy endpoint.db_cluster_port- Enter the database port. If not provided, a default port will be used. The values ofdb_clusterandenvironmentshould match those configured in the Setting values in telegraf.conf step above.
notedb_cluster_addressanddb_cluster_portshould reflect exact configuration of DB client configuration in your application, especially if you instrument it with OT tracing. The values of these fields should match exactly the connection string used by the database client (reported as values for net.peer.name and net.peer.port metadata fields).For example, if your application uses
“mysql-prod.sumologic.com:3306”as the connection string, the field values should be set as follows:db_cluster_address=mysql-prod.sumologic.com db_cluster_port=3306If your application connects directly to a given mysql node, rather than the whole cluster, use the application connection string to override the value of the “host” field in the Telegraf configuration:
host=mysql-prod.sumologic.com.Pivoting to Tracing data from Entity Inspector is possible only for “MySQL address” Entities.
-
In the Advanced Options for Logs section:
- Enable Timestamp Parsing. Select "Extract timestamp information from log file entries".
- Time Zone. Select "Use time zone form log file, if none is detected use Use Collector Default".
- Timestamp Format. Select "Automatically detect the format".
- Encoding. Select "UTF-8" (Default).
- Enable Multiline Processing
- Detect Messages Spanning Multiple Lines. True
- Infer Boundaries - Detect message boundaries automatically. False
- Boundary Regex.
^#\sTime:\s.*
-
Click Save.
-
At this point, MySQL slow query logs should start flowing into Sumo Logic.
Installing the MySQL app
To install the app, do the following:
Next-Gen App: To install or update the app, you must be an account administrator or a user with Manage Apps, Manage Monitors, Manage Fields, Manage Metric Rules, and Manage Collectors capabilities depending upon the different content types part of the app.
- Select App Catalog.
- In the 🔎 Search Apps field, run a search for your desired app, then select it.
- Click Install App.
note
Sometimes this button says Add Integration.
- Click Next in the Setup Data section.
- In the Configure section of your respective app, complete the following fields.
- Is K8S deployment involved. Specify if resources being monitored are partially or fully deployed on Kubernetes (K8s)
- Click Next. You will be redirected to the Preview & Done section.
Post-installation
Once your app is installed, it will appear in your Installed Apps folder, and dashboard panels will start to fill automatically.
Each panel slowly fills with data matching the time range query received since the panel was created. Results will not immediately be available but will be updated with full graphs and charts over time.
As part of the app installation process, the following fields will be created by default:
componentenvironmentdb_systemdb_clusterdb_cluster_addressdb_cluster_port
Additionally, if you are using MySQL in the Kubernetes environment, the following additional fields will be created by default during the app installation process:
pod_labels_componentpod_labels_environmentpod_labels_db_systempod_labels_db_clusterpod_labels_db_cluster_addresspod_labels_db_cluster_port
For information on setting up fields, see Fields.
Viewing MySQL dashboards
All dashboards have a set of filters that you can apply to the entire dashboard. Use these filters to drill down and examine the data to a granular level.
- You can change the time range for a dashboard or panel by selecting a predefined interval from a drop-down list, choosing a recently used time range, or specifying custom dates and times. Learn more.
- You can use template variables to drill down and examine the data on a granular level. For more information, see Filtering Dashboards with Template Variables.
- Most Next-Gen apps allow you to provide the scope at the installation time and are comprised of a key (
_sourceCategoryby default) and a default value for this key. Based on your input, the app dashboards will be parameterized with a dashboard variable, allowing you to change the dataset queried by all panels. This eliminates the need to create multiple copies of the same dashboard with different queries.
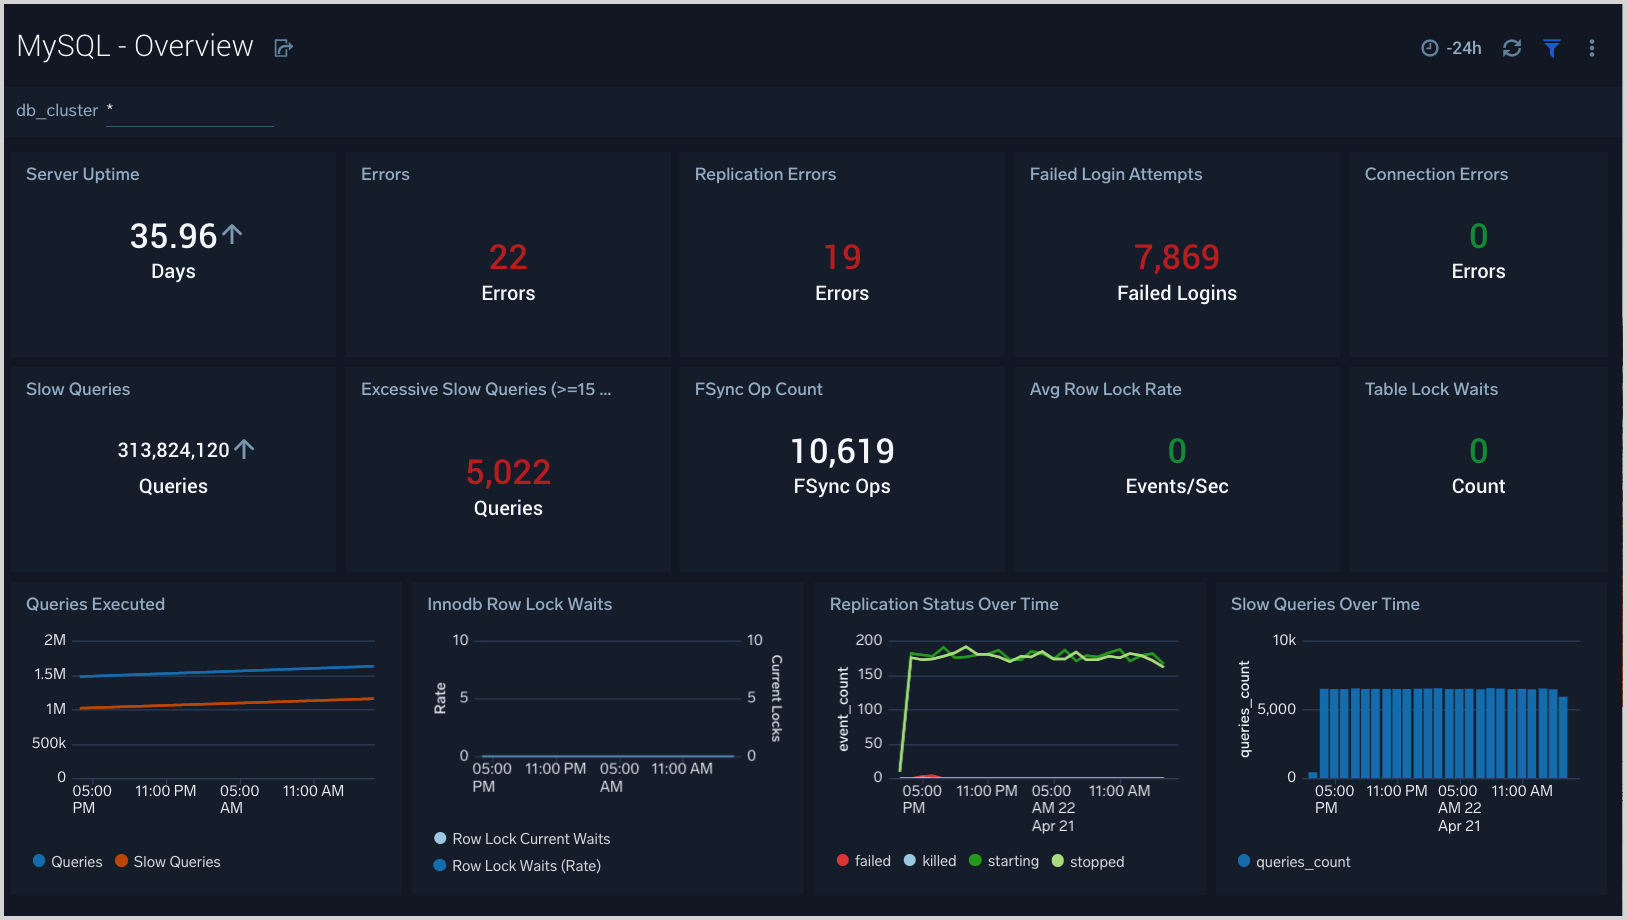
Overview
The MySQL - Overview dashboard gives you an at-a-glance view of the state of your database clusters by monitoring key cluster information such as errors, failed logins, errors, queries executed, slow queries, lock waits, uptime and more.
Use this dashboard to:
- Quickly identify the state of a given database cluster.
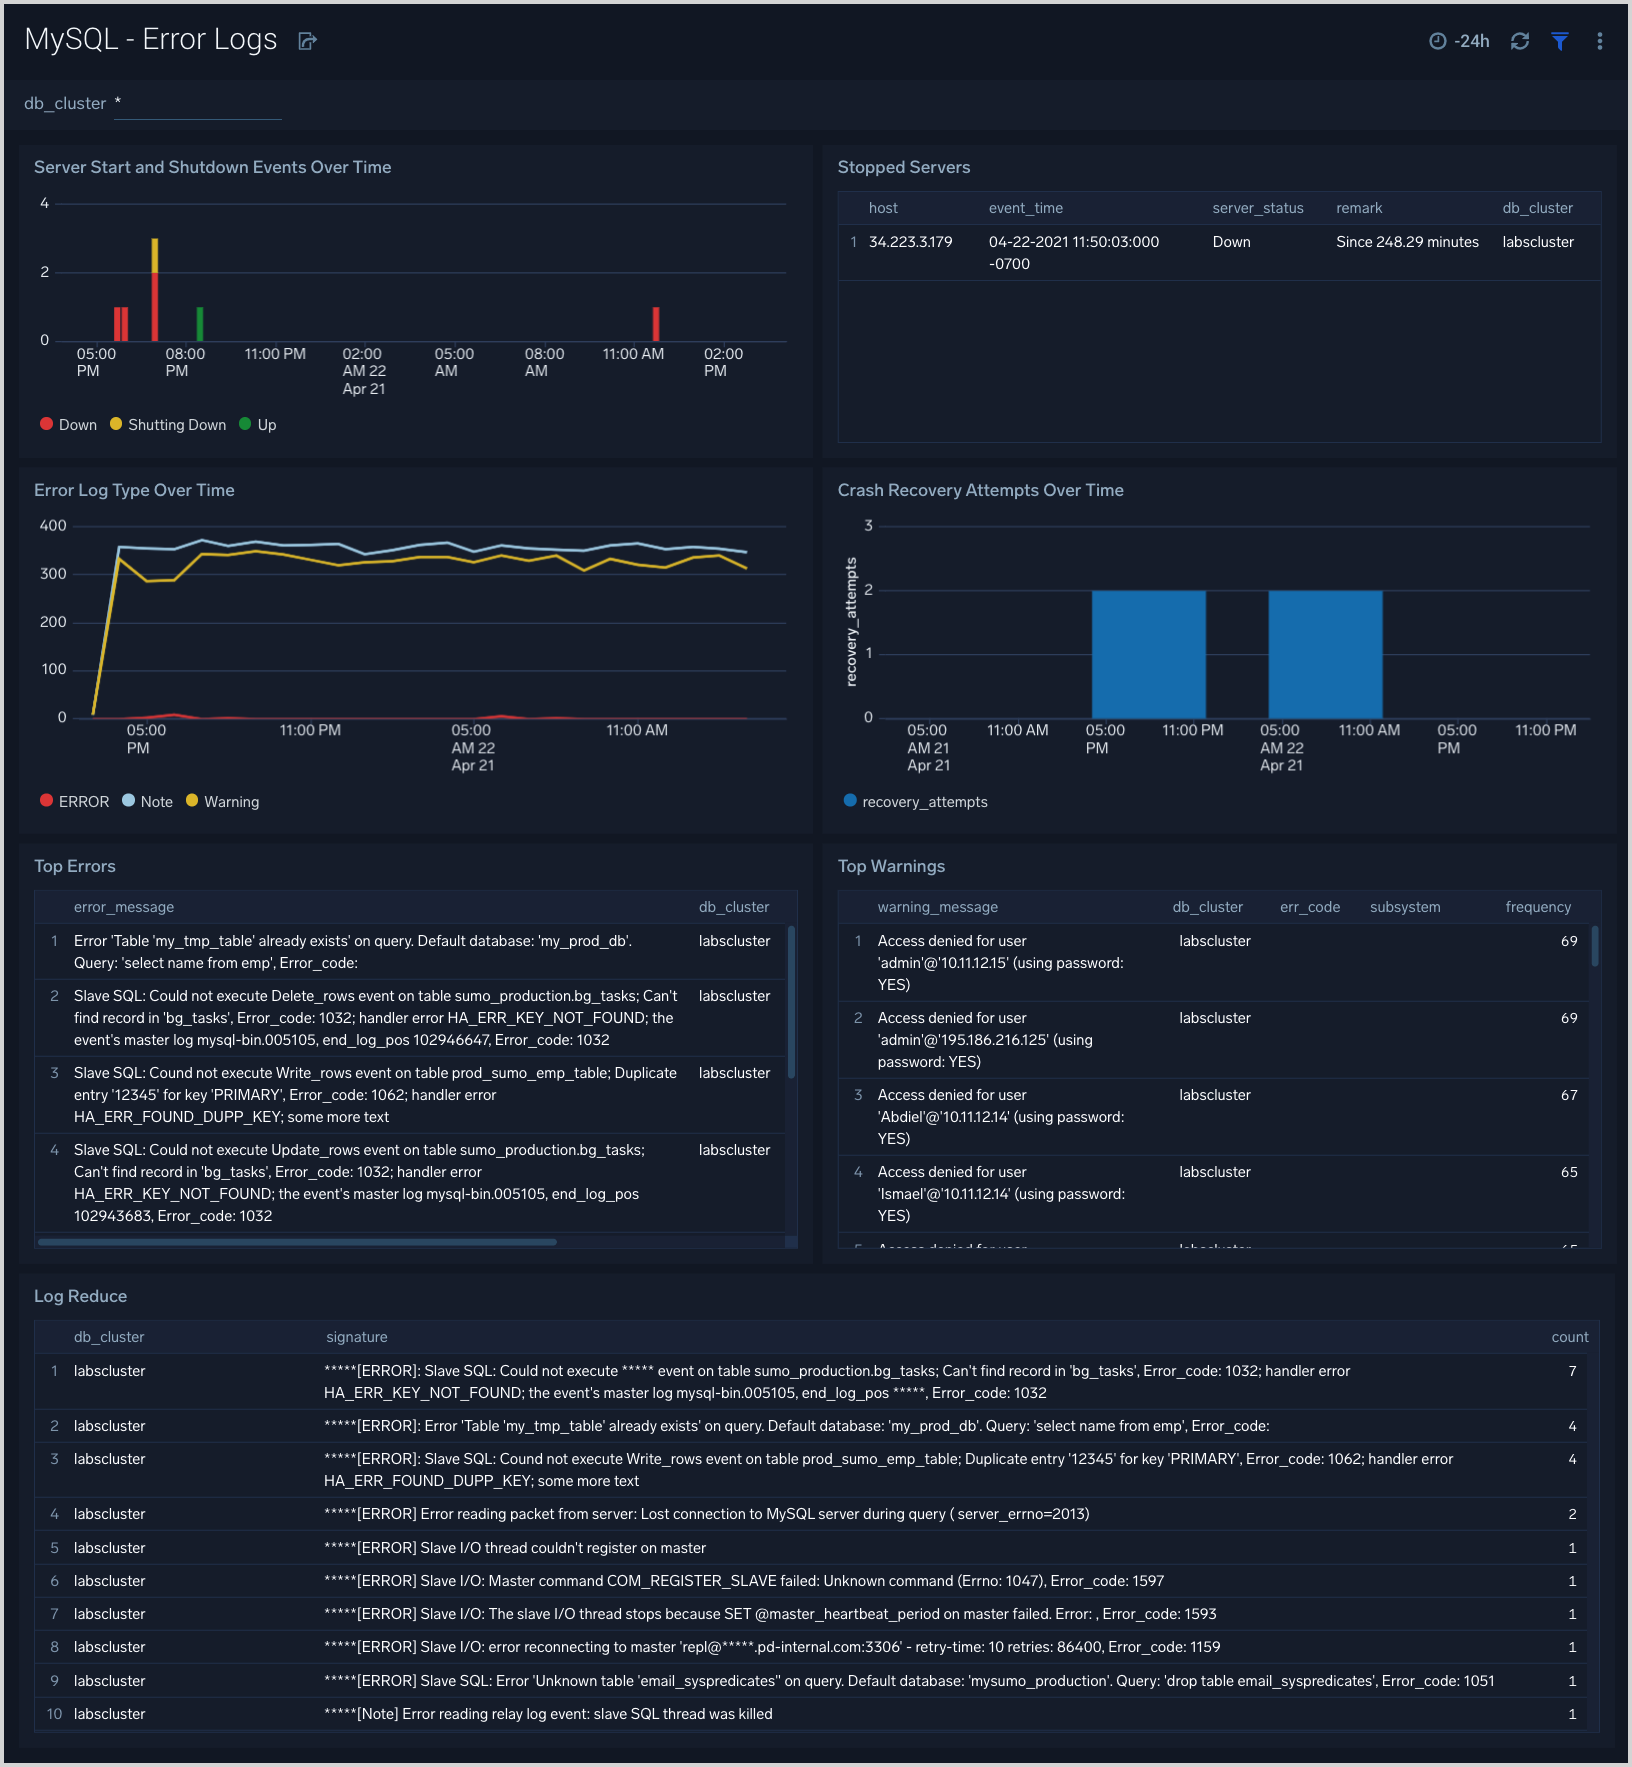
Error Logs
The MySQL - Error Logs dashboard provides insight into database error logs by specifically monitoring database shutdown/start events, errors over time, errors, warnings, and crash recovery attempts.
Use this dashboard to:
- Quickly identify errors and patterns in logs for troubleshooting.
- Monitor trends in error logs and identify outliers.
- Ensure that server start, server stop and crash recovery events are in line with expectations.
- Dashboard filters allow you to narrow a search for database cluster.
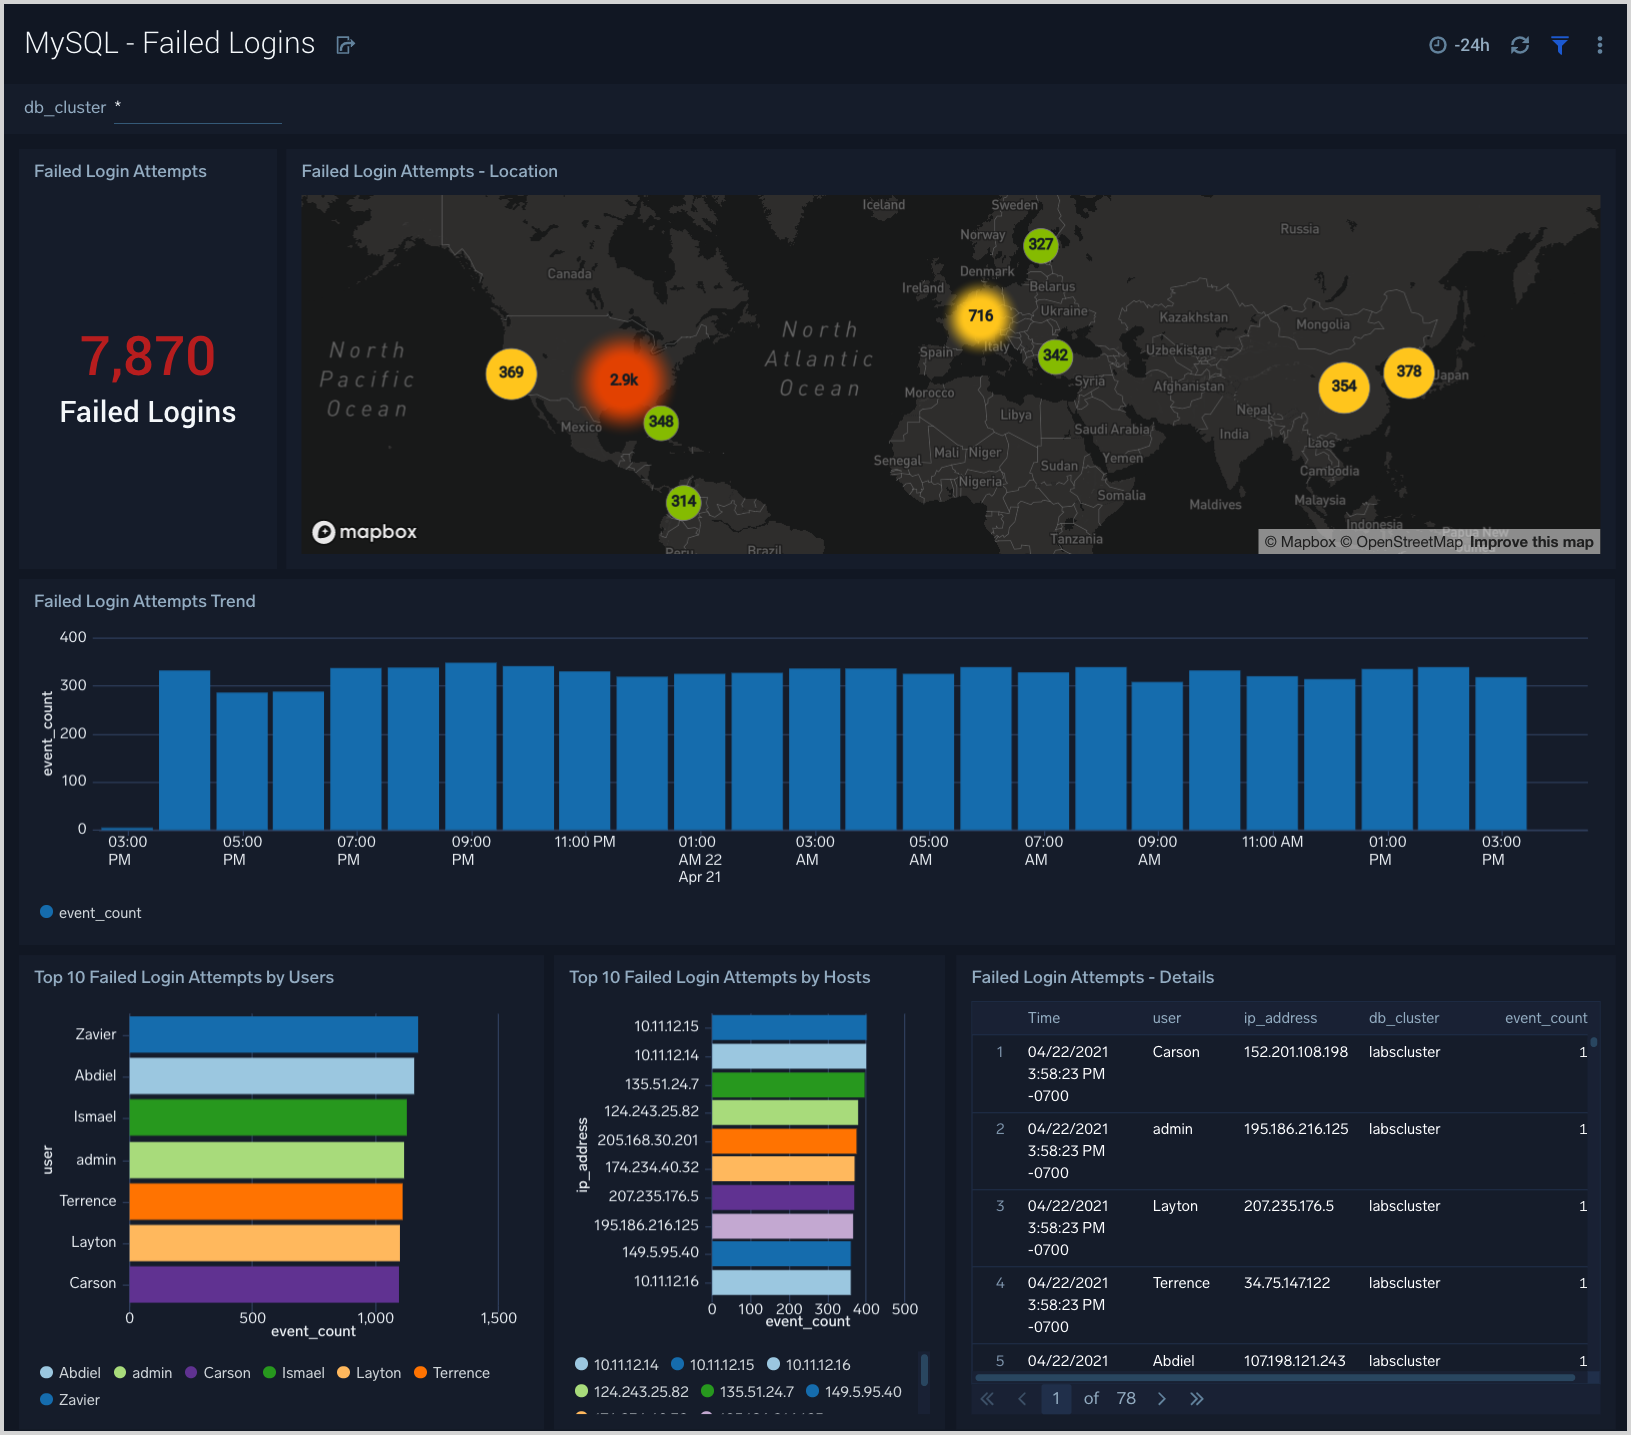
Failed Logins
The MySQL - Failed Logins dashboard provides insights into all failed login attempts by location, users, and hosts.
Use this dashboard to:
- Monitor all failed login attempts and identify any unusual or suspicious activity.
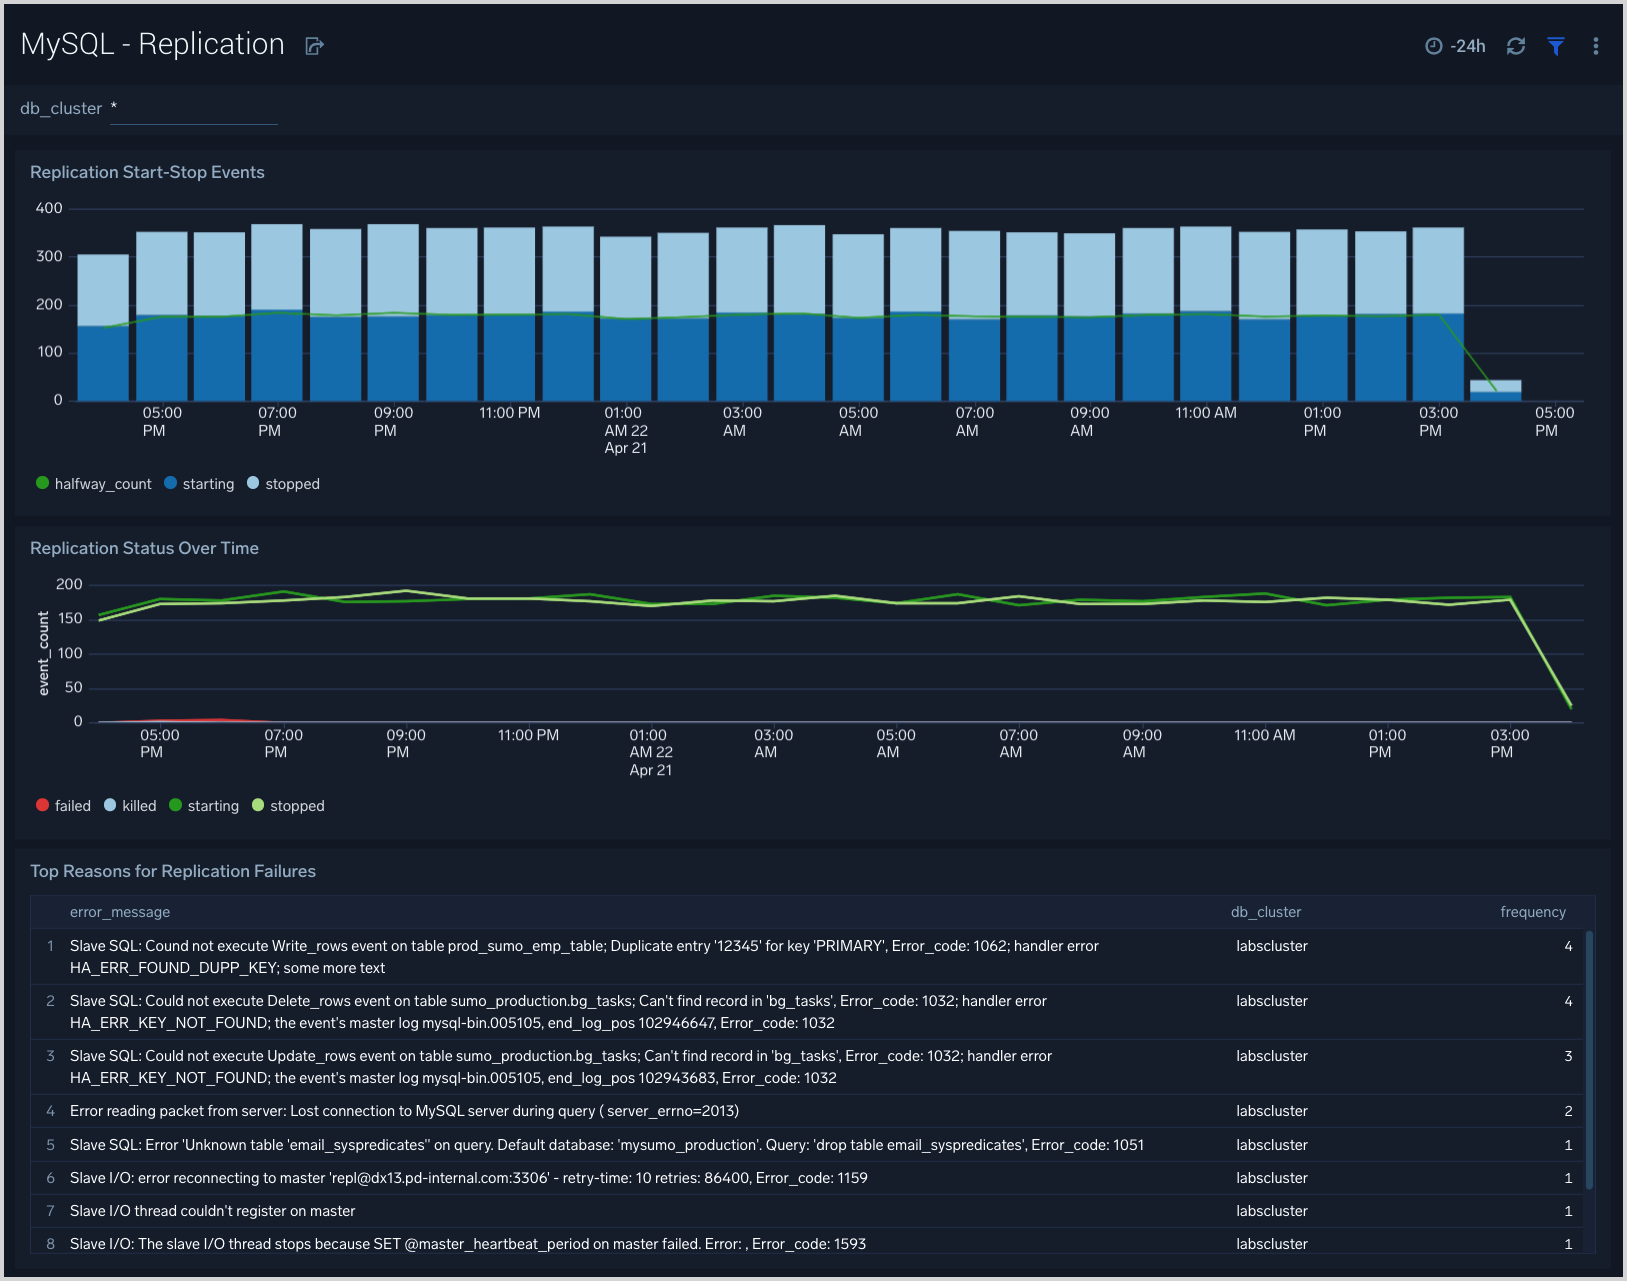
Replication
The MySQL - Replication dashboard provides insights into the state of database replication.
Use this dashboard to:
- Quickly determine reasons for replication failures.
- Monitor replication status trends.
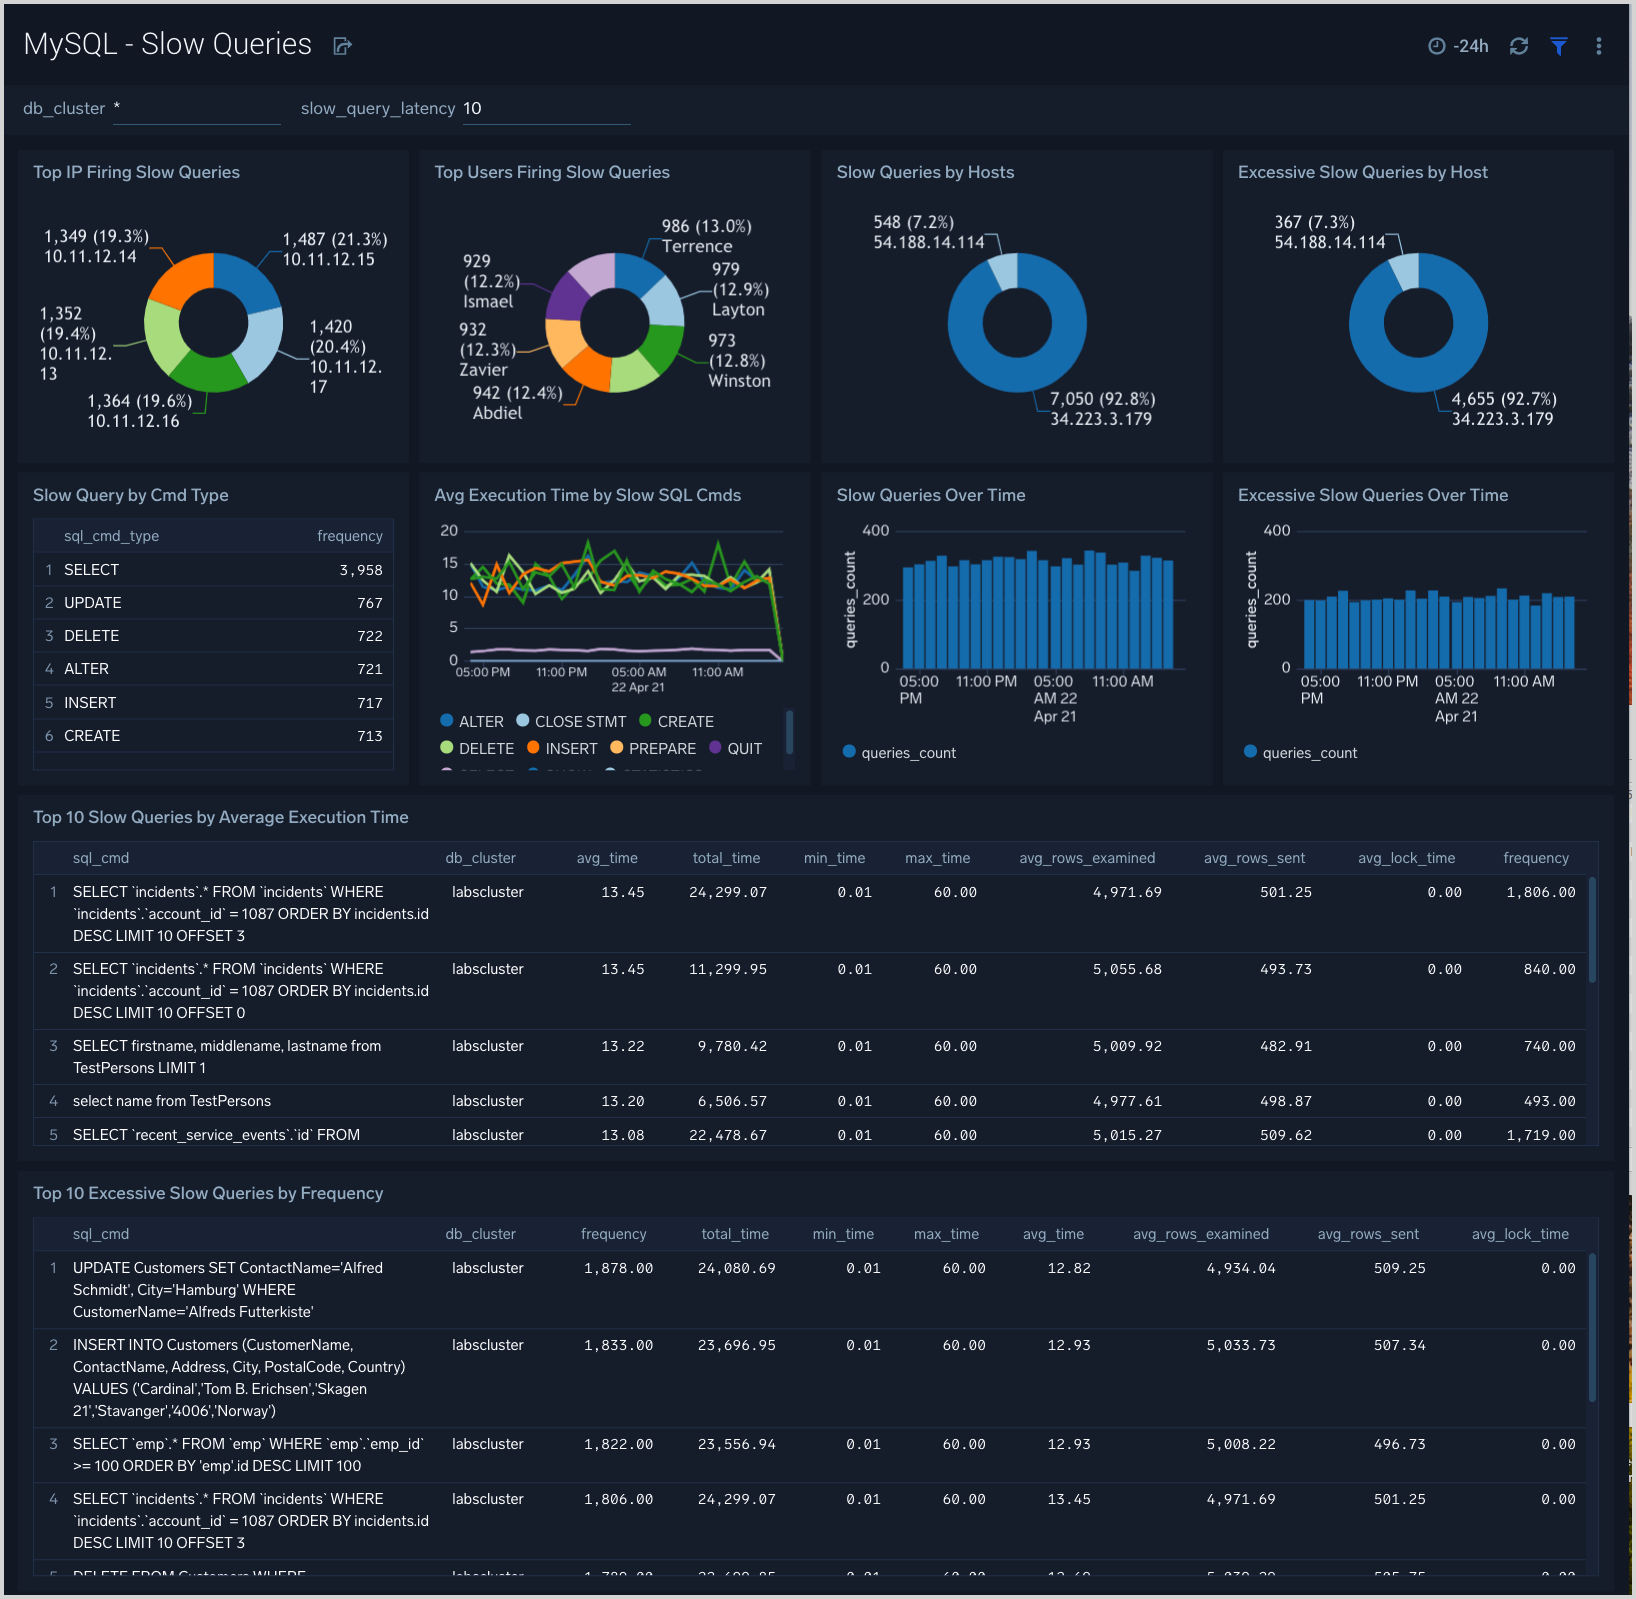
Slow Queries
The MySQL - Slow Queries dashboard provides insights into all slow queries executed on the database.
Note: Slow queries are queries that take 10 seconds or more to execute (default value is 10 seconds as per mysql configuration which can be altered) and excessive slow queries are those that take 15 seconds or more to execute.
Use this dashboard to:
- Identify all slow queries.
- Quickly determine which queries have been identified as slow or excessive slow queries.
- Monitor users and hosts running slow queries.
- Determine which SQL commands are slower than others.
- Examine slow query trends to determine if there are periodic performance bottlenecks in your database clusters.
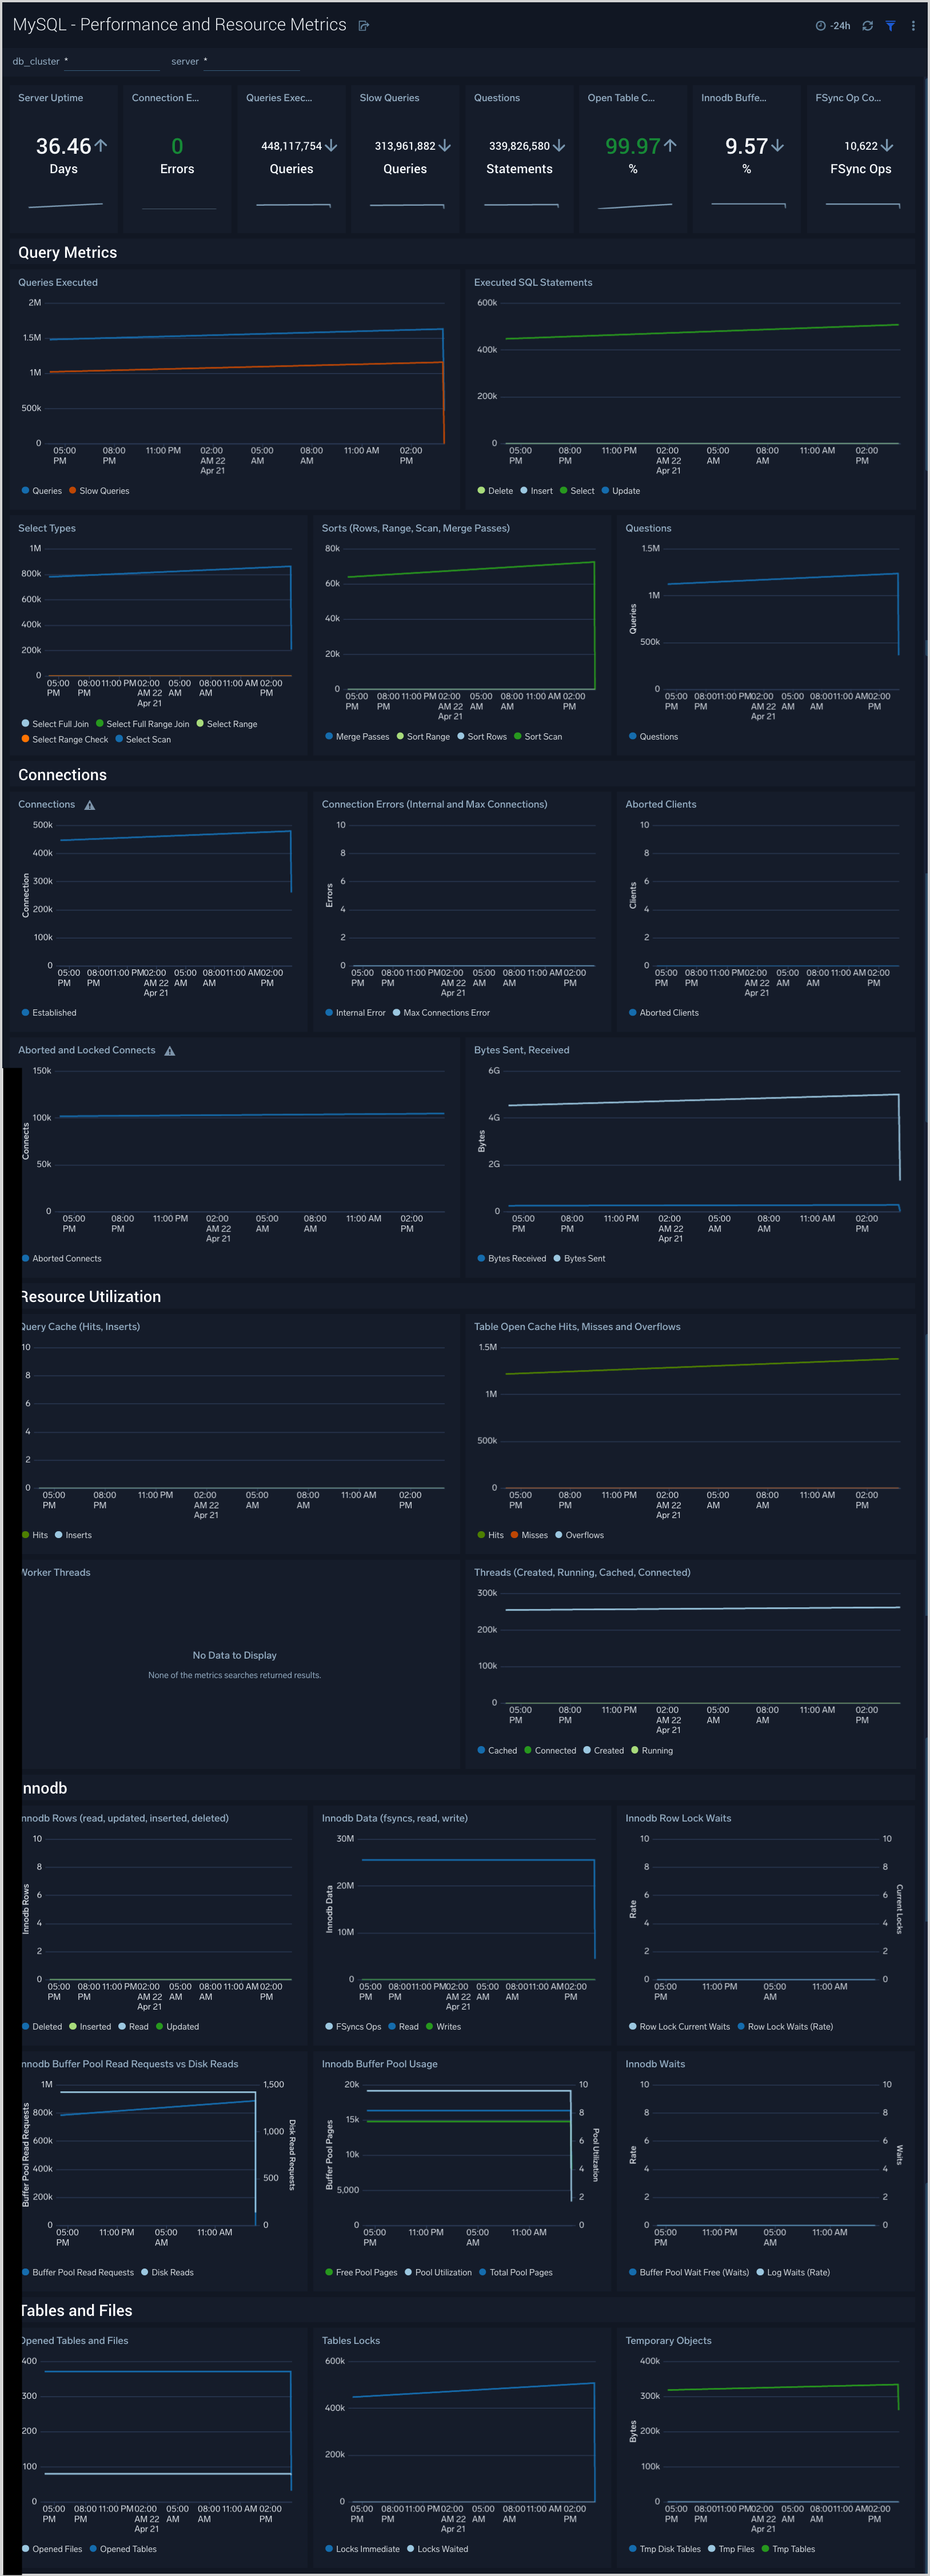
Performance and Resource Metrics
The MySQL - Performance and Resource Metrics dashboard allows you to monitor the performance and resource usage of your database clusters.
Use this dashboard to:
- Understand the behavior and performance of your database clusters.
- Monitor key operational metrics around connections, network traffic, threads running, innodb waits, and locks.
- Monitor query execution trends to ensure they match up with expectations.
- Dashboard filters allow you to narrow a search for a specific database cluster.
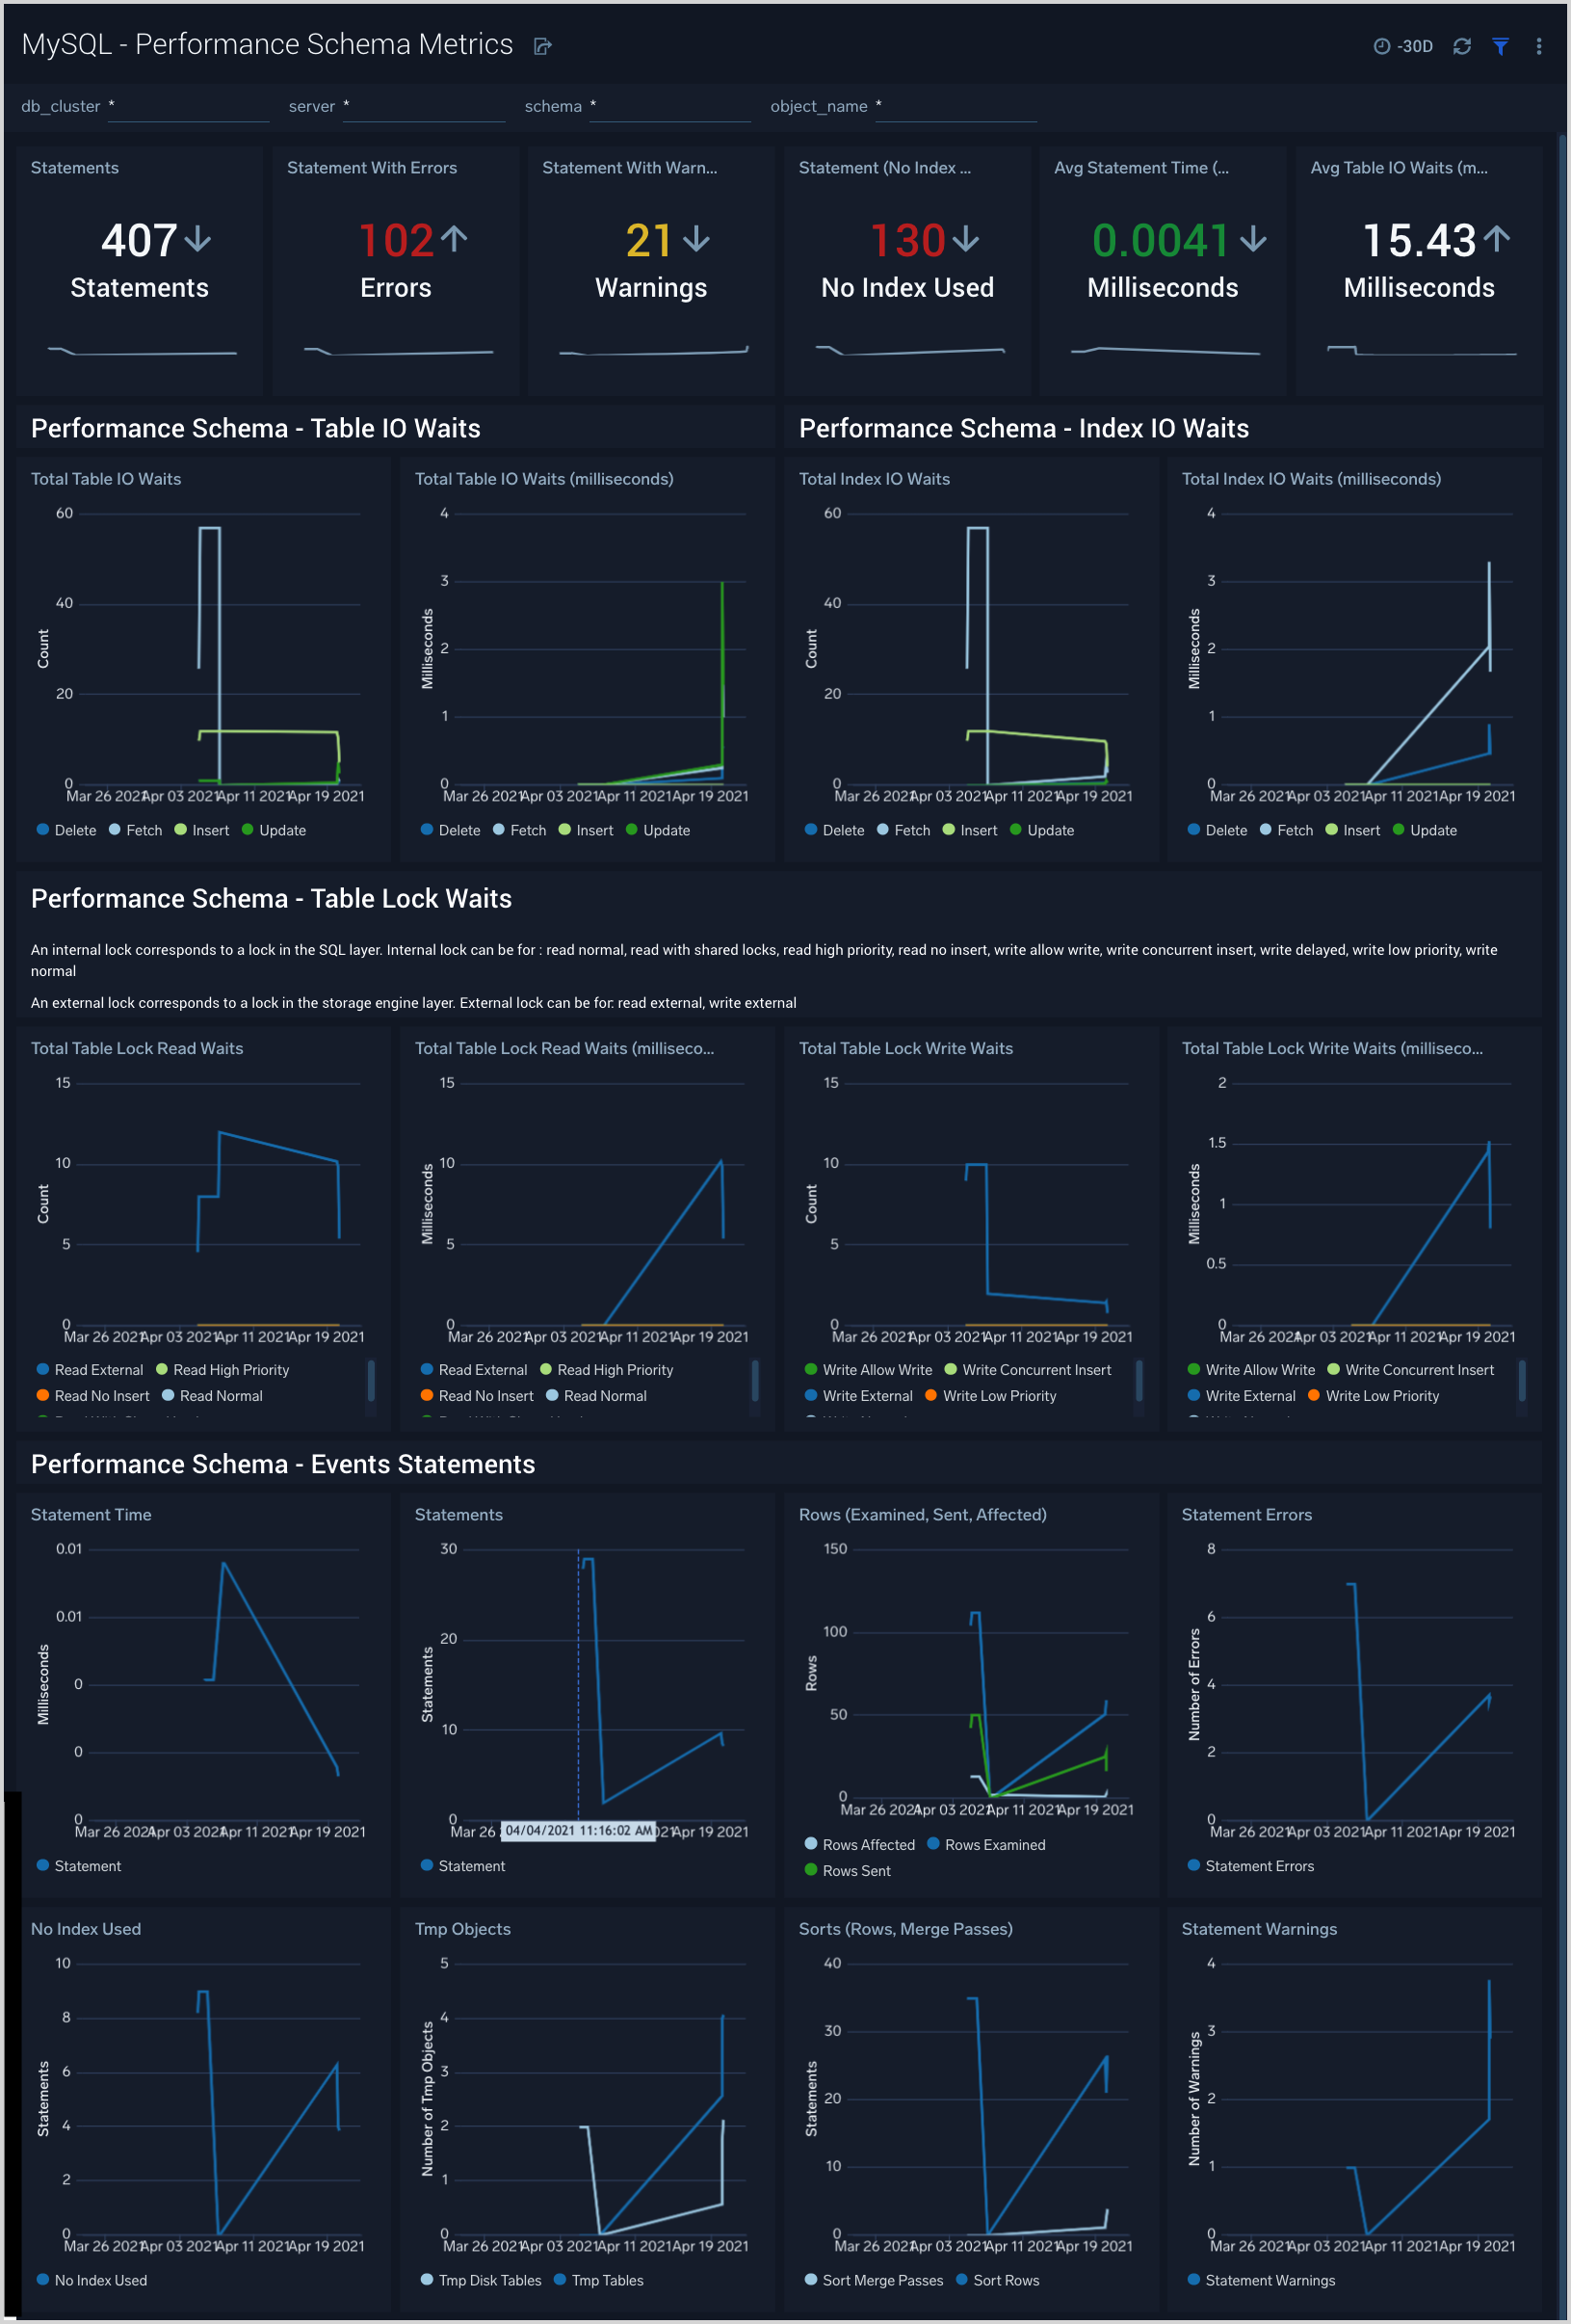
Performance Schema Metrics
The MySQL - Performance Schema Metrics dashboard provides insights into the metrics provided by the MySQL Performance Schema, which is a feature for monitoring MySQL Server execution at a low level.
Use this dashboard to:
- Monitor errors and warning for SQL statements.
- Monitor statements running without use of index columns.
- Monitor statistics such as Table and Index waits and read and write lock waits to optimize the performance of your database.
Create monitors for MySQL app
From your App Catalog:
- From the Sumo Logic navigation, select App Catalog.
- In the Search Apps field, search for and then select your app.
- Make sure the app is installed.
- Navigate to What's Included tab and scroll down to the Monitors section.
- Click Create next to the pre-configured monitors. In the create monitors window, adjust the trigger conditions and notifications settings based on your requirements.
- Scroll down to Monitor Details.
- Under Location click on New Folder.
note
By default, monitor will be saved in the root folder. So to make the maintenance easier, create a new folder in the location of your choice.
- Enter Folder Name. Folder Description is optional.
tip
Using app version in the folder name will be helpful to determine the versioning for future updates.
- Click Create. Once the folder is created, click on Save.
MySQL alerts
| Monitor name | Monitor description | Alert Condition | Recovery Condition |
|---|---|---|---|
| MySQL - Connection refused | This alert fires when connections are refused when the limit of maximum connections is reached within a 5-minute time interval. | <= 1 | > 1 |
| MySQL - High average query run time | This alert fires when the average run time of SQL queries for a given schema is greater than or equal to one second within a 5-minute interval. | >= 1 | < 1 |
| MySQL - High Innodb buffer pool utilization | This alert fires when we detect that the InnoDB buffer pool utilization is high (>= 90%) within a 5-minute time interval. | >= 90 | < 90 |
| MySQL - Large number of aborted connections | This alert fires when we detect that there are 5 or more aborted connections identified within a 5-minute interval. | >= 5 | < 5 |
| MySQL - Large number of internal connection errors | This alert fires when we detect that there are 5 or more internal connection errors within a 5-minute interval. | >= 5 | < 5 |
| MySQL - Large number of slow queries | This alert fires when we detect that there are 5 or more slow queries within a 5-minute time interval. | >= 5 | < 5 |
| MySQL - Large number of statement errors | This alert fires when we detect that there are 5 or more statement errors within a 5-minute time interval. | >= 5 | < 5 |
| MySQL - Large number of statement warnings | This alert fires when we detect that there are 20 or more statement warnings within a 5-minute time interval. | >= 20 | < 20 |
| MySQL - No index used in the SQL statements | This alert fires when we detect that there are 5 or more statements not using an index in the SQL query within a 5-minute time interval. | >= 5 | < 5 |
| MySQL - Excessive Slow Query Detected | This alert fires when we detect the average time to execute a query is more than 5 seconds over a 24-hour time period. | >= 1 | < 1 |
| MySQL - Follower replication lag detected | This alert fires when we detect that the average replication lag is greater than or equal to 900 seconds within a 5-minute time interval. | >= 900 | < 900 |
| MySQL - Instance down | This alert fires when we detect that a MySQL instance is down within the last 5-minute interval. | >= 1 | < 1 |
MySQL Metrics
Here are the Telegraf metrics for MySQL collected by the MySQL app (click to expand).
mysql_aborted_clients
mysql_aborted_connects
mysql_bytes_received
mysql_bytes_sent
mysql_commands_delete
mysql_commands_insert
mysql_commands_select
mysql_commands_update
mysql_connection_errors_internal
mysql_connection_errors_max_connections
mysql_connections
mysql_created_tmp_disk_tables
mysql_created_tmp_files
mysql_created_tmp_tables
mysql_innodb_buffer_pool_pages_free
mysql_innodb_buffer_pool_pages_total
mysql_innodb_buffer_pool_read_requests
mysql_innodb_buffer_pool_reads
mysql_innodb_buffer_pool_wait_free
mysql_innodb_data_fsyncs
mysql_innodb_data_read
mysql_innodb_data_writes
mysql_innodb_log_waits
mysql_innodb_row_lock_current_waits
mysql_innodb_row_lock_waits
mysql_innodb_rows_deleted
mysql_innodb_rows_inserted
mysql_innodb_rows_read
mysql_innodb_rows_updated
mysql_locked_connects
mysql_mysqlx_connections_accepted
mysql_mysqlx_connections_closed
mysql_mysqlx_connections_rejected
mysql_mysqlx_worker_threads
mysql_mysqlx_worker_threads_active
mysql_opened_files
mysql_opened_tables
mysql_perf_schema_events_statements_errors_total
mysql_perf_schema_events_statements_no_index_used_total
mysql_perf_schema_events_statements_rows_affected_total
mysql_perf_schema_events_statements_rows_examined_total
mysql_perf_schema_events_statements_rows_sent_total
mysql_perf_schema_events_statements_seconds_total
mysql_perf_schema_events_statements_sort_merge_passes_total
mysql_perf_schema_events_statements_sort_rows_total
mysql_perf_schema_events_statements_tmp_disk_tables_total
mysql_perf_schema_events_statements_tmp_tables_total
mysql_perf_schema_events_statements_total
mysql_perf_schema_events_statements_warnings_total
mysql_perf_schema_index_io_waits_seconds_total_delete
mysql_perf_schema_index_io_waits_seconds_total_fetch
mysql_perf_schema_index_io_waits_seconds_total_insert
mysql_perf_schema_index_io_waits_seconds_total_update
mysql_perf_schema_index_io_waits_total_delete
mysql_perf_schema_index_io_waits_total_fetch
mysql_perf_schema_index_io_waits_total_insert
mysql_perf_schema_index_io_waits_total_update
mysql_perf_schema_read
mysql_perf_schema_read_high_priority
mysql_perf_schema_read_no_insert
mysql_perf_schema_read_normal
mysql_perf_schema_read_with_shared_locks
mysql_perf_schema_table_io_waits_seconds_total_delete
mysql_perf_schema_table_io_waits_seconds_total_fetch
mysql_perf_schema_table_io_waits_seconds_total_insert
mysql_perf_schema_table_io_waits_seconds_total_update
mysql_perf_schema_table_io_waits_total_delete
mysql_perf_schema_table_io_waits_total_fetch
mysql_perf_schema_table_io_waits_total_insert
mysql_perf_schema_table_io_waits_total_update
mysql_perf_schema_write
mysql_perf_schema_write_allow_write
mysql_perf_schema_write_concurrent_insert
mysql_perf_schema_write_low_priority
mysql_perf_schema_write_normal
mysql_qcache_hits
mysql_qcache_inserts
mysql_queries
mysql_questions
mysql_select_full_join
mysql_select_full_range_join
mysql_select_range
mysql_select_range_check
mysql_select_scan
mysql_slow_queries
mysql_sort_merge_passes
mysql_sort_range
mysql_sort_rows
mysql_sort_scan
mysql_table_locks_immediate
mysql_table_locks_waited
mysql_table_open_cache_hits
mysql_table_open_cache_misses
mysql_table_open_cache_overflows
mysql_threads_cached
mysql_threads_connected
mysql_threads_created
mysql_threads_running
mysql_uptime