Oracle
The Oracle app is a unified logs and metrics app that helps you monitor Oracle database cluster availability, performance, and resource utilization. Preconfigured dashboards and searches provide insight into the health of your database clusters, parallel executions, resource utilization, response time, tablespaces, throughput, wait for class/events, listeners, audit logs, and security.
This app is tested with the following Oracle versions:
- Non-Kubernetes: Oracle Database 19c Enterprise Edition Release 19.0.0.0.0 - Production - Version 19.3.0.0.0
- Kubernetes: Oracle Database 19c Enterprise Edition Release 19.0.0.0.0 - Production - Version 19.3.0.0.0
Log types
- Alert Logs
- Listener Logs
- Audit Logs
Collect Logs and Metrics for the Oracle app
This section provides instructions for configuring logs and metrics collection for the Sumo Logic app for the Oracle.
Configure Oracle Logs and Metrics Collection
Sumo Logic supports the collection of logs and metrics data from Oracle in both Kubernetes and non-Kubernetes environments.
Click on the appropriate links based on the environment where your Oracle clusters are hosted.
- Kubernetes environments
- Non-Kubernetes environments
In Kubernetes environments, we use the Telegraf Operator, which is packaged with our Kubernetes collection. You can learn more about it here. The diagram below illustrates how data is collected from Oracle in Kubernetes environments. In the architecture shown below, there are four services that make up the metric collection pipeline: Telegraf, Telegraf Operator, Prometheus, and Sumo Logic Distribution for OpenTelemetry Collector.
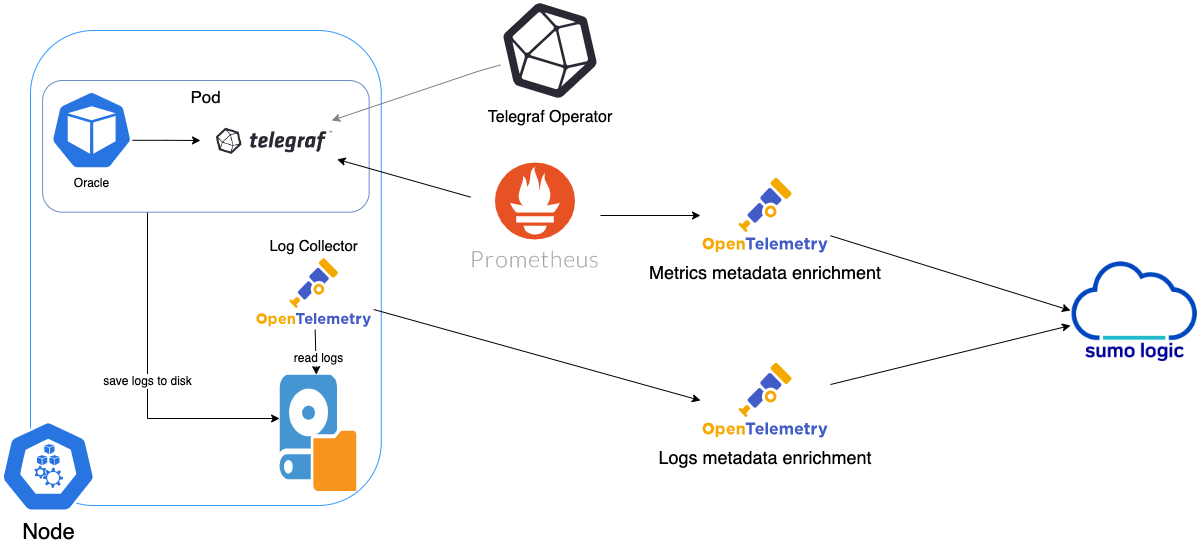
The first service in the metrics pipeline is Telegraf. Telegraf collects metrics from Oracle. Note that we’re running Telegraf in each pod we want to collect metrics from as a sidecar deployment: i.e. Telegraf runs in the same pod as the containers it monitors. Telegraf uses the exec input plugin to obtain metrics. (For simplicity, the diagram doesn’t show the input plugins.) The injection of the Telegraf sidecar container is done by the Telegraf Operator.
Prometheus pulls metrics from Telegraf and sends them to Sumo Logic Distribution for OpenTelemetry Collector which enriches metadata and sends metrics to Sumo Logic.
In the logs pipeline, Sumo Logic Distribution for OpenTelemetry Collector collects logs written to standard out and forwards them to another instance of Sumo Logic Distribution for OpenTelemetry Collector, which enriches metadata and sends logs to Sumo Logic.
It’s assumed that you are using the latest helm chart version. If not, upgrade using the instructions here.
Configure Metrics Collection
This section explains how to collect Oracle metrics from a Kubernetes environment.
In Kubernetes environments, we use the Telegraf Operator, which is packaged with our Kubernetes collection. You can learn more about this here. Follow the steps listed below to collect metrics from a Kubernetes environment:
Step 1. Configure Oracle pod to send metrics to Sumo Logic
We use custom Python script which sends Oracle metrics into Sumo Logic as mentioned here. There are two methods to execute the script in pod:
- Use Config Map to execute the script.
- Modify existing dockerfile and update the Pod definition:
FROM python:3.7
RUN pip install cx_Oracle
# Install Oracle Client
ENV ORACLE_HOME=/opt/oracle
ENV LD_LIBRARY_PATH=$LD_LIBRARY_PATH:$ORACLE_HOME/lib
RUN wget https://dl.influxdata.com/telegraf/r....4-1_amd64.deb \
    && dpkg -i telegraf_1.20.4-1_amd64.deb
RUN apt-get update && apt-get install -y libaio1 && rm -rf /var/lib/apt/lists/* \
 && wget -q https://download.oracle.com/otn_soft....0.0.0dbru.zip \
 && unzip instantclient-*.zip \
 && mkdir -p $ORACLE_HOME \
 && mv instantclient_19_6 $ORACLE_HOME/lib \
 && rm -f instantclient-*.zip
COPY sumo_oracle_metrics.py /app/
COPY exec_oracle_metrics.sh /app/
RUN chmod +x entrypoint.sh && chmod +x /tmp/exec_oracle_metrics.sh
CMD ["telegraf"]
Step 2. Setup Kubernetes Collection with the Telegraf Operator.
Step 3. Add annotations on your Oracle pods
On your Oracle Pods, add the following annotations:
annotations:
    telegraf.influxdata.com/class: sumologic-prometheus
    prometheus.io/scrape: "true"
    prometheus.io/port: "9273"
    telegraf.influxdata.com/inputs: |+
        [[inputs.exec]]
          commands = ["/path_TO_BE_CHANGEME/exec_oracle_metrics.sh"]
          timeout = "5s"
          data_format = "influx"
          [inputs.exec.tags]
            environment ="dev_ENV_TO_BE_CHANGED"
            component ="database"
            db_system ="oracle"
            db_cluster ="oracle_on_premise_ENV_TO_BE_CHANGED"
            db_cluster_address = "ENV_TO_BE_CHANGED"
            db_cluster_port = "ENV_TO_BE_CHANGED"
- If you haven’t defined a cluster in Oracle, enter
defaultfordb_cluster. - Enter values for the parameters marked
ENV_TO_BE_CHANGEDin the snippet above:-
telegraf.influxdata.com/inputs. This contains the required configuration for the Telegraf exec Input plugin. Please refer to this doc for more information on configuring the Oracle input plugin for Telegraf. Note: As telegraf will be run as a sidecar the host should always be localhost. -
In the input plugins section:
- commands - The exec plugin executes all the commands in parallel on every interval and parses metrics from their output in any one of the accepted Input Data Formats.
-
In the tags section
[inputs.exec.tags]:environment. This is the deployment environment where the Oracle cluster identified by the value of servers resides. For example: dev, prod or qa. While this value is optional we highly recommend setting it.db_cluster. Enter a name to identify this Oracle cluster. This cluster name will be shown in the Sumo Logic dashboards.db_cluster_address. Enter the cluster hostname or ip address that is used by the application to connect to the database. It could also be the load balancer or proxy endpoint.db_cluster_port. Enter the database port. If not provided, a default port will be used.
notedb_cluster_addressanddb_cluster_portshould reflect exact configuration of DB client configuration in your application, especially if you instrument it with OT tracing. The values of these fields should match exactly the connection string used by the database client (reported as values for net.peer.name and net.peer.port metadata fields).For example, if your application uses
“oracle-prod.sumologic.com:3306”as the connection string, the field values should be set as follows:db_cluster_address=oracle-prod.sumologic.com db_cluster_port=3306If your application connects directly to a given oracle node, rather than the whole cluster, use the application connection string to override the value of the “host” field in the Telegraf configuration:
host=oracle-prod.sumologic.comPivoting to Tracing data from Entity Inspector is possible only for “Oracle address” Entities.
-
Do not modify the following values as it will cause the Sumo Logic apps to not function correctly:
telegraf.influxdata.com/class: sumologic-prometheus. This instructs the Telegraf operator what output to use. This should not be changed.prometheus.io/scrape: "true". This ensures our Prometheus will scrape the metrics.prometheus.io/port: "9273". This tells prometheus what ports to scrape on. This should not be changed.telegraf.influxdata.com/inputs- In the tags section [inputs.exec.tags]:
component: “database”- This value is used by Sumo Logic apps to identify application components.db_system: “oracle”- This value identifies the database system.
-
For all other parameters, see this doc for more parameters that can be configured in the Telegraf agent globally.
-
Sumo Logic Kubernetes collection will automatically start collecting metrics from the pods having the labels and annotations defined in the previous step.
Verify metrics in Sumo Logic.
Configure Logs Collection
This section explains the steps to collect Oracle logs from a Kubernetes environment.
- (Recommended Method) Add labels on your Oracle pods to capture logs from standard output. Make sure that the logs from Oracle are sent to stdout. Follow the instructions below to capture Oracle logs from stdout on Kubernetes.
- Apply following labels to the Oracle pod:
labels:
    environment: "prod_ENV_TO_BE_CHANGED"
    component: "database"
    db_system: "oracle"
    db_cluster "Cluster_ENV_TO_BE_CHANGED"
    db_cluster_address = "ENV_TO_BE_CHANGED"
    db_cluster_port = "ENV_TO_BE_CHANGED"
Enter in values for the following parameters (marked in ENV_TO_BE_CHANGED above):
environment. This is the deployment environment where the Oracle cluster identified by the value of servers resides. For example:- dev, prod, or QA. While this value is optional we highly recommend setting it.db_cluster. Enter a name to identify this Oracle cluster. This cluster name will be shown in the Sumo Logic dashboards. If you haven’t defined a cluster in Oracle, then enter ‘default’ fordb_cluster.db_cluster_address- Enter the cluster hostname or ip address that is used by the application to connect to the database. It could also be the load balancer or proxy endpoint.db_cluster_port- Enter the database port. If not provided, a default port will be used.
db_cluster_address and db_cluster_port should reflect the exact configuration of DB client configuration in your application, especially if you instrument it with OT tracing. The values of these fields should match exactly the connection string used by the database client (reported as values for net.peer.name and net.peer.port metadata fields).
For example, if your application uses “oracle-prod.sumologic.com:3306” as the connection string, the field values should be set as follows: db_cluster_address=oracle-prod.sumologic.com db_cluster_port=3306
If your application connects directly to a given oracle node, rather than the whole cluster, use the application connection string to override the value of the “host” field in the Telegraf configuration: host=oracle-prod.sumologic.com
Pivoting to Tracing data from Entity Inspector is possible only for “Oracle address” Entities.
Do not modify the following values as they will cause the Sumo Logic apps to not function correctly.
component: “database”- This value is used by Sumo Logic apps to identify application components.db_system: “oracle”- This value identifies the database system.
For all other parameters, see this doc for more parameters that can be configured in the Telegraf agent globally.
- The Sumologic-Kubernetes-Collection will automatically capture the logs from stdout and will send the logs to Sumologic. For more information on deploying Sumologic-Kubernetes-Collection, visit here.
- Verify logs in Sumo Logic.
- (Optional) Collecting Oracle Logs from a Log File. Follow the steps below to capture Oracle logs from a log file on Kubernetes.
- Determine the location of the Oracle log file on Kubernetes. This can be determined from the Oracle.conf for your Oracle cluster along with the mounts on the Oracle pods.
- Install the Sumo Logic tailing sidecar operator.
- Add the following annotation in addition to the existing annotations.
annotations:
  tailing-sidecar: sidecarconfig;<mount>:<path_of_Oracle_log_file>/<SQLserver_log_file_name>
Example:
annotations:
  tailing-sidecar: sidecarconfig;data:/var/opt/oracle/errorlog
- Make sure that the Oracle pods are running and annotations are applied by using the command:
kubectl describe pod <Oracle_pod_name>
- The Sumo Logic Kubernetes collection will automatically start collecting logs from the pods having the annotations defined above.
- Verify logs in Sumo Logic.
FER to normalize the fields in Kubernetes environments. Labels created in Kubernetes environments automatically are prefixed with pod_labels. To normalize these for our app to work, a Field Extraction Rule named AppObservabilityOracleDatabaseFER is automatically created for Database Application Components.
Sumo Logic uses the Telegraf operator for Oracle metric collection and the Installed Collector for collecting Oracle logs. The diagram below illustrates the components of the Oracle collection in a non-Kubernetes environment. Telegraf uses the exec input plugin to obtain Oracle metrics and the Sumo Logic output plugin to send the metrics to Sumo Logic. Logs from Oracle are collected by a Local File Source.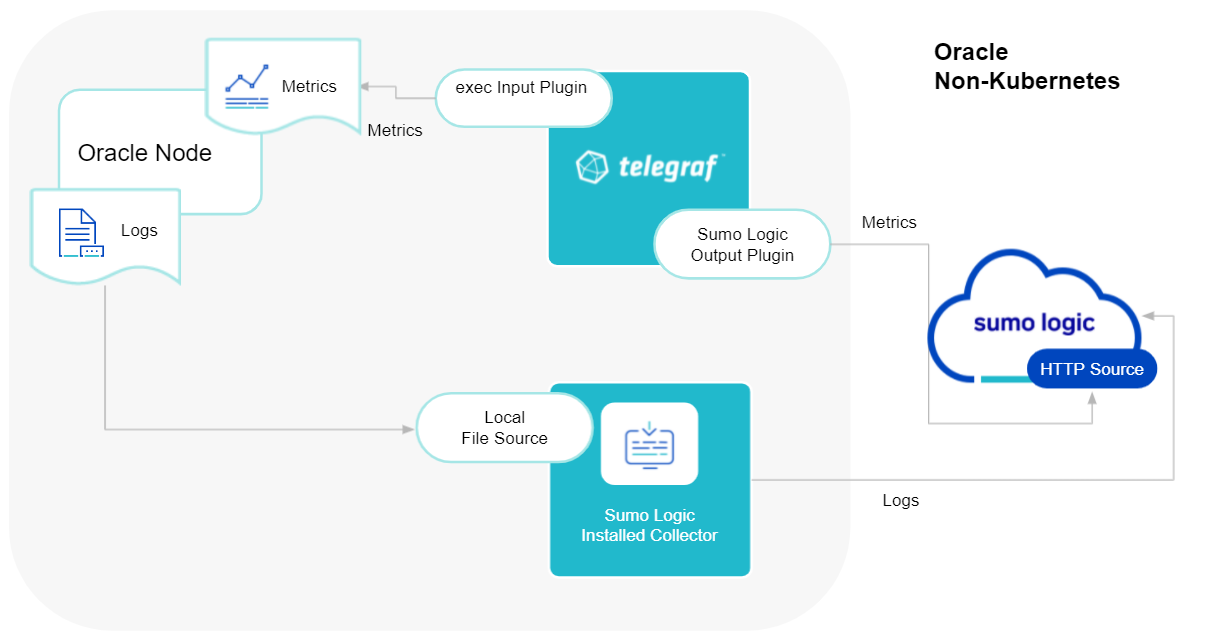
The process to set up collection for Oracle data is done through the following steps:
- Configure Logs Collection
- Enable Oracle Logging
- Verify Log Files Path.
- Configure three Local log file Sources.
- Set Up Oracle Performance Metrics Script
- Configure Metrics Collection
- Configure a Hosted Collector
- Configure an HTTP Logs and Metrics Source
- Install Telegraf
- Configure, and start Telegraf
Configure Logs Collection
This section provides instructions for configuring log collection for Oracle running on a non-Kubernetes environment.
Step 1. Enable Oracle Logging
If logging is not currently enabled for the following logs, enable it.
- Alert log
- Listener log.
- Enable Listener Log: The basic syntax of Listener Control utility commands is as follows
lsnrctl command [listener_name]
lsnrctl set log_status on
- Enable Listener Log: The basic syntax of Listener Control utility commands is as follows
- Audit Log. Follow this guide to enable Audit Logs.
Step 2. Verify Local logs file directories and Path
- Oracle Alert Logs. For 11g and later releases (12c, 18c, 19c): By default, Oracle logs are stored in
$ORACLE_BASE/diag/rdbms/$DB_UNIQUE_NAME/$ORACLE_SID/trace/.- The default directory for log files is value of
BACKGROUND_DUMP_DEST. you can query the value ofBACKGROUND_DUMP_DEST, an initialization parameter, where you can find Oracle alert logSQL> show parameter background_dump_dest;
- The default directory for log files is value of
- Oracle Listener Logs. You can check listener log file with command:
[oracle@sumolab alert]$ lsnrctl status - Oracle Audit Logs. By default, Oracle logs are stored in
$ORACLE_BASE/app/oracle/admin/orcl/adump. The default directory for log files is value ofaudit_file_dest. you can query the value ofaudit_file_dest, an initialization parameter, where you can find the Oracle Audit log directoryAudit Logs should be in eitherSQL> show parameter auditXML, EXTENDEDor{{OS }}for app to work.
Step 3. Configure three Local File Sources
In this step, you will configure three Local File sources on an installed collector, one for each of the following Oracle logs: Alert, Listener, and Audit.
Follow the instructions in Local File Source.
When you configure the sources, plan your source categories to ease the querying process. A hierarchical approach allows you to make use of wildcards. For example:
| Source | Example Source Category |
|---|---|
| Alert Logs | DB/Oracle/Alert |
| Listener Logs | DB/Oracle/Listener |
| Audit | DB/Oracle/Audit |
Add Following Fields on each Local File Source:
- Fields. Set the following fields:
component = database.db_system = oracle.db_cluster = <Your_Oracle_Cluster_Name>. Enter Default if you do not have one.environment = <Your_Environment_Name>. (for example, Dev, QA, or Prod).db_cluster_address. Enter the cluster hostname or ip address that is used by the application to connect to the database. It could also be the load balancer or proxy endpoint.db_cluster_port. Enter the database port. If not provided, a default port will be used
db_cluster_address and db_cluster_port should reflect exact configuration of DB client configuration in your application, especially if you instrument it with OT tracing. The values of these fields should match exactly the connection string used by the database client (reported as values for net.peer.name and net.peer.port metadata fields).
For example, if your application uses “oracle-prod.sumologic.com:3306” as the connection string, the field values should be set as follows: db_cluster_address=oracle-prod.sumologic.com db_cluster_port=3306
If your application connects directly to a given oracle node, rather than the whole cluster, use the application connection string to override the value of the “host” field in the Telegraf configuration: host=oracle-prod.sumologic.com.
Pivoting to Tracing data from Entity Inspector is possible only for “Oracle address” Entities.
Step 4. Set Up Oracle Performance Metrics Script
The instructions for setting up the Oracle performance metrics script vary by operating system:
- For Linux, see Set Up Oracle Performance Metrics Script on Linux
- For Windows, see Set Up Oracle Performance Metrics Script on Windows
Configure Metrics Collection
-
Set up a Sumo Logic HTTP Source.
- Configure a Hosted Collector for Metrics. To create a new Sumo Logic hosted collector, perform the steps in the Configure a Hosted Collector documentation.
-
Configure an HTTP Logs & Metrics source.
- On the created Hosted Collector on the Collection Management screen, select Add Source.
- Select HTTP Logs & Metrics.
- Name (Required). Enter a name for the source.
- Description (Optional).
- Source Category (Recommended). Be sure to follow the Best Practices for Source Categories. A recommended Source Category may be Prod/DB/Oracle/Metrics.
- Select Save.
- Take note of the URL provided once you click Save. You can retrieve it again by selecting the Show URL next to the source on the Collection Management screen.
-
Set up Telegraf.
- Install Telegraf, if you haven’t already, using the following steps to install Telegraf.
- Install custom Python script to send Oracle metrics into Sumo using the following steps
- Configure and start Telegraf. As part of collecting metrics data from Telegraf, we will use the exec input plugin to get data from Telegraf and the Sumo Logic output plugin to send it to Sumo Logic.
You can create a
telegraf.conffile or modify an existingtelegraf.conffile, then copy and paste the text below:
[[inputs.exec]]
  commands = ["/path_TO_BE_CHANGED/exec_oracle_metrics.sh"]
  timeout = "5s"
  data_format = "influx"
  [inputs.exec.tags]
  environment ="DEV_ENV_TO_BE_CHANGED"
  component ="database"
  db_system ="oracle"
  db_cluster ="PROD_ENV_TO_BE_CHANGED"
  db_cluster_address = "ENV_TO_BE_CHANGED"
  db_cluster_port = "ENV_TO_BE_CHANGED"

[[outputs.sumologic]]
  url = "<URL_from_HTTP_Logs_and_Metrics_Source>"
  data_format = "prometheus"
Enter values for fields annotated with <ENV_TO_BE_CHANGED> to the appropriate values. Do not include the brackets (< >) in your final configuration
-
Input plugins section, which is
[[inputs.exec]]:- commands. The exec plugin executes all the commands in parallel on every interval and parses metrics from their output in any one of the accepted Input Data Formats.
-
In the tags section, which is
[inputs.exec.tags]:environment. This is the deployment environment where the Oracle cluster identified by the value of servers resides. For example; dev, prod, or QA. While this value is optional we highly recommend setting it.db_cluster. Enter a name to identify this Oracle cluster. This cluster name will be shown in our dashboards.db_cluster_address. Enter the cluster hostname or ip address that is used by the application to connect to the database. It could also be the load balancer or proxy endpoint.db_cluster_port. Enter the database port. If not provided, a default port will be used.
notedb_cluster_addressanddb_cluster_portshould reflect the exact configuration of DB client configuration in your application, especially if you instrument it with OT tracing. The values of these fields should match exactly the connection string used by the database client (reported as values for net.peer.name and net.peer.port metadata fields).For example, if your application uses
“oracle-prod.sumologic.com:3306”as the connection string, the field values should be set as follows:db_cluster_address=oracle-prod.sumologic.com db_cluster_port=3306If your application connects directly to a given oracle node, rather than the whole cluster, use the application connection string to override the value of the “host” field in the Telegraf configuration:
host=oracle-prod.sumologic.comPivoting to Tracing data from Entity Inspector is possible only for “Oracle address” Entities.
-
In the output plugins section, which is
[[outputs.sumologic]]:- URL. This is the HTTP source URL created previously. See this doc for more information on additional parameters for configuring the Sumo Logic Telegraf output plugin.
Here’s an explanation for additional values set by this Telegraf configuration.
If you haven’t defined a cluster in Oracle, then enter ‘default’ for db_cluster.
There are additional values set by the Telegraf configuration. We recommend not to modify these values as they might cause the Sumo Logic app to not function correctly.
data_format: “prometheus”. In the output[[outputs.sumologic]]plugins section. Metrics are sent in the Prometheus format to Sumo Logic.component: “database”. In the input[[inputs.exec]]plugins section. This value is used by Sumo Logic apps to identify application components.db_system - “oracle”. In the input plugins sections. This value identifies the database system.
See this doc for all other parameters that can be configured in the Telegraf agent globally.
After you've finalized your telegraf.conf file, you can start or reload the telegraf service using instructions from this doc.
At this point, Telegraf should start collecting the Oracle metrics and forward them to the Sumo Logic HTTP Source.
Performance Metrics Script Setup
This section describes how to set up the performance metrics script on Linux and Windows for the Oracle app.
The Sumo Logic app for Oracle uses a Python script to query database tables to collect Oracle server performance metrics.
The script connects the database using a database user account, runs a set of example SQL queries, and prints the query results in JSON format to the console. The account credentials and SQL queries are specified in the script configuration file, oracle-perf-monitor.cfg.
The SQL queries in the [queries] section of the configuration file are provided as examples. You can add, modify, and remove queries, as desired. We recommend having the queries you plan to use reviewed by your DBA.
The database user that you use to run the SQL queries should have permission to access query-specific databases, tables, and views. The table below shows the SQL commands to grant the required permissions for each query.
| Query | SQL Command to Grant Permissions |
| For Queries 1 through 3 |
|
| For Query 4 |
|
| For Queries 5 and 6 | SQL> grant select on sys.v_$session_wait to <username>;
|
Linux
The script was developed and tested on:
- Linux Server 8.4, Python (3.7.10), Oracle Database 19c Enterprise Edition Release 19.0.0.0.0 - Production - Version 19.3.0.0.0
Prerequisites
Check the Linux version currently running on your machine to ensure compatibility with the script.
$ lsb_release -a
LSB Version: :core-4.1-amd64:core-4.1-noarch
Distributor ID: OracleServer
Description: Oracle Linux Server release 8.4
Release: 8.4
Codename: n/a
If you get the error lsb_release: command not found, use below command to install lsb core and then re-run above command.
sudo yum update && sudo yum install redhat-lsb-core
Install Python 3.7.10+ for Linux
In this step, you install Python 3.7.10 for Linux.
- Install Python using the following command.
yum install python3 -y
ln -s /usr/bin/python3 /usr/bin/python - To check the Python version:
python3 --version
Python 3.7.10 - In this step, you install pip if it’s not already installed. To determine whether pip is installed, run this command:
If pip is not installed, you’ll see the message
pip3 -VThe program 'pip' is currently not installed. To install pip, run this command:Verify the installation by running this command:yum install python3-pip -yYou should see a message like this:$ pip3 -Vpip 20.2.2 from /usr/lib/python3.7/site-packages/pip (python 3.7).
Install Oracle Instant Client on Linux 64bit OS
- Install Oracle Instant Client packages.
$ dnf install oracle-instantclient-release-el8 -y
$ dnf install oracle-instantclient-basic
$ oracle-instantclient-devel oracle-instantclient-jdbc
$ oracle-instantclient-odbc oracle-instantclient-sqlplus oracle-instantclient-tools -y
- Install the
libaioandlibaio-devpackages if they are not already installed. Typically, in standard Oracle Linux Server, thelibaioandlibaio-devare not pre-installed. These packages are required to start the Oracle Instant Client.
$ dnf install -y libaio libaio-devel
- Test the client.
$ sqlplus username/password@//databasehost:1521/sidvalue
SQL*Plus: Release 19.0.0.0.0 - Production on Thu Nov 25 12:42:35 2021
Version 19.3.0.0.0
Copyright (c) 1982, 2019, Oracle.  All rights reserved.
Connected to:
Oracle Database 19c Enterprise Edition Release 19.0.0.0.0 - Production
Version 19.3.0.0.0
- Run a sample SQL query to test the connection.
SQL> select BANNER from v$version;
BANNER
----------------------------------------
Oracle Database 19c Enterprise Edition Release 19.0.0.0.0 - Production
Set up cx_Oracle on Linux
In this step, you'll set up cx_Oracle, an open-source Python interface to Oracle.
- Install
cx_Oracle.pip3 install cx_Oracle==7.3 - Check the
cx_oracleversion.pip3 list | grep cx-Oracle
cx-Oracle (7.3.0)
Set up and Configure Performance Metrics Script
In this step, you set up the performance metrics script.
Download the script - Clone the git repo
Clone the Sumo Logic Python performance metrics script and configuration files from the git repo inside a folder (for example: oracle_script) using below command:
git clone git@github.com:SumoLogic/sumologic-oracle-perf-monitor.git
Once the script is cloned, navigate to oracle_script/sumooracle.
Two files should be present:
Configure the script
Make the following updates to the script configuration file (oracle-perf-monitor.cfg). In the [dbLogin] section, supply values for each parameter:
If you do not wish to keep the password in the configuration file, keep the oraPassword field blank. You can set the password in the environment variable DB_PASSWORD.
To set environment variable, add variable in your ~/.bash_profile file in your environment:
export DB_PASSWORD = DB Password
The script first tries to read the password from the config file, if the password is not found in the config file, it searches for an environment variable DB_PASSWORD.
[dbLogin]
oraUser= database user id example myuser123oraPassword= user password example mypwd123oraHost=server name example ip-101-25-17-22oraPort=port number example 1521oraInstance=oracle instance SID (SID_NAME) example XE
Test the script
$ python3 oracle-perf-monitor.py
Configure the Sumo Logic Script Source
- Classic UI. In the main Sumo Logic menu, select Manage Data > Collection > Collection.
New UI. In the Sumo Logic top menu select Configuration, and then under Data Collection select Collection. You can also click the Go To... menu at the top of the screen and select Collection. - Find the name of the installed collector to which you'd like to add a Source. Click Add. Then choose Add Source from the pop-up menu.
- Select Script for the Source type. Collectors using version 19.245-4 and later do not allow Script Sources to run by default. To allow Script Sources, you need to set the Collector parameter
enableScriptSourcein user.properties to true and restart the Collector.- For Name enter any name you like, for instance, Oracle Server Script
- The Description is optional.
- For Source Category, enter the desired category. It can be any value you like, for example,
DB/Oracle/DBQueryScript. - Fields. Set the following fields:
component = databasedb_system = oracledb_cluster = <Your_Oracle_Cluster_Name>. Enter Default if you do not have one.environment = <Your_Environment_Name>(for example,Dev,QA, orProd)
- For Frequency, select desired frequency, for instance, 5 minutes
- For Specify a timeout for your command, select a value that is long enough that long-running queries can complete, for instance, 30 seconds.
- For Command,
select /usr/bin/python - For Script, enter a path to the script, for example,
oracle_script/sumooracle/oracle-perf-monitor.py - For Working Directory, enter a directory, for example,
oracle_script/sumooracle
- Click Save.
After a few minutes, your new Source should be propagated down to the Collector and will begin submitting your Oracle log files to the Sumo Logic service.
Windows
This section has instructions for setting up the performance metrics script on Windows OS for the Oracle app.
The script was developed and tested on:
- Windows Server 2019 standard, Python (3.7.10), Oracle Database 19c (19.3) for Microsoft Windows x64 (64-bit)
Install Python 3.7.10+ for Windows
- Download and install Python for Windows from: https://www.python.org/downloads/.
- Add the python installation folder to your Path system variable: Control Panel > Systems > Advanced System Settings > Advanced Tab > Environment Variable > System Variables > Path.
To confirm that you have successfully installed Python and added it to your path, open a new command window and run the following command:
C:\Users\Administrator>python3 --version
You should see this response: Python 3.7.10.
Install Oracle Instant Client for Windows 64bit
- Download and setup Oracle Instant Client for Win 64bit.
- http://www.oracle.com/technetwork/topics/winx64soft-089540.html
- instantclient-sdk-windows.x64-21.3.0.0.0.zip
- instantclient-basic-windows.x64-21.3.0.0.0.zip
- instantclient-sqlplus-windows.x64-21.3.0.0.0.zip
- Unzip the packages into a single directory, for example:
C:\oracle\instantclient_21_3\
- Add this directory to the PATH environment variable. If you have multiple versions of Oracle libraries installed, make sure the new directory occurs first in the path.
- Download and install the correct Visual Studio Redistributable from Microsoft. Instant Client 21.3 requires the Visual Studio 2017 redistributable.
- Test the client:
sqlplus username/password@//databasehost:1521/sidvalue
C:\Users\Administrator>sqlplus user/password//IP_ORACLE_SERVER:1521/remote_service_name

SQL*Plus: Release 19.0.0.0.0 - Production on Thu Nov 25 17:03:16 2021
Version 19.3.0.0.0
Copyright (c) 1982, 2019, Oracle.  All rights reserved.
Connected to:
Oracle Database 19c Enterprise Edition Release 19.0.0.0.0 - Production
Version 19.3.0.0.0
- Run some sample SQL queries to test the connection.
SQL> select BANNER from v$version;
BANNER
-----------------------------------------------------------------
Oracle Database 19c Enterprise Edition Release 19.0.0.0.0 - Production
Install cx_Oracle on Windows
- Use Python’s pip package to install
cx_Oracle.
python3 -m pip install cx_Oracle==7.3
- Check the
cx_Oracleversion.
C:\Users\Administrator>python3
Python 3.7.10 (v2.7.18:8d21aa21f2, Apr 20 2020, 13:25:05) [MSC v.1500 64 bit (AMD64)] on win32
Type "help", "copyright", "credits" or "license" for more information.
>>> import cx_Oracle
>>> print cx_Oracle.version
7.3.0
>>>
Set up and Configure Performance Metrics Script
In this step, you set up the performance metrics script.
Download the script - Clone the git repo
Clone the Sumo Logic Python performance metrics script and configuration files from the git repo inside a folder (for example: oracle_script) using below command:
git clone git@github.com:SumoLogic/sumologic-oracle-perf-monitor.git
Once the script is cloned, navigate to oracle_script/sumooracle.
Two files oracle-perf-monitor.cfg and oracle-perf-monitor.py should be present.
Configure the script
Make the following updates to the script configuration file (oracle-perf-monitor.cfg). In the [dbLogin] section, supply values for each parameter:
If you do wish to keep the password in the configuration file, keep the oraPassword field blank. You can keep the password in the environment variable DB_PASSWORD.
To set environment variable , add variable using below command:
setx DB_PASSWORD = DB Password
The script first tries to read password from the config file, if the password is not found in config file, it searches for an environment variable DB_PASSWORD.
[dbLogin]
oraUser= database user id example myuser123oraPassword= user password example mypwd123oraHost=server name example ip-101-25-17-22oraPort=port number example 1521oraInstance=oracle instance SID (SID_NAME) example XE
Test the script
oracle_script/sumooracle>python3 oracle-perf-monitor.py
Configure the Sumo Logic Script Source
- Classic UI. In the main Sumo Logic menu, select Manage Data > Collection > Collection.
New UI. In the Sumo Logic top menu select Configuration, and then under Data Collection select Collection. You can also click the Go To... menu at the top of the screen and select Collection. - Find the name of the Installed Collector to which you'd like to add a Source. Click Add. Then choose Add Source from the pop-up menu.
- Select Script for the Source type. Collectors using version 19.245-4 and later do not allow Script Sources to run by default. To allow Script Sources you need to set the Collector parameter
enableScriptSourcein user.properties to true and restart the Collector.- For Name enter any name you like, for instance, Oracle Server Script.
- The Description is optional.
- For Source Category, enter the desired category. It can be any value you like, for example,
DB/Oracle/DBQueryScript. - For Frequency, select desired frequency, for instance, 5 minutes.
- For Specify a timeout for your command, select a value that is long enough that long-running queries can complete, for instance, 30 sec.
- For Command, select Windows Script.
- For Script, select Type a path to the script to execute, then enter: for instance
oracle_script/sumooracle\oracle-perf-monitor.py. - For Working Directory, enter: for instance
oracle_script/sumooracle - Click Save.
Installing the Oracle app
To install the app, do the following:
Next-Gen App: To install or update the app, you must be an account administrator or a user with Manage Apps, Manage Monitors, Manage Fields, Manage Metric Rules, and Manage Collectors capabilities depending upon the different content types part of the app.
- Select App Catalog.
- In the 🔎 Search Apps field, run a search for your desired app, then select it.
- Click Install App.
note
Sometimes this button says Add Integration.
- Click Next in the Setup Data section.
- In the Configure section of your respective app, complete the following fields.
- Is K8S deployment involved. Specify if resources being monitored are partially or fully deployed on Kubernetes (K8s)
- Click Next. You will be redirected to the Preview & Done section.
Post-installation
Once your app is installed, it will appear in your Installed Apps folder, and dashboard panels will start to fill automatically.
Each panel slowly fills with data matching the time range query received since the panel was created. Results will not immediately be available but will be updated with full graphs and charts over time.
As part of the app installation process, the following fields will be created by default:
componentenvironmentdb_systemdb_clusterdb_cluster_addressdb_cluster_port
Additionally, if you are using Oracle in the Kubernetes environment, the following additional fields will be created by default during the app installation process:
pod_labels_componentpod_labels_environmentpod_labels_db_systempod_labels_db_clusterpod_labels_db_cluster_addresspod_labels_db_cluster_port
For information on setting up fields, see Fields.
Viewing Oracle Dashboards
All dashboards have a set of filters that you can apply to the entire dashboard. Use these filters to drill down and examine the data to a granular level.
- You can change the time range for a dashboard or panel by selecting a predefined interval from a drop-down list, choosing a recently used time range, or specifying custom dates and times. Learn more.
- You can use template variables to drill down and examine the data on a granular level. For more information, see Filtering Dashboards with Template Variables.
- Most Next-Gen apps allow you to provide the scope at the installation time and are comprised of a key (
_sourceCategoryby default) and a default value for this key. Based on your input, the app dashboards will be parameterized with a dashboard variable, allowing you to change the dataset queried by all panels. This eliminates the need to create multiple copies of the same dashboard with different queries.
Overview
See an overview of Oracle listener process activity, including successful DB connections, TNS error information, SID and Service Name usage, command execution, and top usage, in terms of ports, database users, user hosts, client hosts, and user programs as derived from the Oracle Listener log.
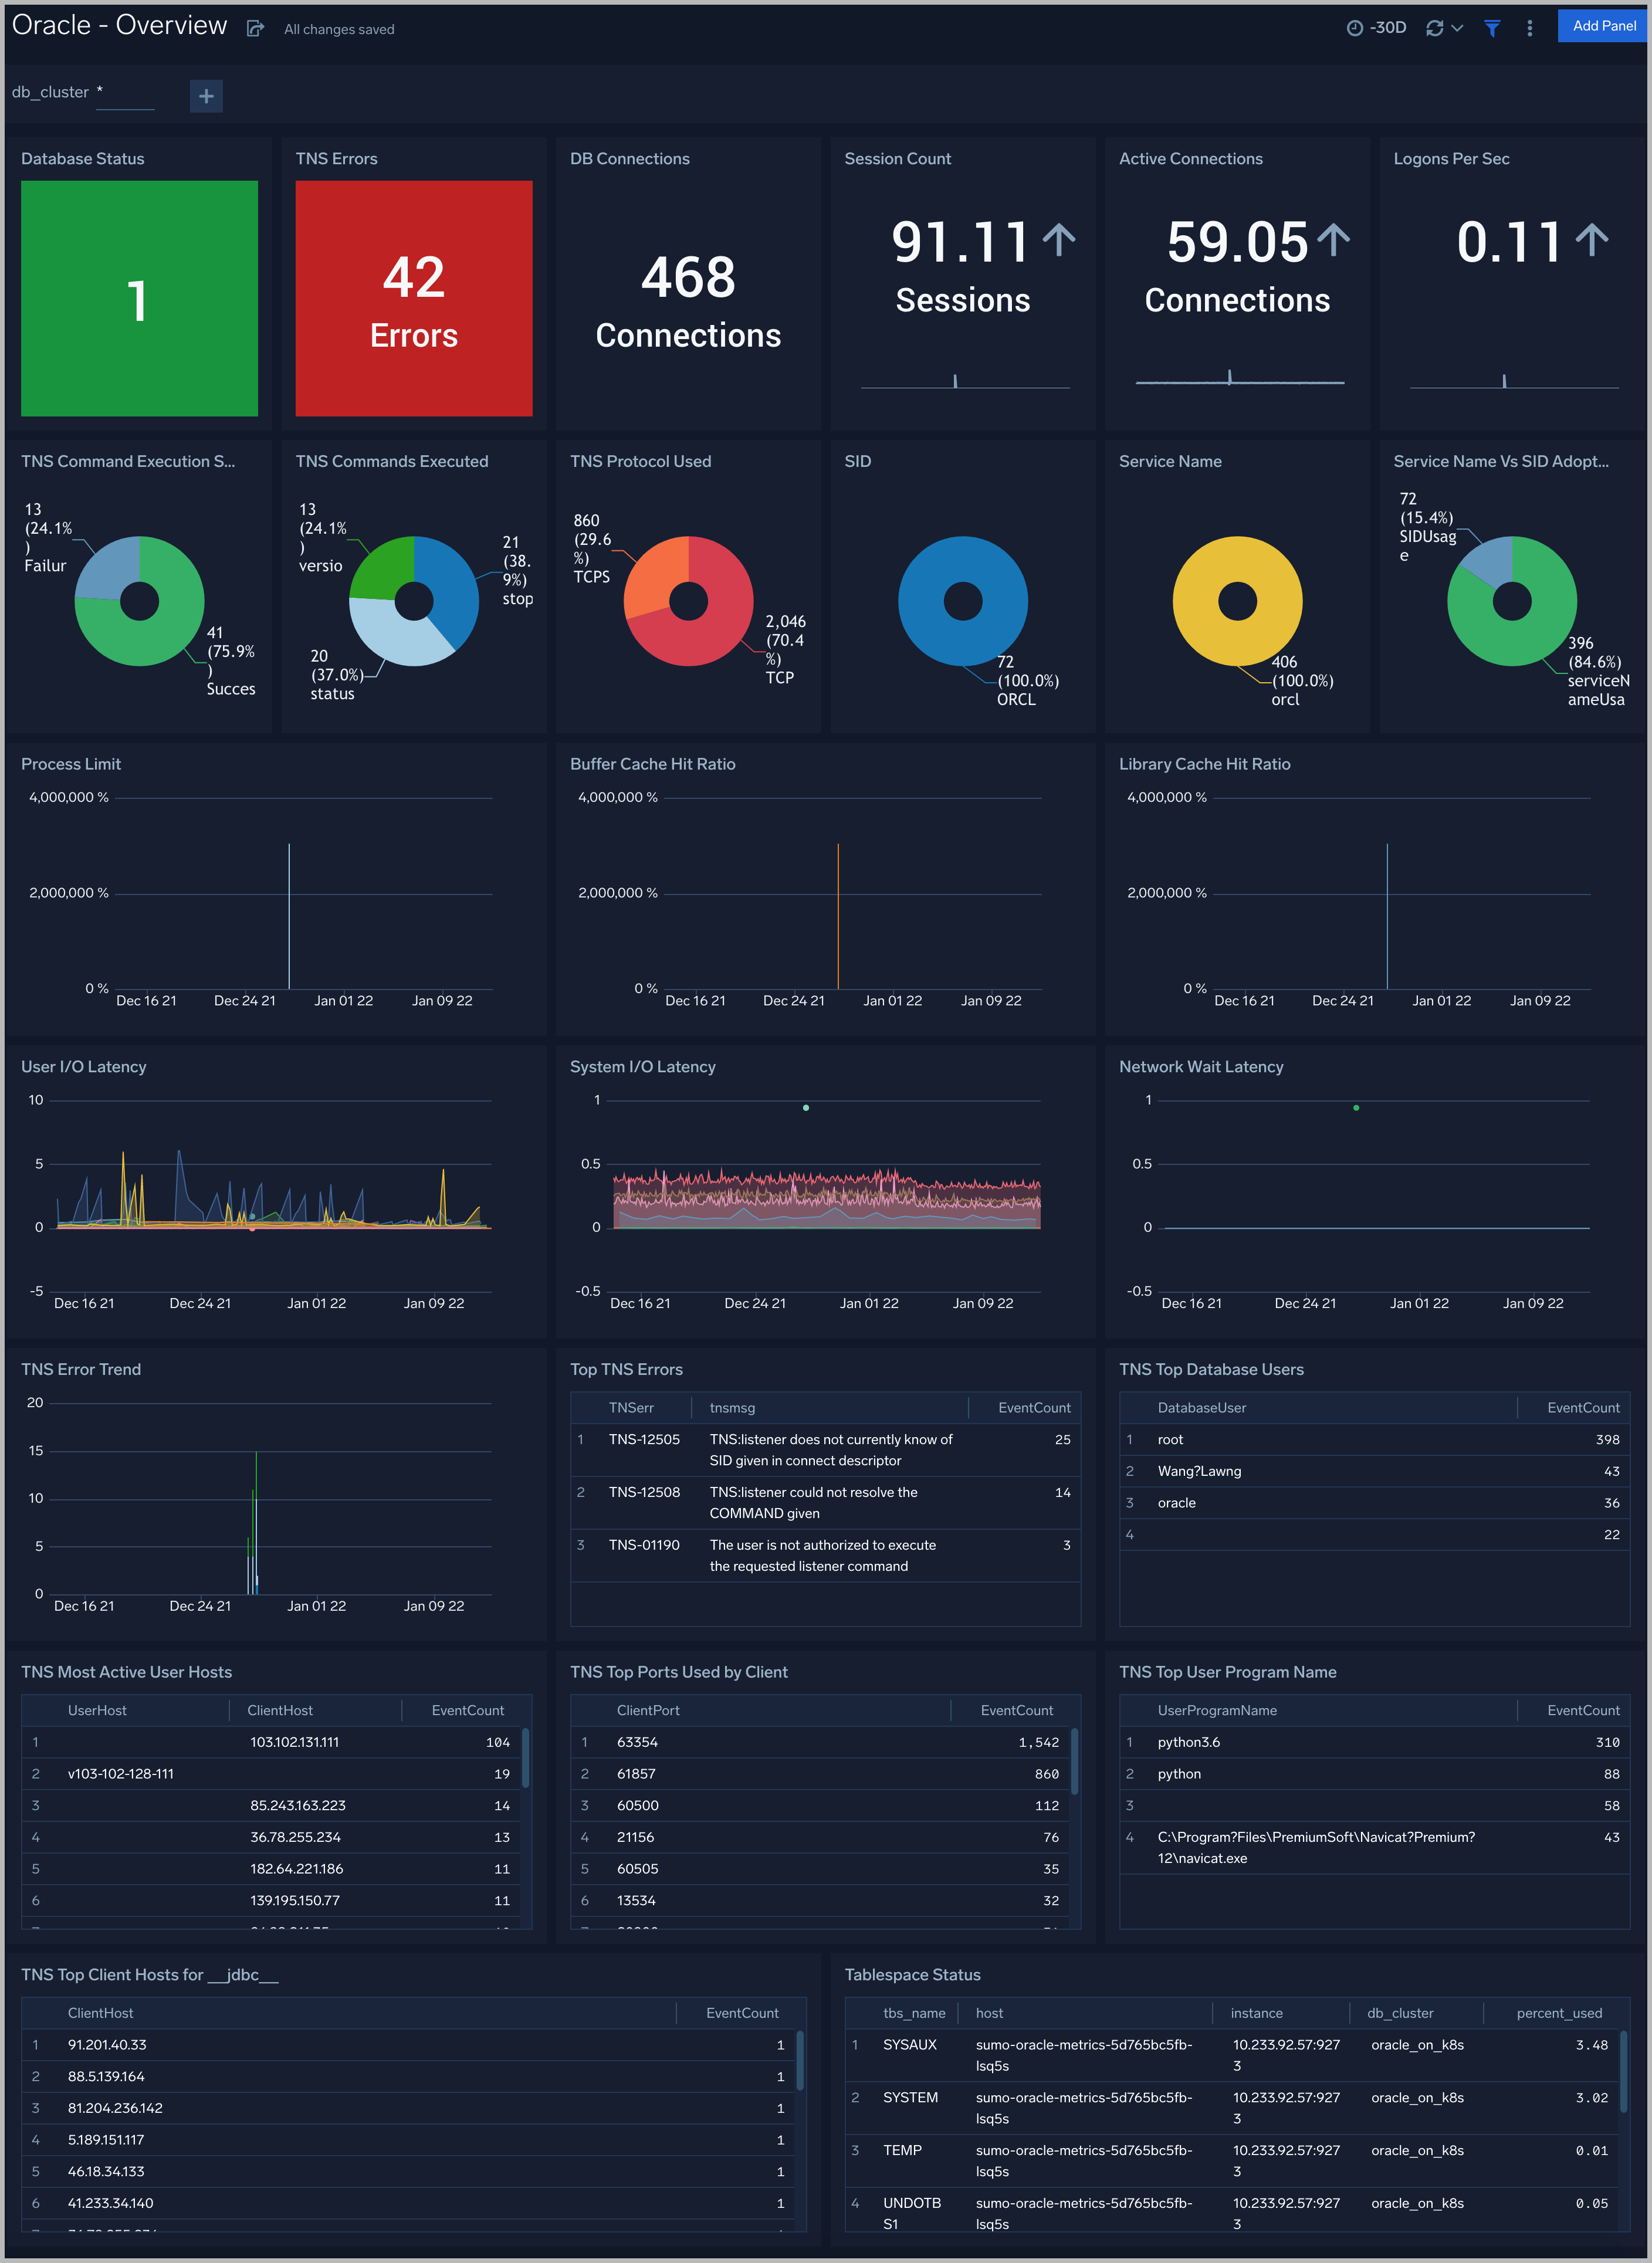
DB Connections. The count of database connections established during the previous 24 hours.
TNS Errors. The count of TNS errors during the previous 24 hours.
Top TNS Errors. A table that shows the top 10 TNS errors and the count of each in the previous 24 hours.
TNS Error Trend. A stacked column chart that shows the count of each TNS error per one hour timeslice, over the previous 24 hours.
SID. A donut chart that shows the breakdown of connections by SID over the previous 24 hours.
Service Name. A donut chart that shows the breakdown of connections by service name over the previous 24 hours.
Service Name Vs SID Adoption. A donut chart that shows the breakdown of connections by SID versus by Service Name over the previous 24 hours.
Protocol Used. A donut chart that shows the breakdown of connection requests by protocol over the previous 24 hours.
Command Execution Status. A donut chart that shows the breakdown of successful and failed Listener commands over the previous 24 hours.
Commands Executed. A donut chart that shows the breakdown of specific lsnrctl commands over the previous 24 hours.
Top Ports Used by Client. A table that shows the top 20 client ports that initiated connections, and connection count for each over the previous 24 hours.
Top Database Users. A table that shows the top 20 database users for which the client initiated connections, and connection count for each over the previous 24 hours.
Most Active User Hosts. A table that shows the top 20 user hosts that initiated connections, and connection count for each over the previous 24 hours.
Top Client Hosts for jdbc. A table that shows connections initiated from Client Host by appserver using the JDBC Thin Client (host name jdbc) and the connection count for each over the previous 24 hours.
Top User Program Name. A table that shows the top 20 programs that initiated connections over the previous 24 hours.
Alert Analysis
See information about Oracle errors, including counts of various error types, ORA messages, oracle instance state, and other data derived from the Oracle Alert log.
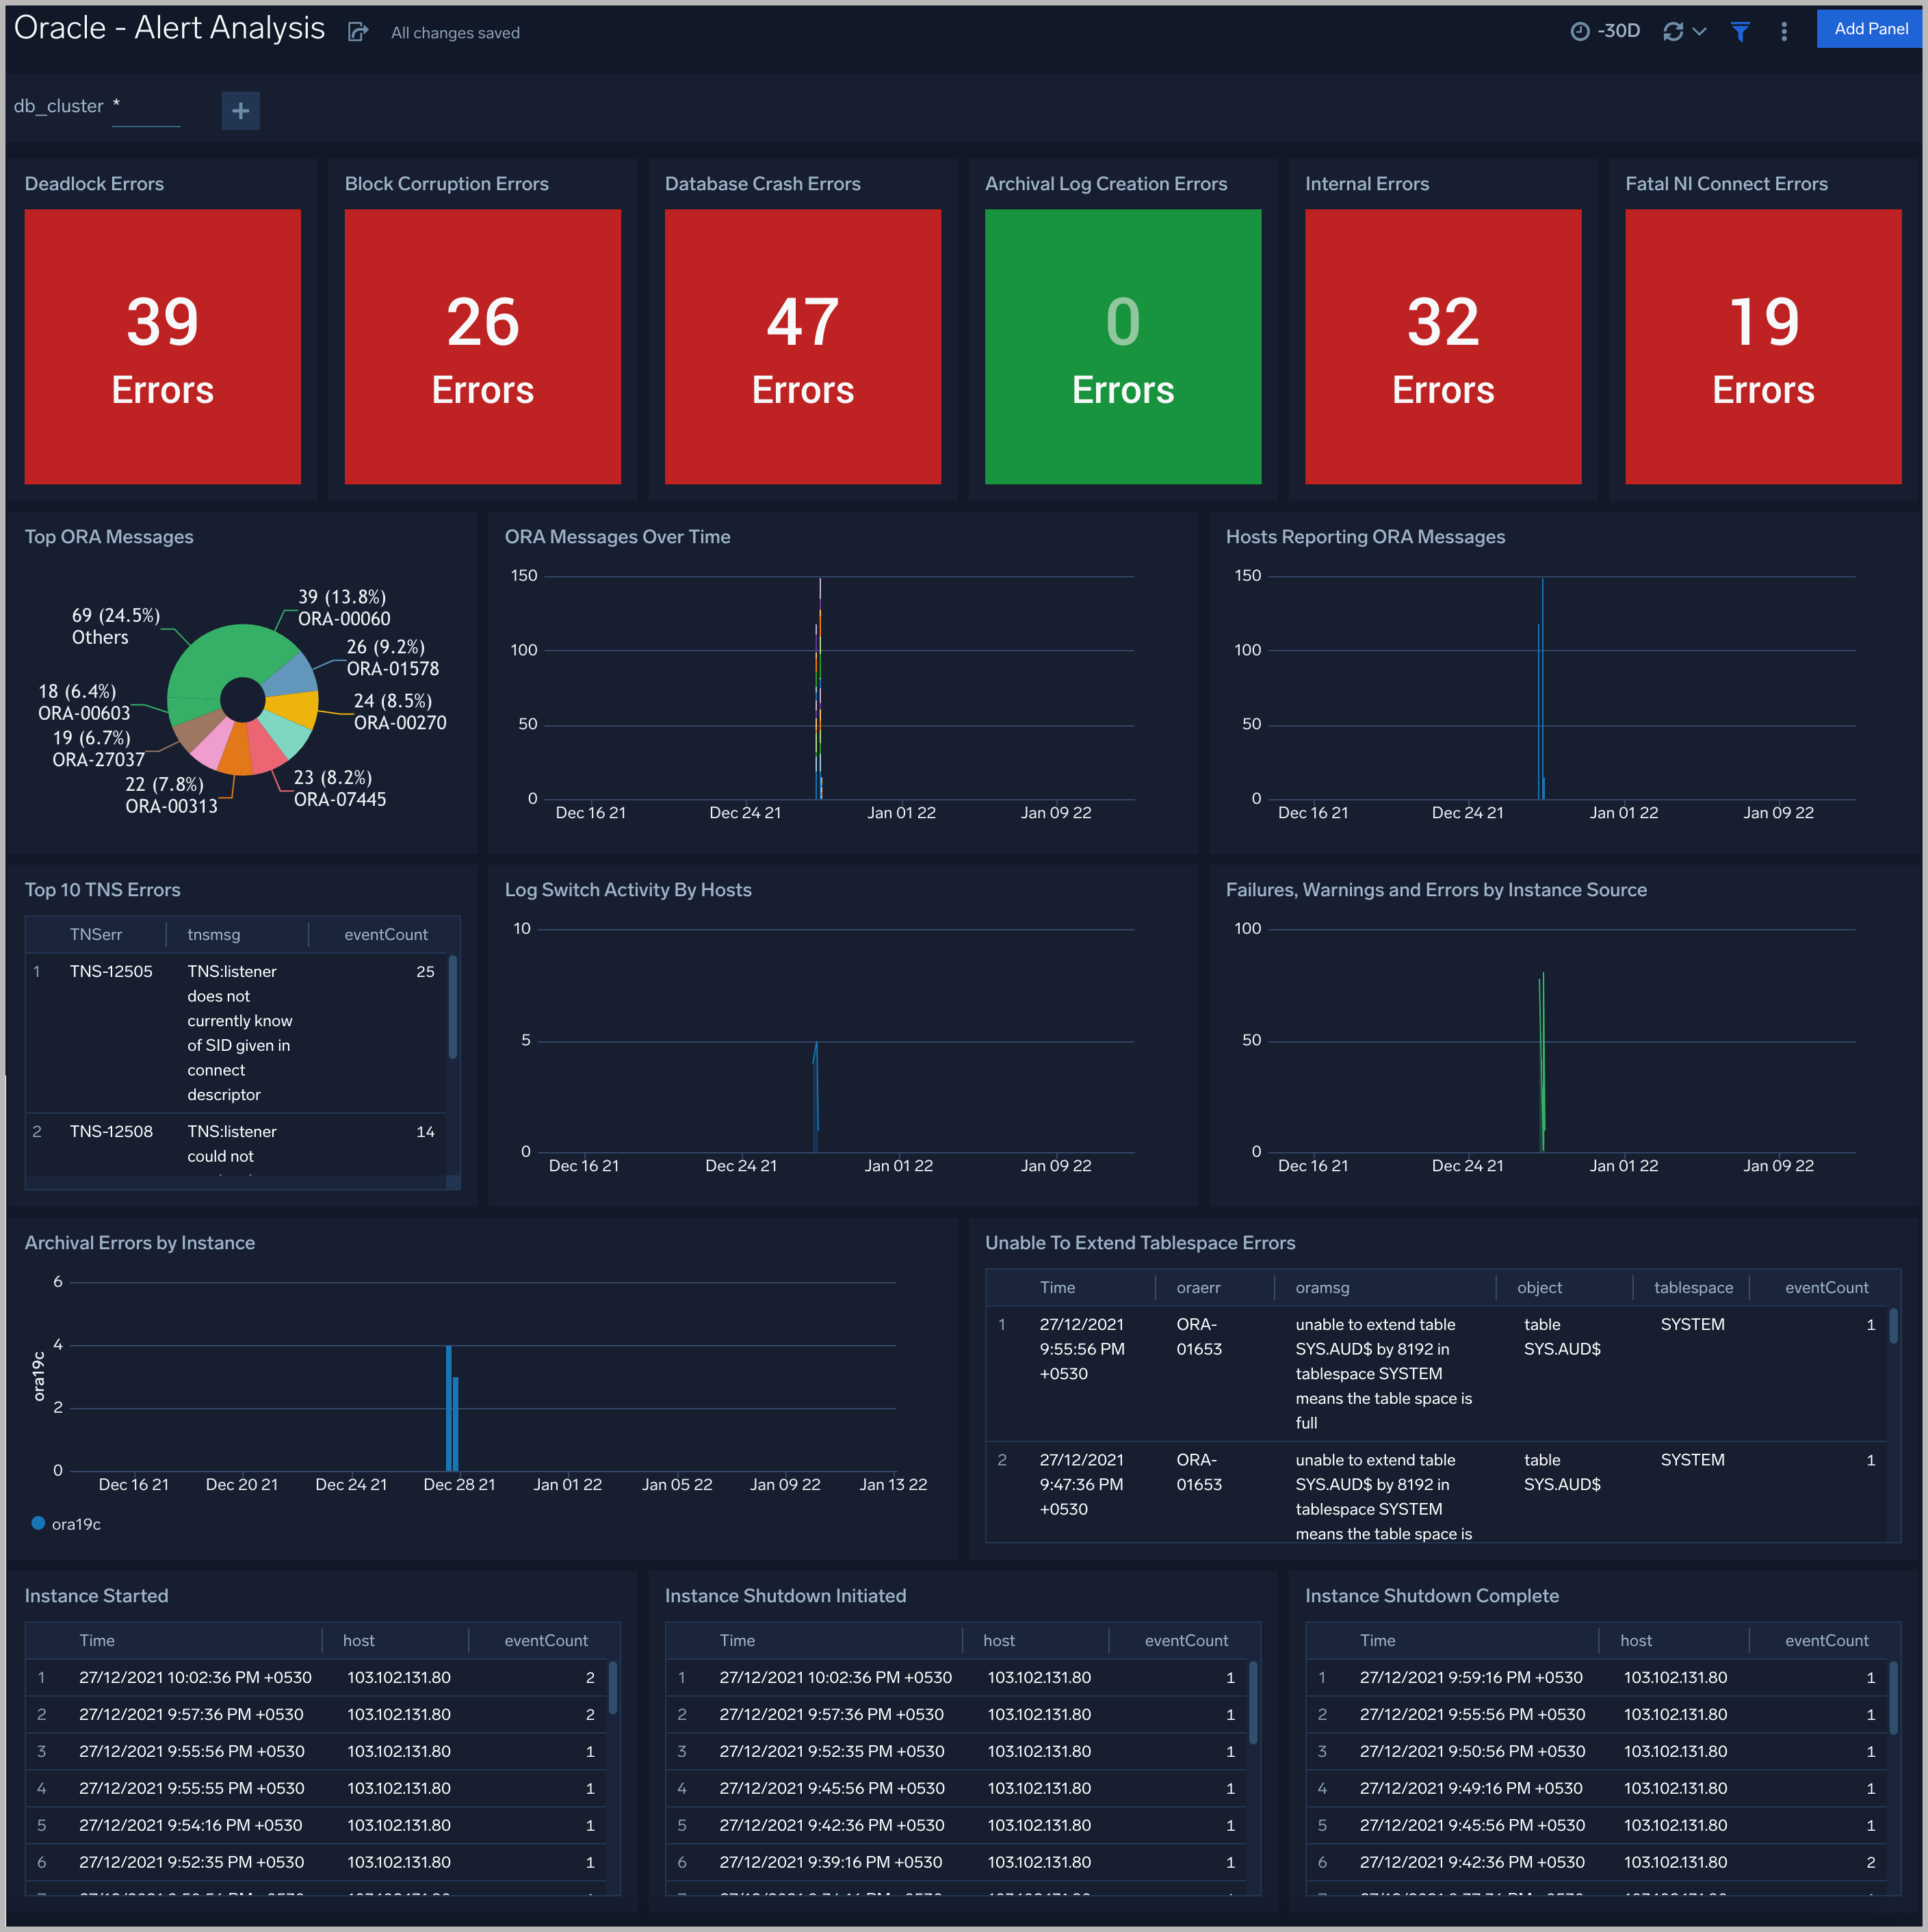
Deadlock Errors. Count of ORA-00060 messages over the previous 24 hours.
Database Crash Errors. Count of database crash errors (ORA-00603, ORA-00449, ORA-00471, or ORA-01092) over the previous 24 hours.
Archival Log Creation Errors. Count of ORA-00270 messages over the previous 24 hours.
Internal Errors. Count of internal errors (ORA-00600 or ORA-07445) over the previous 24 hours.
Fatal NI Connect Errors. Count fatal NI connect errors over the previous 24 hours.
Top ORA Messages. A donut chart that shows the breakdown of ORA messages by message type over the previous 24 hours.
ORA Messages Over Time. A stacked column chart that shows the count of ORA messages of each message type per one hour timeslice over the previous 24 hours.
Hosts Reporting ORA Messages. A stacked column chart that shows the count of ORA messages of all types by host per one hour timeslice over the previous 24 hours.
Top TNS Errors. A table that shows the count of Transparent Network Substrate (TNS) errors of each type over the previous 24 hours.
Log Switch Activity By Hosts. An area chart that shows the count of log switch events per one hour timeslice by host. (A log switch is the point at which the database stops writing to one redo log file and begins writing to another.)
Failures, Warnings and Errors by Instance Source. An area chart that shows the count of messages from the Oracle Alert log that match patterns like: fail*, warn*, or error*.
Archival Errors by Instance. A stacked column chart that shows the count of messages from the Oracle Alert log that contain the string “Archival Error" by per one hour timeslice by database instance over the previous 24 hours.
Unable to Extend Tablespace Errors. A table that lists errors related to a failure to extend a tablespace, that occurred during the previous 24 hours.
Instance Started. A table that lists when database instances were started during the previous three days.
Instance Shutdown Initiated. A table that lists when shutdowns of database instances were initiated during the previous three days.
Instance Shutdown Complete. A table that lists when shutdowns of database instances were initiated during the previous three days.
Listener Troubleshooting
See details of Oracle listener process activity, including database connections by host and application, connection failures, command execution status and trends, and other data derived from the Oracle Listener log.
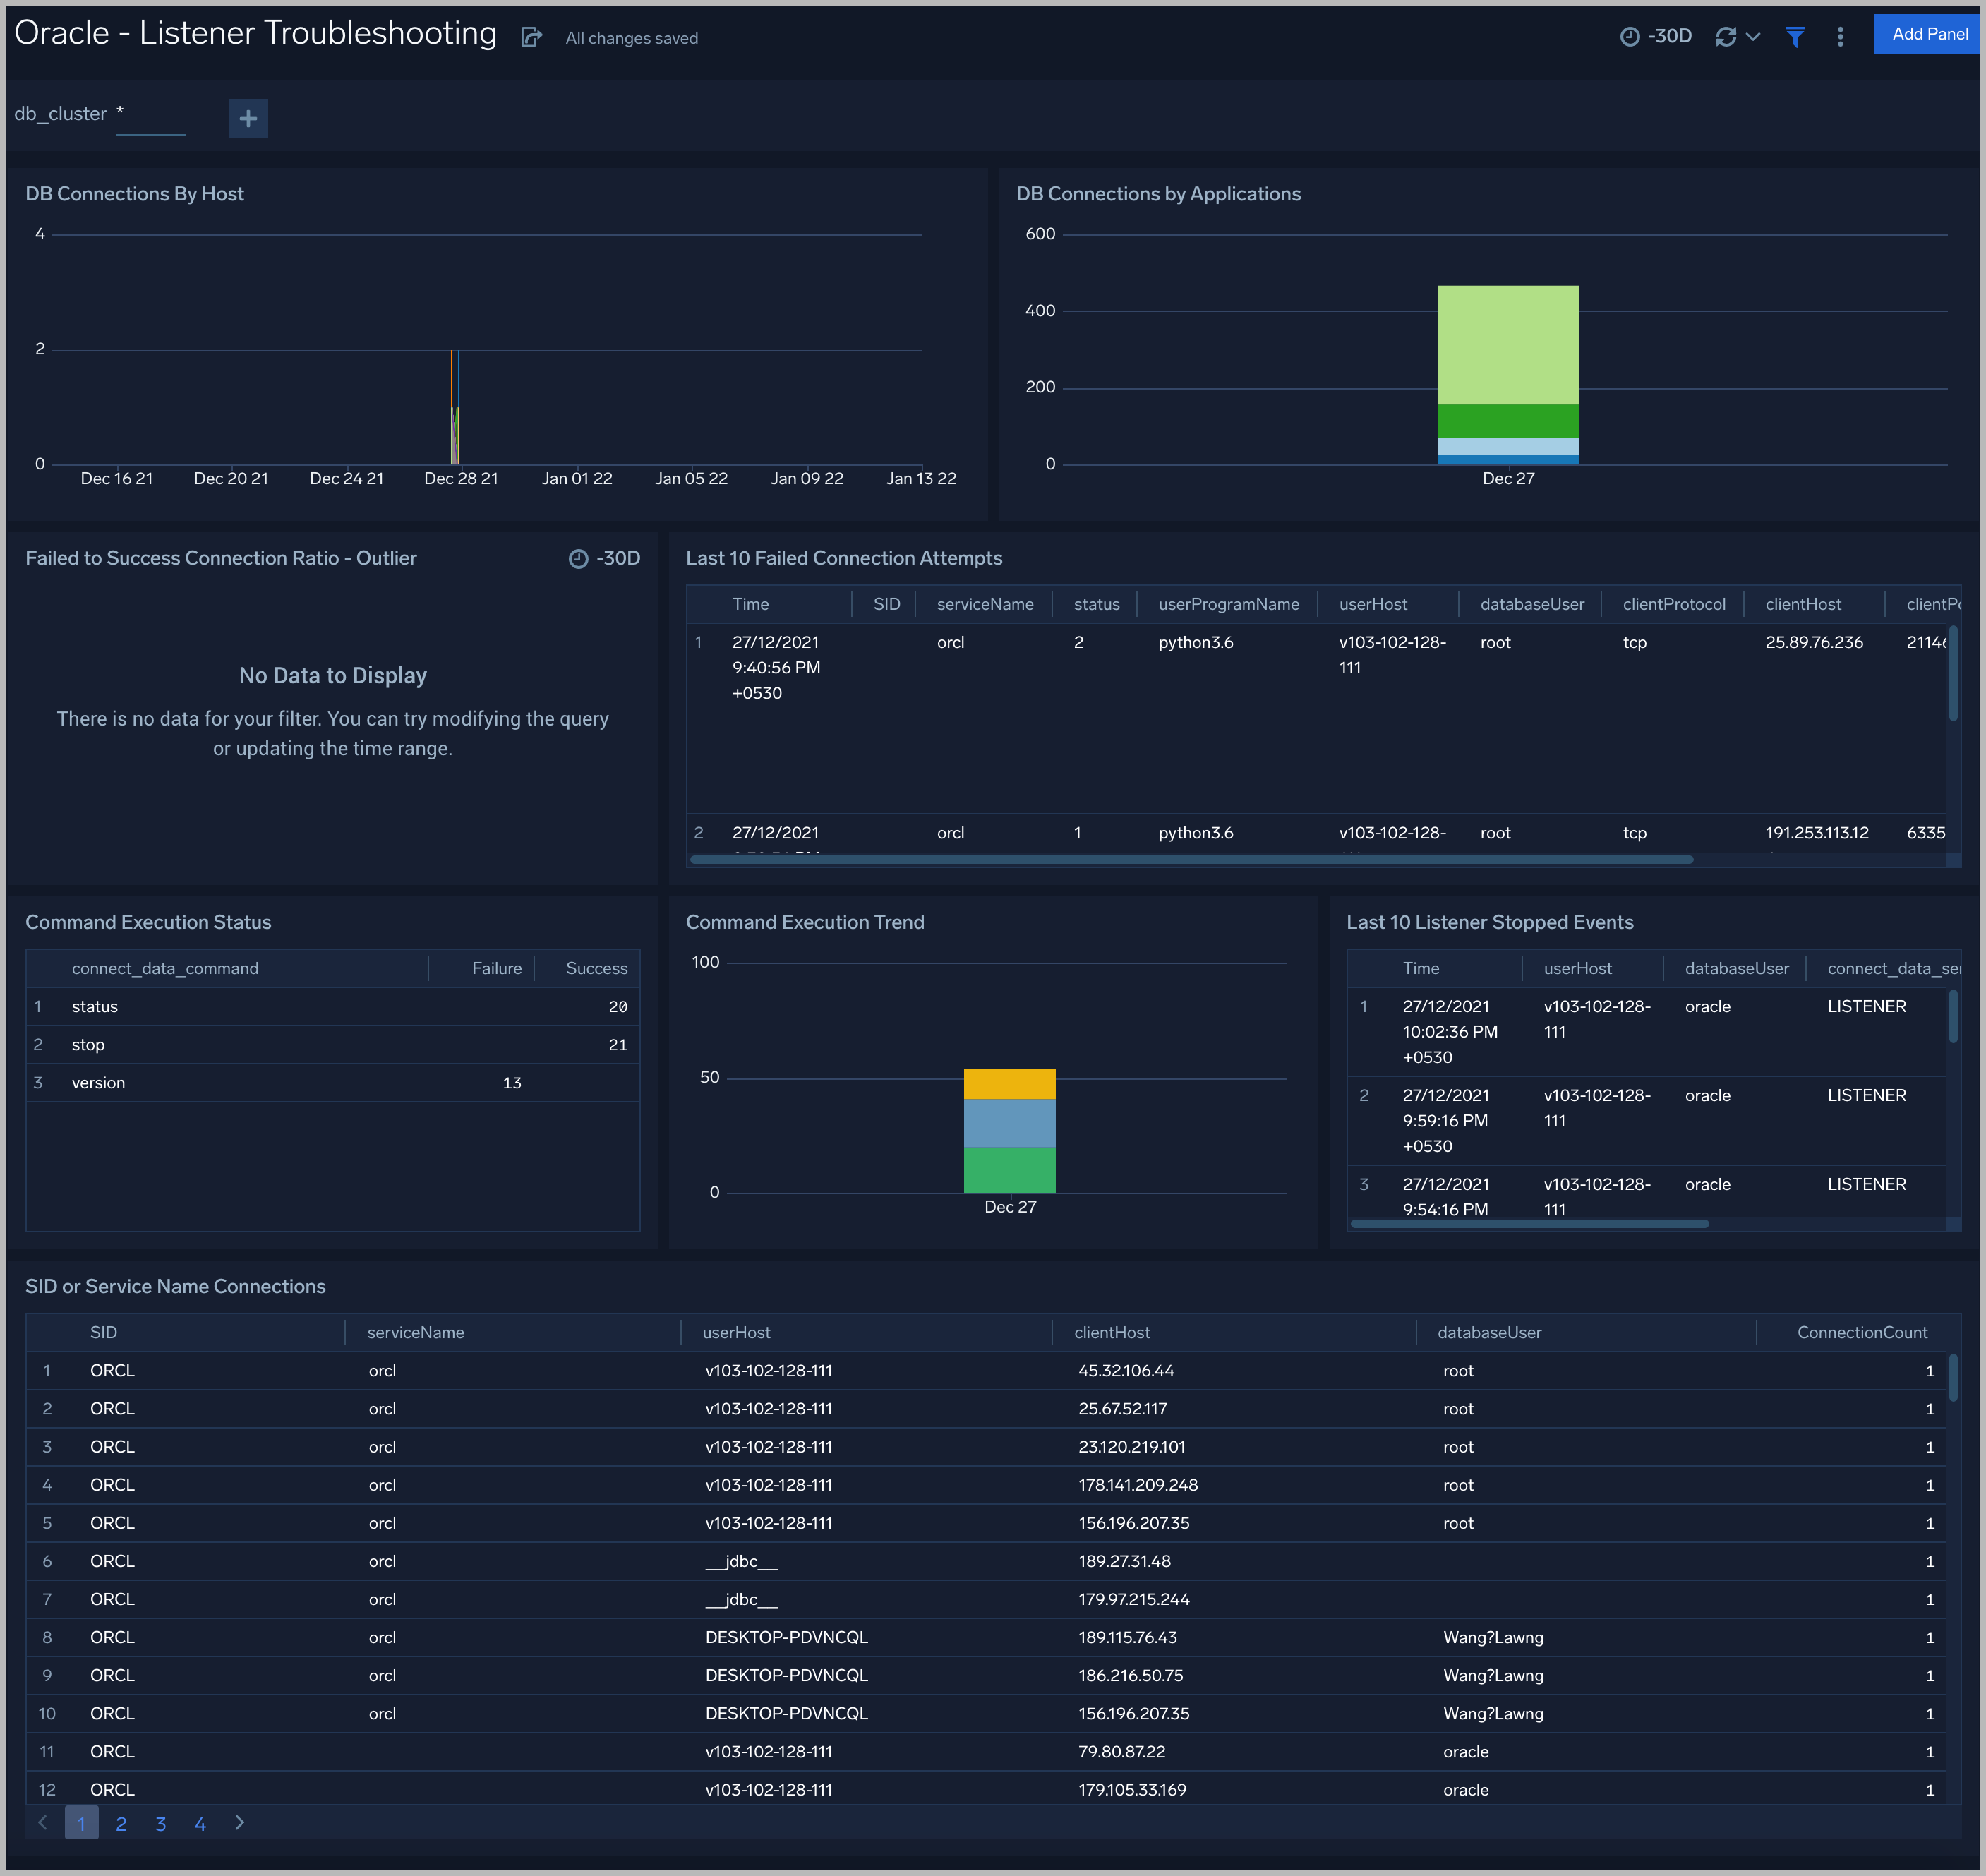
DB Connections By Host. An area chart that shows the count of database connections by host, per 5 minute timeslice, over the previous 24 hours.
DB Connections By Applications. A stacked column chart that shows the count of database connection by initiating program, per one day timeslice, over the previous 7 days.
Failed to Success Connection Ratio - Outlier. A visualization that shows when the ratio of failed to successful connections was statistically significant (more than three standard deviations higher than the running average), over the previous 30 days.
Failed Connection Attempts. A table that lists failed database connection attempts over the previous three days.
Command Execution Status. A table that lists the count of specific lsnrctl commands that were issued in the previous seven days, and the count of failures and successes for each.
Command Execution Trend. A stacked column chart that shows the count of specific lsnrctl commands that were issued in the previous seven days per one day timeslice.
Listener Stopped Events. A table that lists listener stop events during the previous 7 days.
SID or Service Name Detailed Breakup. A table that shows the count of connections performed with sid or service name, by userhost, clienthost, and databaseuser.
Security Monitoring
See information about database connections established by privileged users, connection attempts from public IP addresses, attempts to execute unauthorized commands, and events that associated with potentially inappropriate activities as derived from Oracle Listener and Alert Logs.
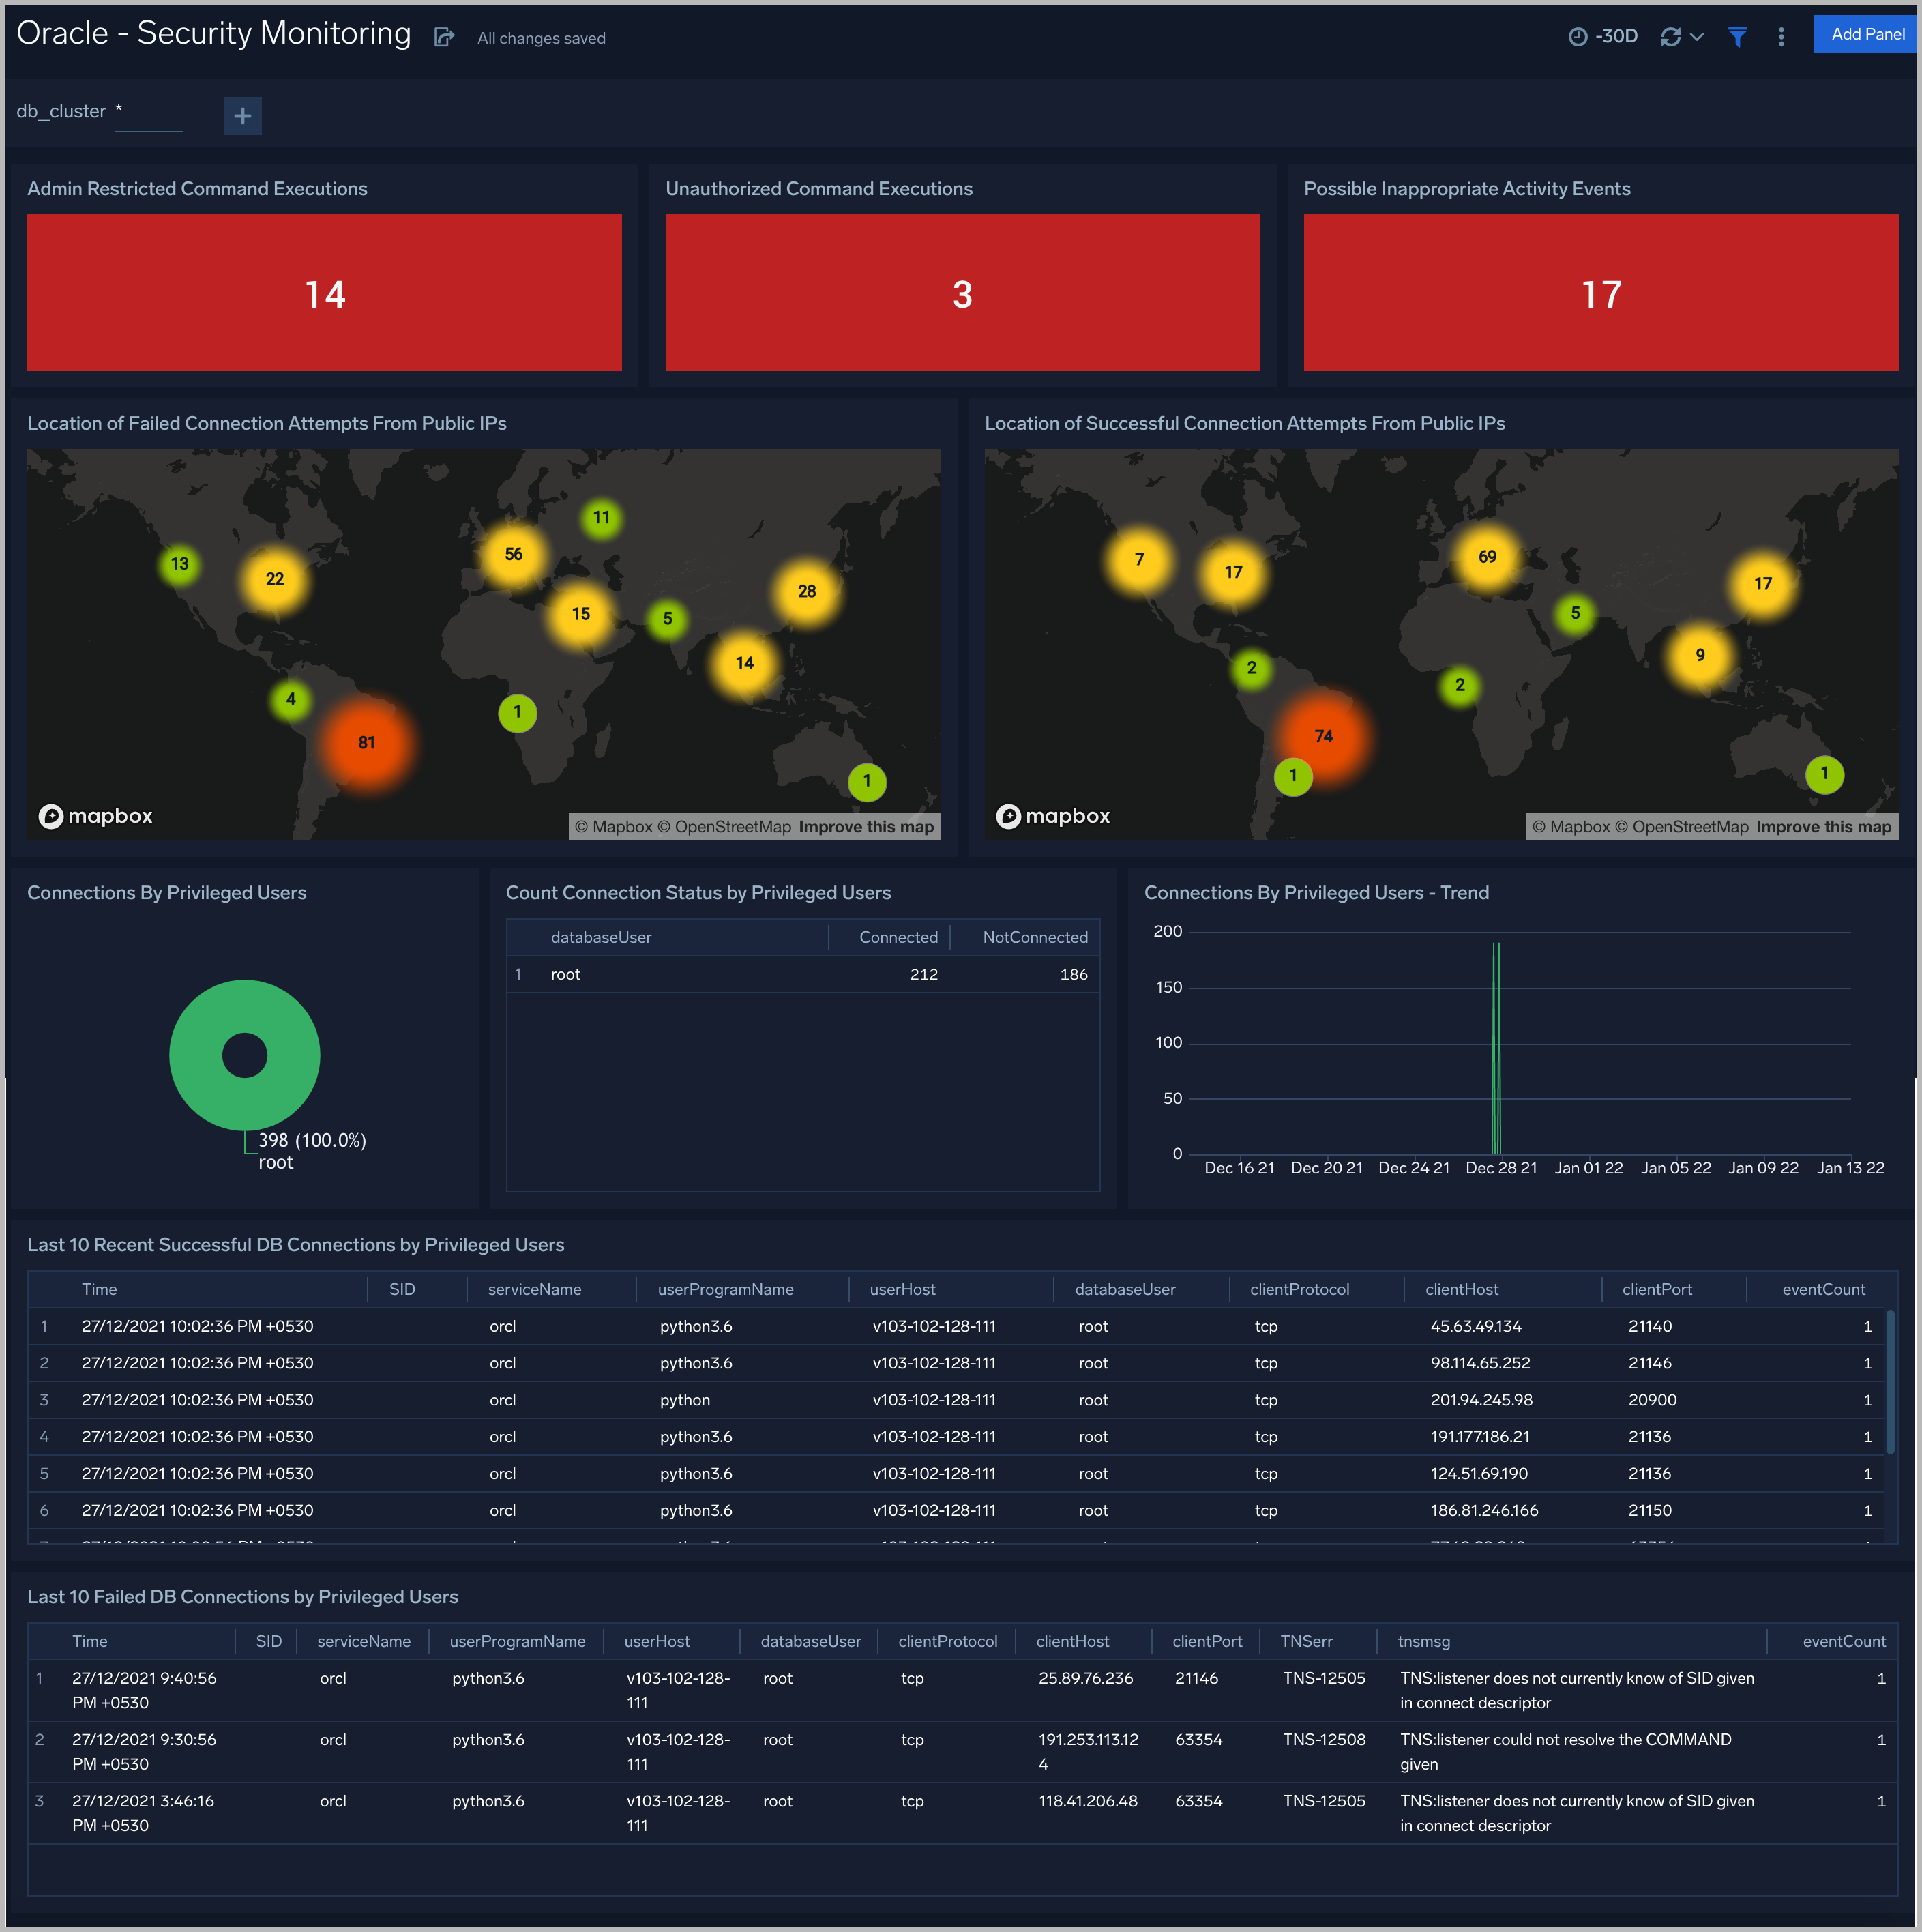
Admin Restricted Command Execution. The count of database commands that resulted in TNS-12508 errors over the previous 24 hours.
Unauthorized Command Execution. The count of database commands that resulted in TNS-01190 errors over the previous 24 hours.
Possible InAppropriate Activity. The count of lsnrctl commands the resulted in errors of the following types over the previous 24 hours: TNS-01169, TNS-01189, TNS-01190, "TNS-12508", ORA-12525, ORA-28040, or ORA-12170.
Connections By Privileged Users. A donut chart that shows the breakdown of connections from privileged user accounts, such as root and administrator, over the previous 24 hours.
Connection Status by Privileged Users. A table that shows the count of successful and unsuccessful connections from privileged user accounts, such as root and administrator, over the previous 24 hours.
Connections By Privileged Users - Trend. A line chart that shows the count of connections from privileged user accounts, such as root and administrator, per one hour timeslice over over the previous 24 hours.
Recent Successful DB Connections by Privileged Users. A table that shows the count of successful connections from privileged user accounts, such as root and administrator, per one minute timeslice, over the previous 24 hours.
Failed Connection Attempt From PublicIP Location. A map chart that shows the count and location of failed connection attempts from geographical locations over the previous 24 hours.
Successful Connection Attempt From PublicIP Location. A map chart that shows the count and location of successful connection attempts from geographical locations over the previous 24 hours.
Failed DB Connections by Privileged Users. A table that provides information about failed database connections from privileged user accounts, such as root and administrator, over the previous 24 hours.
Sys Audit Log
See information derived from the syslog audit trail, including successful and failed activities, and top usage by client, database user, and privileges used.
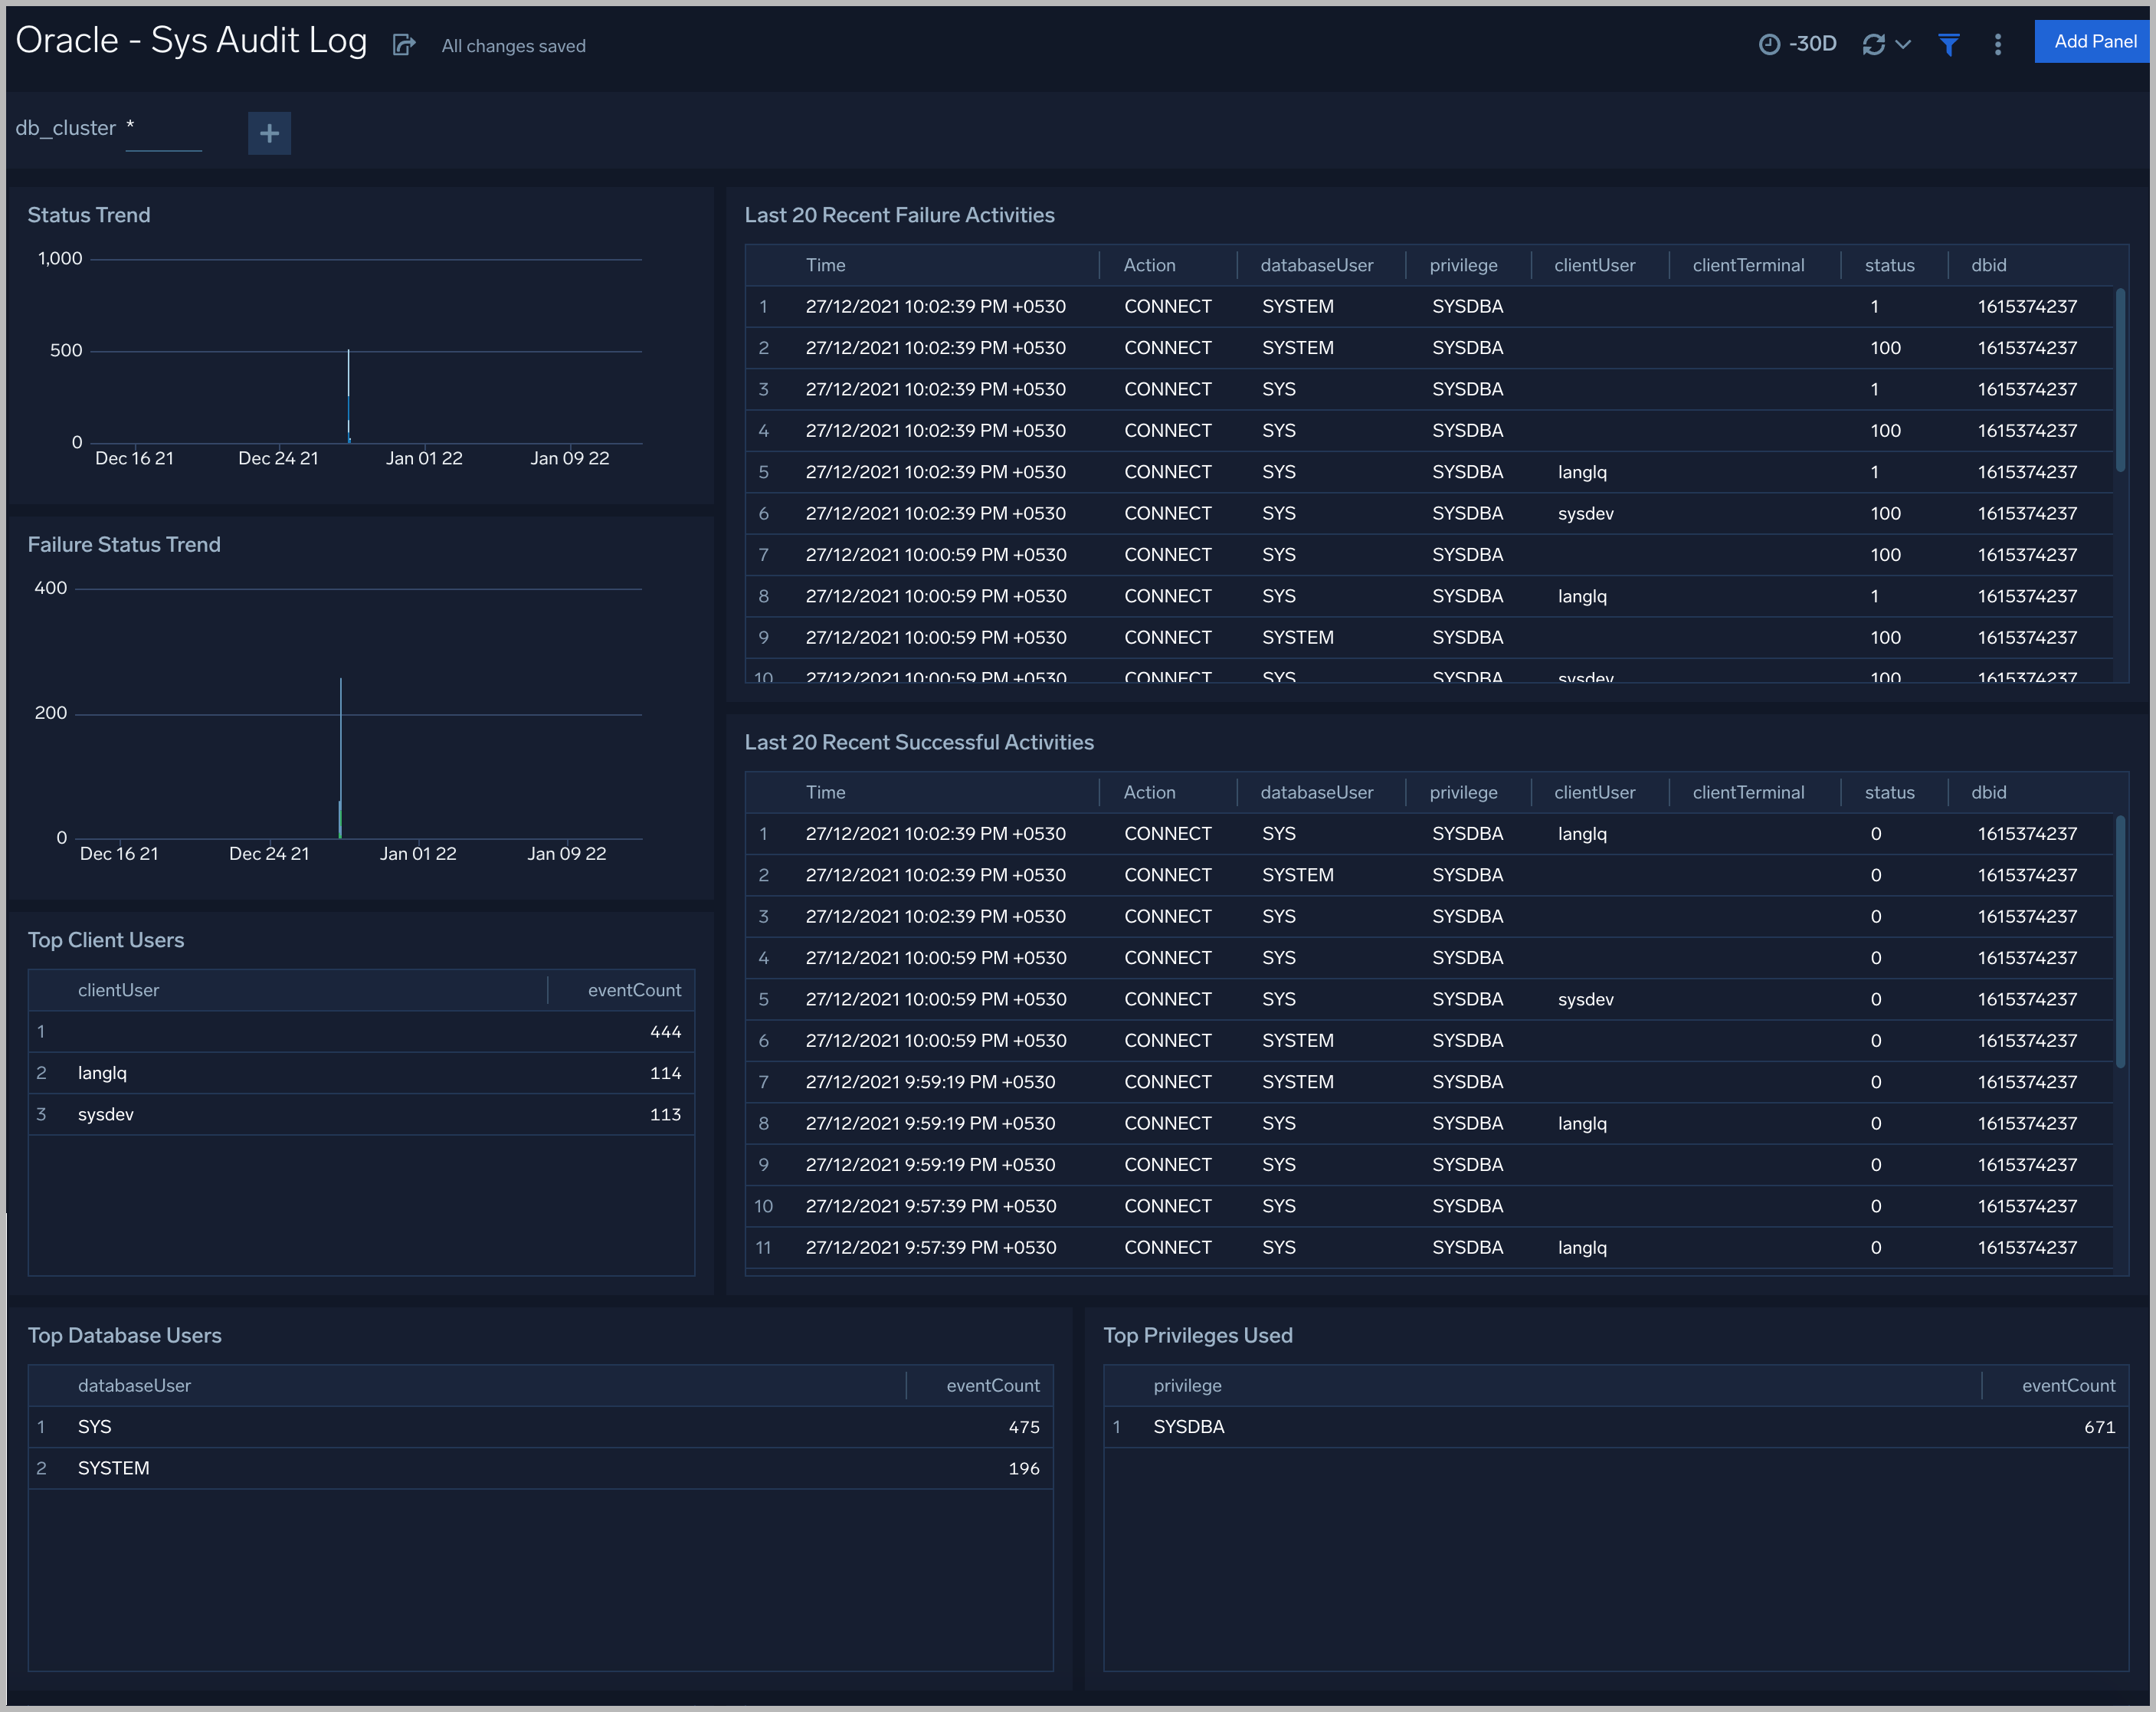
Status Trend. A stacked column chart that shows the count of successful and unsuccessful database actions over the previous 24 hours.
Failure Status Trend. A stacked column chart that shows the count of unsuccessful database actions by failure status code over the previous 24 hours.
Recent Failure Activities. A table that lists unsuccessful database actions over the previous 60 minutes.
Top Client Users. A table that shows the top 10 client users over the previous 24 hours, and a count of the events associated with each.
Top Database Users. A table that shows the top 10 database users over the previous 24 hours, and a count of the events associated with each.
Top Privileges Used. A table that shows the top 10 database privileges used over the previous 24 hours, and a count of the events associated with each.
Recent Successful Activities. A table that lists information about successful database actions over the previous 60 minutes.
Sys Audit Log - Logon Analysis
See logon activity information derived from the syslog audit trail, including successful and failed logons, logon status trends, multiple database user logons and client user logons from the same UserHost, and multiple UserHost logons with the same database user.
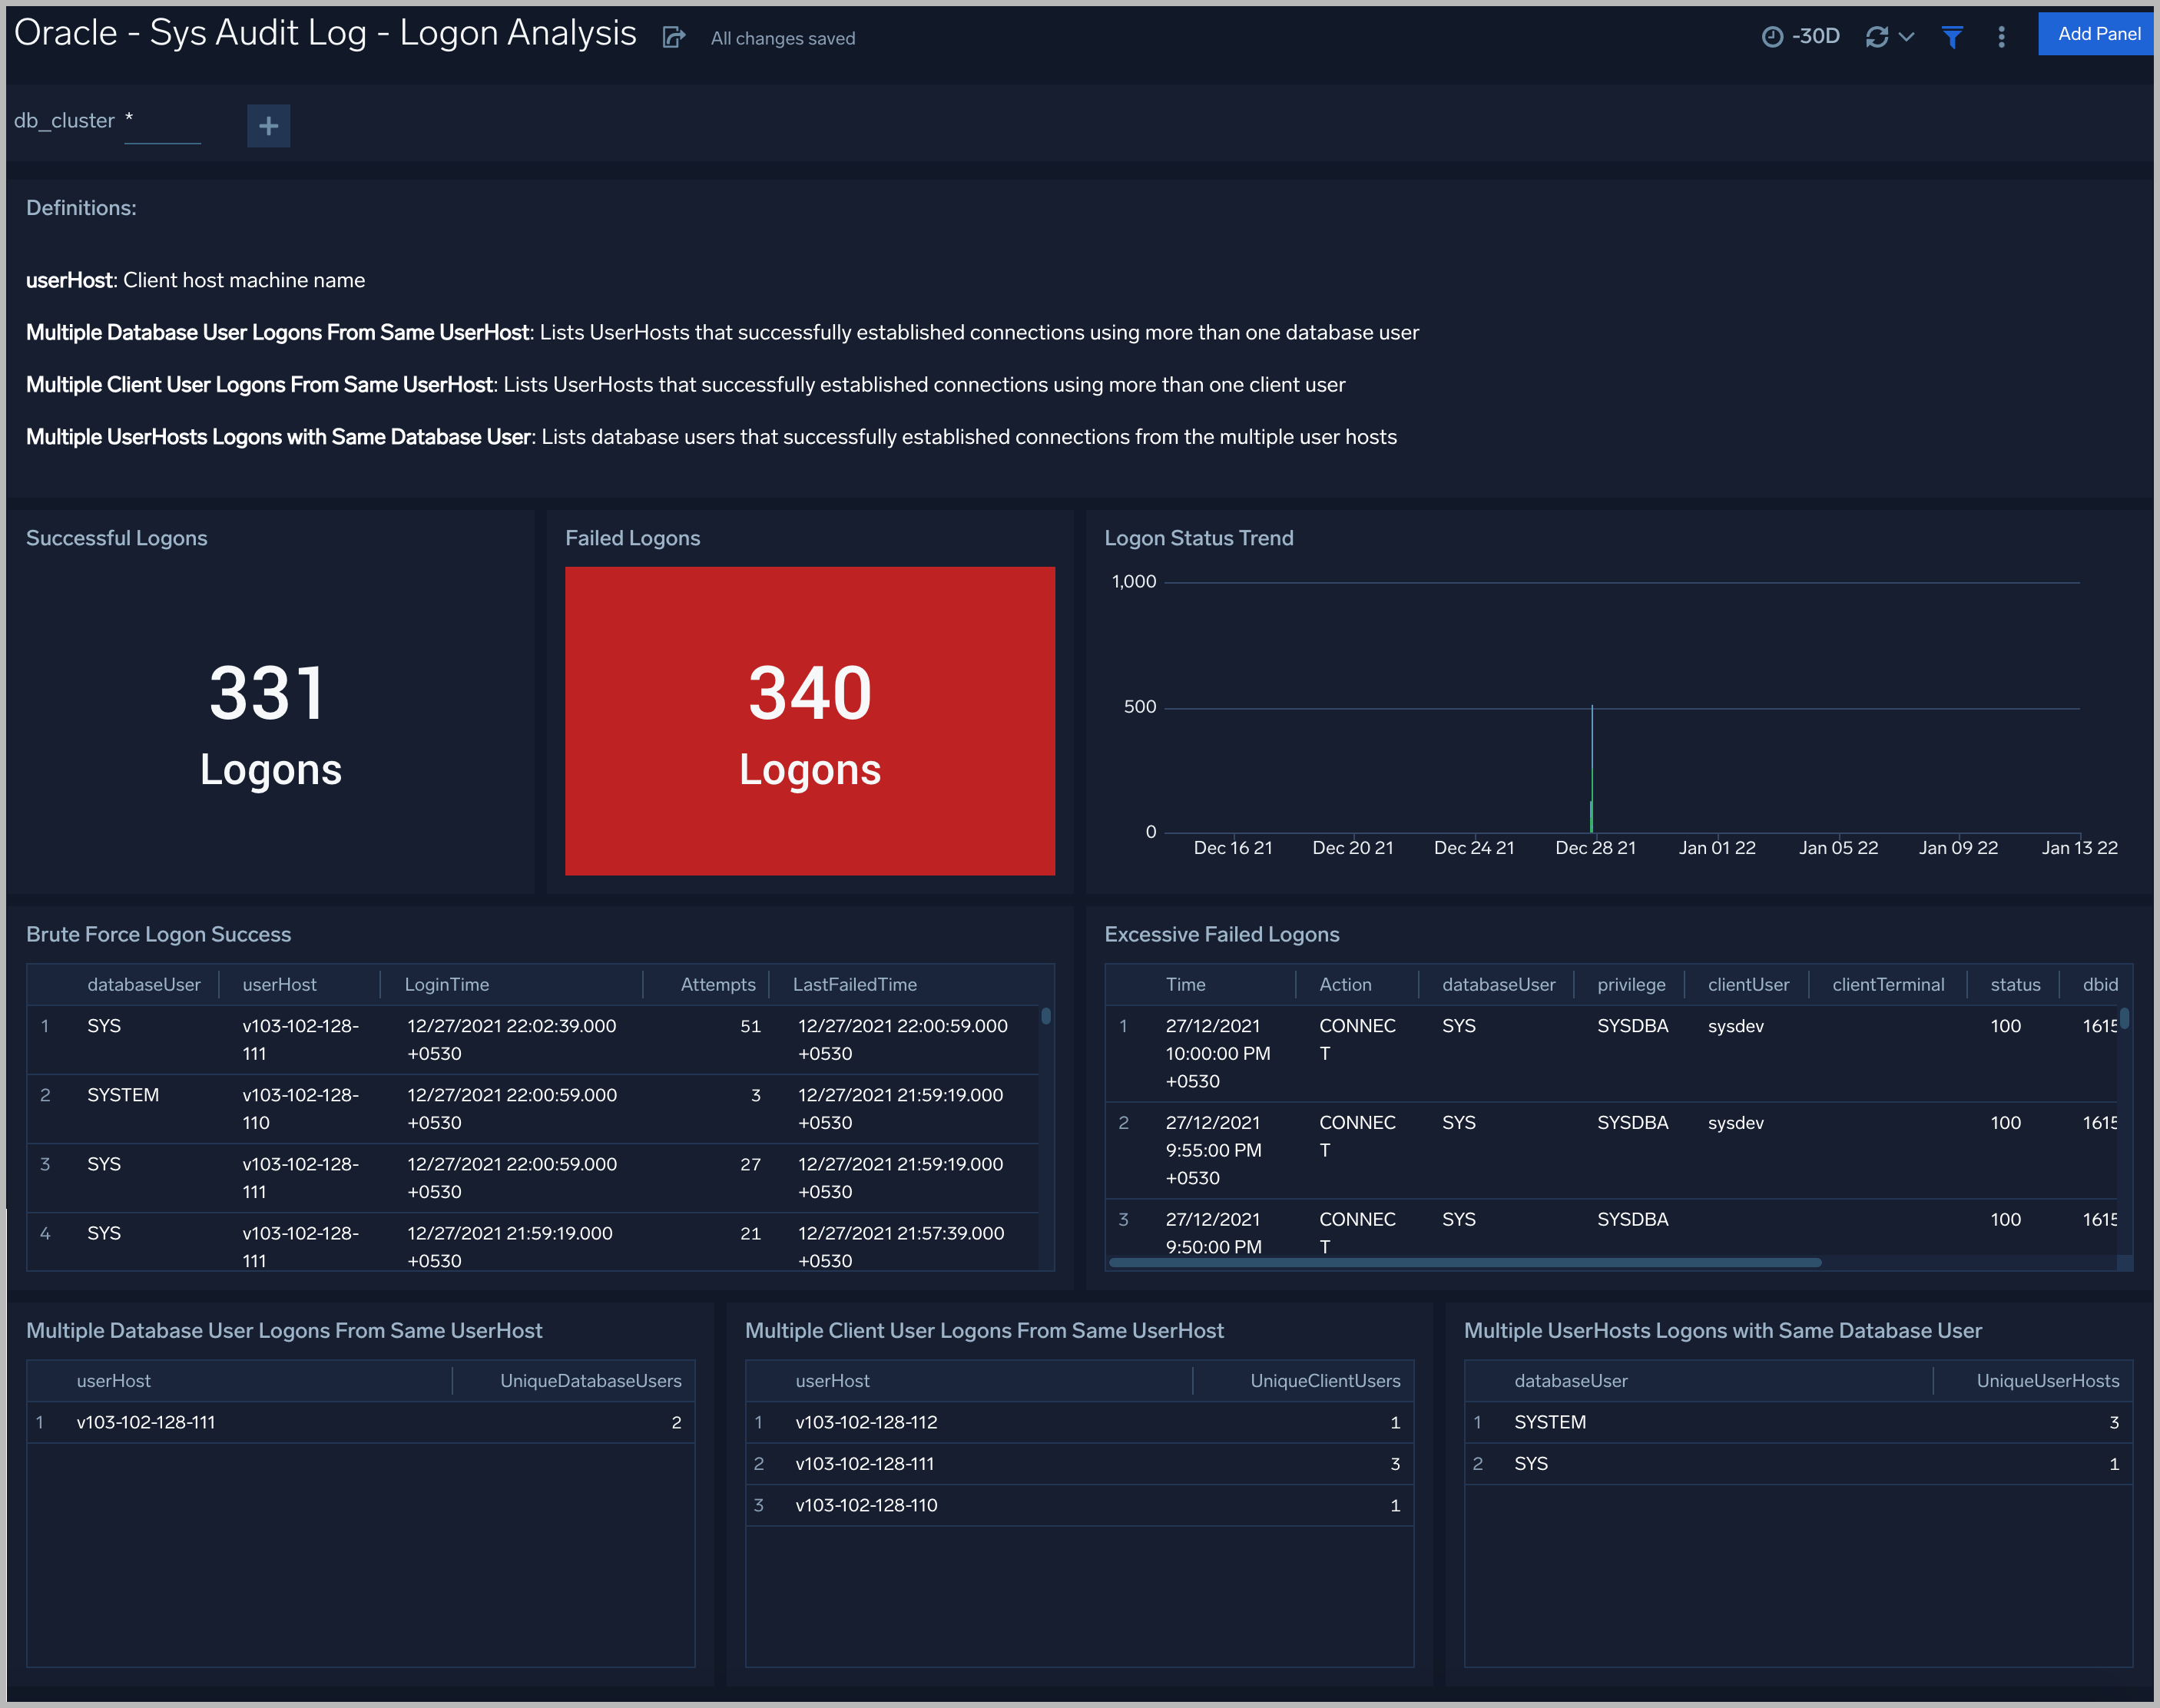
Successful Logons. Count of successful logins in the previous 24 hours.
Failed Logons. Count of failed logins in the previous 24 hours.
Successful Logoffs. Count of successful logoffs in the previous 24 hours.
Logon Activities Trend. Stacked column chart that shows the count of logons and logoffs per one hour timeslice over the previous 24 hours.
Brute Force Login Success. Table that lists information about brute force login attempts that succeeded during the previous three days.
Excessive Failed Logons. A table that lists information about incidents where there were more than five failed logons within 5 minutes during last three days.
Multiple Database User Logons From Same UserHost. A table that lists UserHosts that successfully established connections using more than one database user over the previous 24 hours.
Multiple Client User Logons From Same UserHost. A table that lists UserHosts that successfully established connections using more than one client user over the previous 24 hours.
Multiple UserHosts Logons with Same Database User. A table that lists database users that successfully established connections from the multiple user hosts over the previous 24 hours.
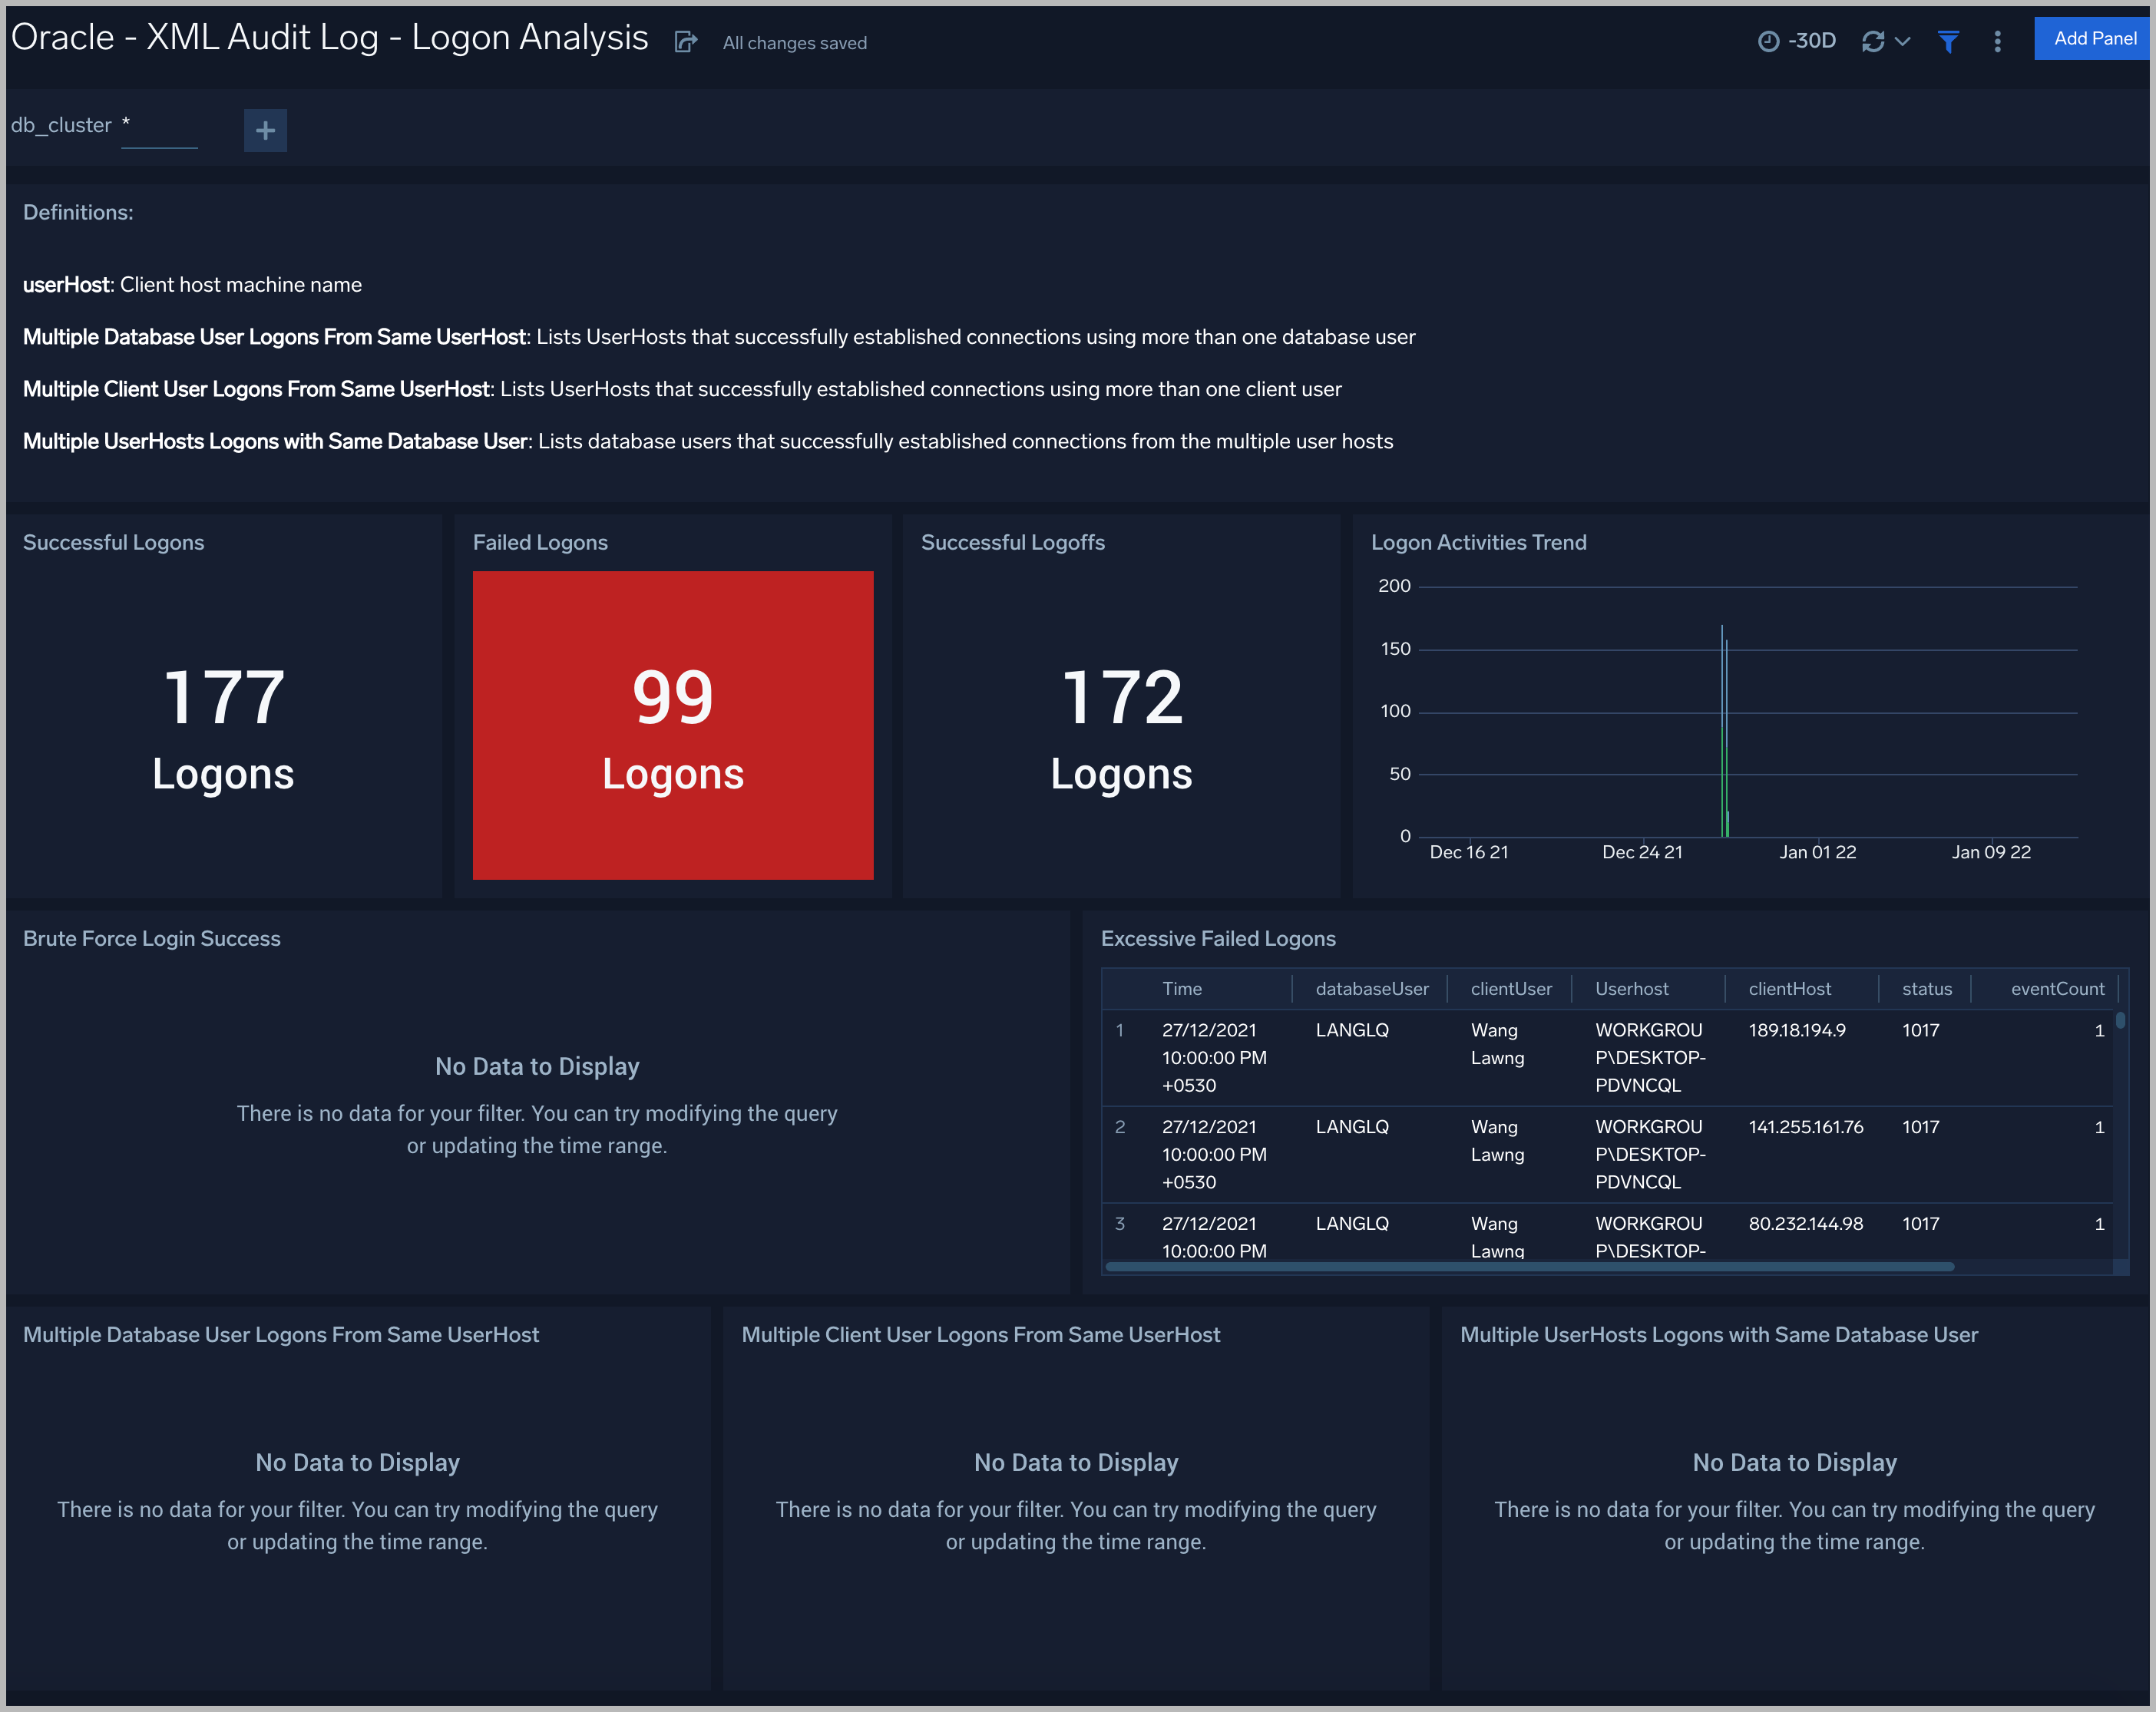
XML Audit Log - Logon Analysis
See logon activity information derived from the XML audit trail, including successful and failed logons, logon status trends, multiple database user logons and client user logons from the same UserHost, and multiple UserHost logons with the same database user.
XML Audit Log - SQL Statement Analysis
See information derived from the XML audit trail about user management, role management, Data Definition Language (DDL), Data Manipulation Language (DML), and Transaction Control Language (TCL) activity.
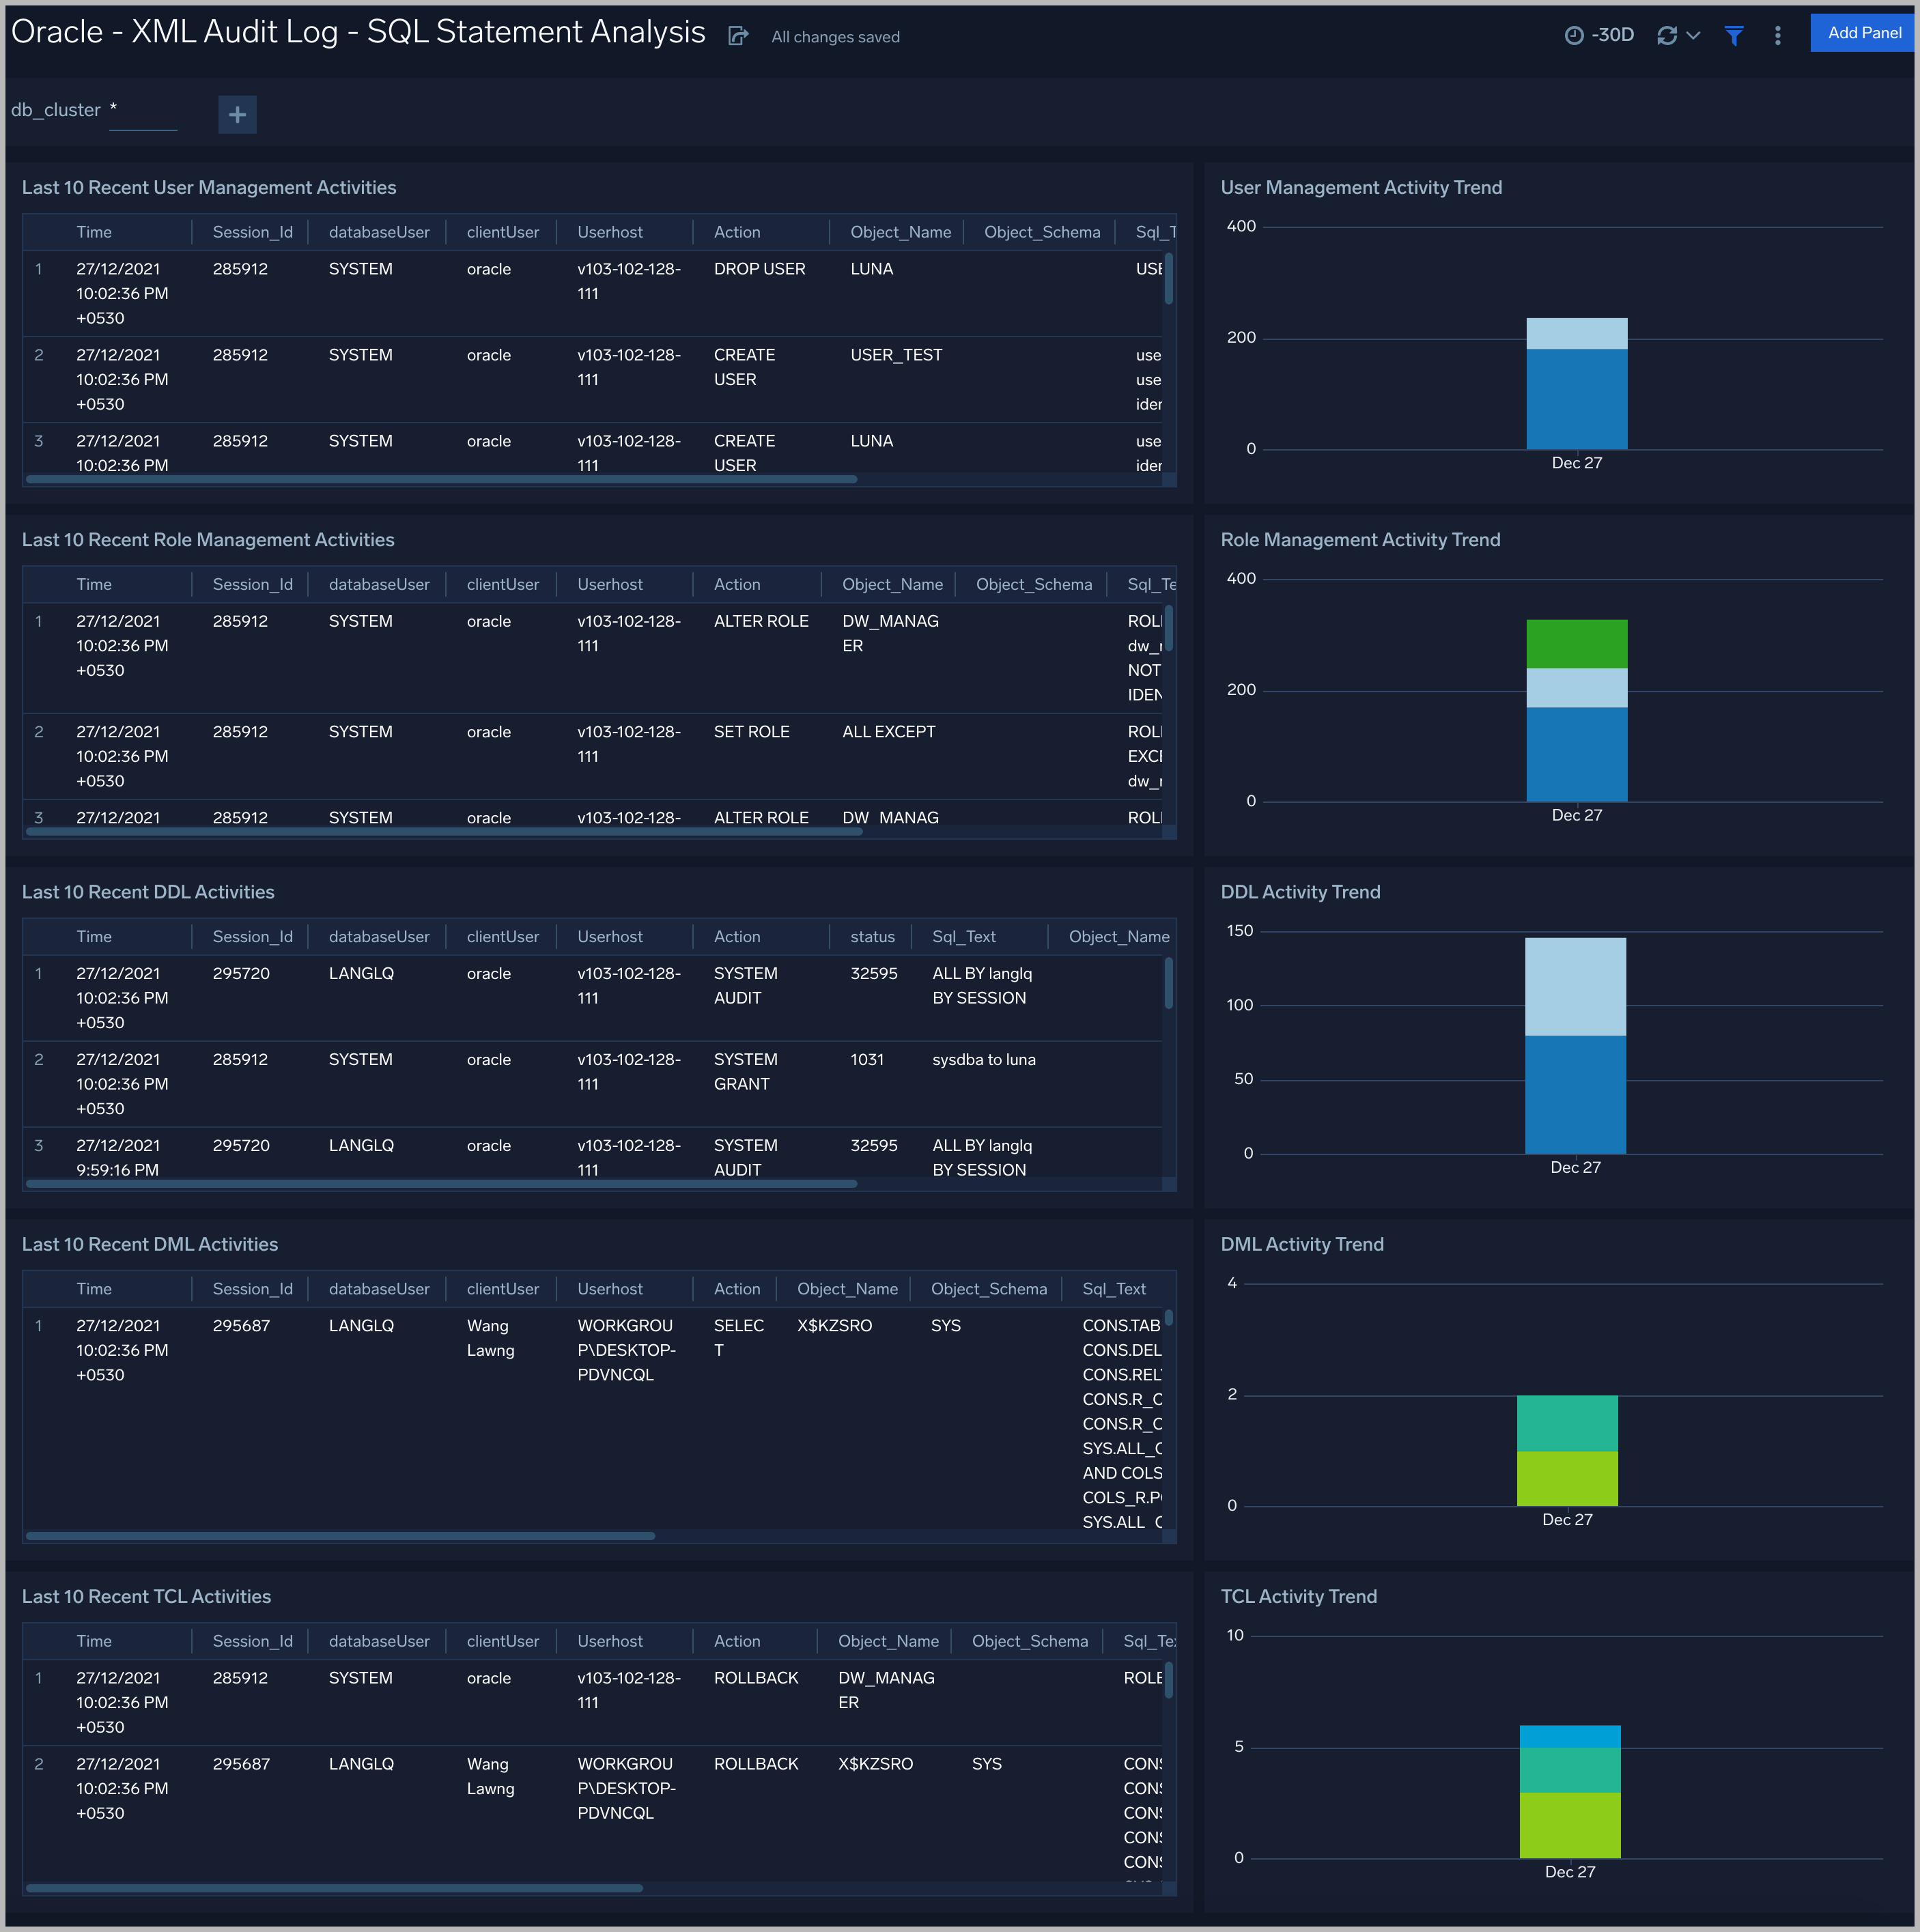
Recent User Management Activities. A table that lists information about user management activities in the previous 24 hours.
User Management Activity Trend. A stacked column chart that shows the count of user management actions by action type per one hour timeslice over the last 7 days.
Recent Role Management Activities. A table that lists information about role management activities in the previous 24 hours.
Role Management Activity Trend. A stacked column chart that shows the count of role management actions by action type per one hour timeslice over the last 7 days.
Recent DDL Activities. A table that lists information about Data Definition Language (DDL) activities in the previous 24 hours.
DDL Activity Trend. A stacked column chart that shows the count of DDL actions by action type per one hour timeslice over the last 7 days.
Recent DML Activities. A table that lists information about Data Manipulation Language (DML) activities in the previous 24 hours.
DML Activity Trend. DDL Activity Trend. A stacked column chart that shows the count of DML actions by action type per one hour timeslice over the last 7 days.
Recent TCL Activities. A table that lists information Transaction Control Language (TCL) activities in the previous 24 hours.
TCL Activity Trend. A stacked column chart that shows the count of DML actions by action type per one hour timeslice over the last 7 days.
Monitor Performance by DB Script
See database usage information obtained by the Oracle script source, including tablespace and datafile utilization; recent active connections; wait times; and recent jobs.
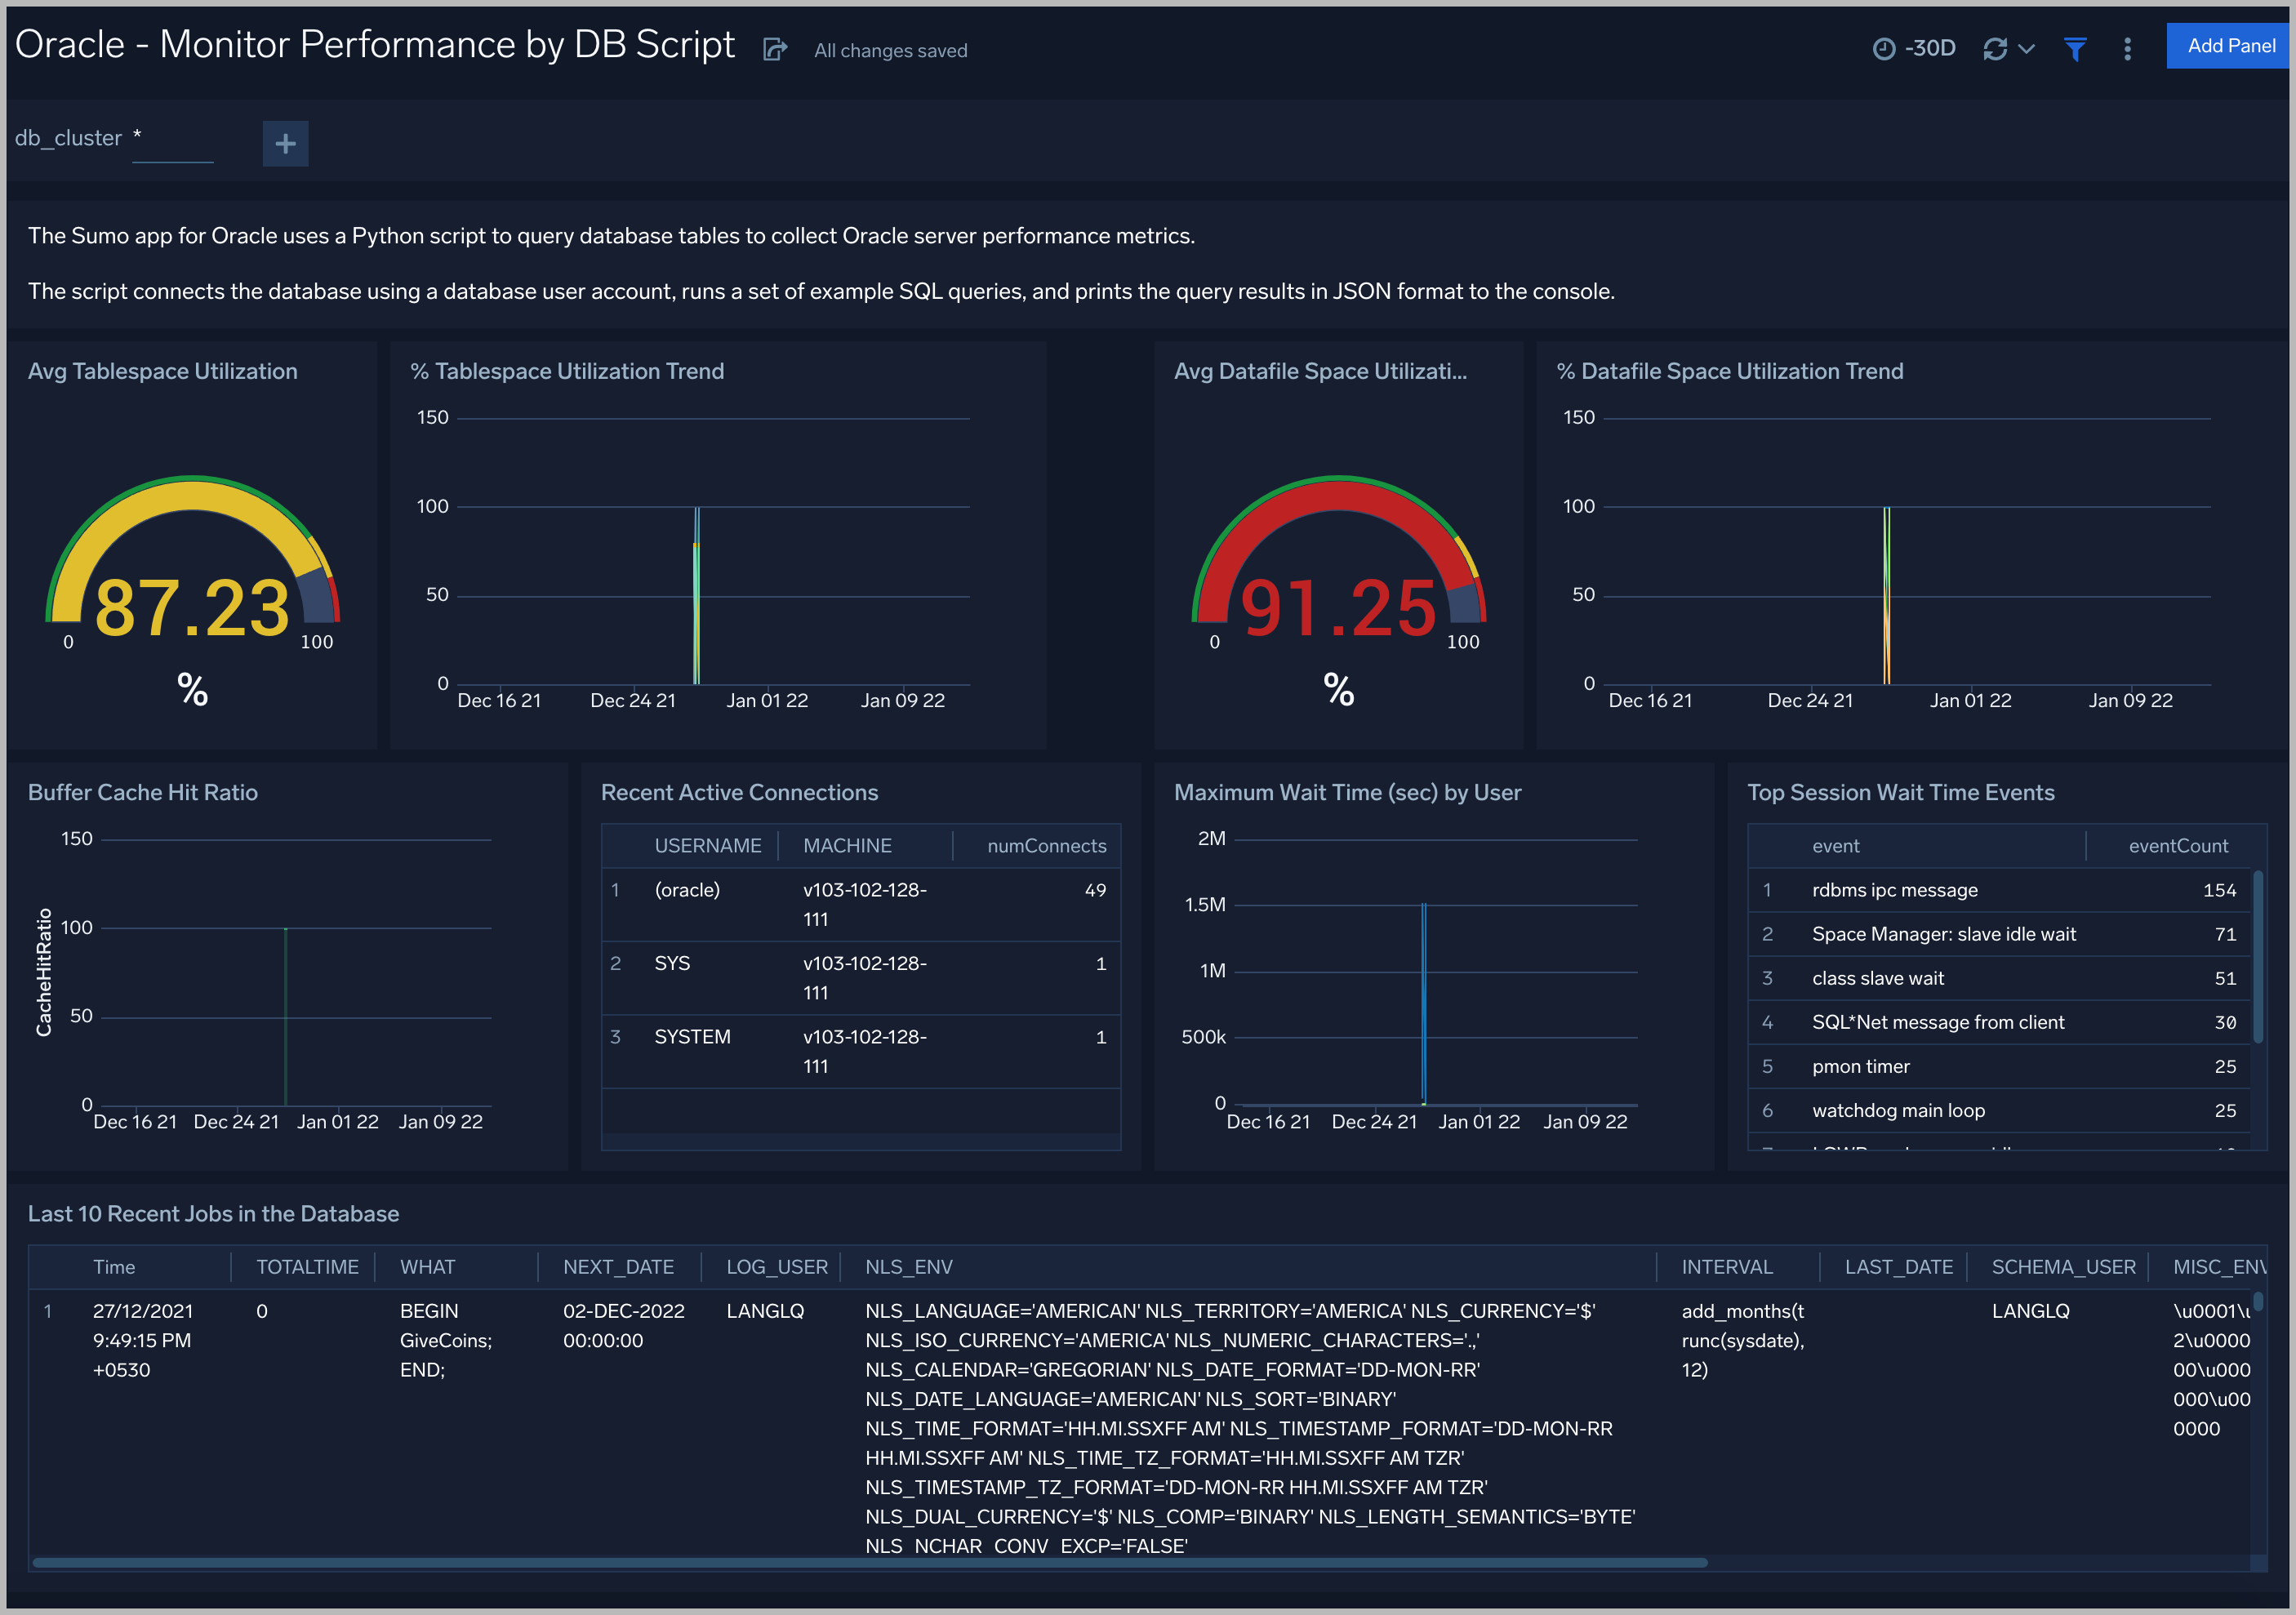
TableSpace Utilization. A table that shows, for each tablespace, the percentage of tablespace used for each 5 minute timeslice over the last 60 minutes.
TableSpace Utilization Trend. A line chart that shows, for each tablespace, the percentage of tablespace used over the last 24 hours.
Datafile Space Utilization. A table that shows, for each database file (.dbf), the percentage of allocated file space used for each 5 minute timeslice over the last 60 minutes.
Datafile Space Utilization Trend. A line chart that shows, for each database file (.dbf), the percentage of allocated file space used over the last 24 hours.
Buffer Cache Hit Ratio. An area chart that shows the buffer cache hit ratio for each 5 minute timeslice over the last 60 minutes.
Recent Active Connections. A table of information about recent active connections, including the user, machine, and number of connections.
Maximum Wait Time (sec) by User. A line chart that shows, for each user, the session wait times for each 5 minute timeslice over the last 60 minutes.
Top Session Wait Time Events. A table that shows the top 10 event types associated with session waits, and the count of each event type.
Recent Jobs in the database. A table of information about recent database jobs, including when each job ran, low long it ran, and when it will next run.
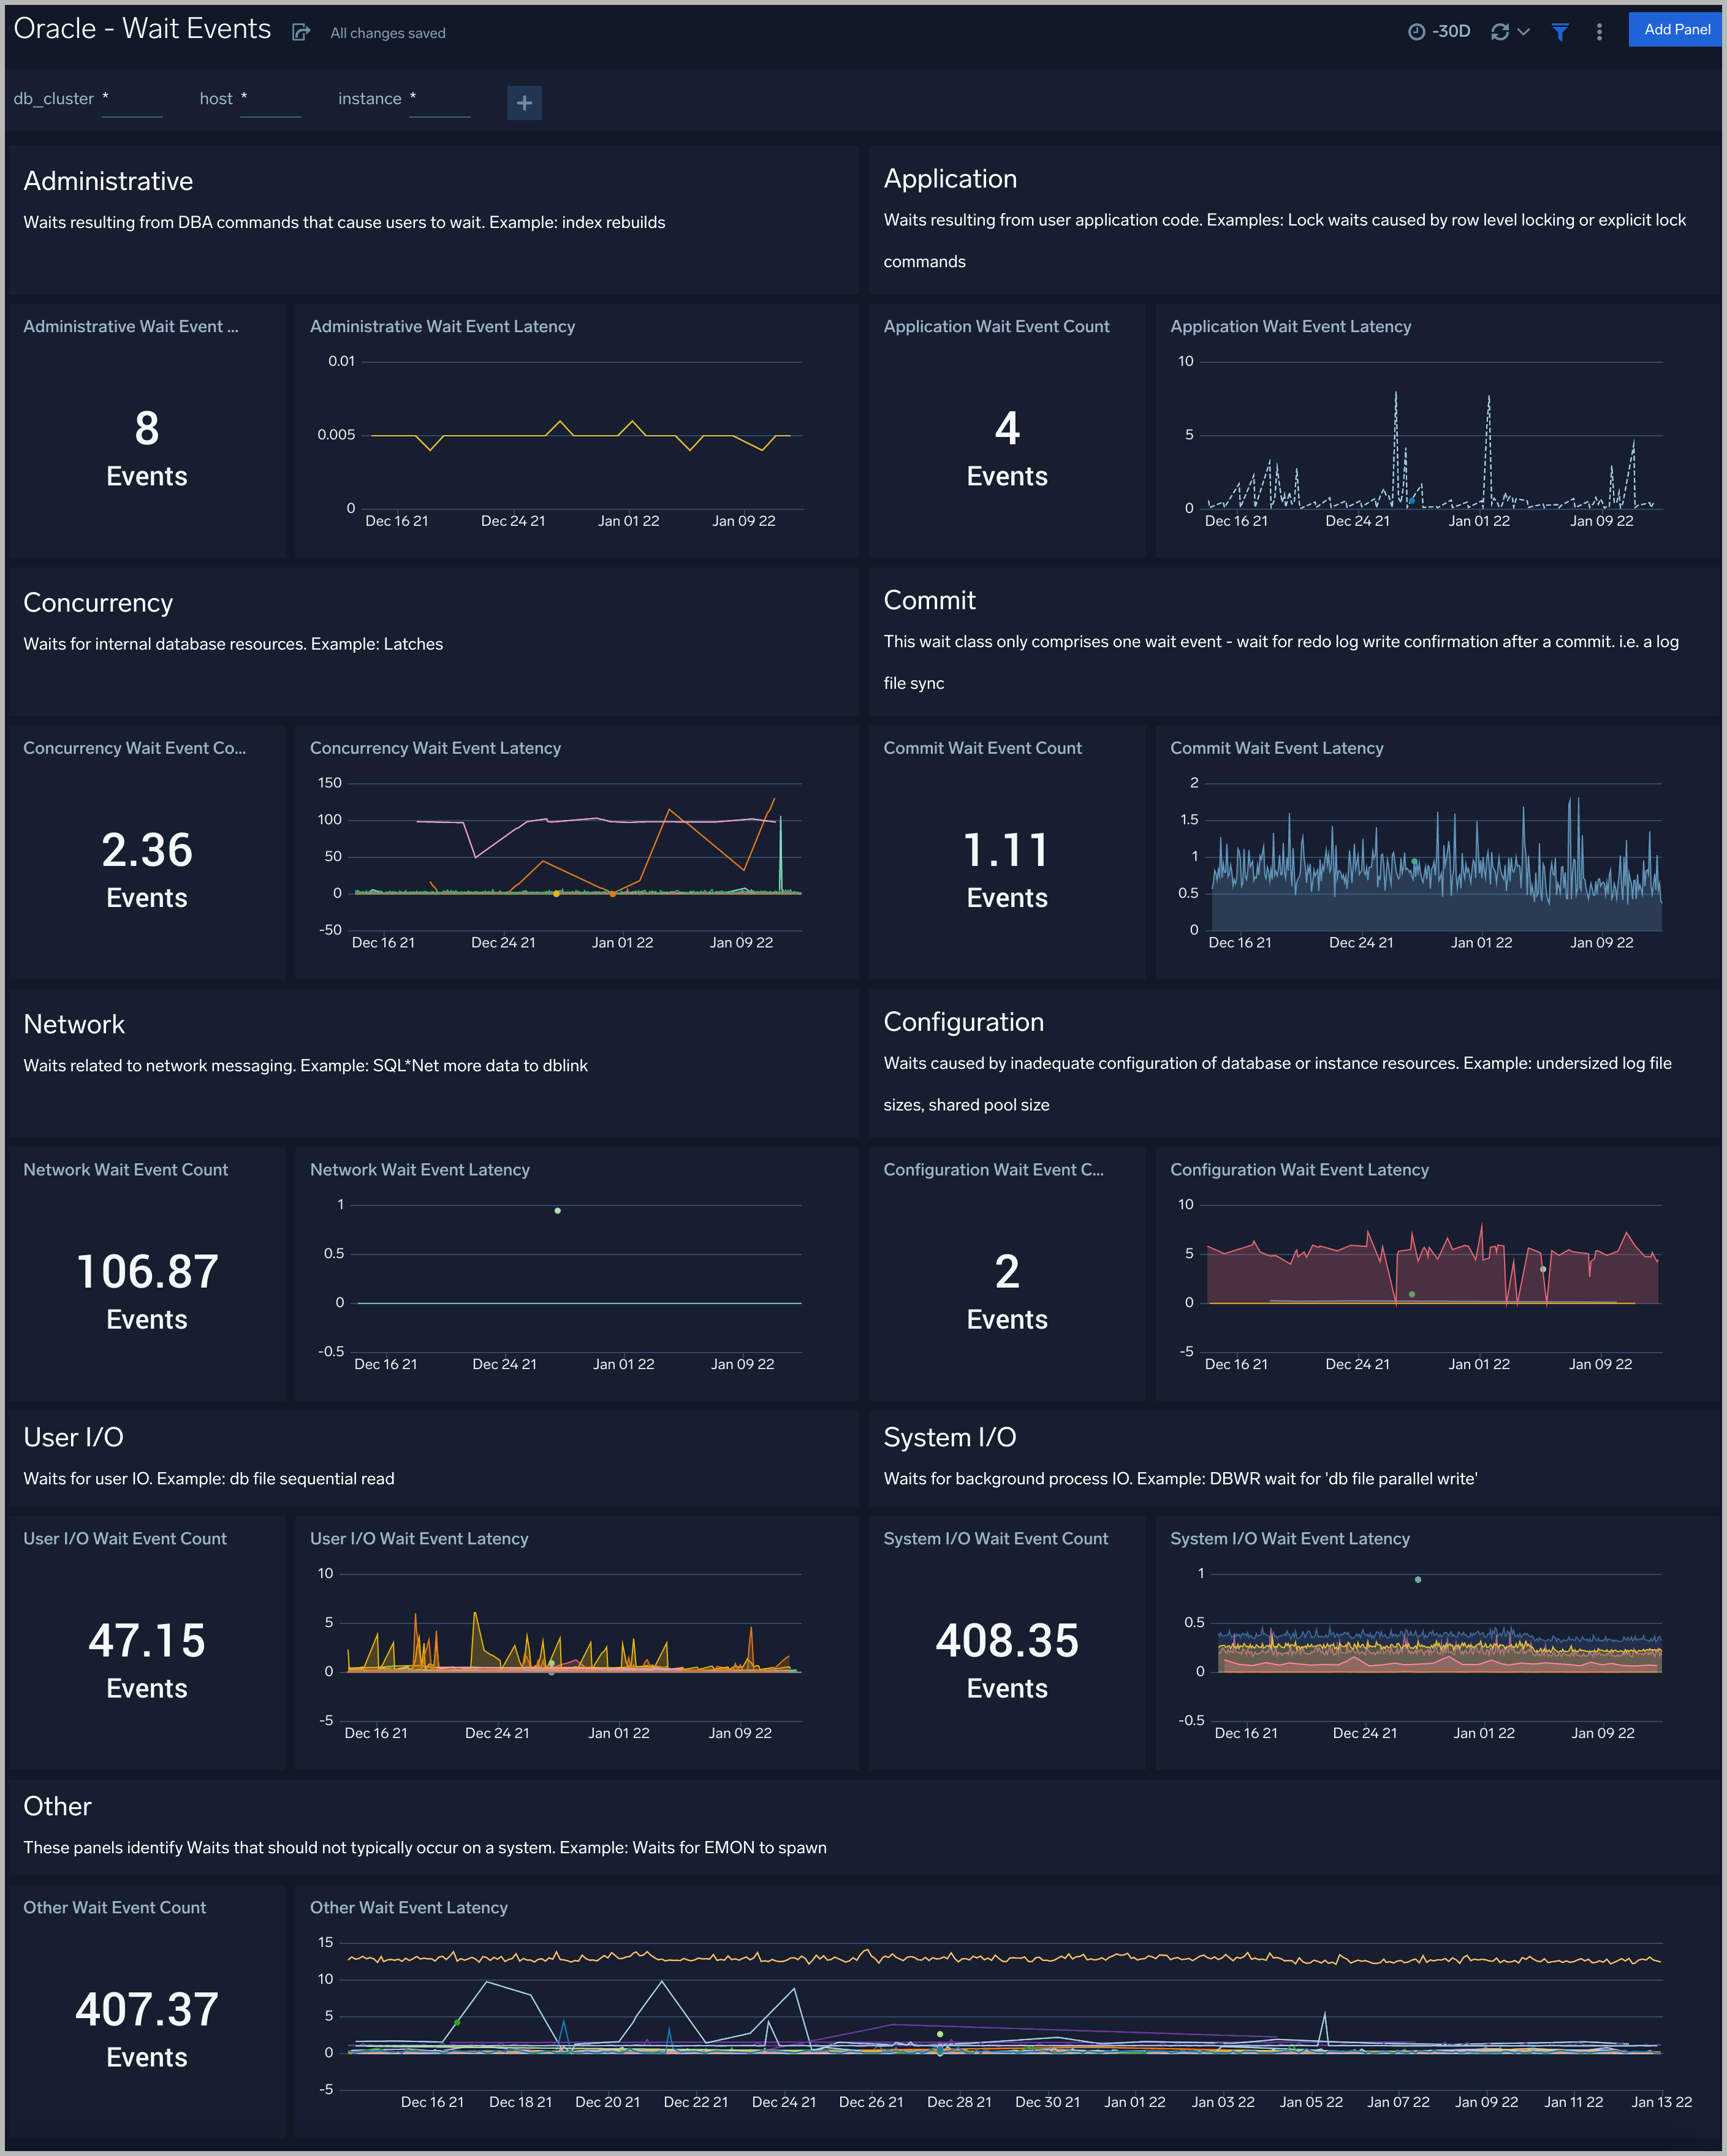
Wait Events
Every wait event belongs to a class of wait events. The following list describes each of the wait classes.
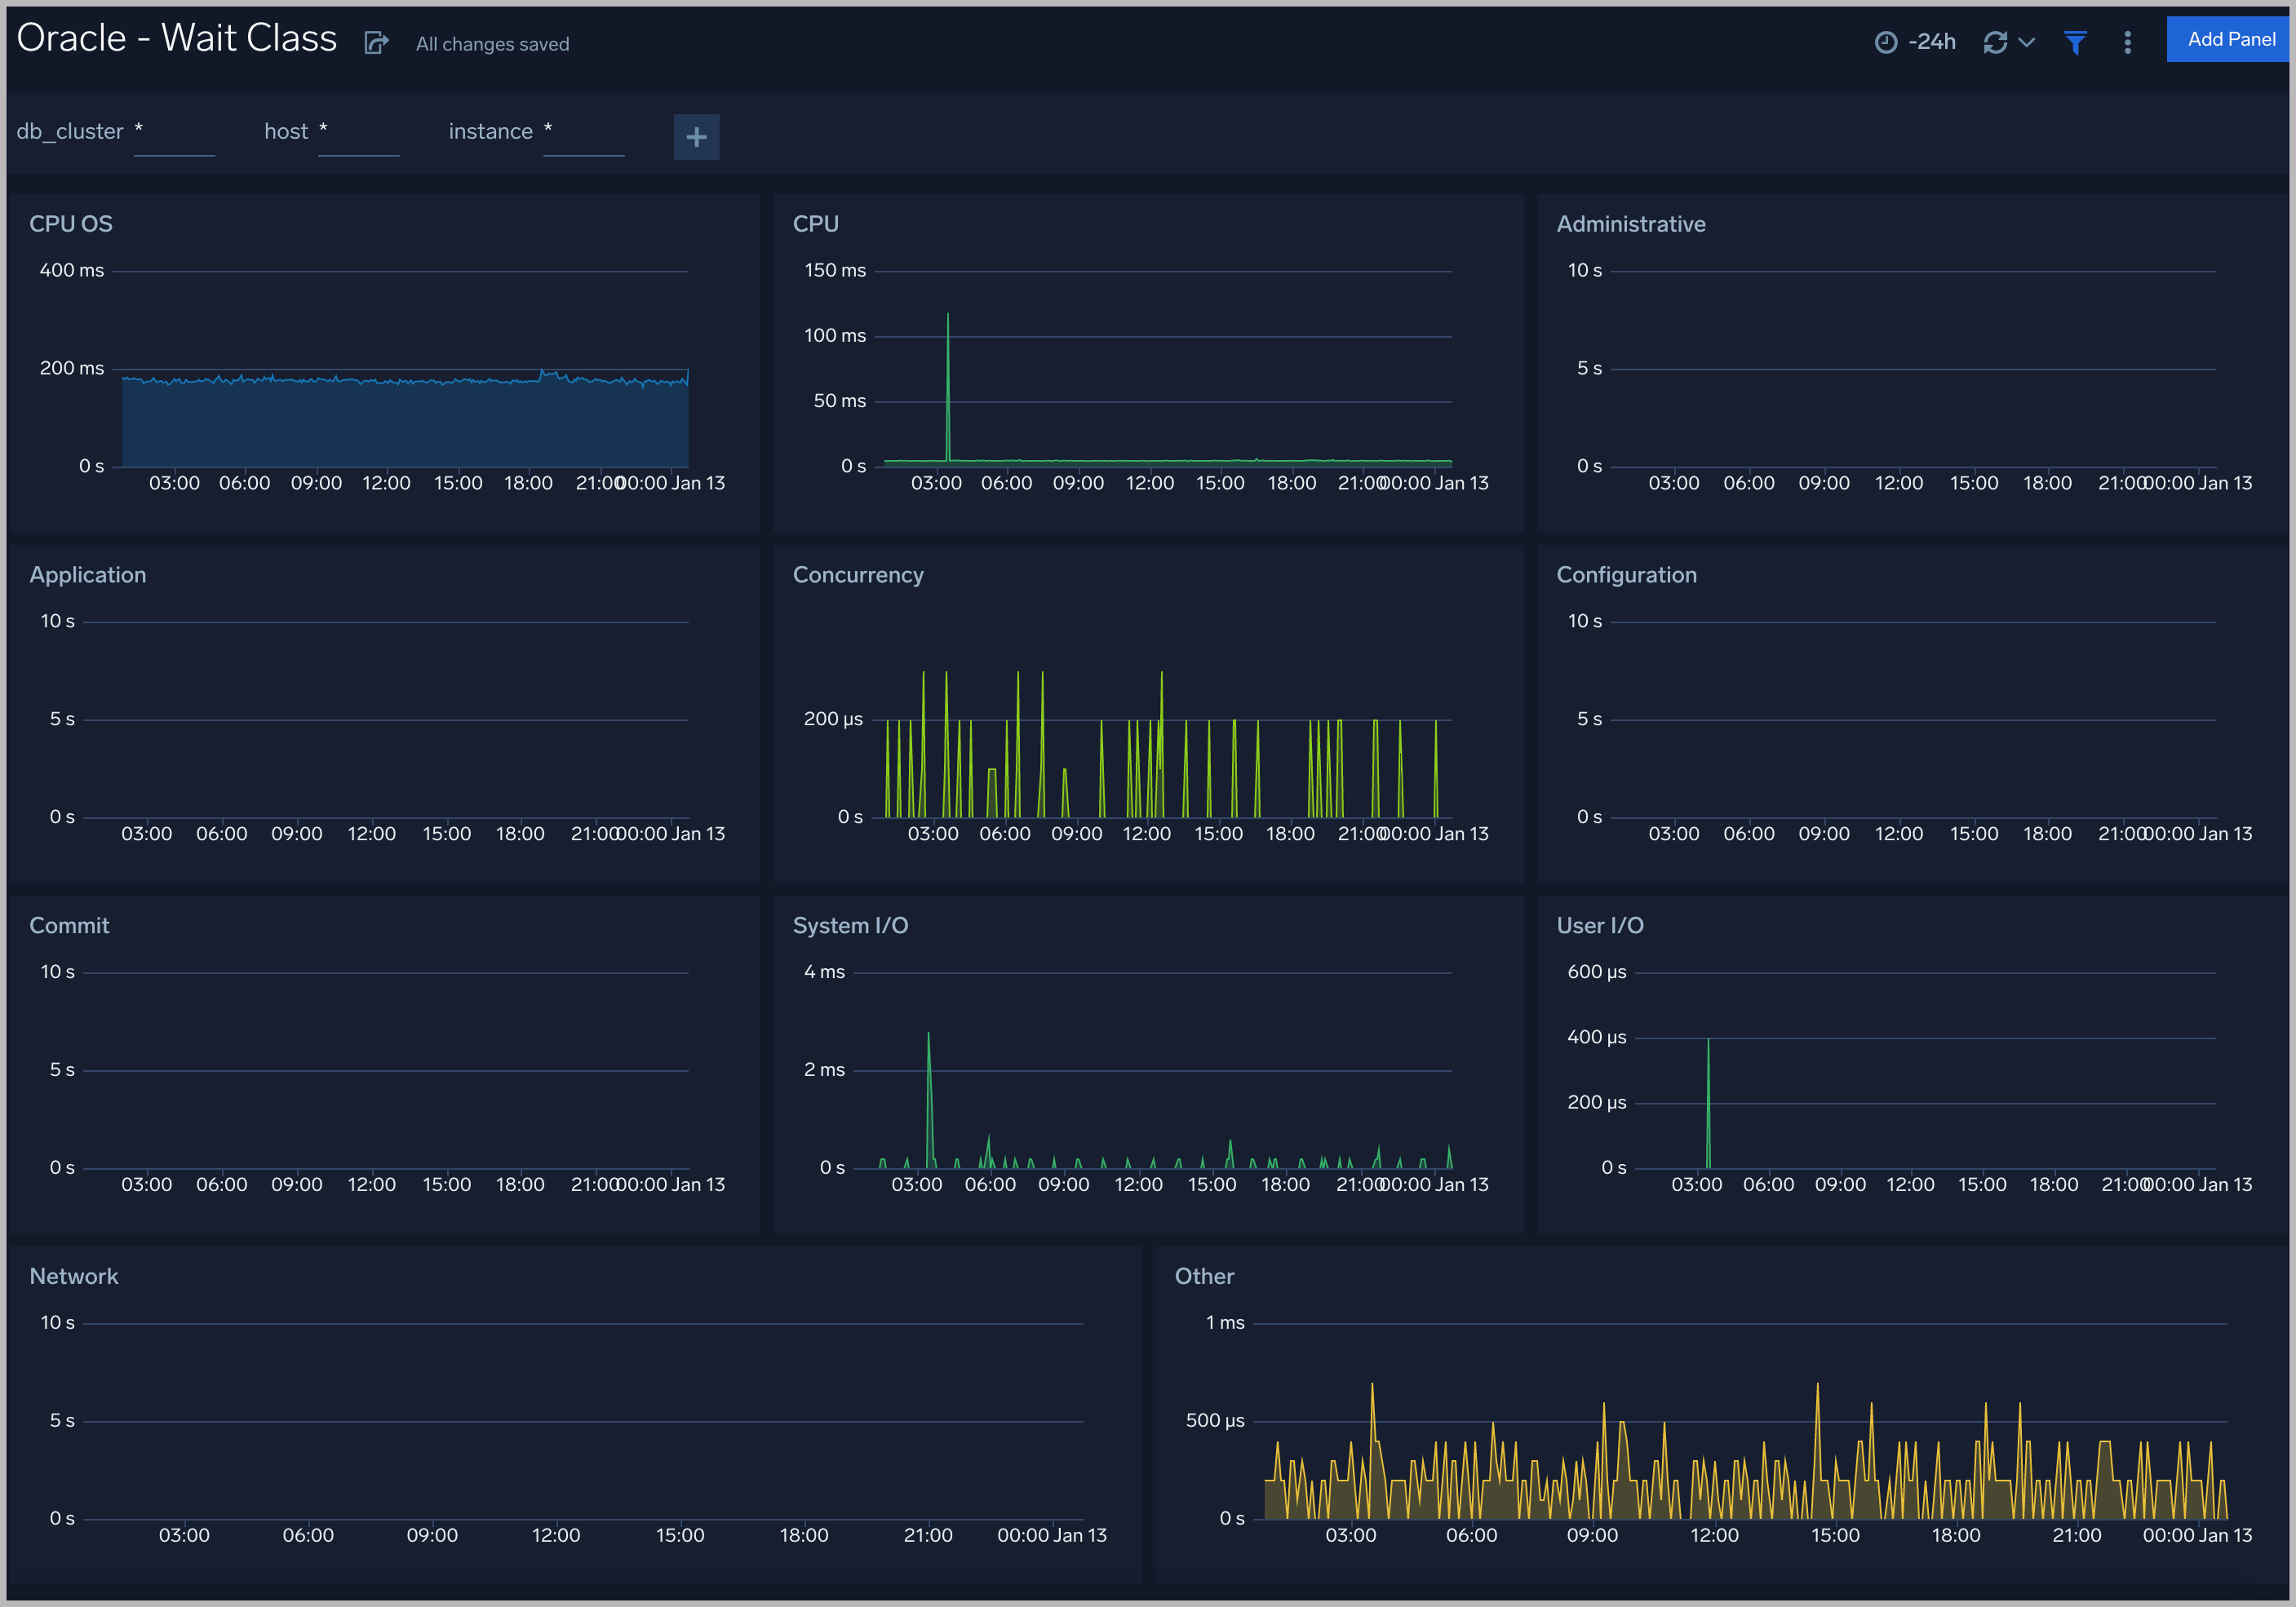
Wait Class
All the wait events are grouped under wait classes and here are the most important wait classes you must know: Administrative, Application, Commit, Concurrency, Configuration, Idle, Network, Other, System I/O, User I/O.
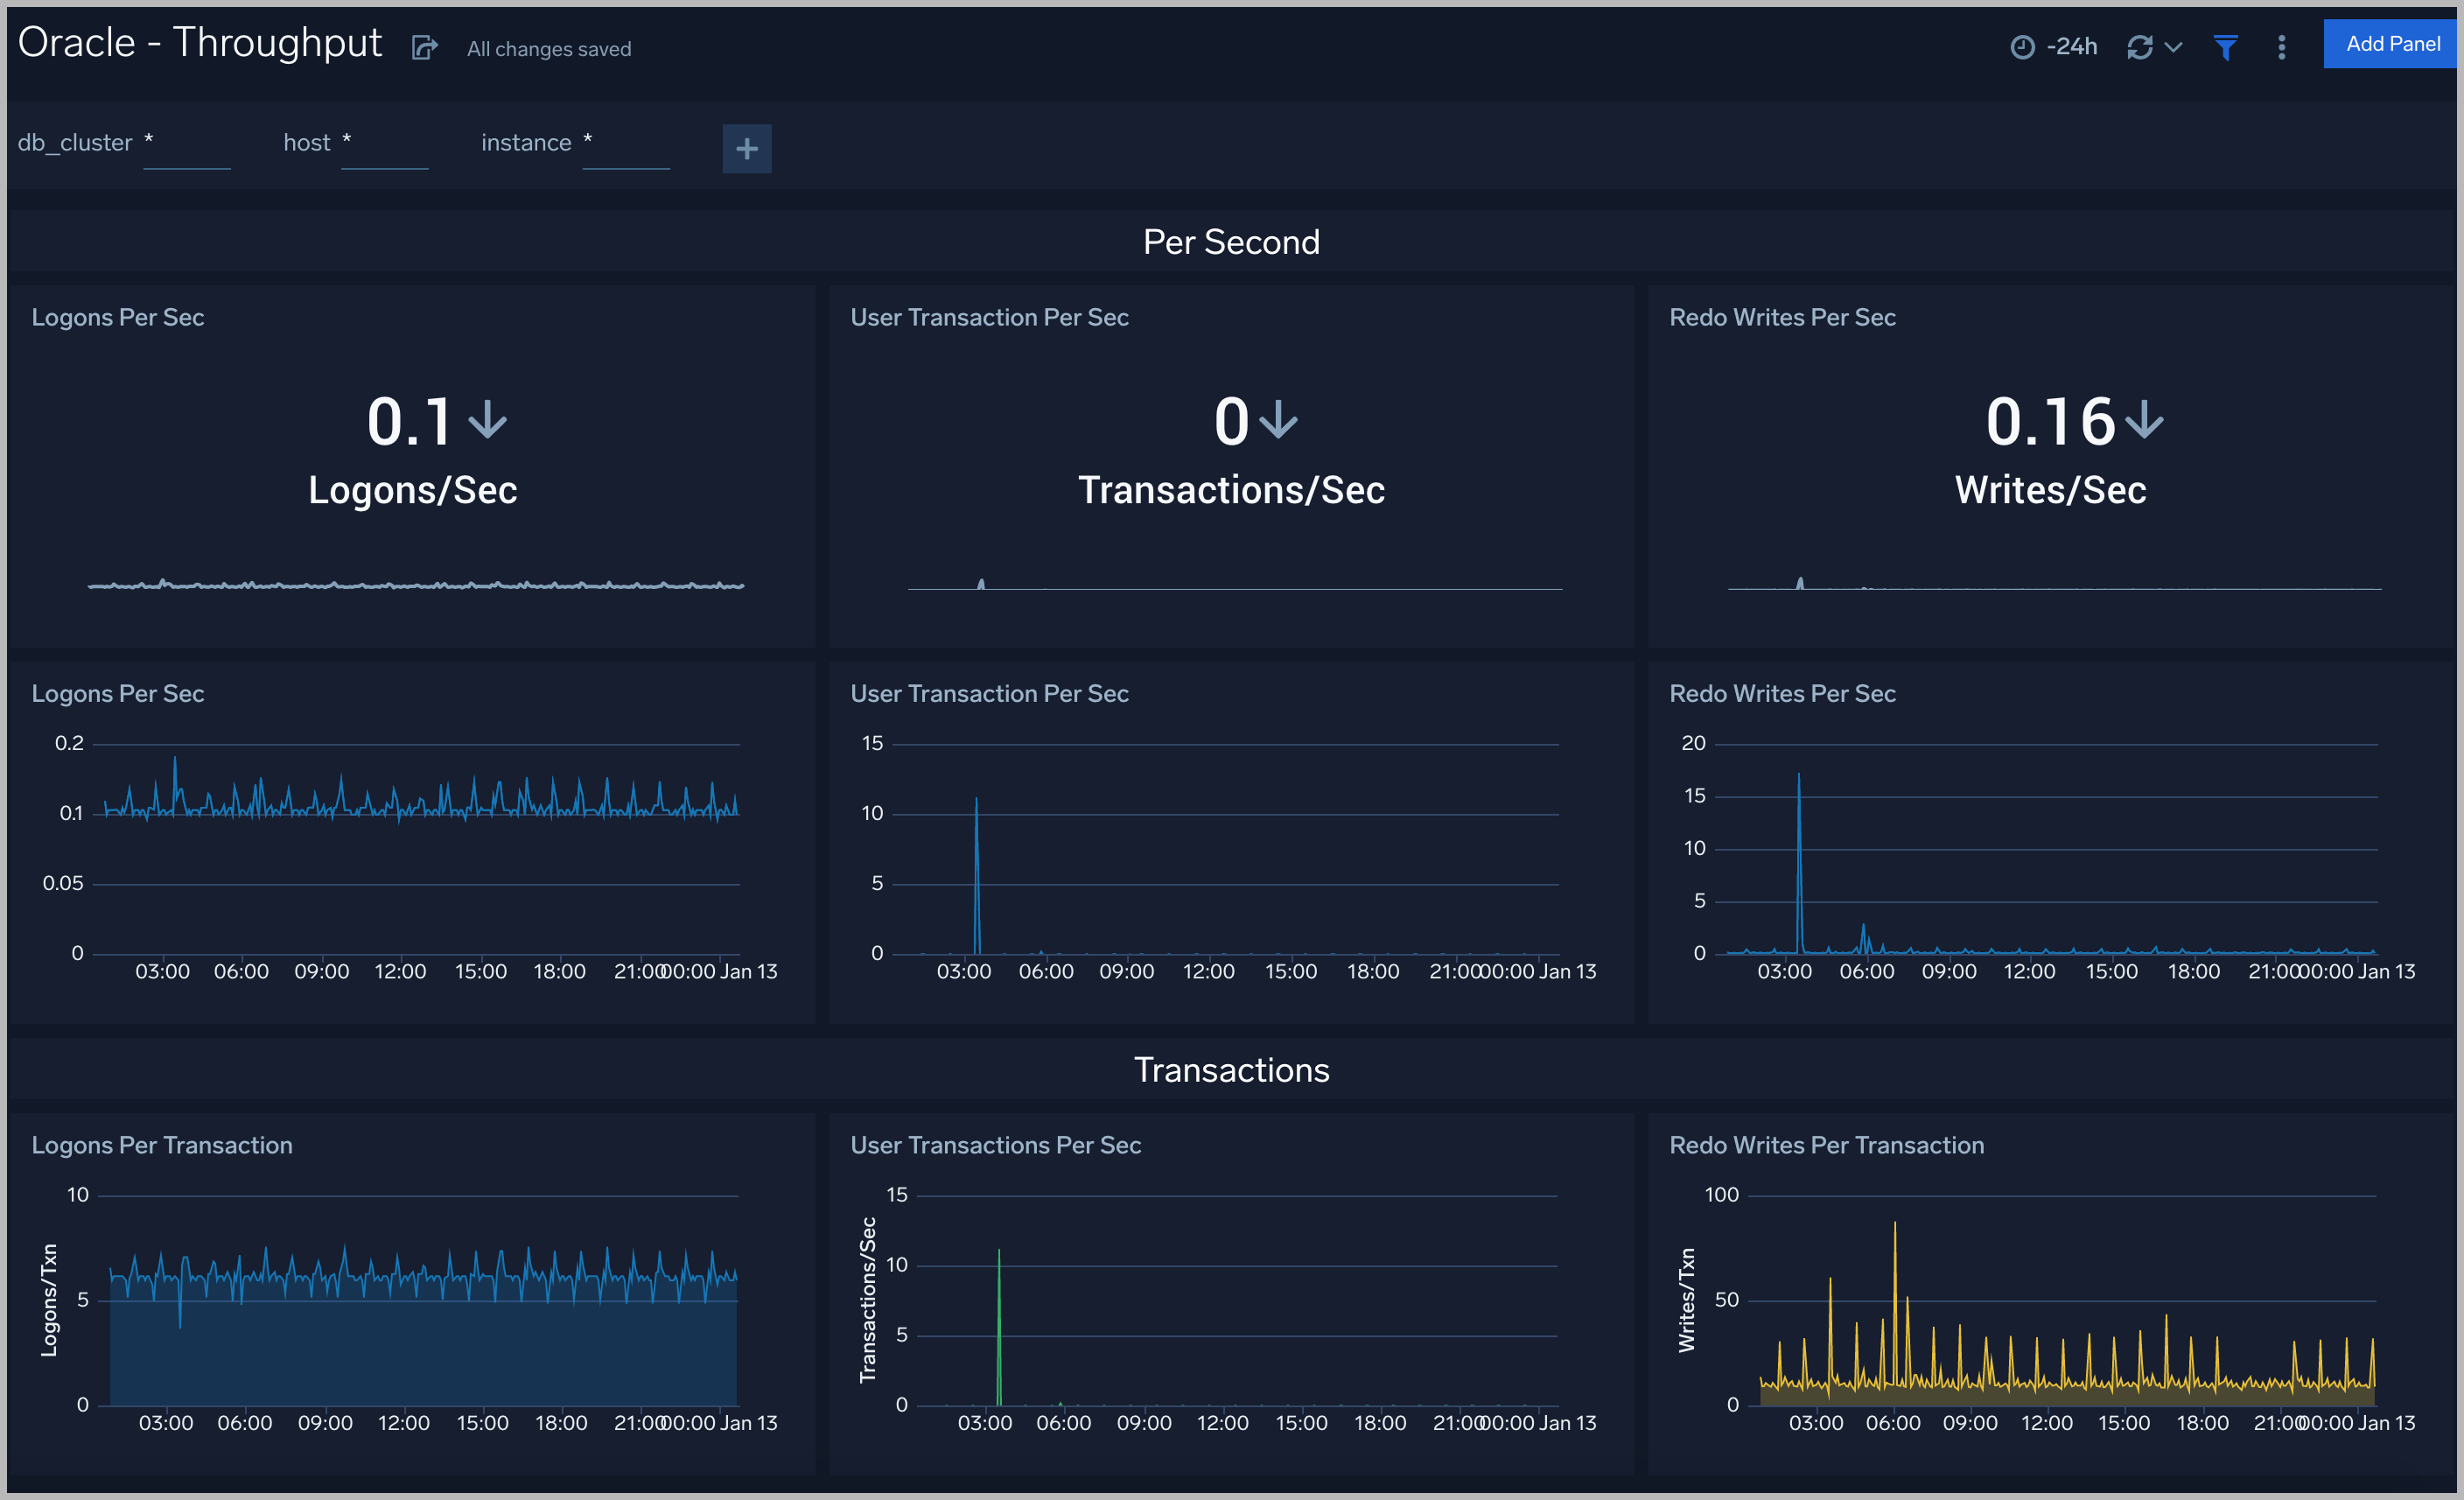
Throughput
The Oracle - Throughput dashboard provides an at-a-glance view of the state of system loads in clusters: Logon, Transaction, and Redo.
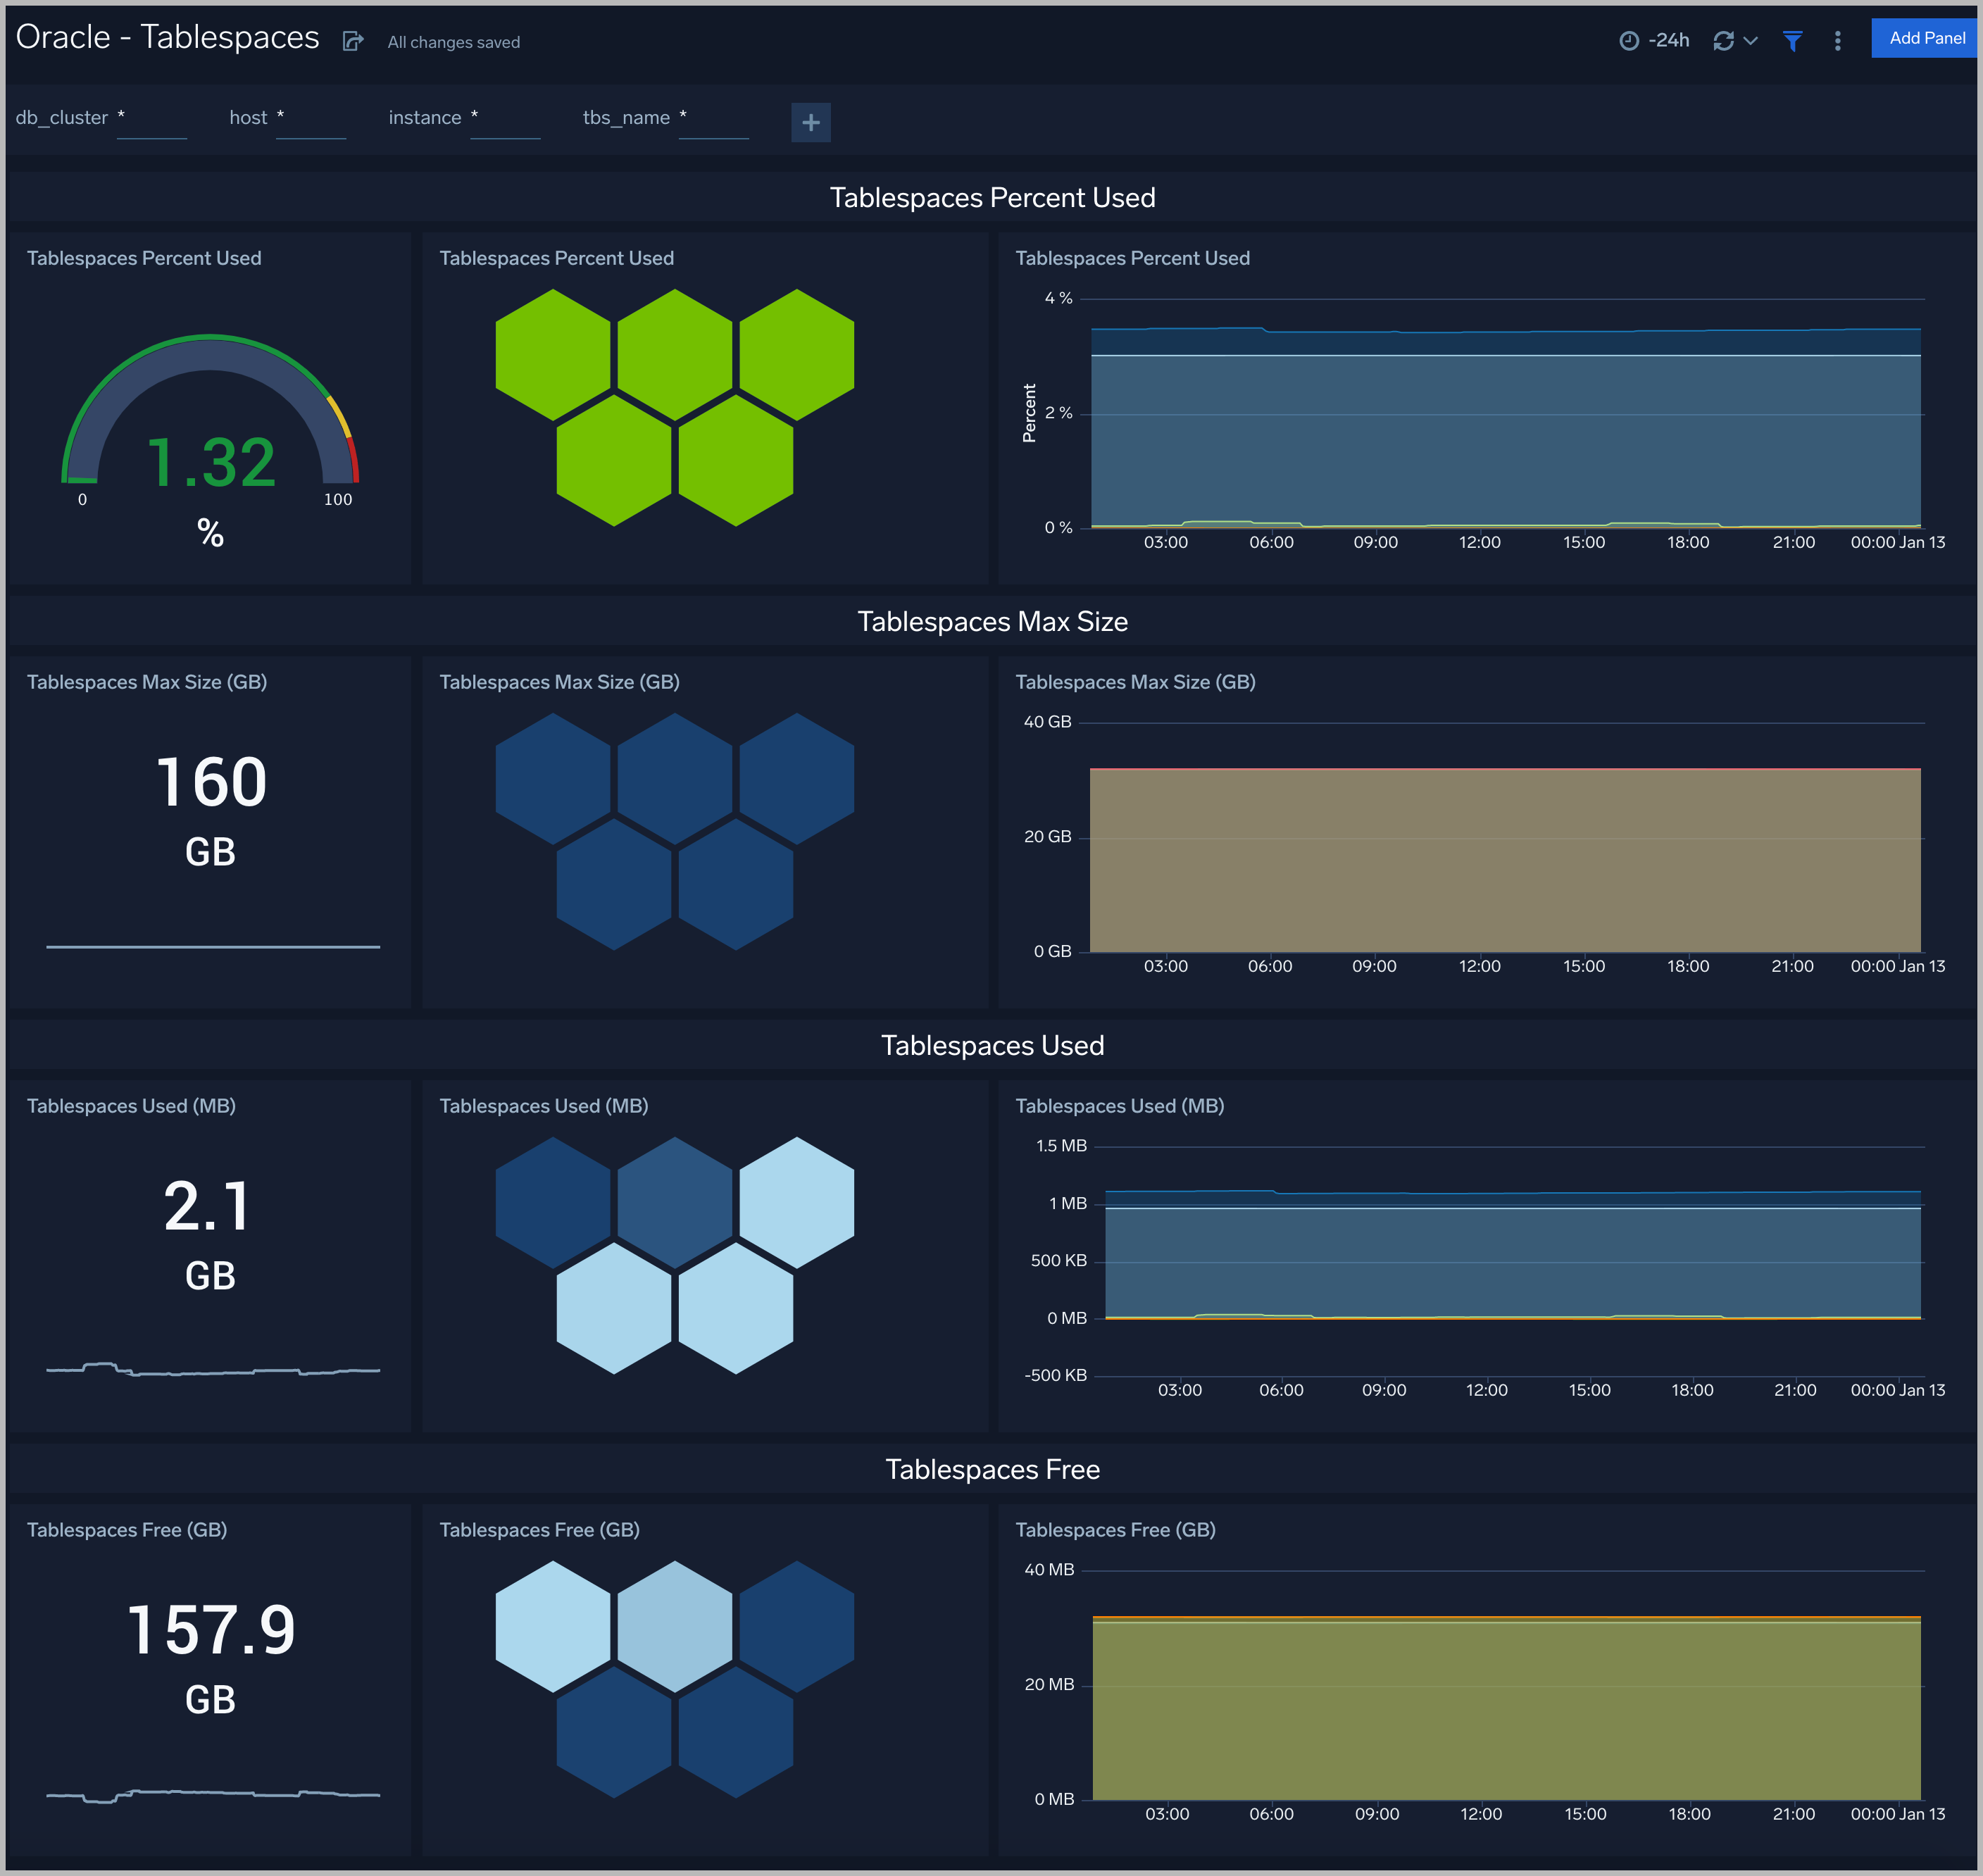
Tablespaces
The Oracle - Tablespaces dashboard provides an at-a-glance view of the tablespaces in clusters: Percent Used, Max size, Size Used, and Free.
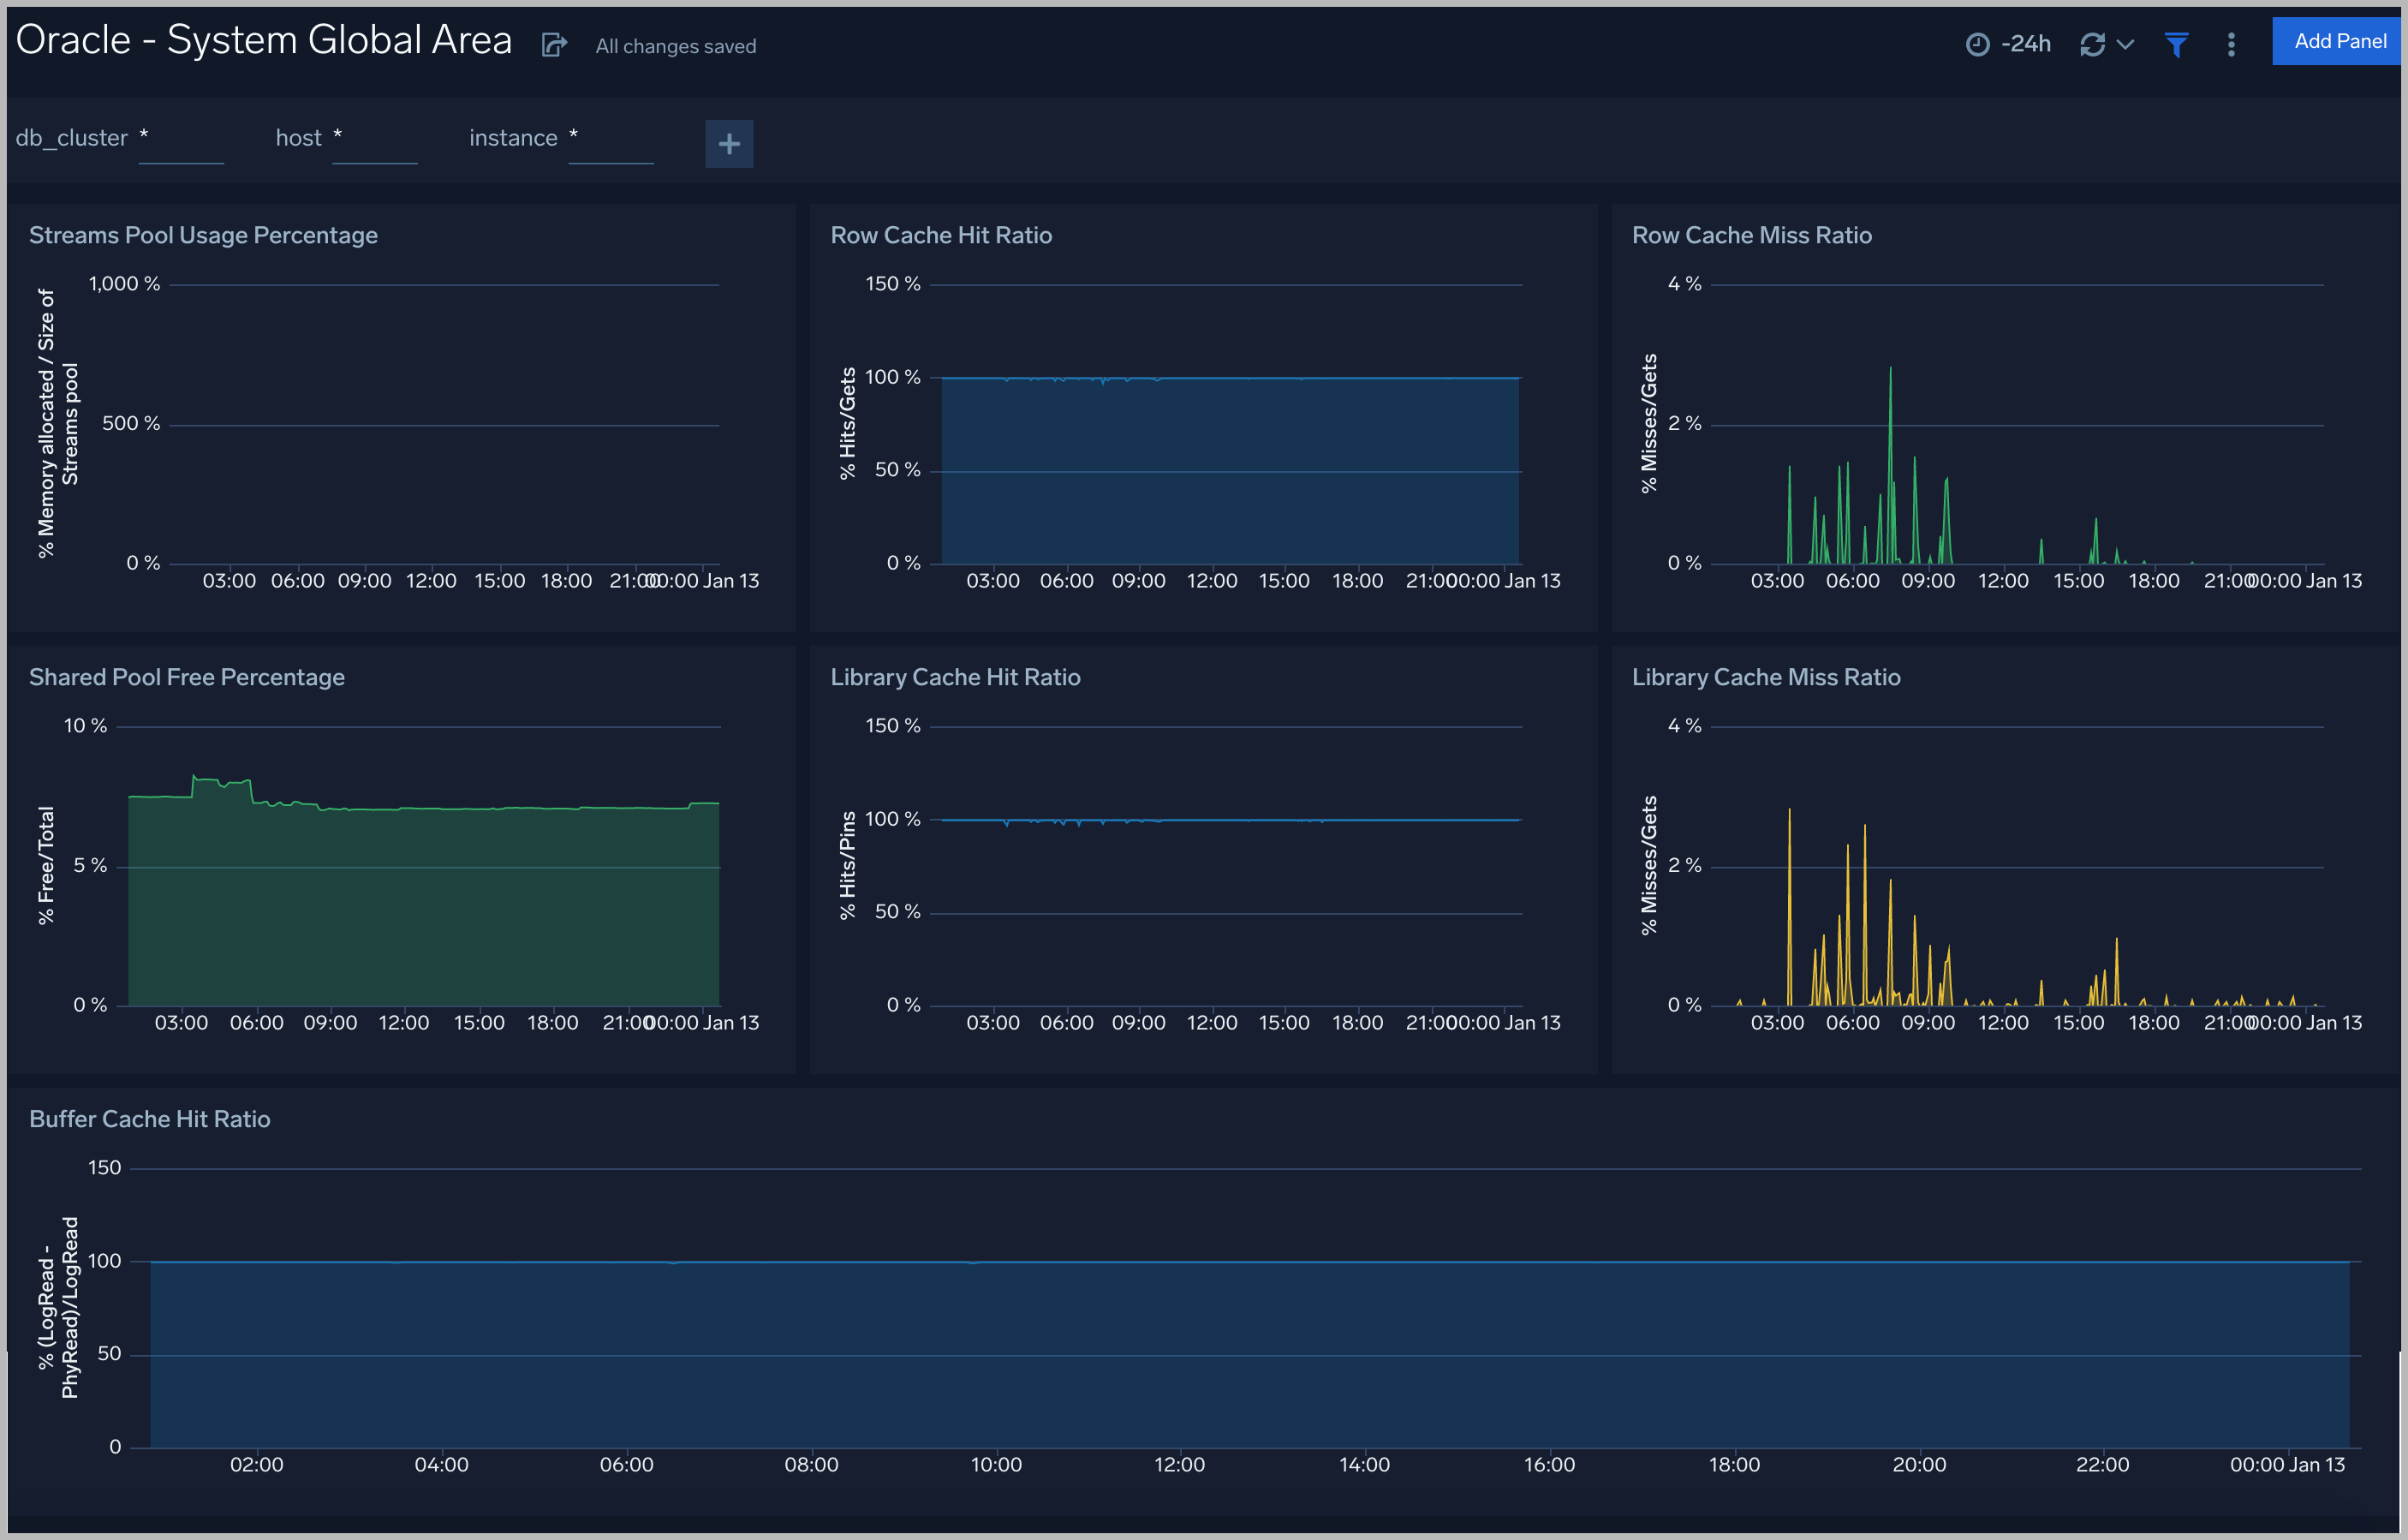
System Global Area
The Oracle - System Global Area dashboard provides an at-a-glance view of a group of shared memory structures, known as SGA components, that contain data and control information for one Oracle Database instance.
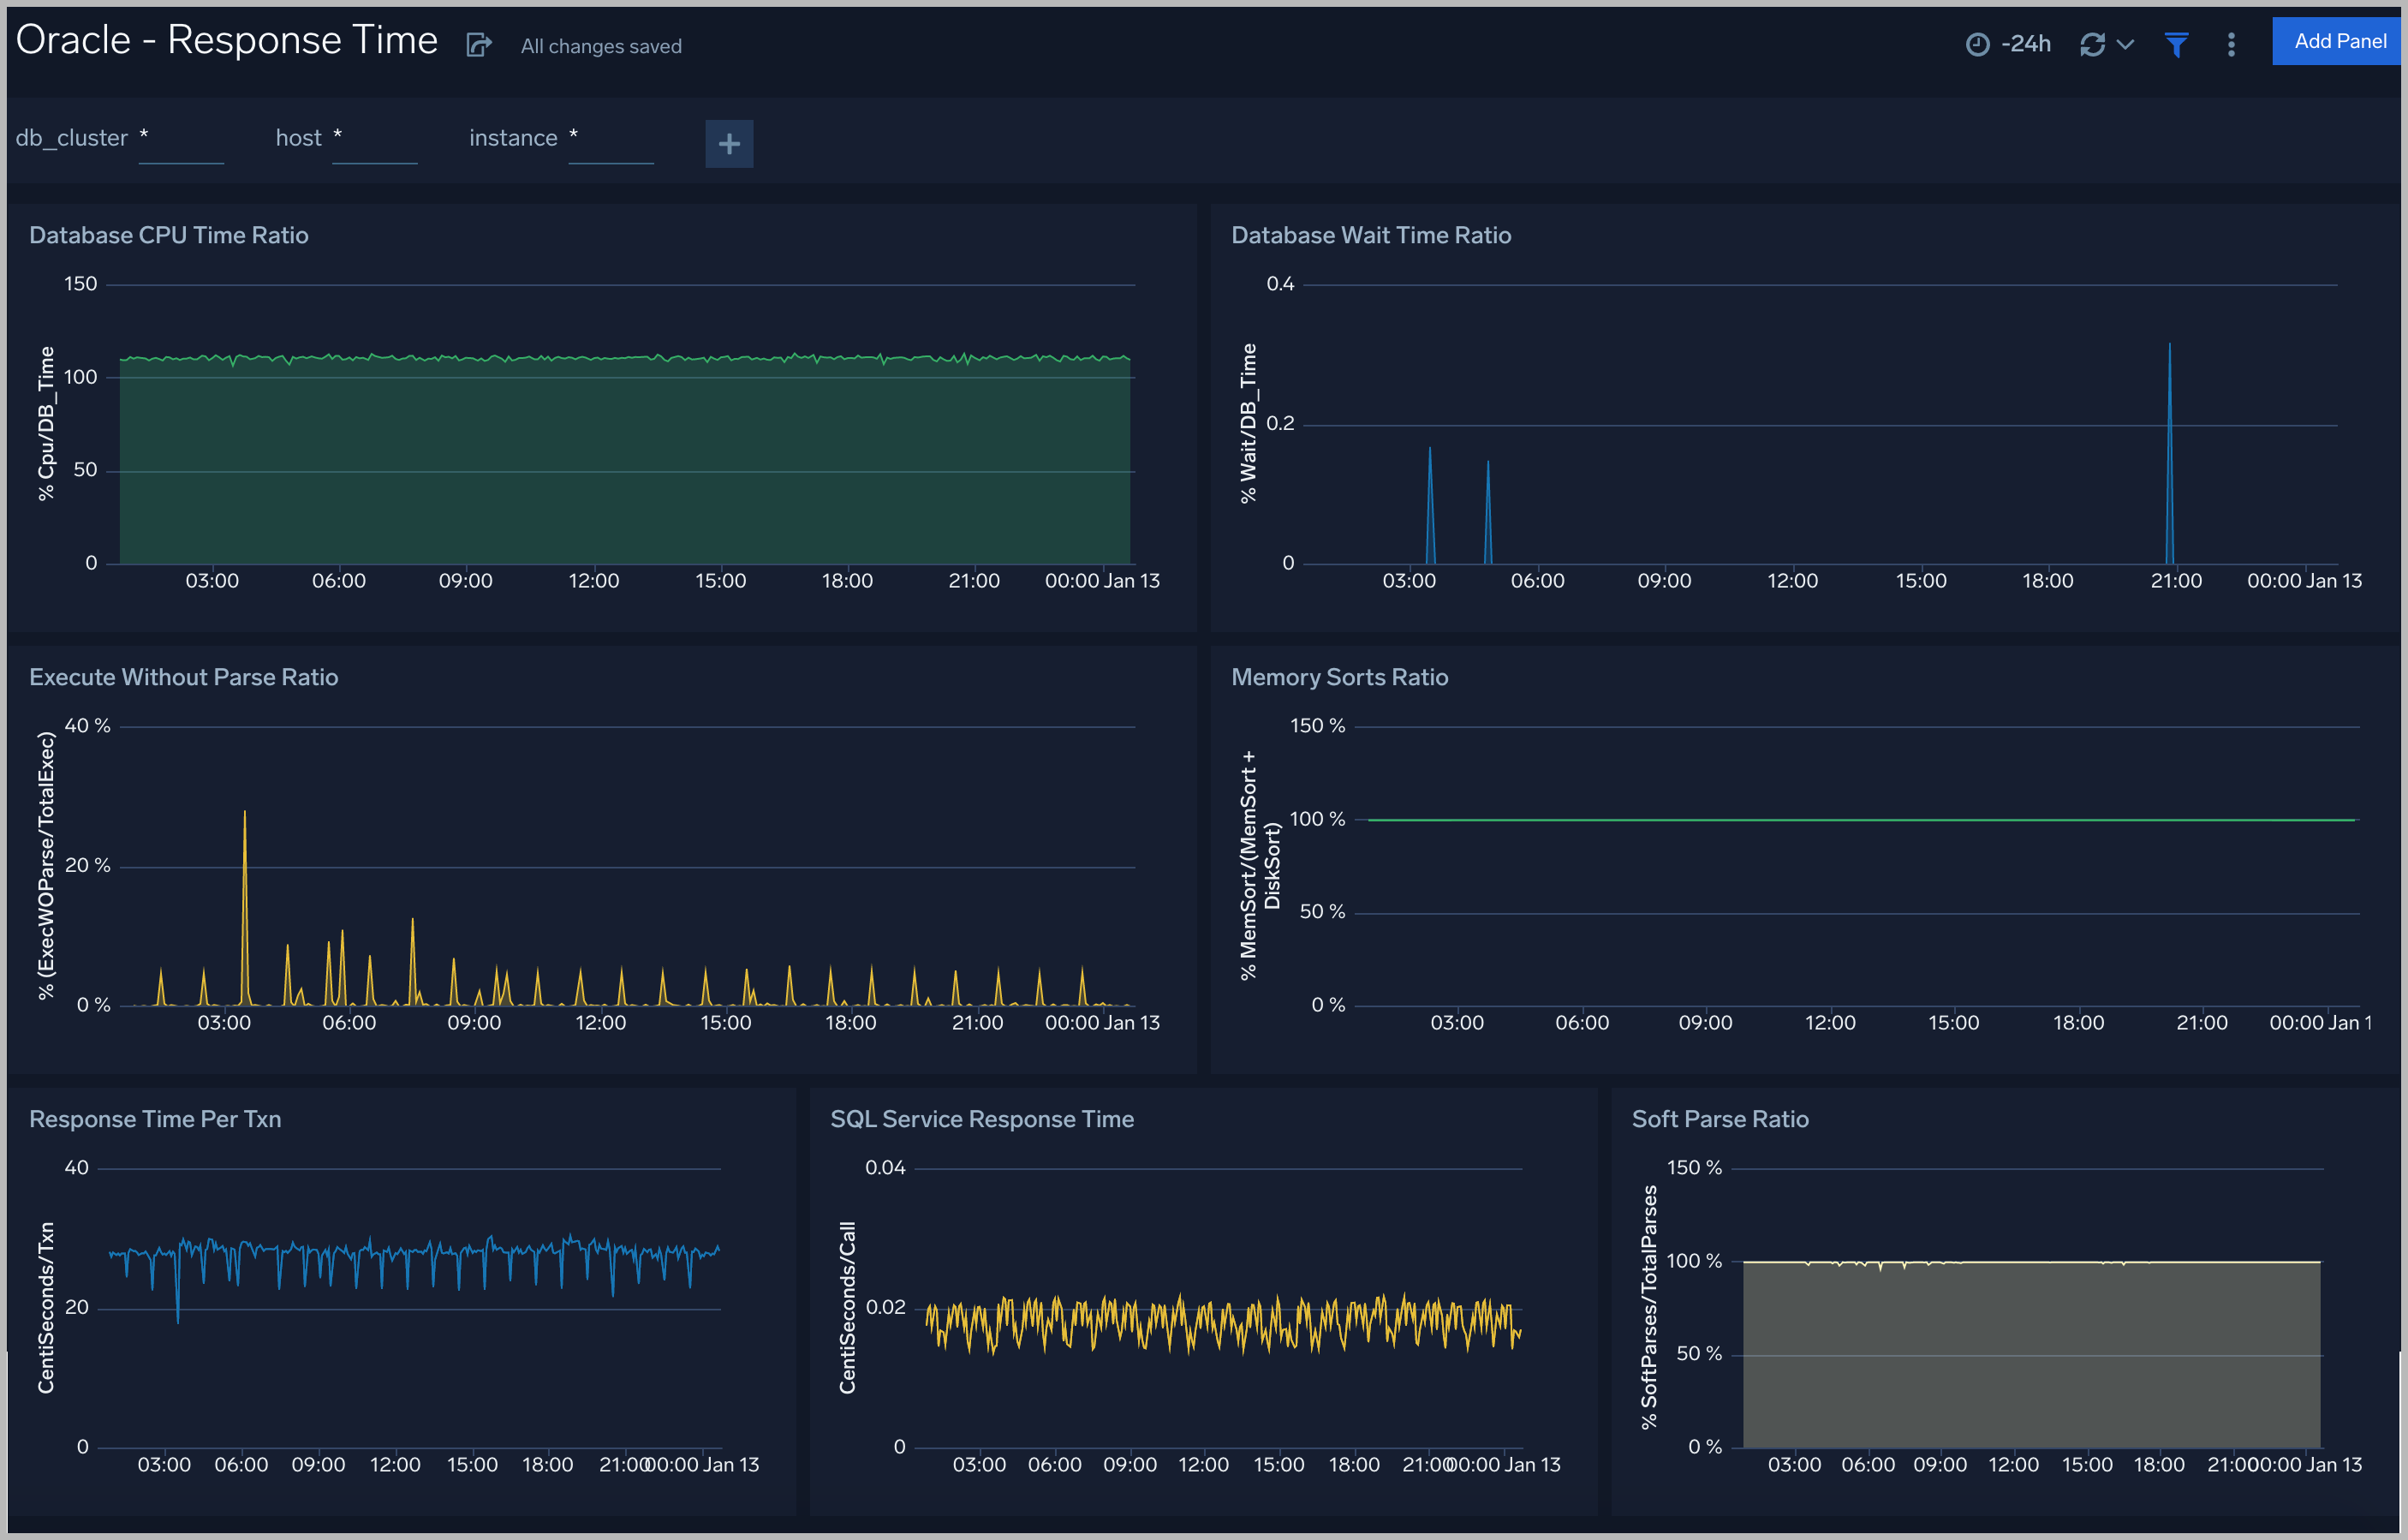
Response Time
The Oracle - Response dashboard performance statistics such as database CPU Time, Wait Time Ratio, Response time, Soft Parse Radio, and Execute
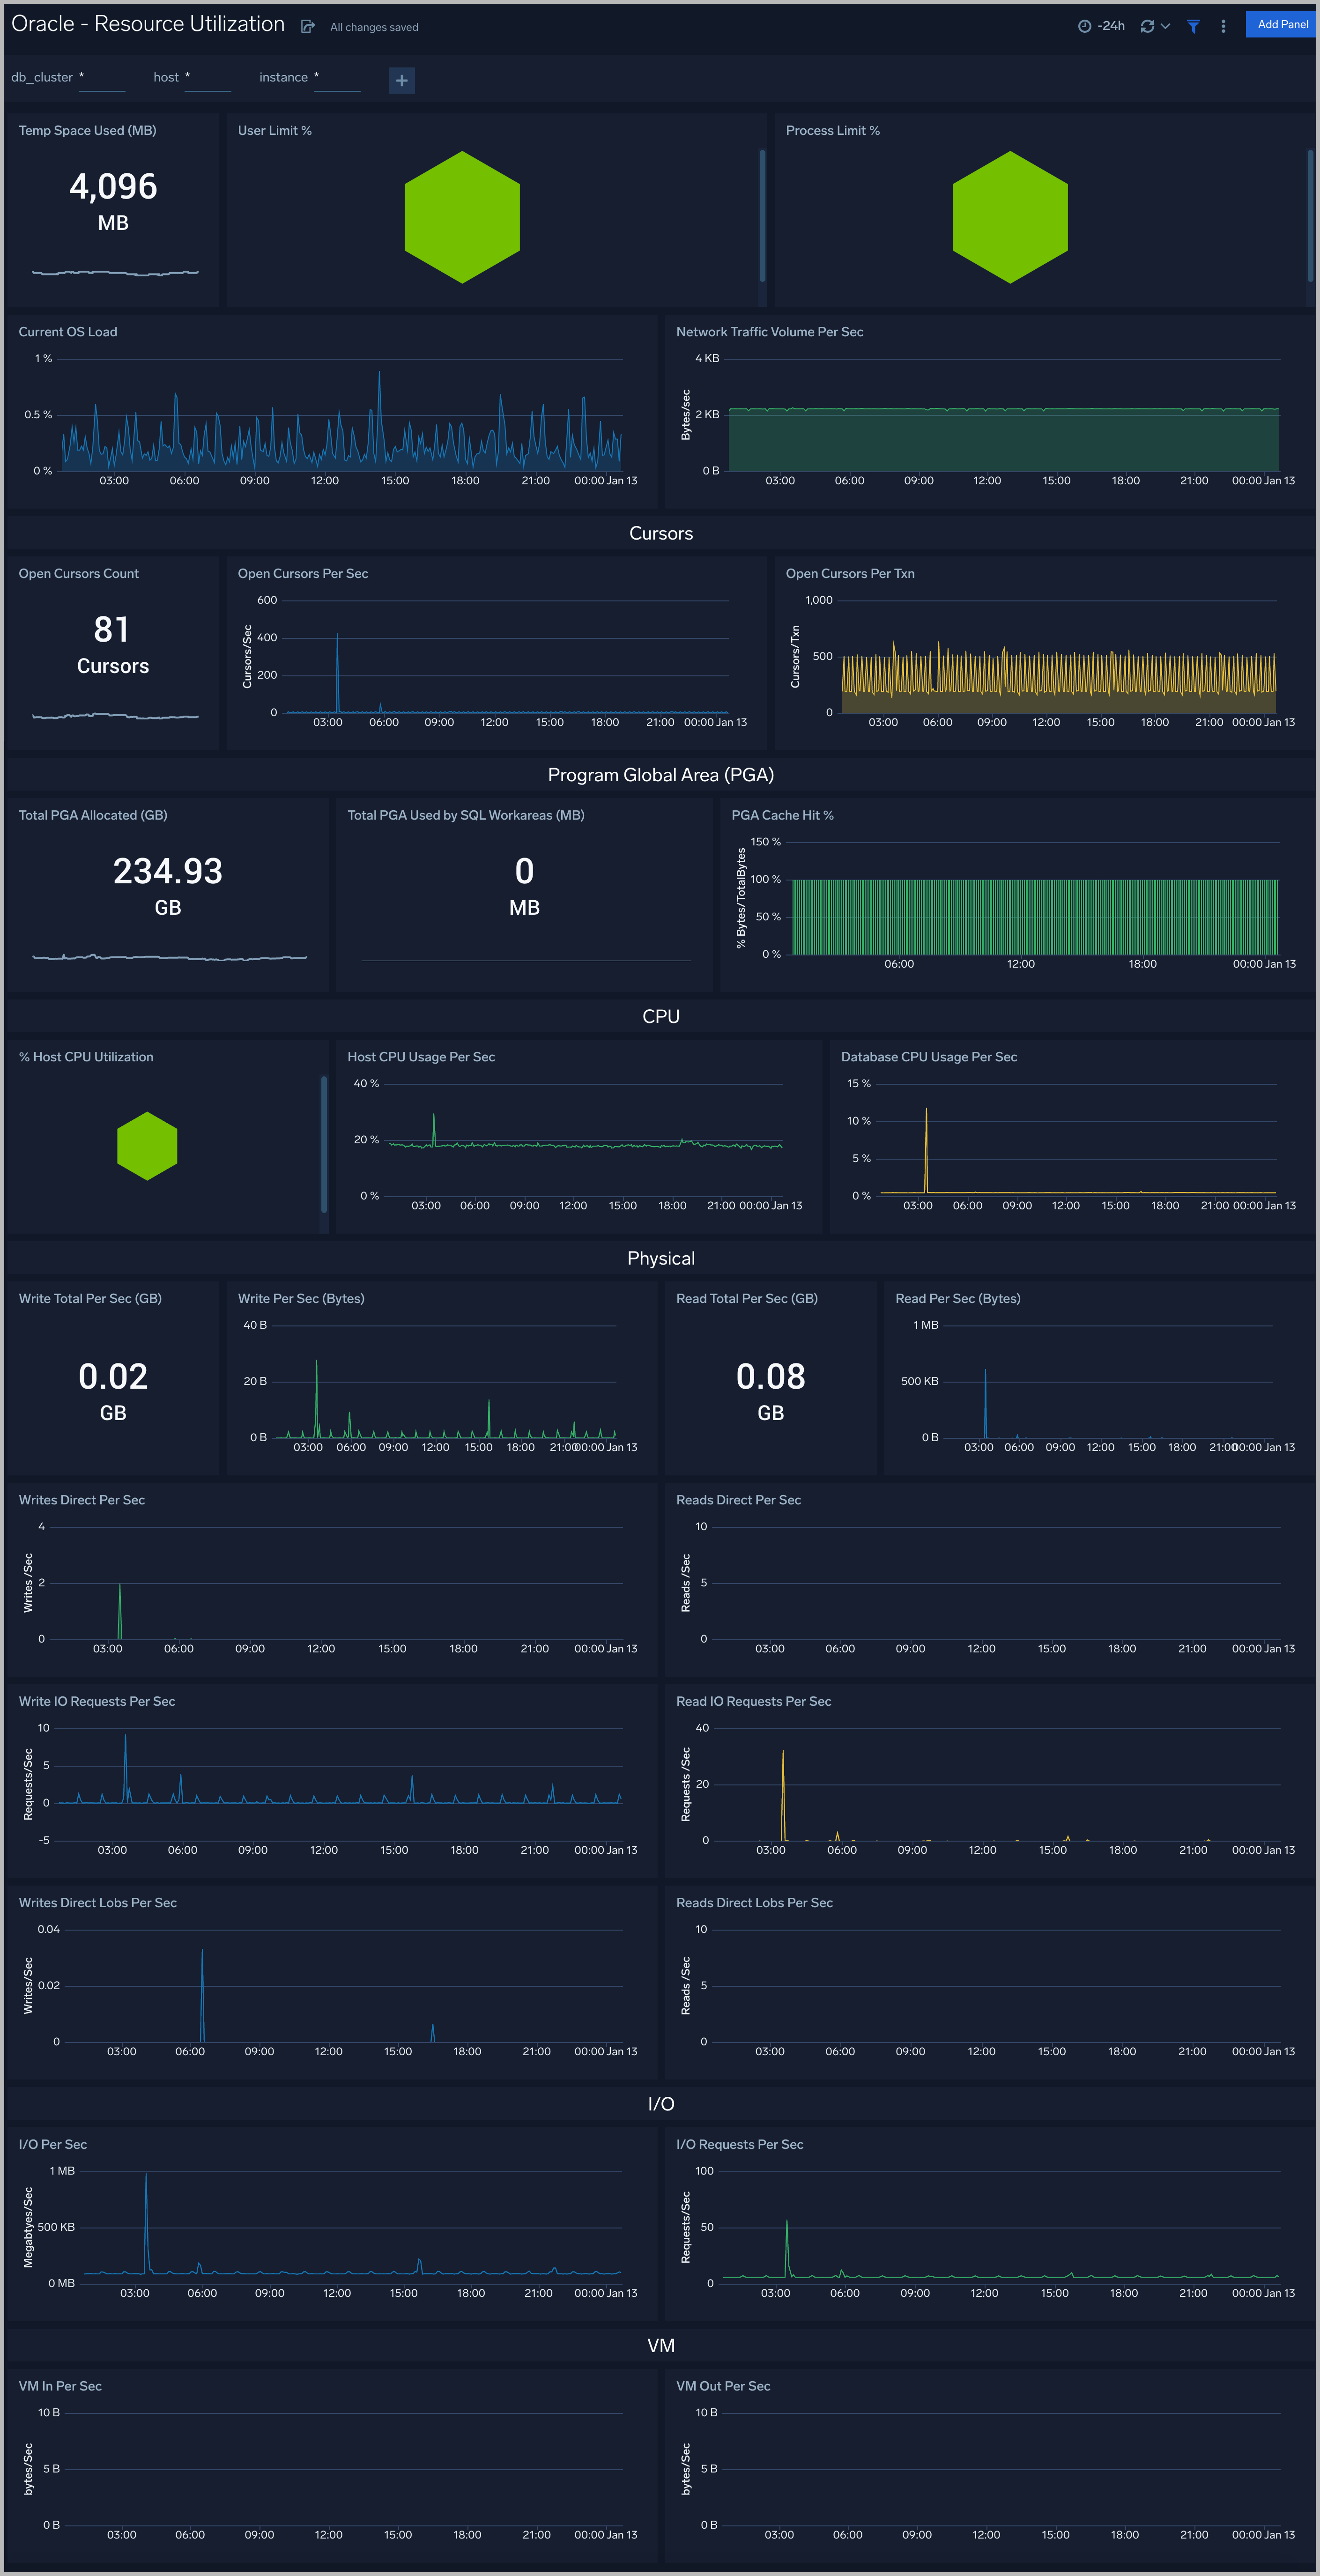
Resource Utilization
The Oracle - Resource Utilization dashboard performance statistics such as Limit, OS load, CPU, Cursors, PGA, Physical, I/O and VM
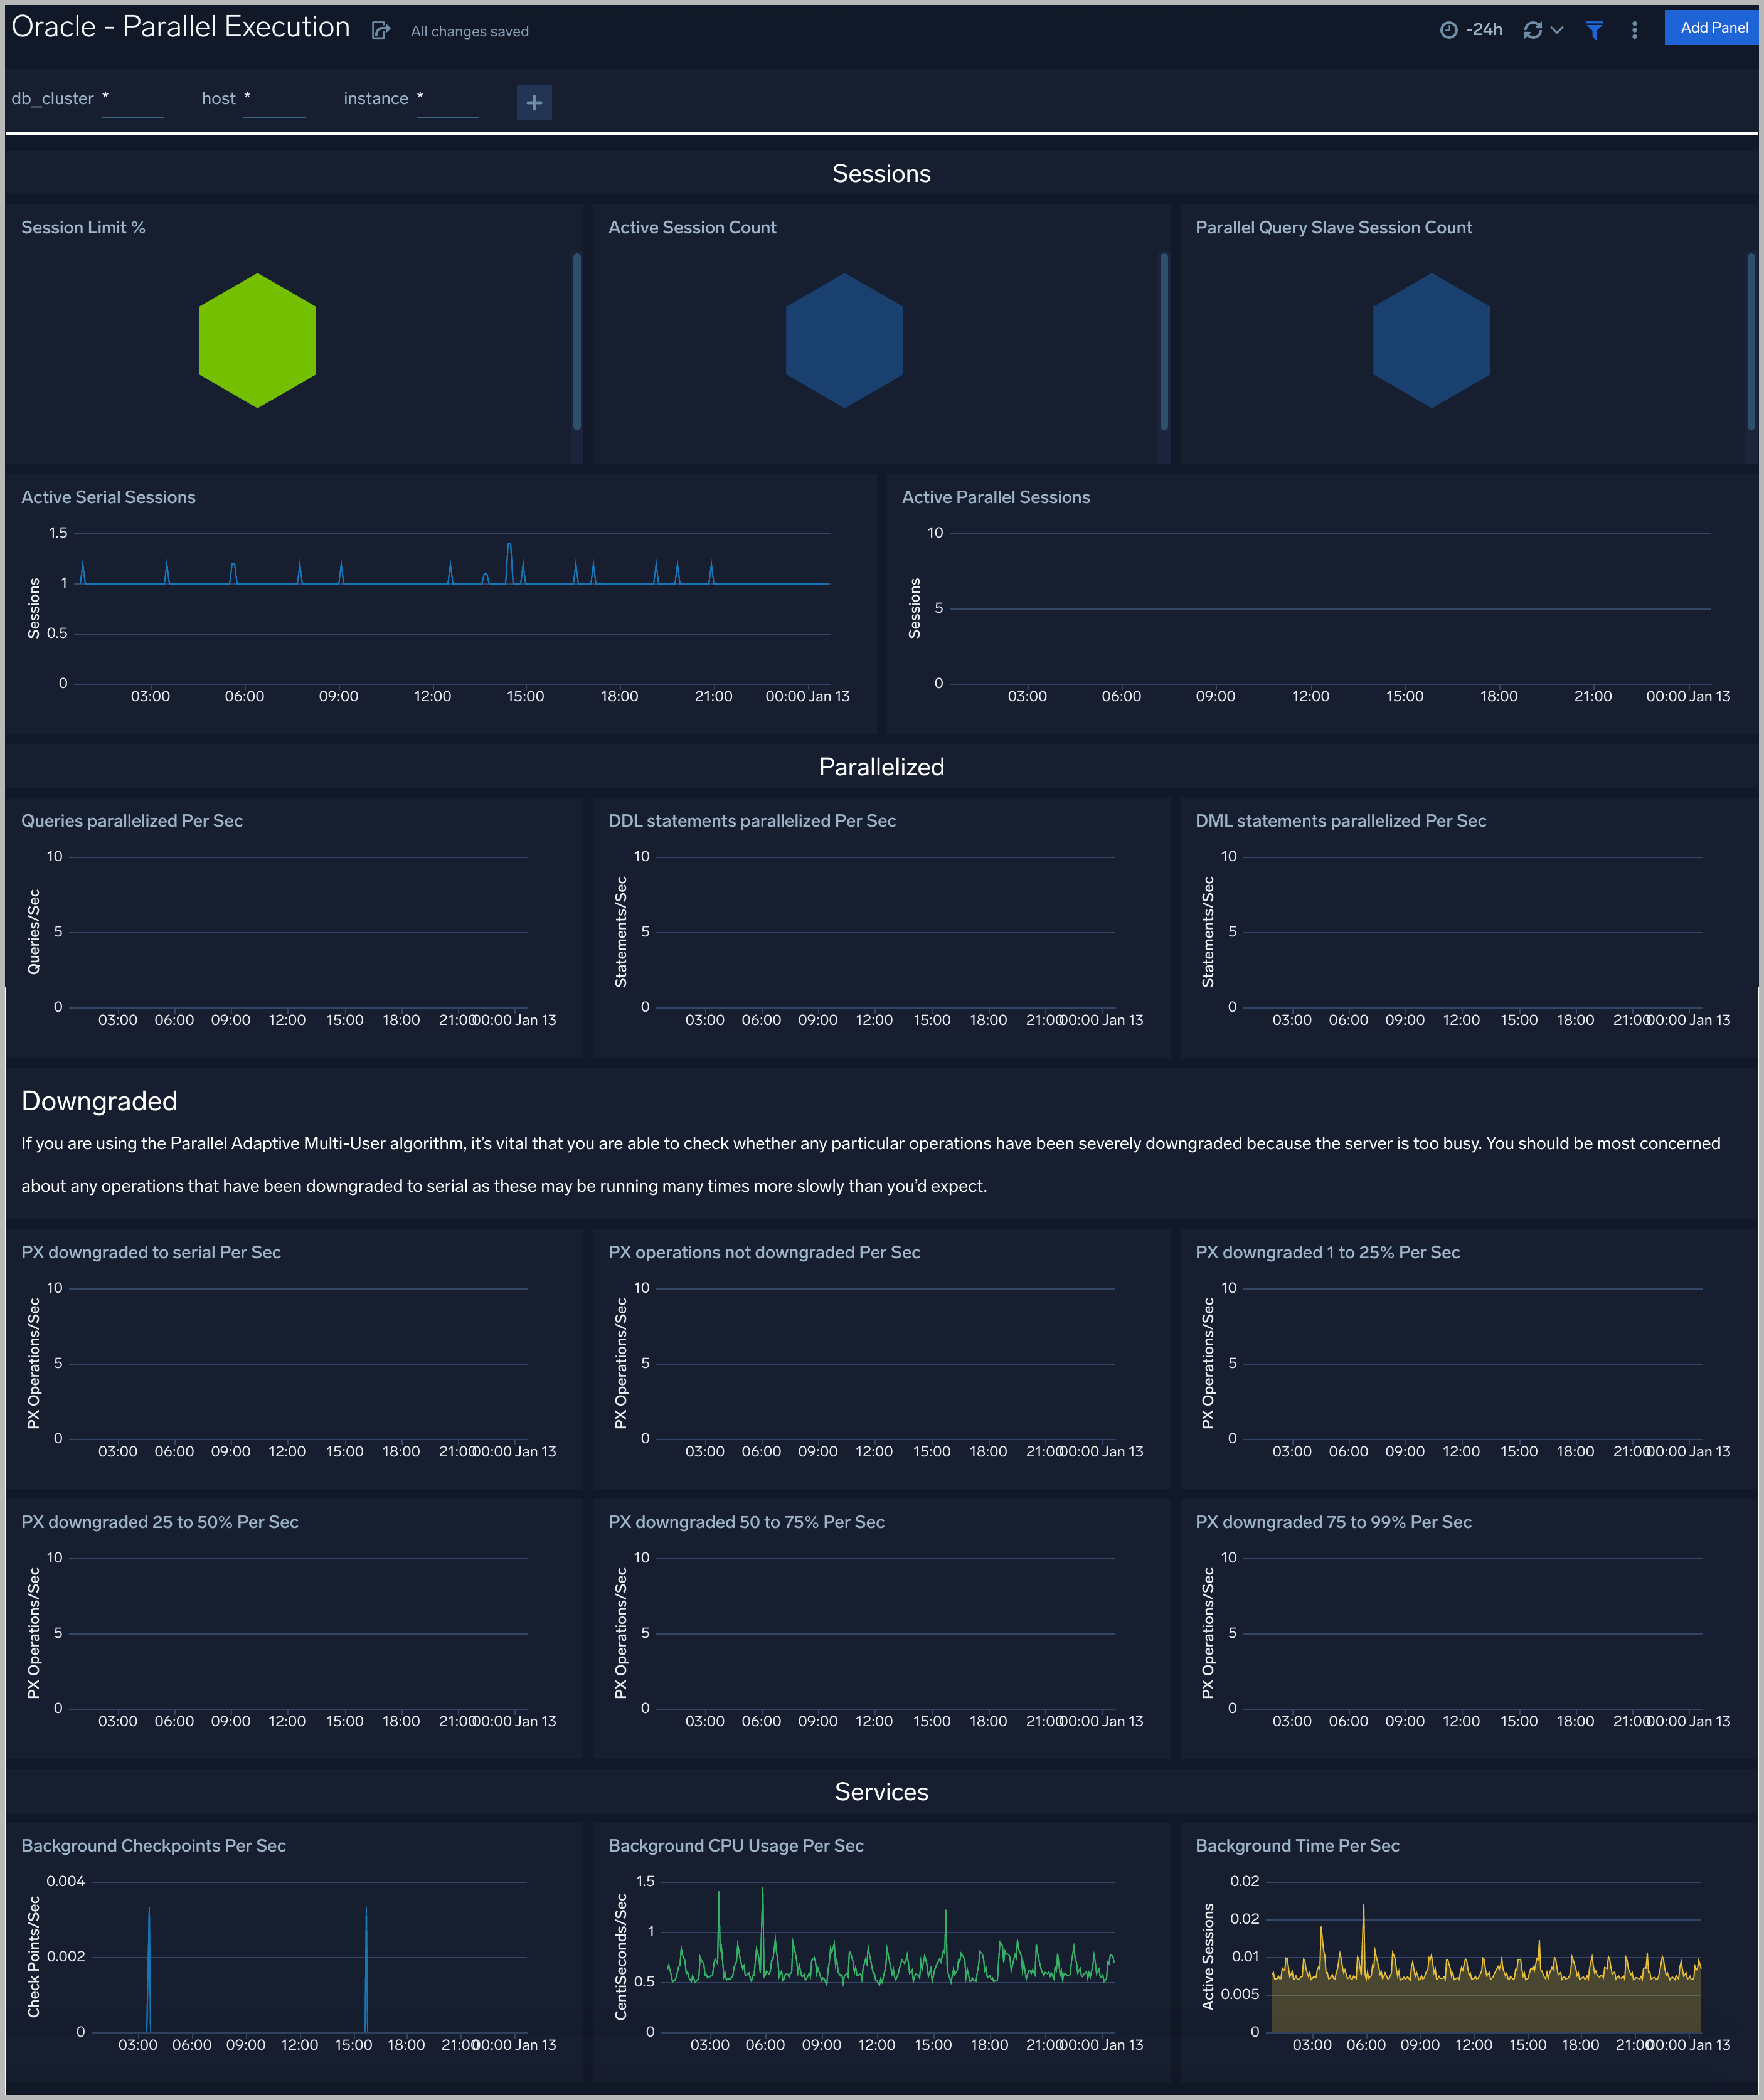
Parallel Execution
The Oracle - Parallel Execution dashboard performance statistics such as Sessions, DDL statements parallelized, PX downgraded, Background services
Create monitors for Oracle app
From your App Catalog:
- From the Sumo Logic navigation, select App Catalog.
- In the Search Apps field, search for and then select your app.
- Make sure the app is installed.
- Navigate to What's Included tab and scroll down to the Monitors section.
- Click Create next to the pre-configured monitors. In the create monitors window, adjust the trigger conditions and notifications settings based on your requirements.
- Scroll down to Monitor Details.
- Under Location click on New Folder.
note
By default, monitor will be saved in the root folder. So to make the maintenance easier, create a new folder in the location of your choice.
- Enter Folder Name. Folder Description is optional.
tip
Using app version in the folder name will be helpful to determine the versioning for future updates.
- Click Create. Once the folder is created, click on Save.
Oracle alerts
| Alert Type (Metrics/Logs) | Alert Name | Alert Description | Trigger Type (Critical / Warning) | Alert Condition | Recover Condition |
|---|---|---|---|---|---|
| Logs | Oracle - Admin Restricted Command Execution | This alert fires when the Listener is unable to resolve a command. | Warning | > 0 | <= 0 |
| Logs | Oracle - Archival Log Creation | This alert fires when there is an archive log creation error. | Warning | > 0 | <= 0 |
| Logs | Oracle - Block Corruption | This alert fires when we detect corrupted data blocks. | Warning | > 0 | <= 0 |
| Logs | Oracle - Database Crash | This alert fires when the database crashes. | Critical | >0 | <= 0 |
| Logs | Oracle - Deadlock | This alert fires when deadlocks are detected. | Warning | >5 | <= 0 |
| Logs | Oracle - Fatal NI Connect Error | This alert fires when we detect a "Fatal NI connect error". | Warning | >0 | <= 0 |
| Logs | Oracle - Internal Errors | This alert fires when internal errors are detected. | Warning | >0 | <= 0 |
| Logs | Oracle - Login Fail | This alert fires when we detect that a user cannot login. | Warning | >0 | <= 0 |
| Logs | Oracle - Possible Inappropriate Activity | This alert fires when we detect possible inappropriate activity. | Warning | >0 | <= 0 |
| Logs | Oracle - TNS Error | This alert fires when we detect TNS operations errors. | Critical | >0 | <= 0 |
| Logs | Oracle - Unable To Extend Tablespace | This alert fires when we detect that we are unable to extend tablespaces. | Warning | >0 | <= 0 |
| Logs | Oracle - Unauthorized Command Execution | This alert fires when we detect that a user is not authorized to execute a requested listener command in an Oracle instance. | Warning | >0 | <= 0 |
| Metrics | Oracle - Database Down | This alert fires when we detect that the Oracle database is down. | Critical | >0 | <= 0 |
| Metrics | Oracle - High CPU Usage | This alert fires when CPU usage on a node in an Oracle cluster is high. | Critical | >=80 | < 80 |
| Metrics | Oracle - Process Limit Critical | This alert fires when process CPU utilization is over 90% | Critical | >=90 | < 90 |
| Metrics | Oracle - Process Limit Warning | This alert fires when processes CPU utilization is over 80% | Warning | >=80 | < 80 |
| Metrics | Oracle - Session Critical | This alert fires when session usage is over 97% | Critical | >=97 | < 97 |
| Metrics | Oracle - Session Warning | This alert fires when session usage is over 90% | Warning | >=90 | < 90 |
| Metrics | Oracle - Tablespaces Out of Space | This alert fires when tablespace disk usage is over 90% | Critical | >=90 | < 90 |
| Metrics | Oracle - Tablespaces Space Low | This alert fires when tablespace disk usage is over 80% | Warning | >=80 | < 80 |
| Metrics | Oracle - User Limit Critical | This alert fires when concurrent user sessions usage is over 90% | Critical | >=90 | < 90 |
| Metrics | Oracle - User Limit Warning | This alert fires when concurrent user sessions usage is over 80% | Warning | >=80 | < 80 |