Global Intelligence for Apache app

The Global Intelligence for Apache app is a companion to the Apache app and helps DevOps and infrastructure engineers compare server and user activity patterns associated with their Apache servers against other Sumo Logic customer’s servers. Such comparisons can help diagnose potential load, throughput, or error issues in Apache clusters and avoid operational incidents arising from sub-optimal configurations of Apache clusters.
Availability
This feature is available in the following account plans.
| Account Type | Account Level |
|---|---|
| CloudFlex | Enterprise |
| Credits | Enterprise Operations, Enterprise Suite |
Data sources
The Global Intelligence for Apache app uses logs data from Apache clusters. Like the Sumo Logic app for Apache, it assumes the NCSA extended/combined log file format for Access logs and the default Apache error log file format for error logs. For more details on Apache logs.
Sample queries
The following sample query is from the Average Requests Per Second: My Server v Benchmark panel of GI Apache - 02. Load Signals and Contributing Factors dashboard.
| parse regex field=apache_log_message "(?<Method>[A-Za-z]+)\s(?<URL>\S+)\sHTTP/[\d\.]+\"\s(?<Status_Code>\d+)\s(?<Size>[\d-]+)\s\"(?<Referrer>.*?)\"\s\"(?<User_Agent>.+?)\".*"
| where _sourceHost matches "*"
| _sourceHost as server
| where size != "-"
| timeslice 1h
| count as hits by _timeslice, server
| hits/3600 as my_company_requests_per_sec
| fields - hits
//| pct(my_company_requests_per_sec, 0.99) as my_entity_p99 by server
| avg(my_company_requests_per_sec) as my_entity_avg by server
| "requests_per_sec" as benchmarkname
| infer _category=gislite _model=benchmarktrendline appname=apache benchmark_stat="avg" my_entity_stat="avg"
//| max(benchmark_p99) as benchmark_p99, max(my_entity_p99) as my_entity_p99 by date
| max(benchmark_avg) as benchmark_avg, max(my_entity_avg) as my_entity_avg by date
| sort by date asc
Collecting logs for the Apache app
Follow the steps in Sumo Logic Apache Logs to configure collection for the Global Intelligence for Apache app.
Concepts
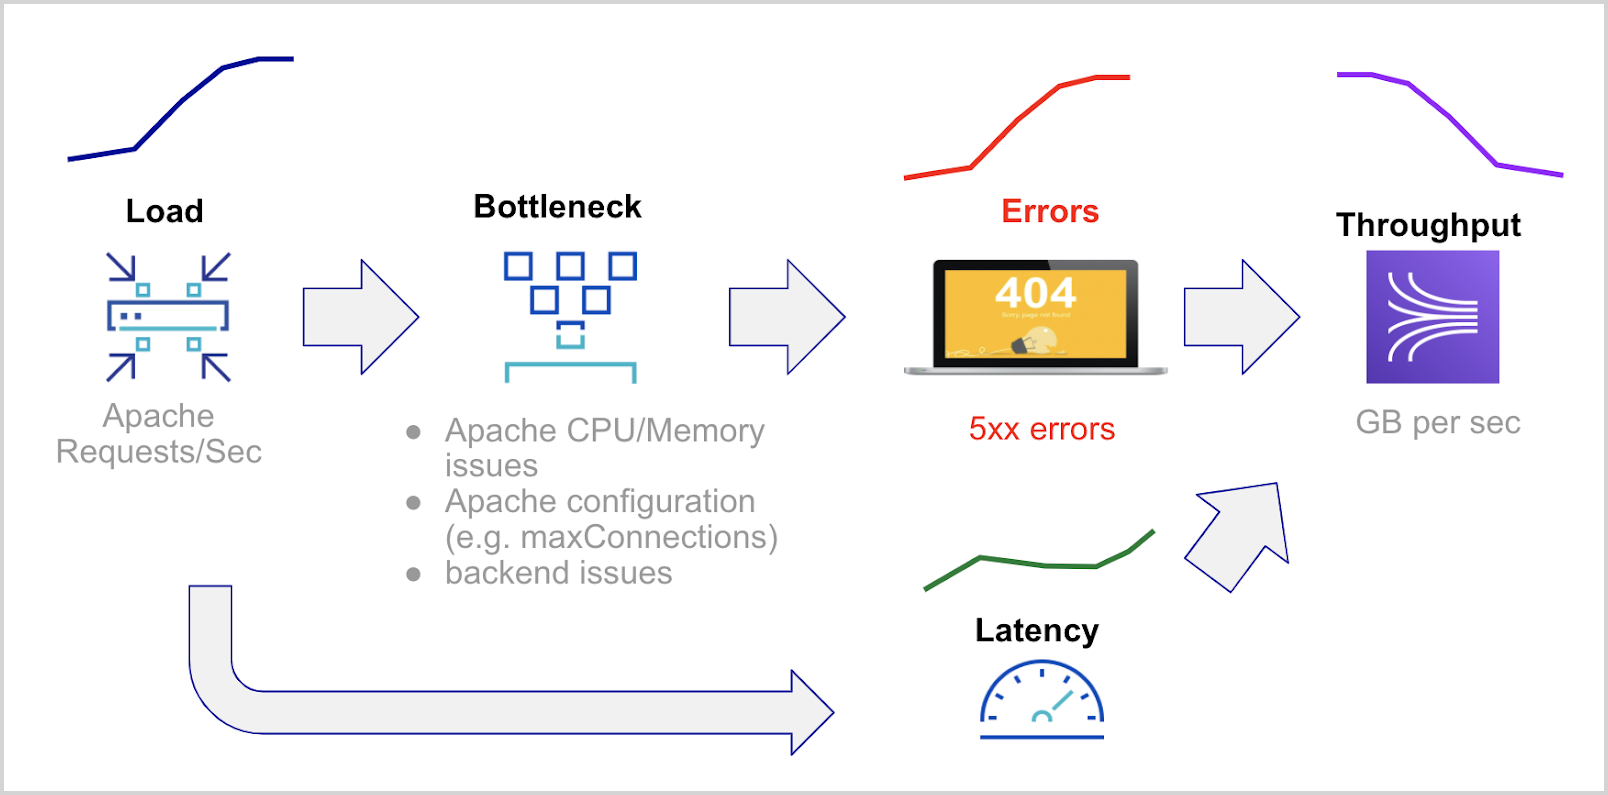
Golden Signals
Golden signals of load, bottleneck, latency, errors and throughput help identify the flow of causation between benchmark signals. In a nutshell, load spikes lead to either latency or error spikes; latency and error spikes lead to a drop in throughput as shown in the figure below. The signals and contributing factors are organized based on Golden Signal analysis
Distance: Quantifying Similarity of Server Time Series to Benchmark
Distance, between 0 and 1, is a statistical measure of how similar a given entity is to other entities based on a given signal. A distance of 0 signifies entities that are behaving identical to the population of entities, for the given signal. Sudden increases in distance coupled with sudden increases compared to benchmark values indicate entities that are either the cause of an incident or are affected by upstream issues.
For each Apache server, hourly signals for the past 7 days are used to construct the benchmark distribution for a given signal such as requests per second. A given server’s hourly readings for each day are compared with the benchmark signals to determine the daily distance from the benchmark. If a server is consistently different from the benchmark, such a server is behaving differently from the population for a given signal. Changes, such as a sudden increase in distance between days, are more significant than the absolute value of distance on any given day.
Installing the Global Intelligence for Apache app
To install the app, do the following:
Next-Gen App: To install or update the app, you must be an account administrator or a user with Manage Apps, Manage Monitors, Manage Fields, Manage Metric Rules, and Manage Collectors capabilities depending upon the different content types part of the app.
- Select App Catalog.
- In the 🔎 Search Apps field, run a search for your desired app, then select it.
- Click Install App.
note
Sometimes this button says Add Integration.
- Click Next in the Setup Data section.
- In the Configure section of your respective app, complete the following fields.
- Field Name. If you already have collectors and sources set up, select the configured metadata field name (eg _sourcecategory) or specify other custom metadata (eg: _collector) along with its metadata Field Value.
- Click Next. You will be redirected to the Preview & Done section.
Post-installation
Once your app is installed, it will appear in your Installed Apps folder, and dashboard panels will start to fill automatically.
Each panel slowly fills with data matching the time range query received since the panel was created. Results will not immediately be available but will be updated with full graphs and charts over time.
Viewing Global Intelligence for Apache dashboards
All dashboards have a set of filters that you can apply to the entire dashboard. Use these filters to drill down and examine the data to a granular level.
- You can change the time range for a dashboard or panel by selecting a predefined interval from a drop-down list, choosing a recently used time range, or specifying custom dates and times. Learn more.
- You can use template variables to drill down and examine the data on a granular level. For more information, see Filtering Dashboards with Template Variables.
- Most Next-Gen apps allow you to provide the scope at the installation time and are comprised of a key (
_sourceCategoryby default) and a default value for this key. Based on your input, the app dashboards will be parameterized with a dashboard variable, allowing you to change the dataset queried by all panels. This eliminates the need to create multiple copies of the same dashboard with different queries.
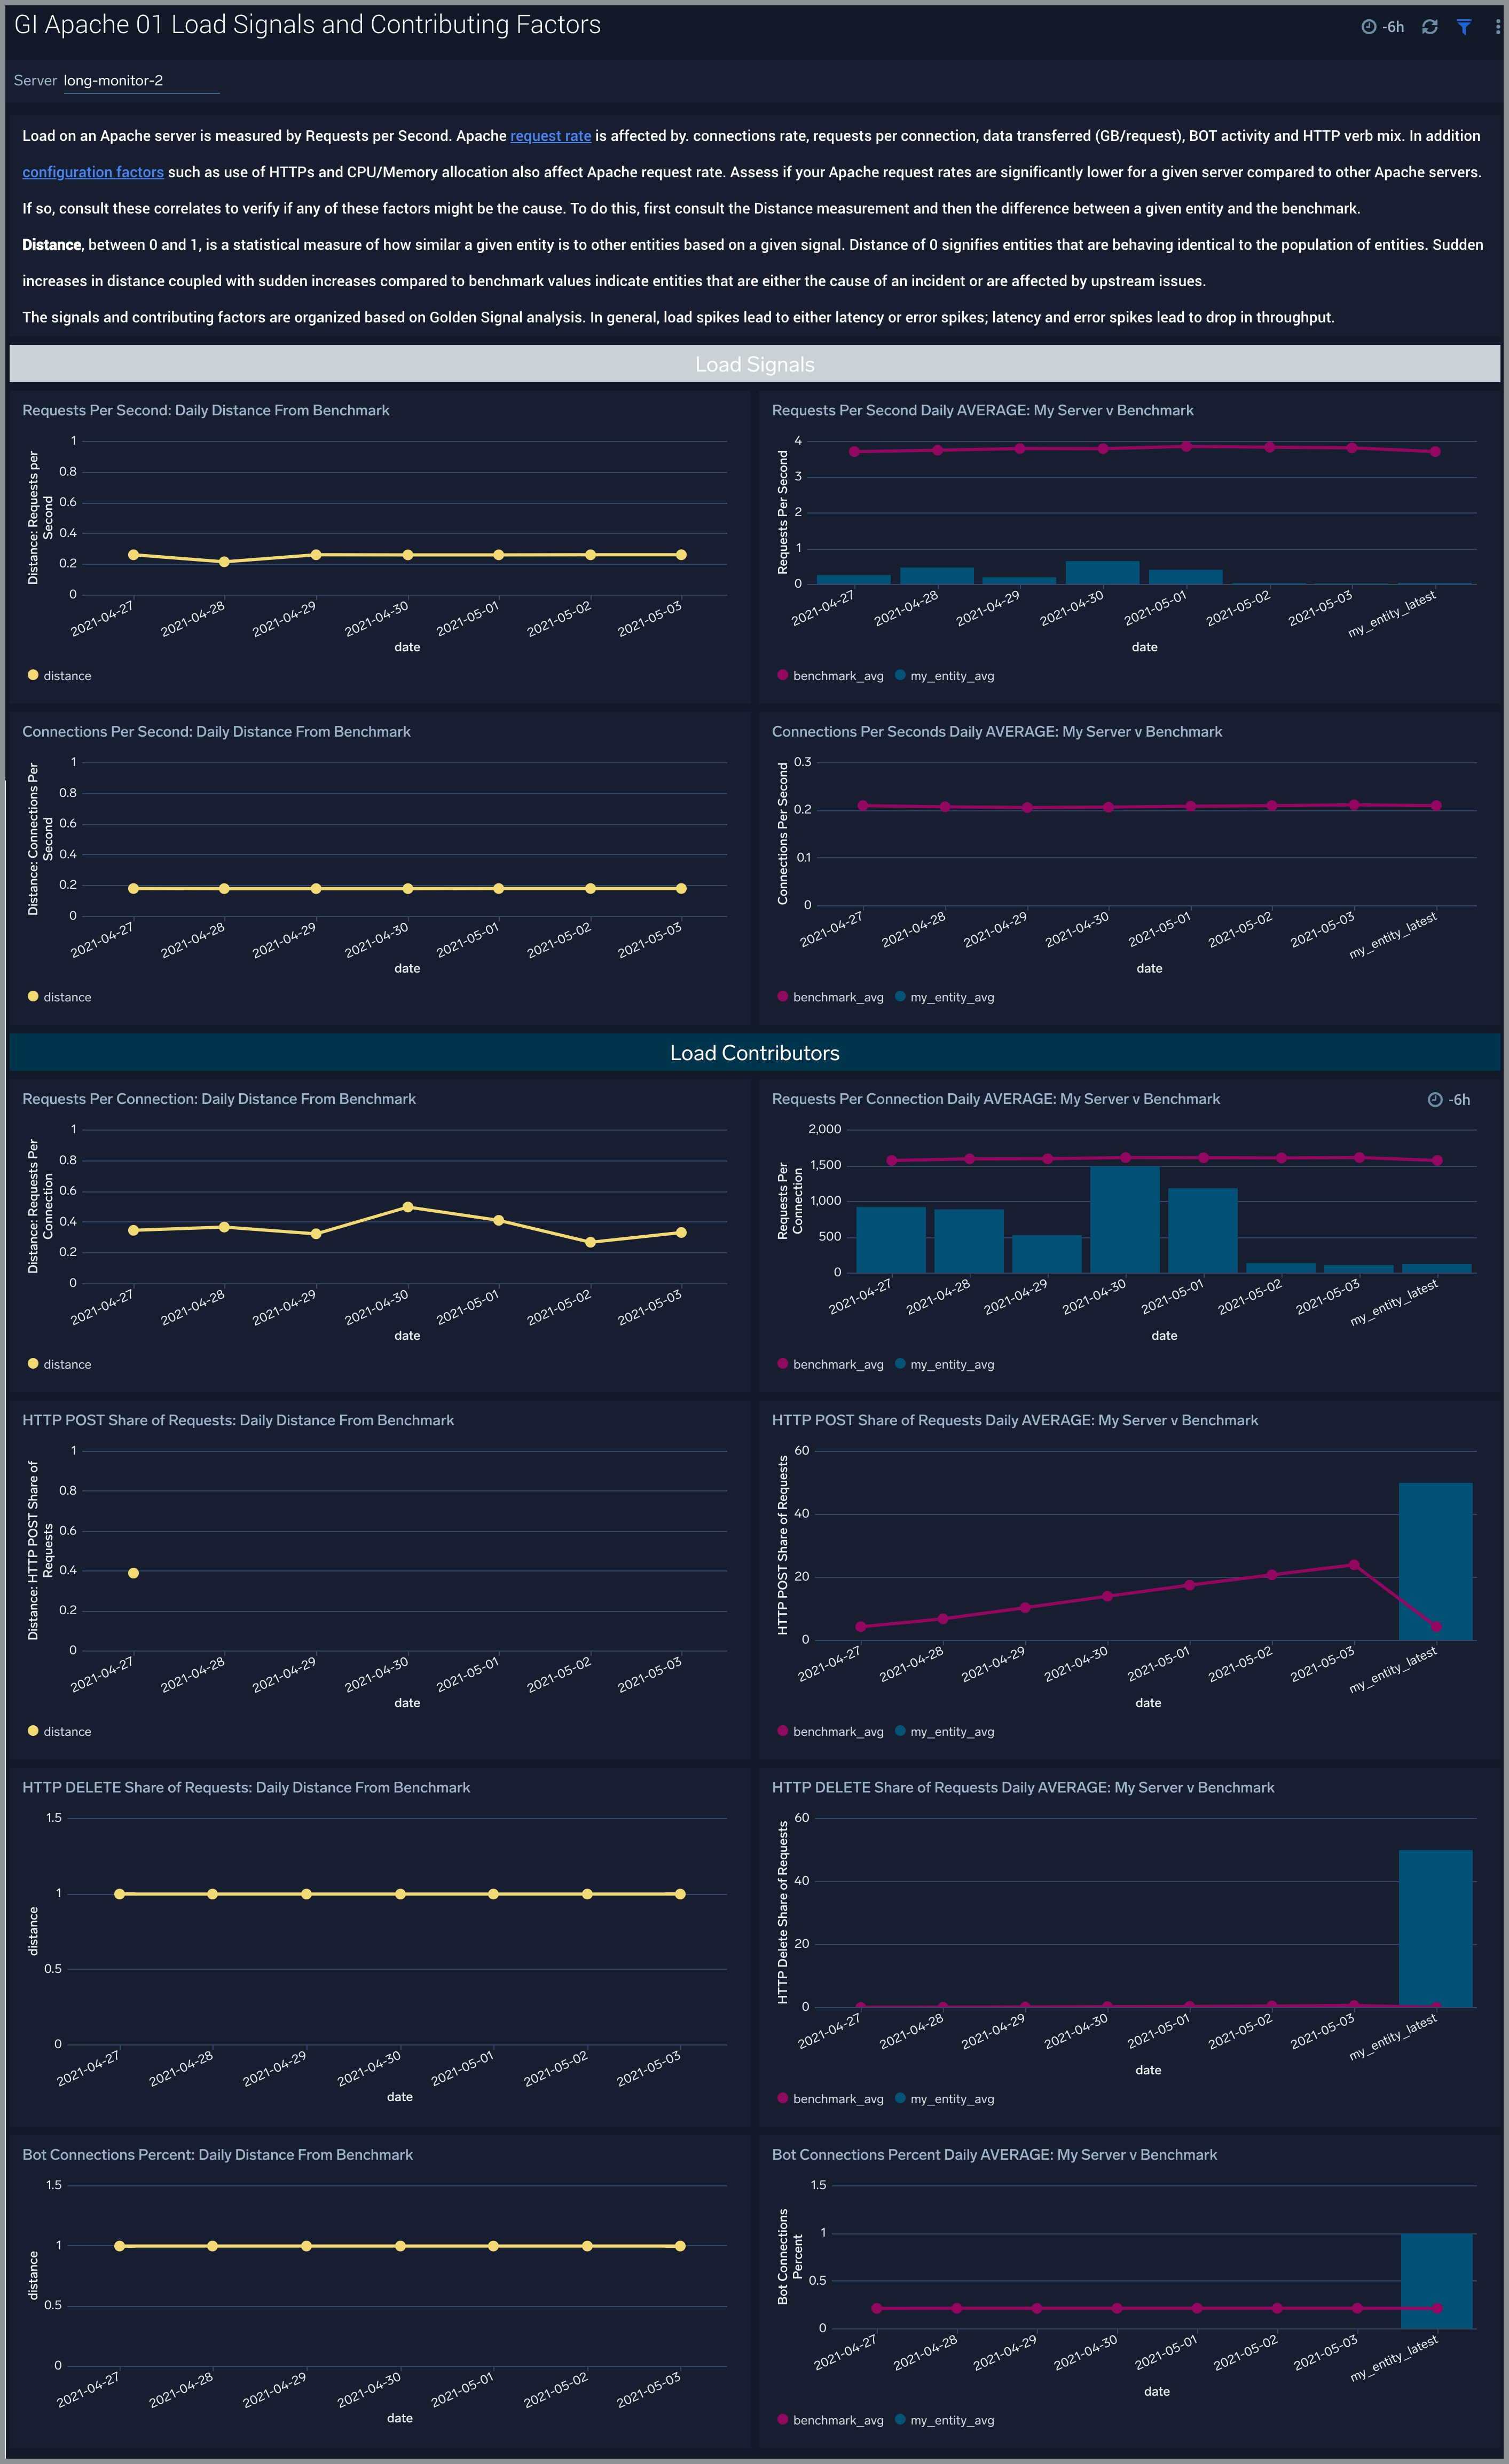
Load Signals and Contributing Factors
The GI Apache - 01. Load Signals and Contributing Factors dashboard compares the golden signal of load (requests per second) for a company’s Apache servers to other servers. These signals are impacted by connections per second, requests per connection, the share of bot connections, and share of HTTP POST/DELETE requests. These causal signals are also compared to the population of Apache servers.
Use this dashboard to:
- Analyze unusual load spikes and the reasons for them. Load on an Apache server is measured by Requests per Second. Apache request rate is affected by connection rate, requests per connection, data transferred (GB/request), BOT activity, and HTTP verb mix. In addition configuration factors such as the use of HTTPs and CPU/Memory allocation also affect Apache request rate. Assess if your Apache request rates are significantly lower for a given server compared to other Apache servers. If so, consult these correlates to verify if any of these factors might be the cause. To do this, first consult the Distance measurement and then the difference between a given entity and the benchmark.
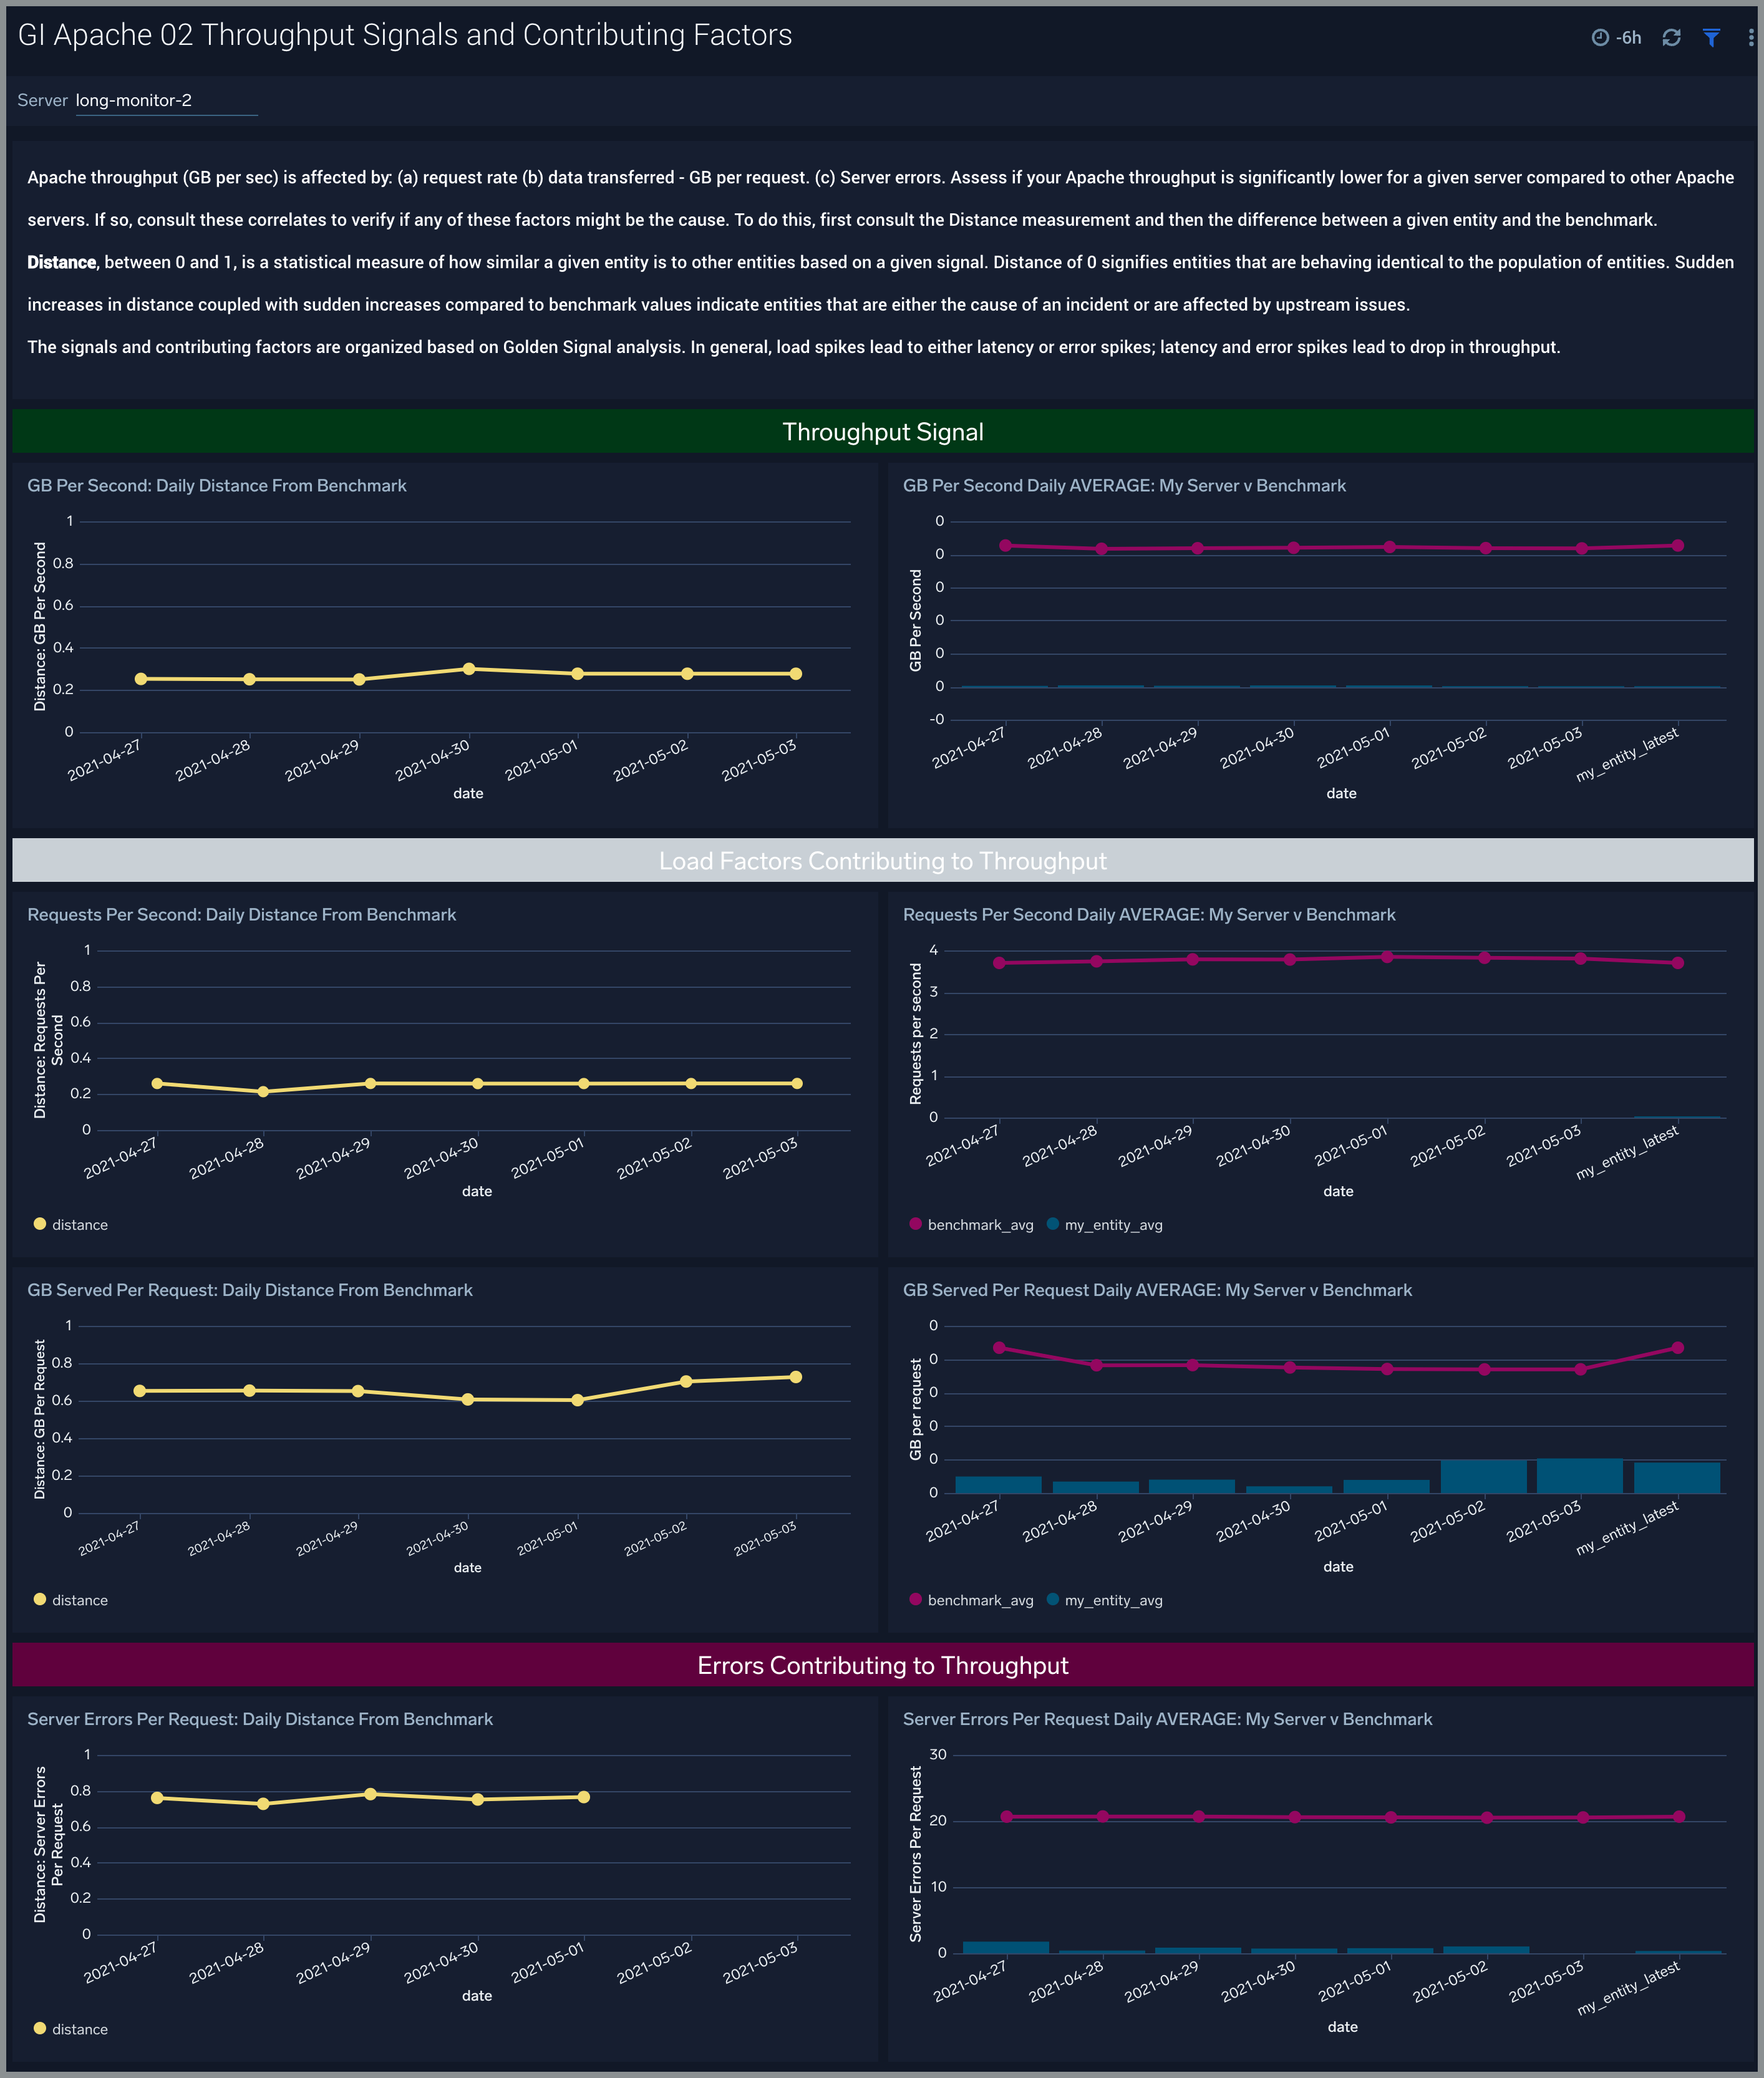
Throughput Signals and Contributing Factors
The GI Apache - 01. Throughput Signals and Contributing Factors dashboard compares the golden signal of throughput (GB per second) for a company’s Apache servers to other servers.
Apache throughput (GB per sec) is affected by: (a) request rate (b) data transferred - GB per request (c) Server errors.
Use this dashboard to:
- Assess if your Apache throughput is significantly lower for a given server compared to other Apache servers. If so, analyze the request rate, GB per request, and server errors to verify if any of these factors might be the cause. To do this, first consult the Distance measurement and then the difference between a given entity and the benchmark. Sudden increases in distance coupled with sudden increases compared to benchmark values indicate entities that are either the cause of an incident or are affected by upstream issues.
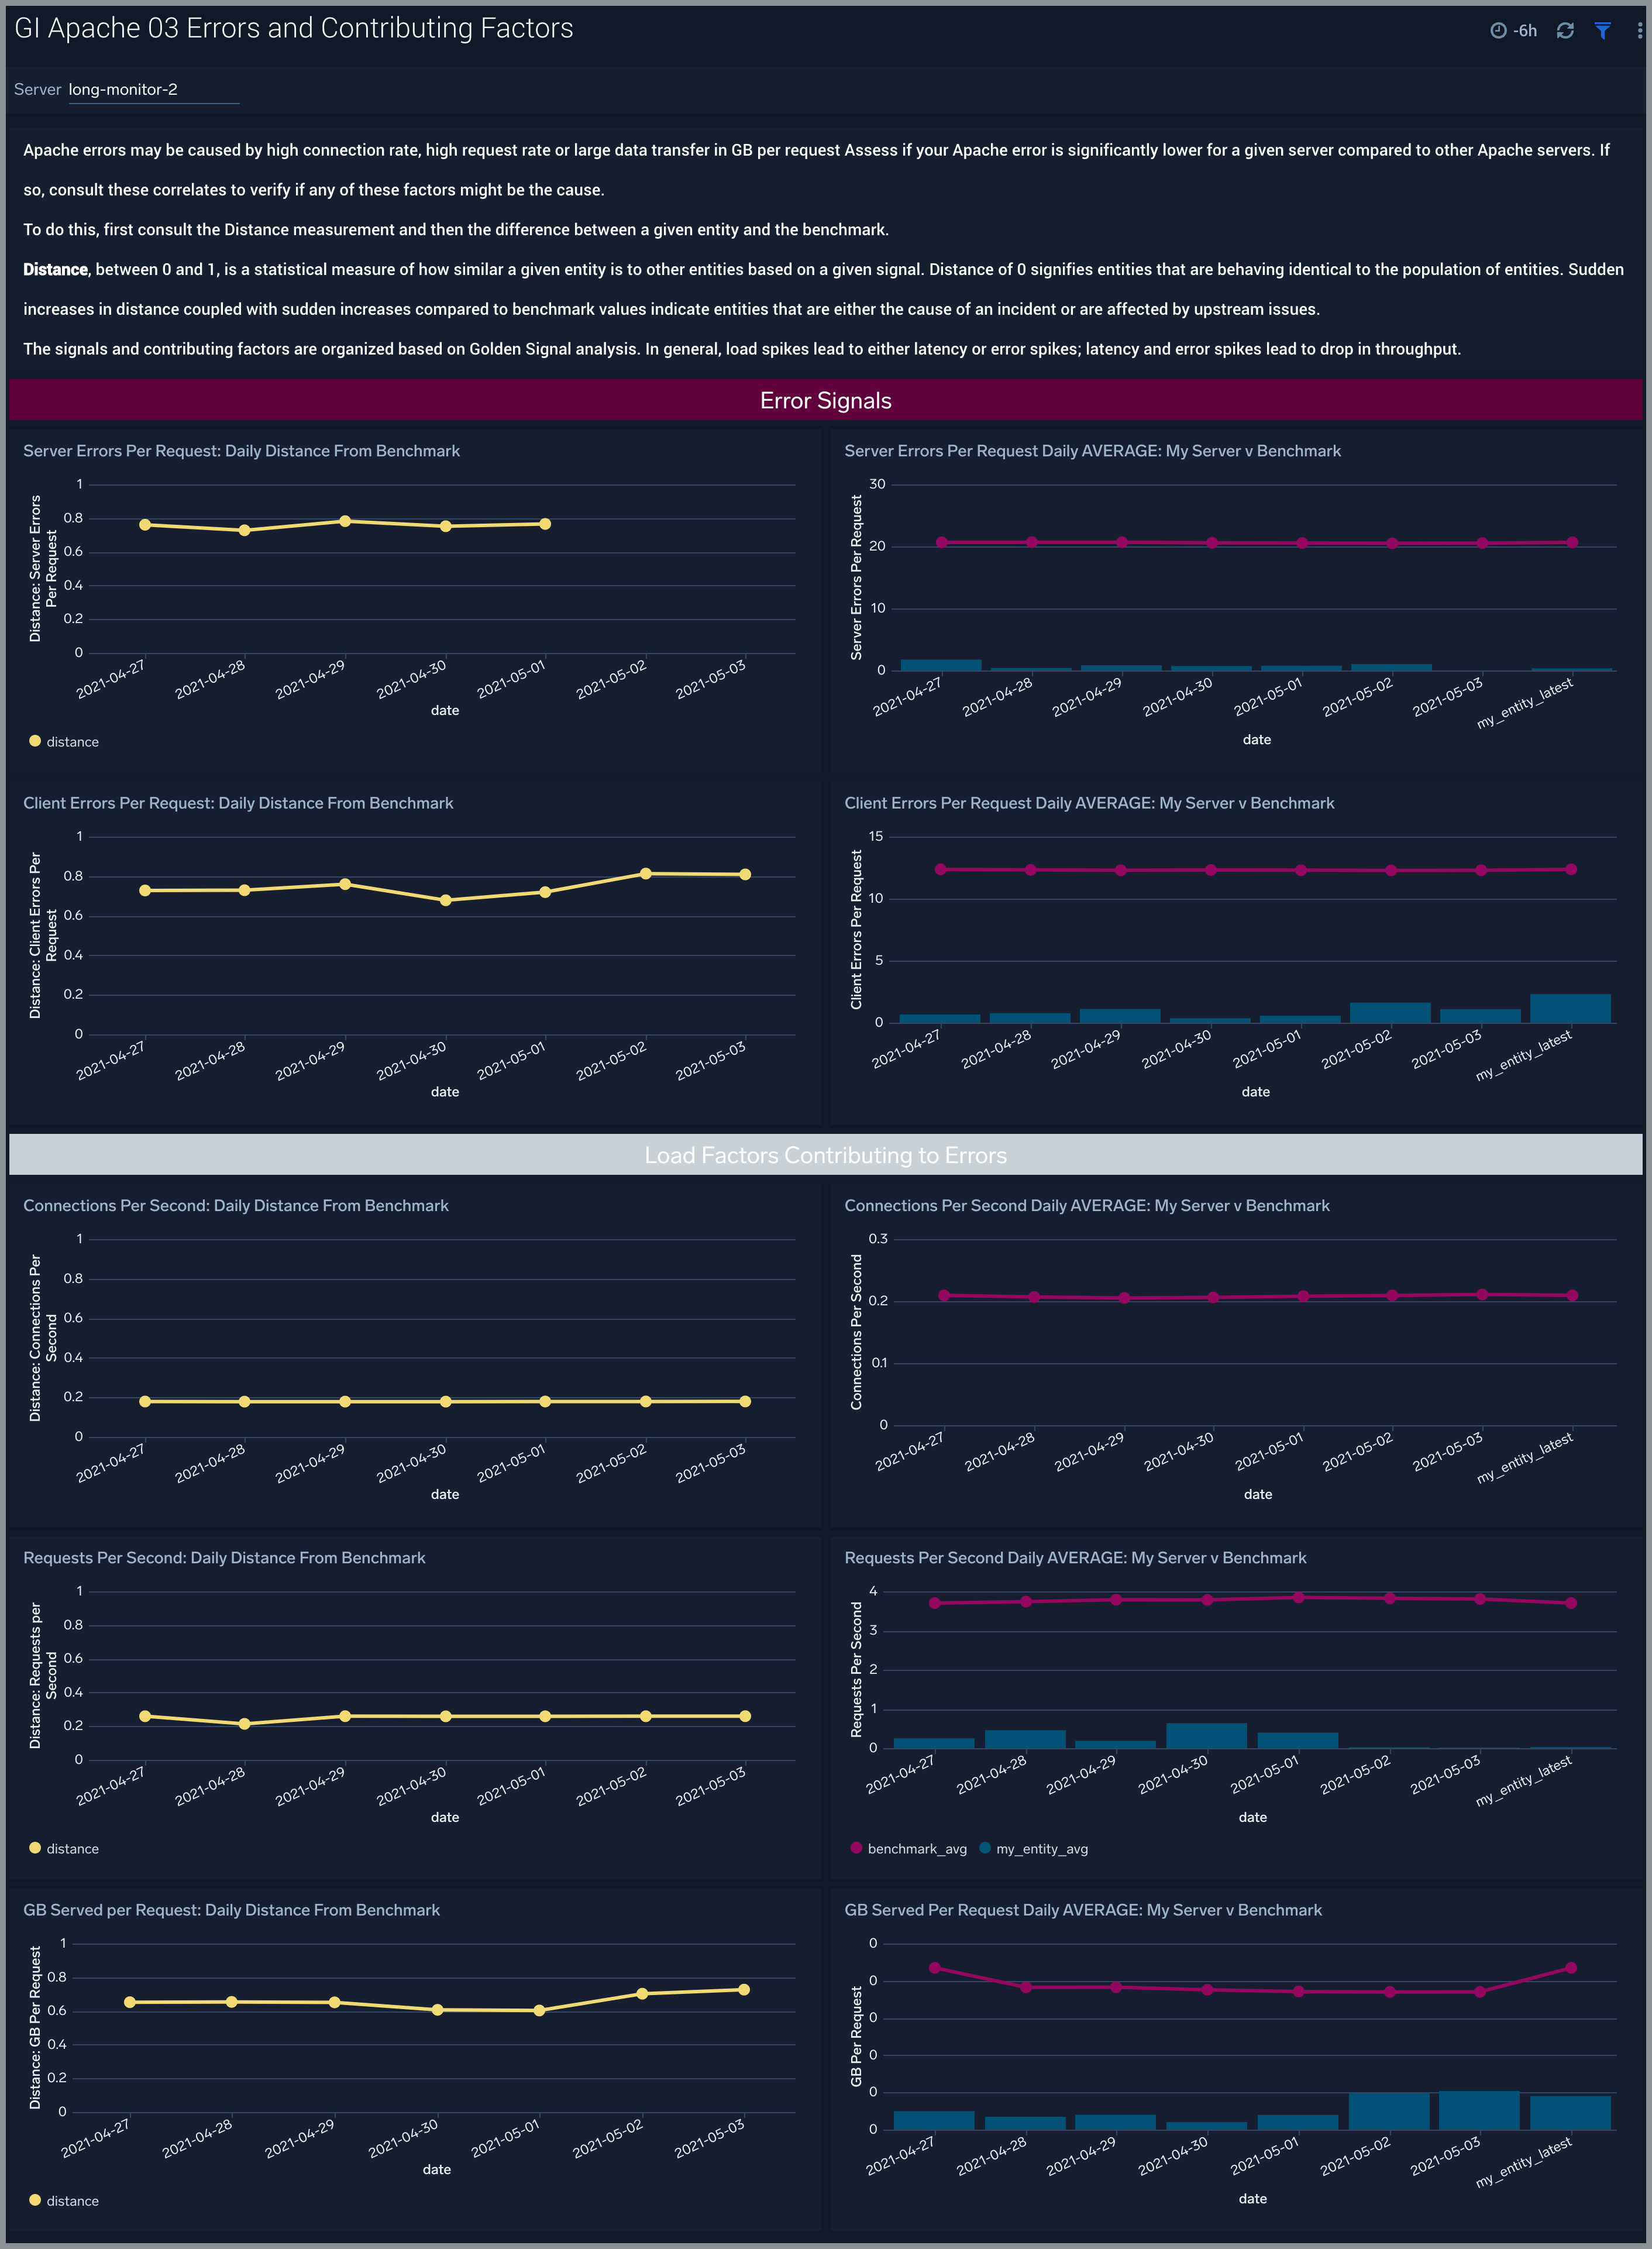
Errors and Contributing Factors
The GI Apache - 03. Errors and Contributing Factors dashboard compares the golden signal of error rate for a company’s Apache servers to other servers. These signals are impacted by requests per second, connections per second and GB per request. These causal signals are also compared to the population of Apache servers.
Use this dashboard to:
- Assess unusual increases in error rate and the reasons for them. Apache errors may be caused by high request rate, high request rate or large data transfer in GB per request. Analyze the request rate, GB per request and server errors to verify if any of these factors might be the cause. To do this, first consult the Distance measurement and then the difference between a given entity and the benchmark. Sudden increases in distance coupled with sudden increases compared to benchmark values indicate entities that are either the cause of an incident or are affected by upstream issues.
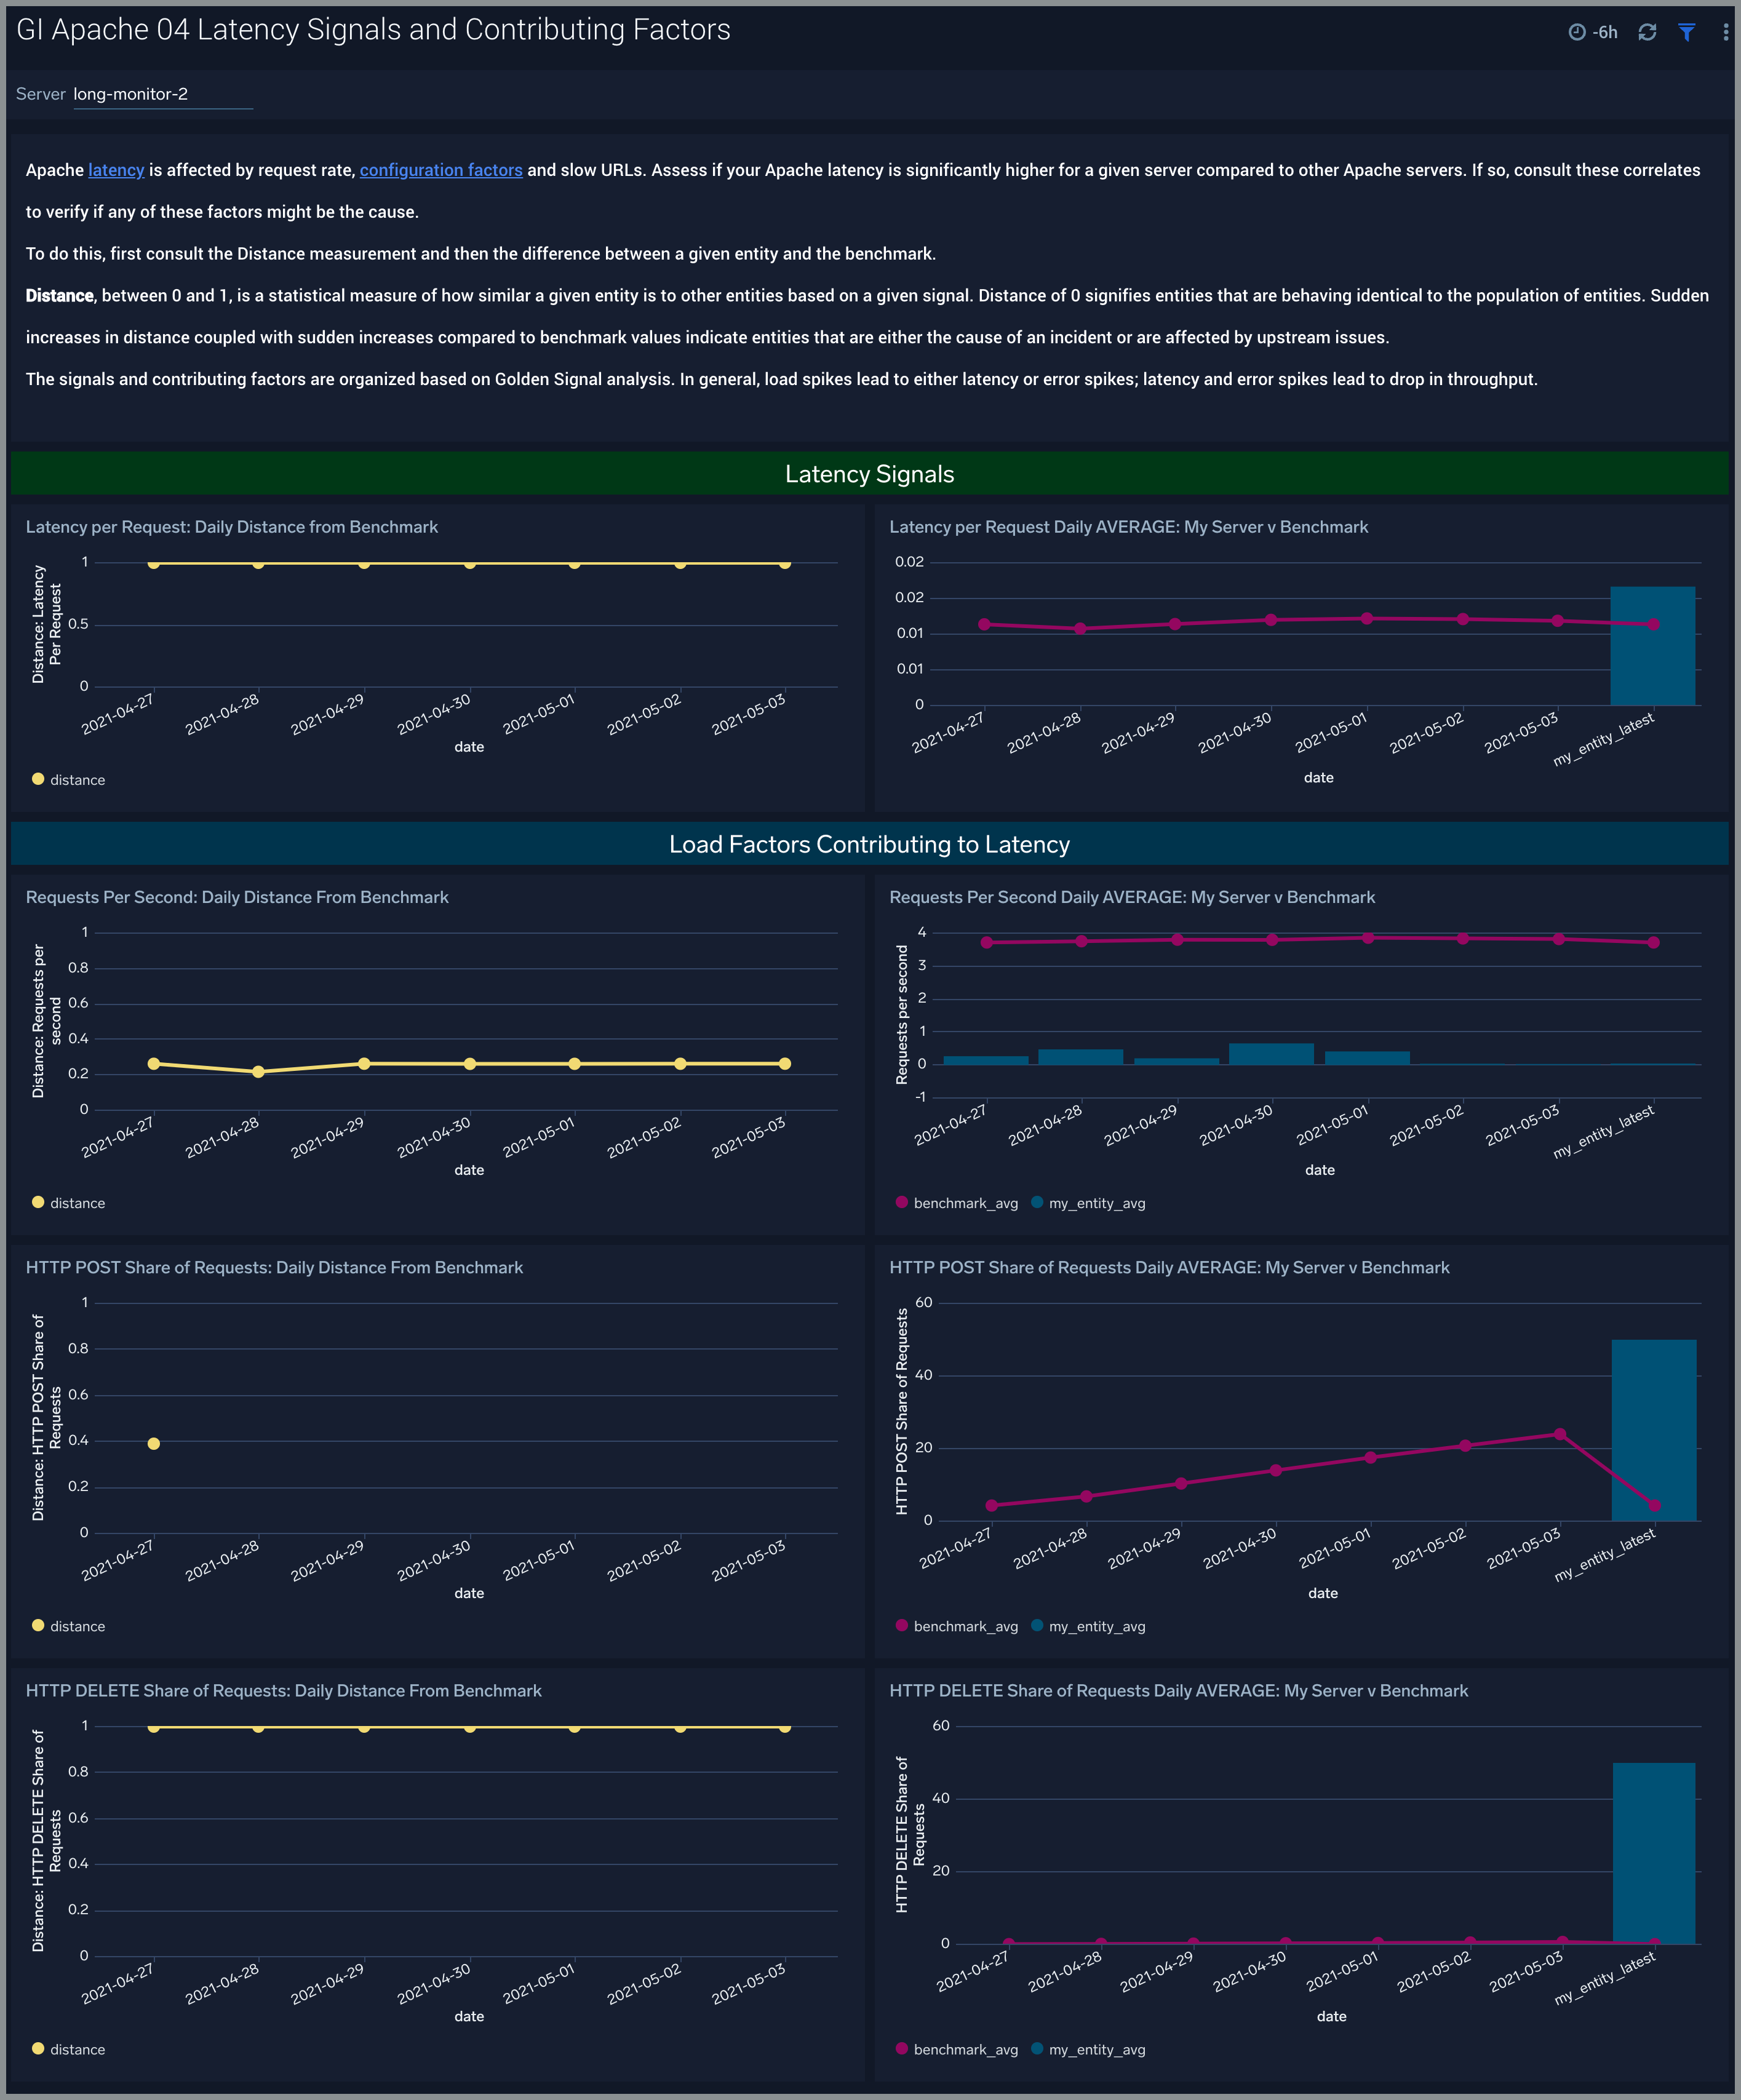
Latency Signals and Contributing Factors
The GI Apache - 04. Latency Signals and Contributing Factors dashboard compares the golden signal of latency for a company’s Apache servers to other servers. Apache latency is affected by request rate, configuration factors, and slow URLs.
Use this dashboard to:
- Assess unusual latency increases and the reasons for them such as increased load. Analyze the request rate and HTTP POST/DELETE mix of requests to verify if any of these factors might be the cause. To do this, first consult the Distance measurement and then the difference between a given entity and the benchmark. Sudden increases in distance coupled with sudden increases compared to benchmark values indicate entities that are either the cause of an incident or are affected by upstream issues.
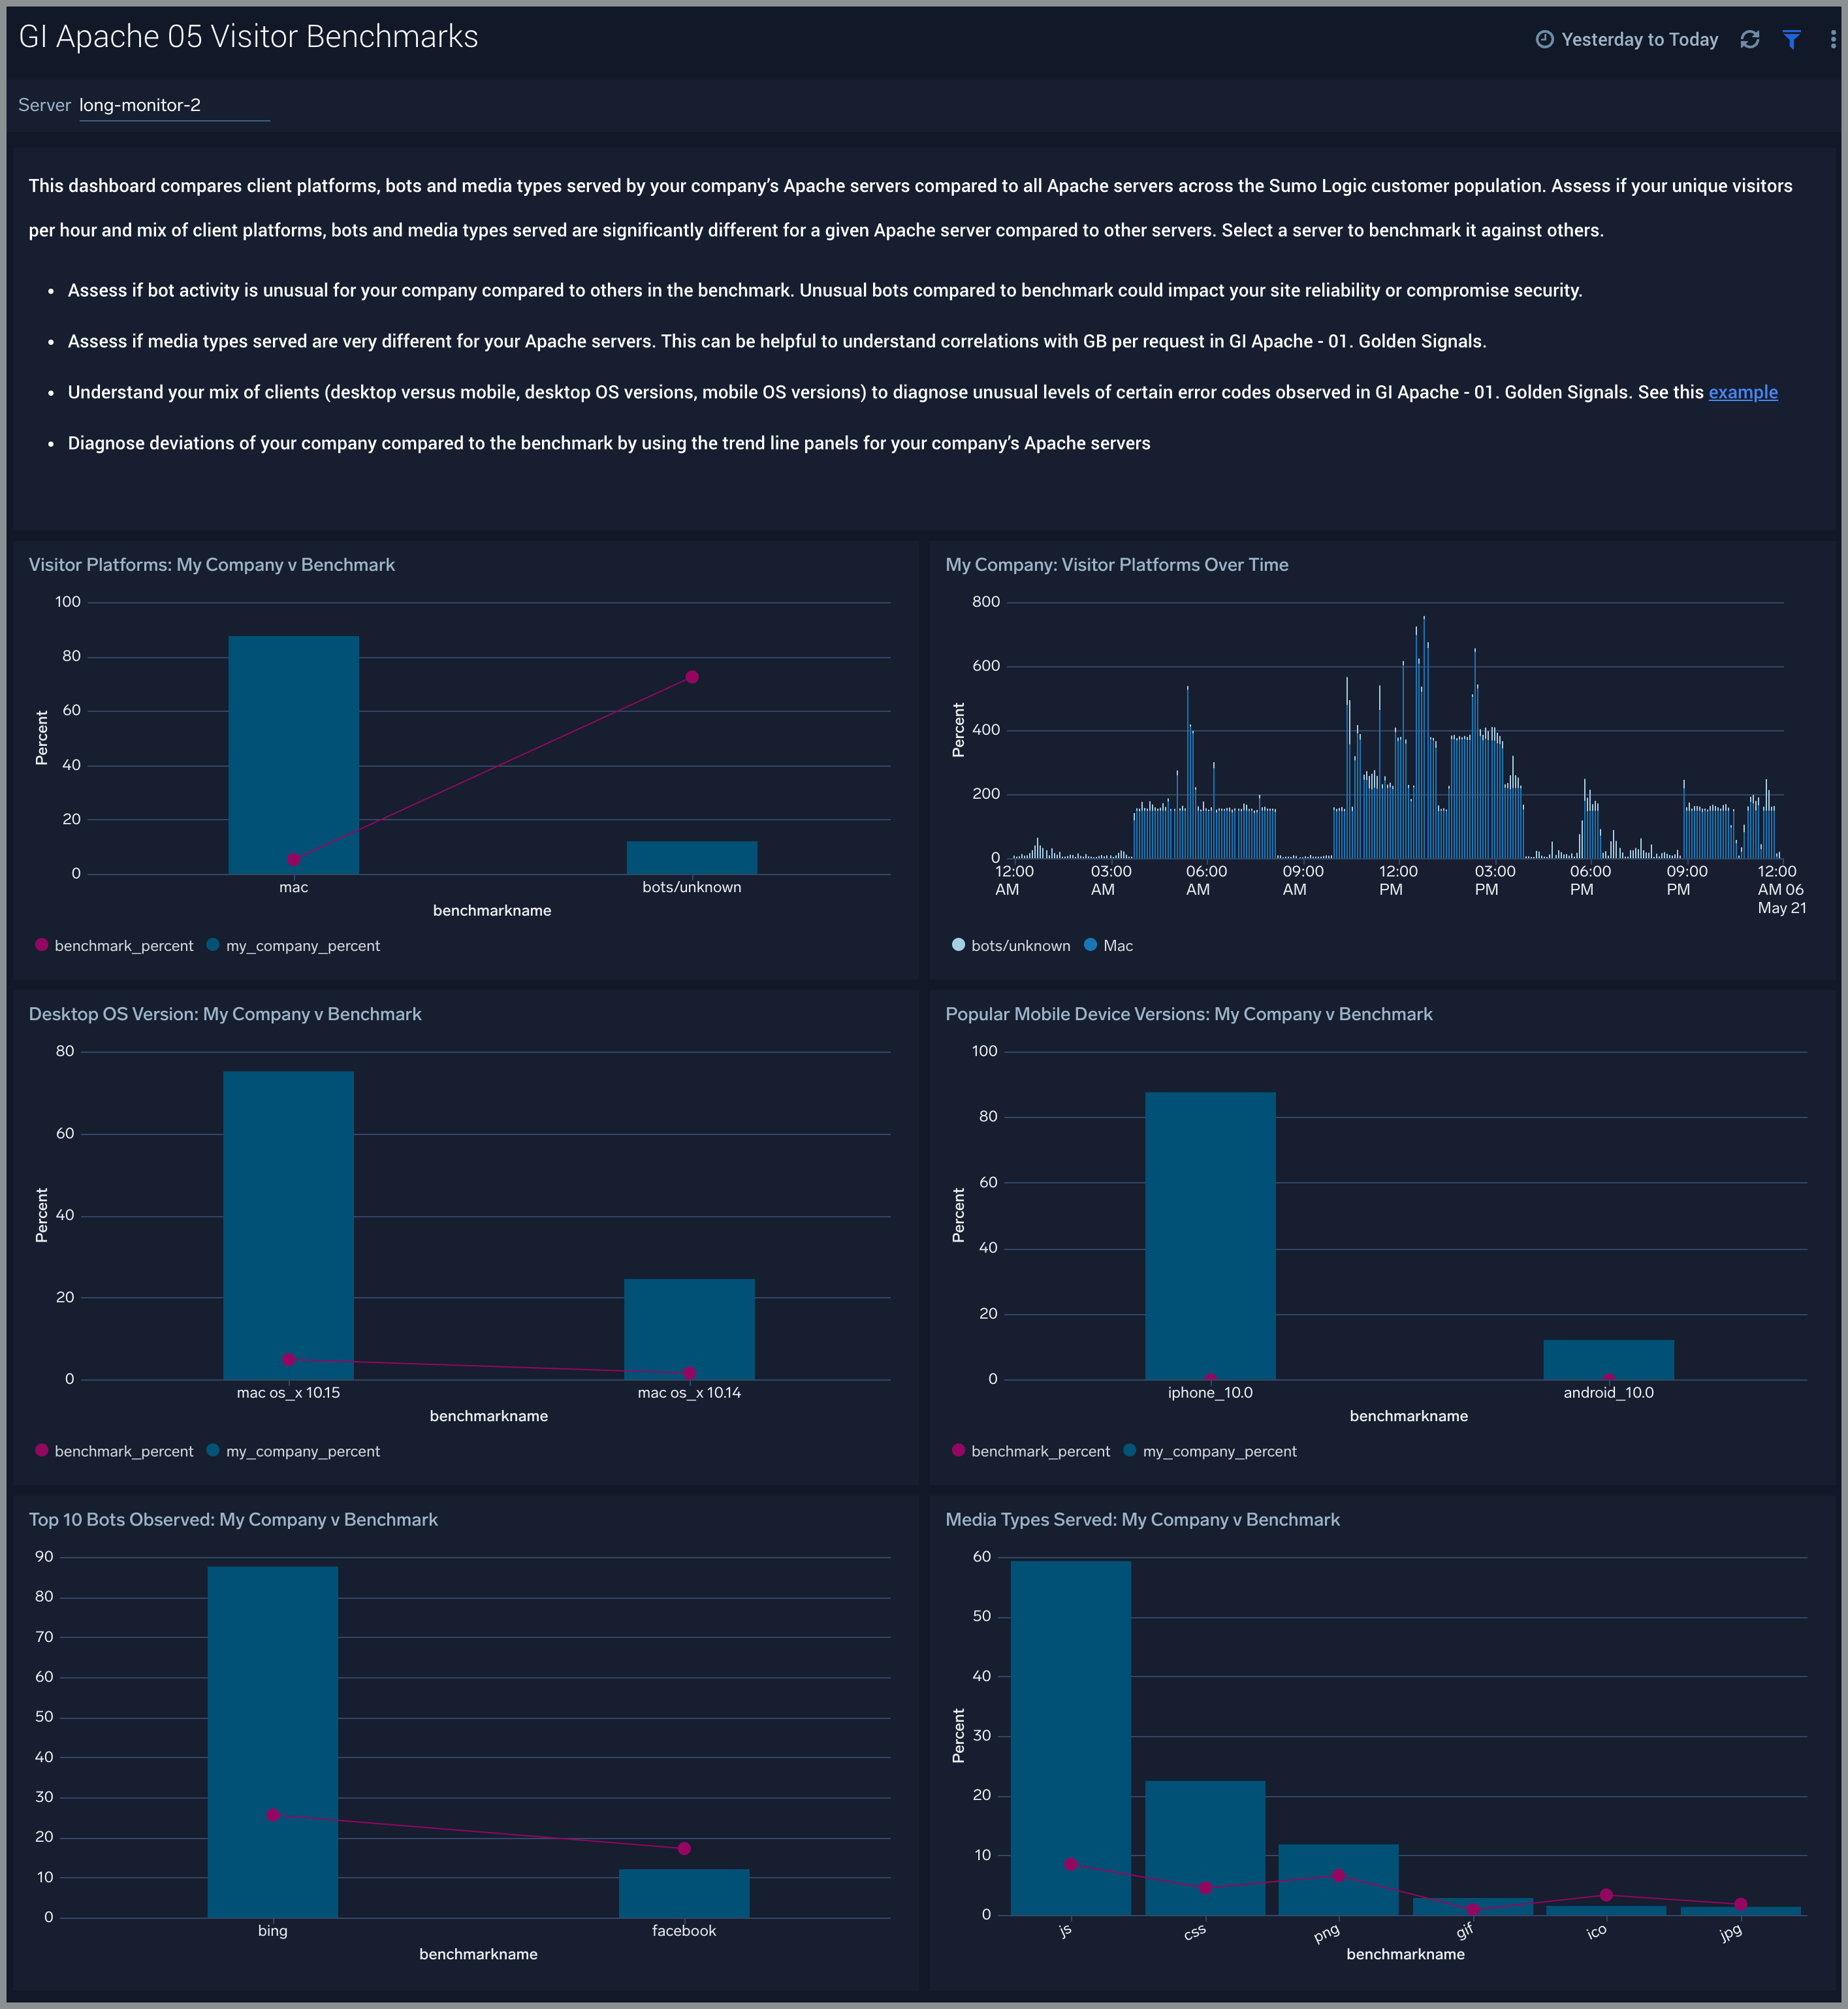
Visitor Benchmarks
The GI Apache - 05. Visitor dashboard compares client platforms, bots, and media types served by your company’s Apache servers compared to all Apache servers across the Sumo Logic server population.
Use this dashboard to:
- Assess if your mix of client platforms, bots, and media types served are significantly different for a given Apache server compared to other servers.
- Assess if bot activity is unusual for your company compared to others in the benchmark. Unusual bots compared to benchmarks could impact your site reliability or compromise security.
- Assess if media types served are very different for your Apache servers. This can be helpful to understand correlations with GB per request in GI Apache - 01. Load Signals and Contributing Factors.
- Understand your mix of clients (desktop versus mobile, desktop OS versions, mobile OS versions) to diagnose unusual levels of certain error codes observed in GI Apache - 01. Load Signals and Contributing Factors. See this example.
- Diagnose deviations of your company compared to the benchmark by using the trend line panels for your company’s Apache servers.
Upgrade/Downgrade the Global Intelligence for Apache app (Optional)
To update the app, do the following:
Next-Gen App: To install or update the app, you must be an account administrator or a user with Manage Apps, Manage Monitors, Manage Fields, Manage Metric Rules, and Manage Collectors capabilities depending upon the different content types part of the app.
- Select App Catalog.
- In the Search Apps field, search for and then select your app.
Optionally, you can identify apps that can be upgraded in the Upgrade available section. - To upgrade the app, select Upgrade from the Manage dropdown.
- If the upgrade does not have any configuration or property changes, you will be redirected to the Preview & Done section.
- If the upgrade has any configuration or property changes, you will be redirected to the Setup Data page.
- In the Configure section of your respective app, complete the following fields.
- Field Name. If you already have collectors and sources set up, select the configured metadata field name (eg _sourcecategory) or specify other custom metadata (eg: _collector) along with its metadata Field Value.
- Click Next. You will be redirected to the Preview & Done section.
Post-update
Your upgraded app will be installed in the Installed Apps folder and dashboard panels will start to fill automatically.
See our Release Notes changelog for new updates in the app.
To revert the app to a previous version, do the following:
- Select App Catalog.
- In the Search Apps field, search for and then select your app.
- To version down the app, select Revert to < previous version of your app > from the Manage dropdown.
Uninstalling the Global Intelligence for Apache app (Optional)
To uninstall the app, do the following:
- Select App Catalog.
- In the 🔎 Search Apps field, run a search for your desired app, then select it.
- Click Uninstall.