Global Intelligence for Nginx app
Availability
This feature is available in the following account plans.
| Account Type | Account Level |
|---|---|
| CloudFlex | Trial, Enterprise |
| Credits | Trial, Enterprise Operations, Enterprise Suite |
Nginx is a web server that is used as a reverse proxy, load balancer, mail proxy, and HTTP cache. Global Intelligence for Nginx, is a companion to the Nginx ULM application. It helps DevOps and infrastructure engineers to compare server, and user activity patterns associated with their Nginx servers against other Sumo Logic customer’s servers. Such comparisons can help diagnose potential load, throughput or error issues in Nginx clusters and avoid operational incidents arising from sub-optimal configurations of Nginx clusters.
| Dashboard | Description |
|---|---|
| GI Nginx - 01 Golden Signals | This dashboard compares golden signals of load (requests per second), throughput (responses by type) and errors for a company’s Nginx servers compared to other servers. Unusual levels of these signals compared to benchmarks can indicate configuration or operational issues. |
| GI Nginx - 02 Visitor Benchmarks | These panels compare unique visitor rates, bots and client platforms served by your company's Nginx servers versus Nginx servers of other companies to assess if unusual patterns in these indicators correlate with golden signals. |
Data sources
Global Intelligence for Nginx app uses logs data from Nginx clusters. Like the Sumo Logic app for Nginx, it assumes the NCSA extended/combined log file format for Access logs and the default Nginx error log file format for error logs. For more details on Nginx logs.
Sample queries
The following sample query is from the Average Requests Per Second: My Company v Benchmark panel of GI Nginx - 01 Golden Signals dashboard.
// id=@benchmark_requests_per_hr_sourceCategory=Labs/Nginx/Logs
| json auto maxdepth 1 nodrop
| if (isEmpty(log), _raw, log) as nginx_log_message
| parse regex field=nginx_log_message "(?<Client_Ip>\d{1,3}\.\d{1,3}\.\d{1,3}\.\d{1,3})"
| parse regex field=nginx_log_message|
"(?<Method>[A-Z]+)\s(?<URL>\S+)\sHTTP/[\d\.]+\"\s(?<Status_Code>\d+)\s(?<Size>[\d-]+)\s\"(?<Referrer>.*?)\"\s\"(?<User_Agent>.+?)\".*"
| where _sourceHost matches Client_Ip matches "*" and Method matches "*" and URL matches "*" and Status_Code matches "*" and Referrer matches "*"
| where size != "-"
| timeslice 1h
| count as hits by _timeslice
| hits/3600 as hits
| pct(hits, 50) as my_company_p50, pct(hits, 75) as my_company_p75
| "requests_per_sec" as benchmarkname
| infer _category=gislite _model=benchmark appname=nginx benchmarktype=numerical stat="p50,p75"
| benchmark_p75/3600 as benchmark_p75
| benchmark_p50/3600 as benchmark_p50
| max(my_company_p50) as my_company_p50, max(my_company_p75) as my_company_p75, max(benchmark_p75) as benchmark_p75, max(benchmark_p50) as benchmark_p50 by benchmarkname
Configuring Log Collection for Global Intelligence for Nginx
Follow the steps on the Sumo Logic Nginx app to configure the log collection for Global Intelligence for Nginx app.
Installing the Global Intelligence for Nginx app
To install the app, do the following:
Next-Gen App: To install or update the app, you must be an account administrator or a user with Manage Apps, Manage Monitors, Manage Fields, Manage Metric Rules, and Manage Collectors capabilities depending upon the different content types part of the app.
- Select App Catalog.
- In the 🔎 Search Apps field, run a search for your desired app, then select it.
- Click Install App.
note
Sometimes this button says Add Integration.
- Click Next in the Setup Data section.
- In the Configure section of your respective app, complete the following fields.
- Field Name. If you already have collectors and sources set up, select the configured metadata field name (eg _sourcecategory) or specify other custom metadata (eg: _collector) along with its metadata Field Value.
- Click Next. You will be redirected to the Preview & Done section.
Post-installation
Once your app is installed, it will appear in your Installed Apps folder, and dashboard panels will start to fill automatically.
Each panel slowly fills with data matching the time range query received since the panel was created. Results will not immediately be available but will be updated with full graphs and charts over time.
Viewing Global Intelligence for Nginx dashboards
All dashboards have a set of filters that you can apply to the entire dashboard. Use these filters to drill down and examine the data to a granular level.
- You can change the time range for a dashboard or panel by selecting a predefined interval from a drop-down list, choosing a recently used time range, or specifying custom dates and times. Learn more.
- You can use template variables to drill down and examine the data on a granular level. For more information, see Filtering Dashboards with Template Variables.
- Most Next-Gen apps allow you to provide the scope at the installation time and are comprised of a key (
_sourceCategoryby default) and a default value for this key. Based on your input, the app dashboards will be parameterized with a dashboard variable, allowing you to change the dataset queried by all panels. This eliminates the need to create multiple copies of the same dashboard with different queries.
GI Nginx - 01 Golden Signals
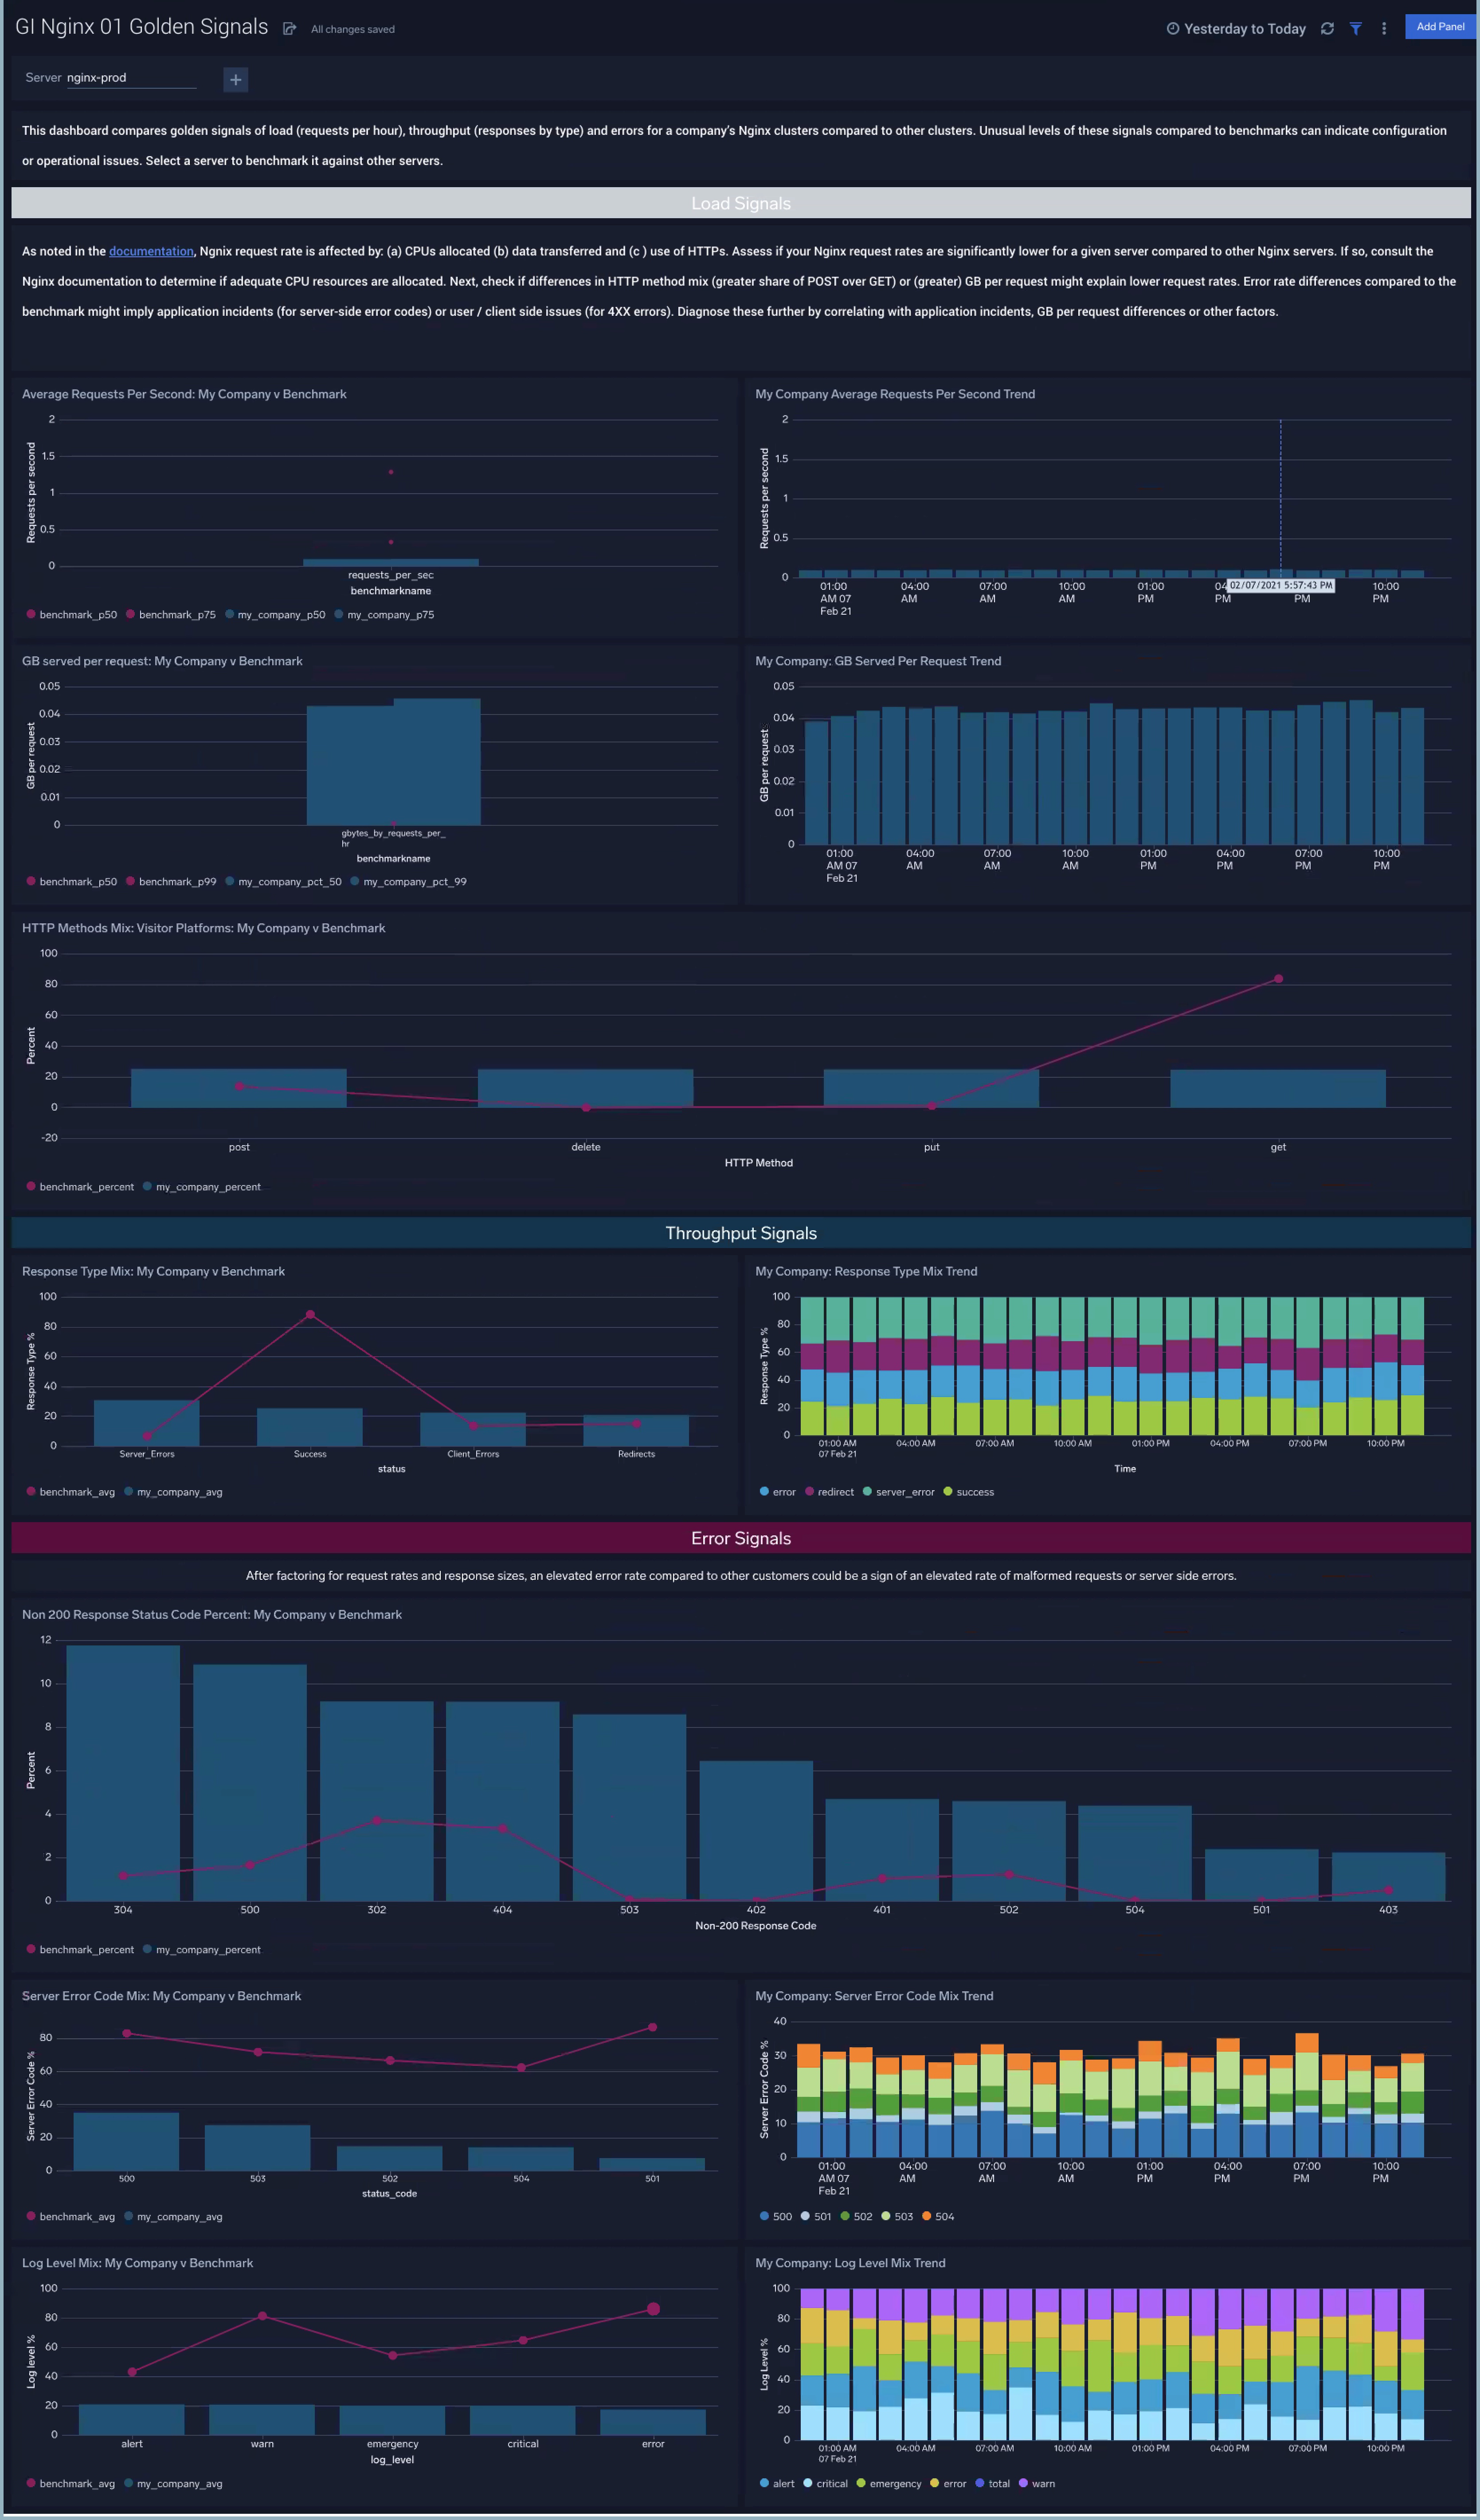
The GI Nginx - 01 Golden Signals dashboard tabulates requests per second, HTTP method mix, GB per request, response types (success, error, redirect) per request, and errors in your company’s Nginx servers and compares them to all servers from all customers. Filter results by nginx server to profile a given server against all Nginx servers in the Sumo Logic customer base. If your stats are different compared to the benchmark, it is a strong signal that your Nginx cluster’s load profile is different or is incorrectly provisioned compared to request load when compared to other customers. Refer to Testing the Performance of NGINX and NGINX Plus Web Servers to validate your nginx configuration relative to load configuration.
Use this dashboard to:
- Compare requests per second, HTTP method mix and GB per request along with response types, errors and log levels distribution for your company’s Nginx servers versus all servers.
- As noted here, Nginx request rate is affected by: (a) CPUs allocated (b) data transferred and (c) use of HTTPs. Assess if your Nginx request rates are significantly lower for a given server compared to other Nginx. If so, consult the Nginx documentation to determine if adequate CPU resources are allocated. Next, check if differences in HTTP method mix (greater share of POST over GET) or (greater) GB per request might explain lower request rates. Error rate differences compared to the benchmark might imply application incidents (for server-side error codes) or user / client side issues (for 4XX errors). Diagnose these further by correlating with application incidents, GB per request differences or other factors.
- Use the trend line panels for request rate, GB per request and errors to understand if your Nginx errors have a temporal pattern that might help explain differences compared to benchmarks.
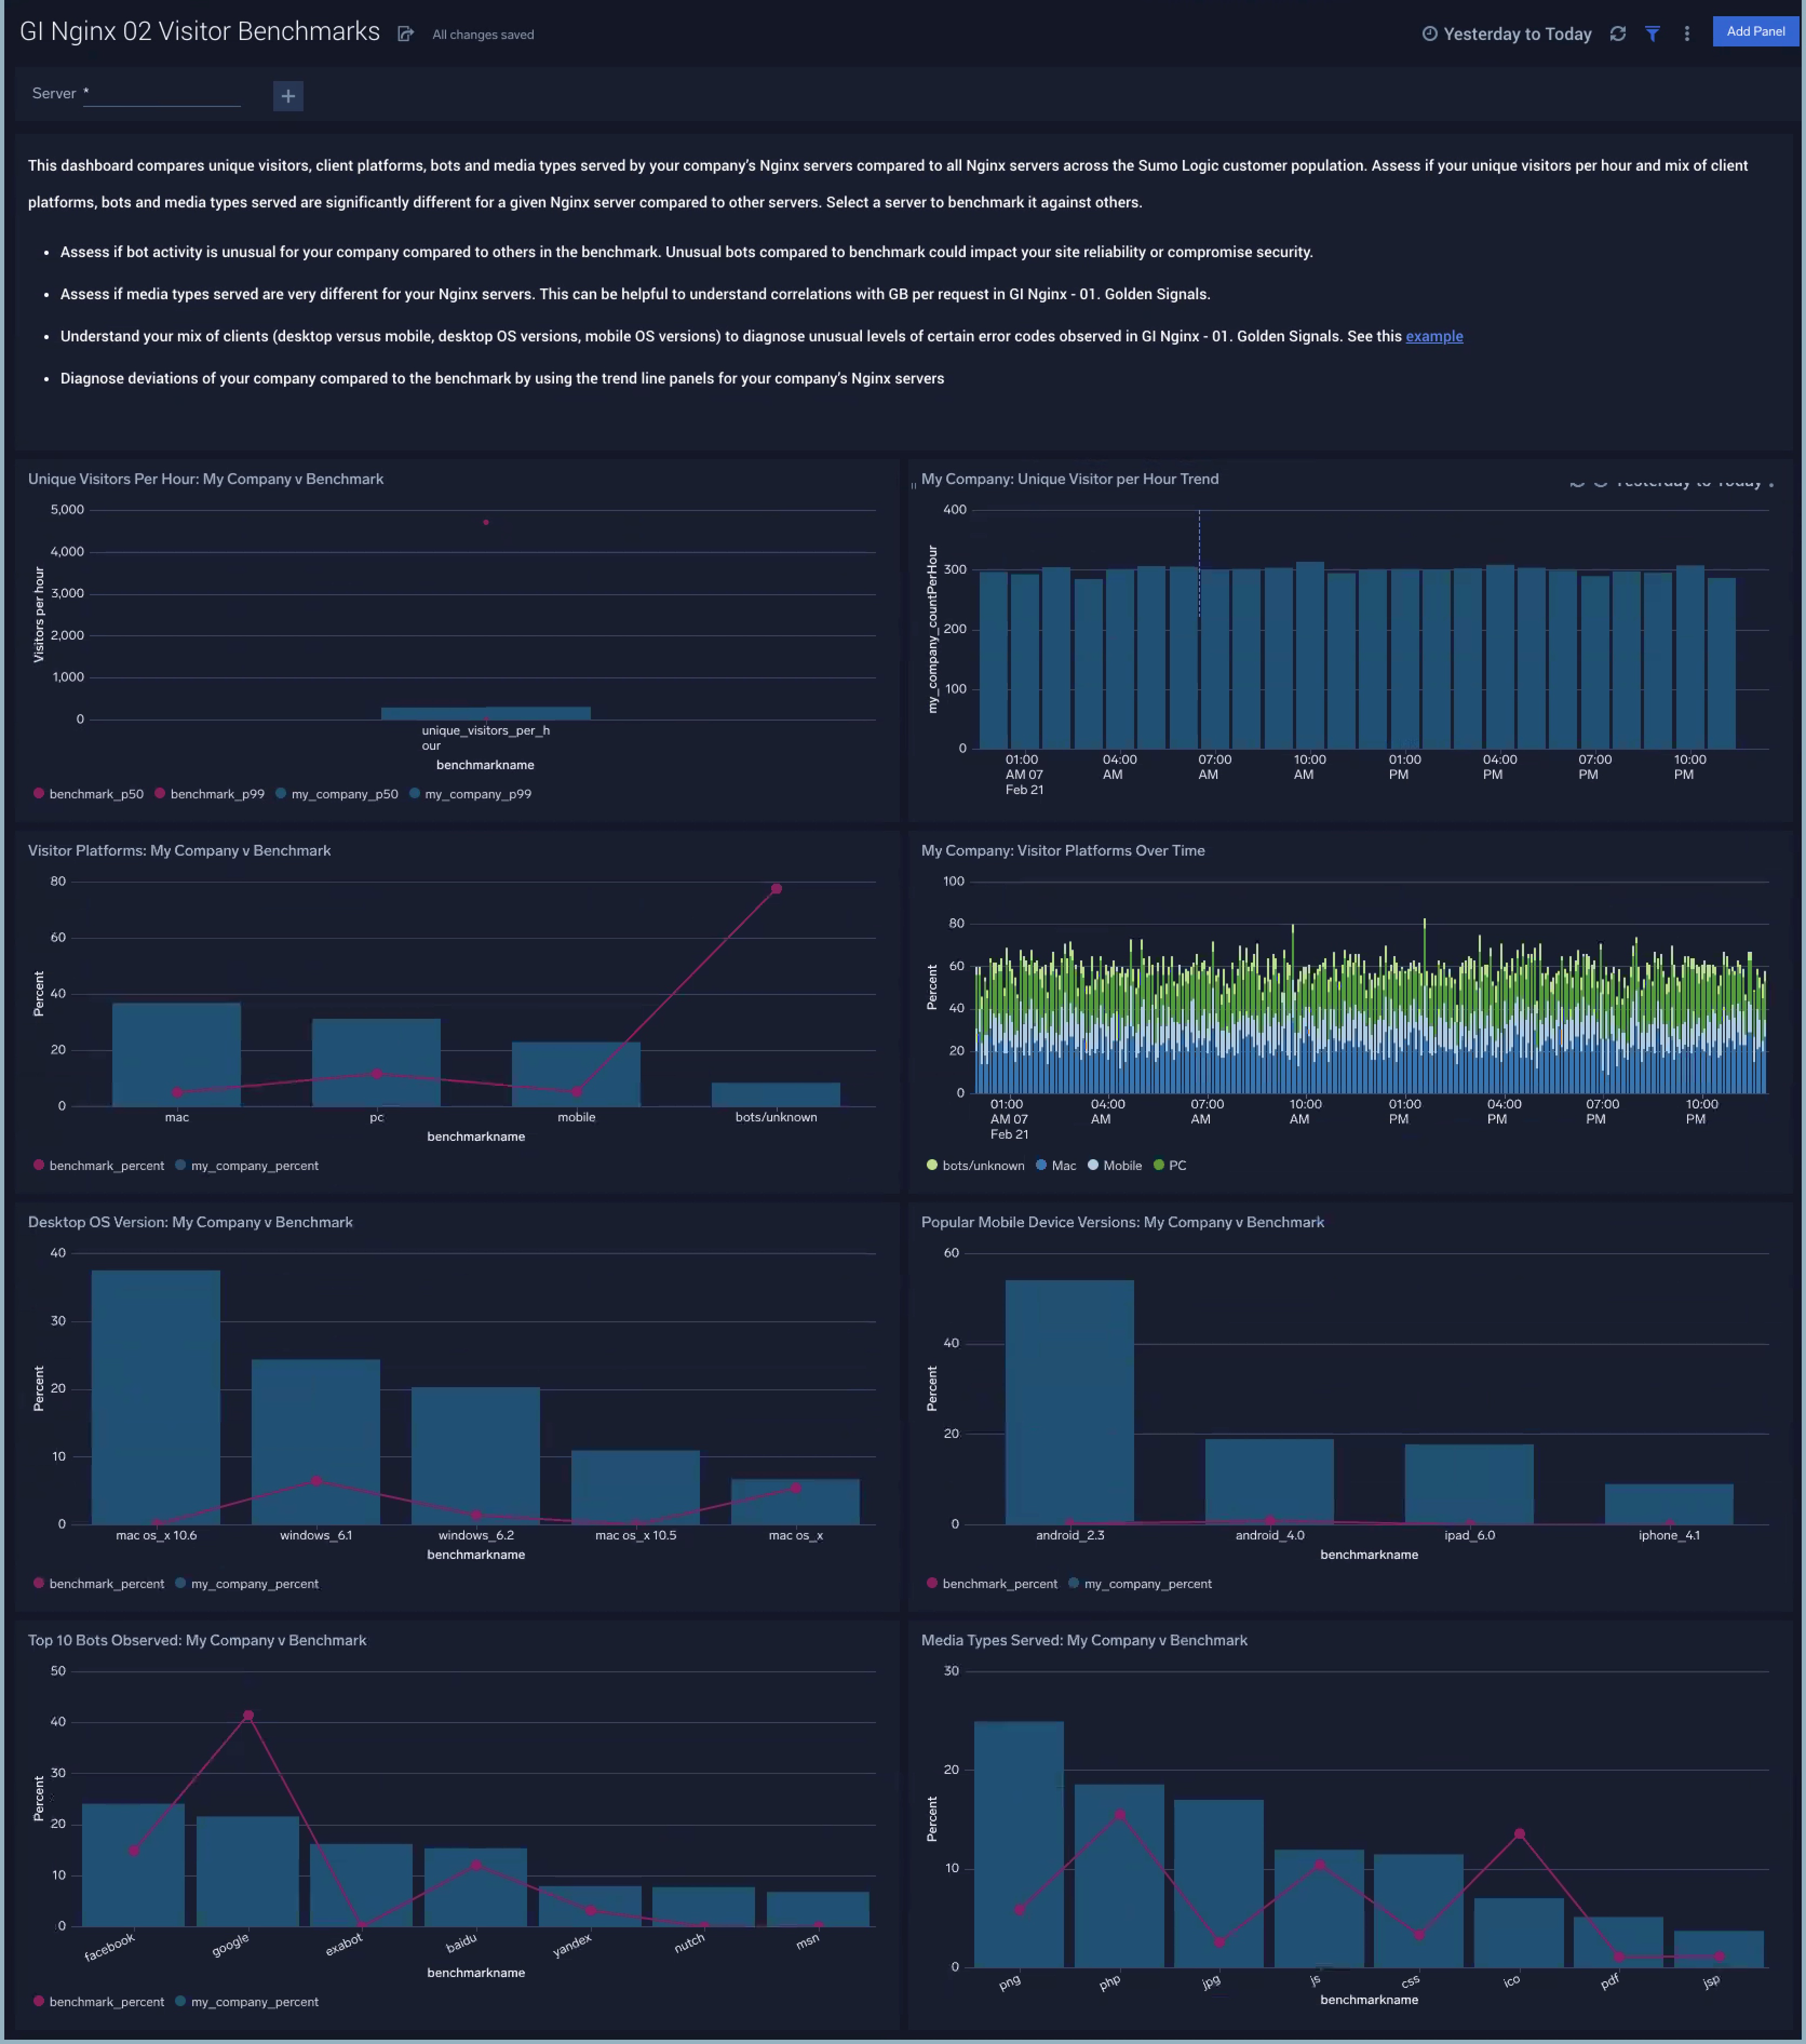
GI Nginx - 02 Visitor Benchmarks
The GI Nginx - 02 Visitor dashboard compares unique visitors, client platforms, bots and media types served by your company’s Nginx servers compared to all Nginx servers across the Sumo Logic customer population.
Use this dashboard to:
- Assess if your unique visitors per hour and mix of client platforms, bots and media types served are significantly different for a given Nginx server compared to other servers.
- Assess if bot activity is unusual for your company compared to others in the benchmark. Unusual bots compared to benchmark could impact your site reliability or compromise security.
- Assess if media types served are very different for your Nginx servers. This can be helpful to understand correlations with GB per request in GI Nginx - 01 Golden Signals.
- Understand your mix of clients (desktop versus mobile, desktop OS versions, mobile OS versions) to diagnose unusual levels of certain error codes observed in GI Nginx - 01 Golden Signals. See this example.
- Diagnose deviations of your company compared to the benchmark by using the trend line panels for your company’s Nginx servers
Upgrade/Downgrade the Global Intelligence for Nginx app (Optional)
To update the app, do the following:
Next-Gen App: To install or update the app, you must be an account administrator or a user with Manage Apps, Manage Monitors, Manage Fields, Manage Metric Rules, and Manage Collectors capabilities depending upon the different content types part of the app.
- Select App Catalog.
- In the Search Apps field, search for and then select your app.
Optionally, you can identify apps that can be upgraded in the Upgrade available section. - To upgrade the app, select Upgrade from the Manage dropdown.
- If the upgrade does not have any configuration or property changes, you will be redirected to the Preview & Done section.
- If the upgrade has any configuration or property changes, you will be redirected to the Setup Data page.
- In the Configure section of your respective app, complete the following fields.
- Field Name. If you already have collectors and sources set up, select the configured metadata field name (eg _sourcecategory) or specify other custom metadata (eg: _collector) along with its metadata Field Value.
- Click Next. You will be redirected to the Preview & Done section.
Post-update
Your upgraded app will be installed in the Installed Apps folder and dashboard panels will start to fill automatically.
See our Release Notes changelog for new updates in the app.
To revert the app to a previous version, do the following:
- Select App Catalog.
- In the Search Apps field, search for and then select your app.
- To version down the app, select Revert to < previous version of your app > from the Manage dropdown.
Uninstalling the Global Intelligence for Nginx app (Optional)
To uninstall the app, do the following:
- Select App Catalog.
- In the 🔎 Search Apps field, run a search for your desired app, then select it.
- Click Uninstall.