Google Cloud Load Balancing
Google Cloud Load Balancing is Google’s load balancing service for Google Cloud Platform. The Sumo Logic App for Google Cloud Load Balancing helps you monitor your Application load balancer activity. There are 3 types of Application load balancer available in GCP:
- Global External
- Regional External
- Internal
Each type of Application load balancer has its own set of log structure and metrics. To accommodate this, the app is organized into three folders, each containing dashboards specific to the respective load balancer type. The preconfigured dashboards provide insights into request locations and volume, response codes, and request and response data by load balancer with help for logs and metrics.
Log types
The Sumo Logic app for Google Cloud Load Balancer uses the following logs:
Metric types
The Sumo Logic app for Google Cloud Load Balancer uses the following three metrics:
- Global External. Metrics for this type are of the format "https/metric_name".
- Regional External. Metrics for this type are of the format "https/external/regional/metric_name".
- Internal. Metric for this type are of the format “https/internal/metric_name”.
Sample log messages
{"remoteIp":"98.243.249.133","requestUrl":"http:\/\/35.201.123.100\/","requestMethod":"POST","serverIp":"10.128.0.9","responseSize":"415","userAgent":"Mozilla\/5.0 (Windows NT 6.3; WOW64; Trident\/7.0; rv:11.0) like Gecko","requestSize":"1347","status":501}
Sample metric messages
{"queryId":"A","client_country":"Brazil","_source":"sumo GCP metric test","cloud.platform":"gcp_loadbalancing","_metricId":"K0zIDUIKXKkbaldwOnoVzw","backend_scope":"us-central1-c","raw_metric":"loadbalancing.googleapis.com/https/backend_latencies","url_map_name":"sumo-alb","_sourceName":"sumo GCP metric test","backend_scope_type":"ZONE","backend_target_type":"BACKEND_SERVICE","response_code":"200","backend_name":"instance-group-sumo","matched_url_path_rule":"UNMATCHED","proxy_continent":"America","_sourceCategory":"anrms/gcp/computeengine","_contentType":"GcpMetrics","load_balancing_scheme":"EXTERNAL","Statistic":"SampleCount","response_code_class":"200","cache_result":"DISABLED","project_id":"appdev-project-240622","metric":"https/backend_latencies","backend_type":"INSTANCE_GROUP","_collectorId":"000000000DFDF2E8","backend_target_name":"backend-service-sumo","region":"global","_sourceId":"000000004DEE1CBC","cloud.provider":"gcp","_sourceHost":"GCP","_collector":"sumoPrivate","protocol":"HTTP/1.1","forwarding_rule_name":"alb-frontend","target_proxy_name":"sumo-alb-target-proxy","max":4,"min":4,"avg":4,"sum":4,"latest":4,"count":1}
Sample logs queries
_sourceCategory=*gcp* data logName resource "\"type\":\"http_load_balancer\""
| parse regex "\"logName\":\"(?<log_name>[^\"]+)\""
| where log_name matches "projects/*/logs/requests"
| json "message.data.resource.labels", "message.data.httpRequest.status" as labels, status
| json field=labels "project_id", "zone", "url_map_name" as project, zone, load_balancer
| if(status matches "20*", 1, 0) as resp_200
| if(status matches "30*", 1, 0) as resp_300
| if(status matches "40*", 1, 0) as resp_400
| if(status matches "50*", 1, 0) as resp_500
| if(!(status matches "20*" or status matches "30*" or status matches "40*" or status matches "50*"), 1, 0) as resp_others
| sum(resp_200) as tot_200, sum(resp_300) as tot_300, sum(resp_400) as tot_400, sum(resp_500) as tot_500, sum(resp_others) as tot_others by load_balancer, project
Sample metric query
project_id=* region=global cloud.platform=gcp_loadbalancing url_map_name=* metric=https/backend_request_bytes_count statistic=average !url_map_name="" | quantize to 5m using sum | sum
Collect Logs for Google Cloud Load Balancing
This page describes the Sumo pipeline for ingesting logs from Google Cloud Platform (GCP) services, and provides instructions for collecting logs from Google Cloud Load Balancing.
Collection Process for GCP Services
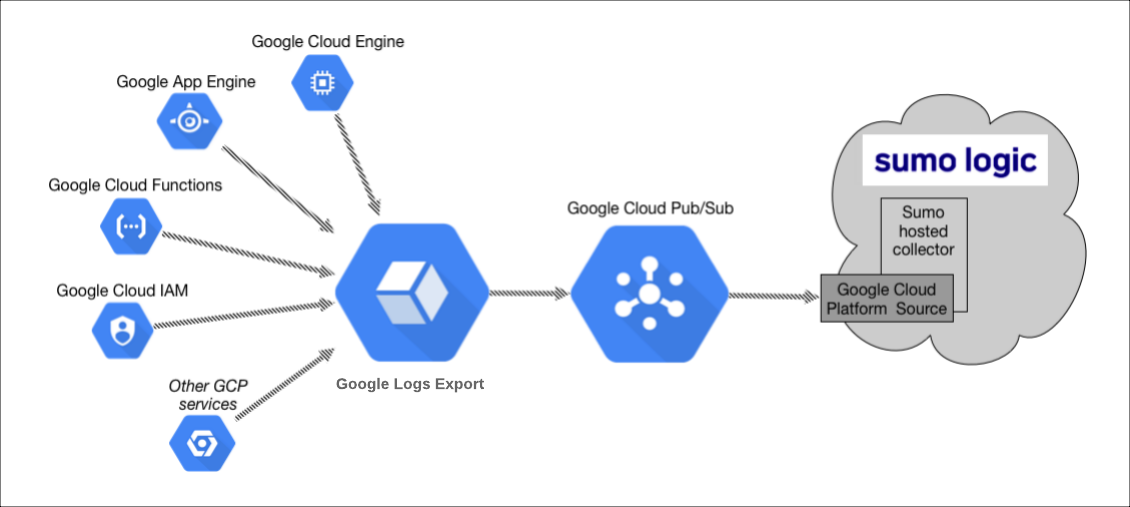
The key components in the collection process for GCP services are Google Logs Export, Google Cloud Pub/Sub, and Sumo’s Google Cloud Platform (GCP) source running on a hosted collector.
The GCP service generates logs which are exported and published to a Google Pub/Sub topic through Google Cloud Logging Log Router. You will then set up a Sumo Logic Google Cloud Platform source that subscribes to this topic and receives the exported log data.
Configuring collection for GCP
Configuring collection for GCP uses the following process:
- Configure a GCP source on a hosted collector. You'll obtain the HTTP URL for the source.
- Create a topic in Google Pub/Sub and subscribe the GCP source URL to that topic.
- Create an export of GCP logs from Google Log Router Logging. Exporting involves writing a filter that selects the log entries you want to export, and choosing a Pub/Sub as the destination. The filter and destination are held in an object called a sink.
See the following sections for configuration instructions.
Configure a Google Cloud Platform Source
The Google Cloud Platform (GCP) Source receives log data from Google Pub/Sub.
You can use the same GCP Source to receive log data from multiple GCP services. For example, you can send logs collected from Google Cloud Application Engine, Google Cloud IAM, and Google Cloud Audit.
However, this is not recommended since you cannot define specific Source Category values to each GCP service. If you create a GCP Source for each service you can define a specific Source Category to each service.
This Source will be a Google Pub/Sub-only Source, which means that it will only be usable for log data formatted as data coming from Google Pub/Sub.
- Classic UI. In the main Sumo Logic menu, select Manage Data > Collection > Collection.
New UI. In the Sumo Logic top menu select Configuration, and then under Data Collection select Collection. You can also click the Go To... menu at the top of the screen and select Collection. - Select an existing Hosted Collector upon which to add the Source. If you do not already have a Collector you'd like to use, create one, using the instructions on Configure a Hosted Collector.
- Click Add Source next to the Hosted Collector and click Google Cloud Platform.
- Enter a Name to display for the Source. A Description is optional.
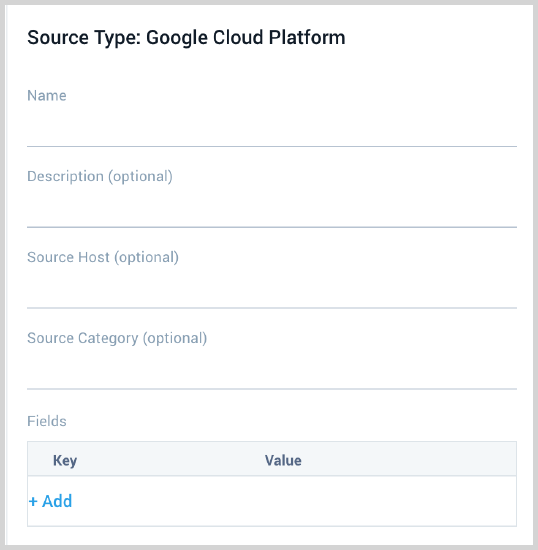
- Source Host (Optional). The Source Host value is tagged to each log and stored in a searchable metadata field called _sourceHost. Avoid using spaces so you do not have to quote them in keyword search expressions. This can be a maximum of 128 characters.
- Source Category (Optional). The Source Category value is tagged to each log and stored in a searchable metadata field called
_sourceCategory. See our Best Practices: Good Source Category, Bad Source Category. Avoid using spaces so you do not have to quote them in keyword search expressions. This can be a maximum of 1,024 characters. - Fields. Click the +Add Field link to add custom log metadata Fields, then define the fields you want to associate. Each field needs a name (key) and value. Look for one of the following icons and act accordingly:
 If an orange triangle with an exclamation point is shown, use the option to automatically add or enable the nonexistent fields before proceeding to the next step. The orange icon indicates that the field doesn't exist, or is disabled, in the Fields table schema. If a field is sent to Sumo that does not exist in the Fields schema or is disabled it is ignored, known as dropped.
 If a green circle with a checkmark is shown, the field exists and is already enabled in the Fields table schema. Proceed to the next step.
- Advanced Options for Logs.
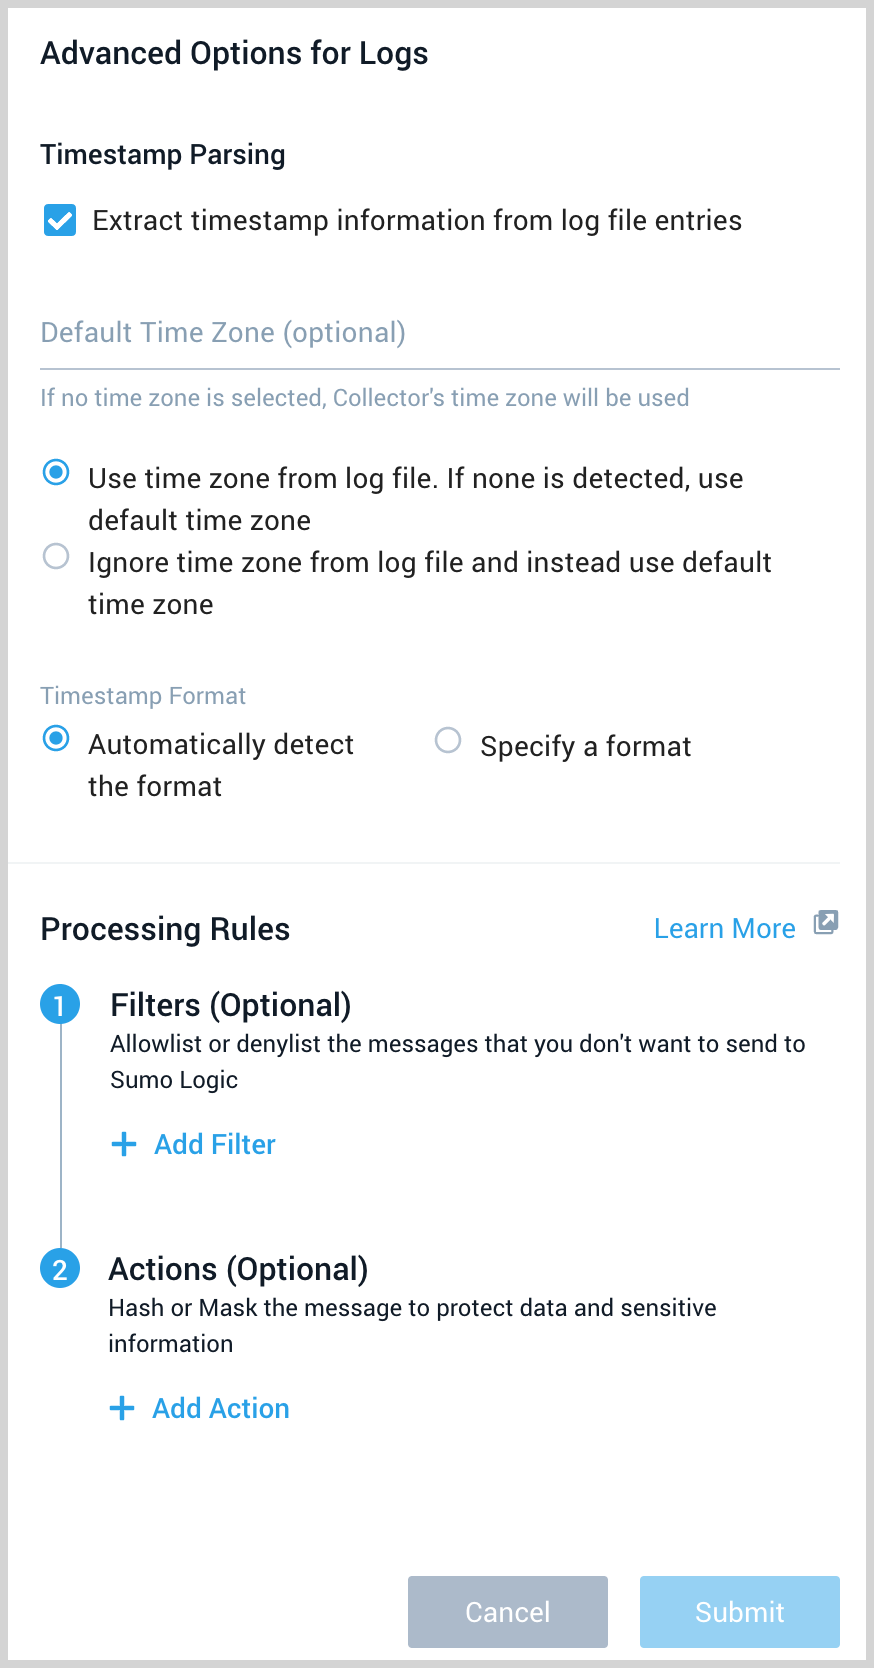
- Timestamp Parsing. This option is selected by default. If it's deselected, no timestamp information is parsed at all.
- Time Zone. There are two options for Time Zone. You can use the time zone present in your log files, and then choose an option in case time zone information is missing from a log message. Or, you can have Sumo Logic completely disregard any time zone information present in logs by forcing a time zone. It's very important to have the proper time zone set, no matter which option you choose. If the time zone of logs cannot be determined, Sumo Logic assigns logs UTC; if the rest of your logs are from another time zone your search results will be affected.
- Timestamp Format. By default, Sumo Logic will automatically detect the timestamp format of your logs. However, you can manually specify a timestamp format for a Source. See Timestamps, Time Zones, Time Ranges, and Date Formats for more information.
- Processing Rules. Configure any desired filters, such as allowlist, denylist, hash, or mask, as described in Create a Processing Rule.
- When you are finished configuring the Source, click Save.
Configure a Pub/Sub Topic for GCP
You need to configure a Pub/Sub Topic in GCP and add a subscription to the Source URL that belongs to the Sumo Logic Google Cloud Platform Source you created. Once you configure the Pub/Sub, you can export data from Google Logging to the Pub/Sub. For example, you can export Google App Engine logs, as described on Collect Logs for Google App Engine.
- Create a Pub/Sub Topic in GCP. Refer to the Google Cloud documentation for the latest configuration steps.
- Create a Pub/Sub subscription to the Source URL that belongs to the Sumo Logic Google Cloud Platform Source you created. See Google Cloud documentation for the latest configuration steps.
- Use a Push Delivery Method to the Sumo Logic Source URL. To determine the URL, navigate to the Source on the Collection page in Sumo Logic and click Show URL.
Limitations
Google limits the volume of data sent from a Topic. Our testing resulted in the following data limits:
| Topics | Megabytes per second | Payload size |
|---|---|---|
| One | 18 MBps (1.5 TB/day) | 100 KB |
| One | 6 MBps (0.5 TB/day) | 2.5 KB |
These limits may vary based on your setup and are based on our previous tests.
We recommend the following:
- Shard messages across topics within the above data limits.
- Ask GCP to increase the allowable capacity for the topic.
Create export of Google Cloud Load Balancing logs from Google Logging
In this step you export logs to the Pub/Sub topic you created in the previous step.
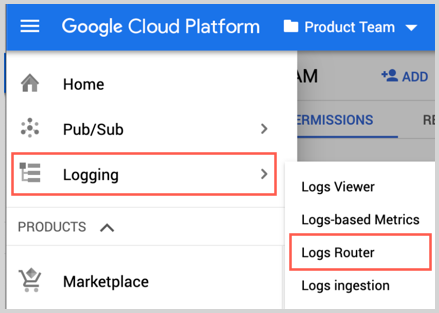
- Go to Logging and click Logs Router.
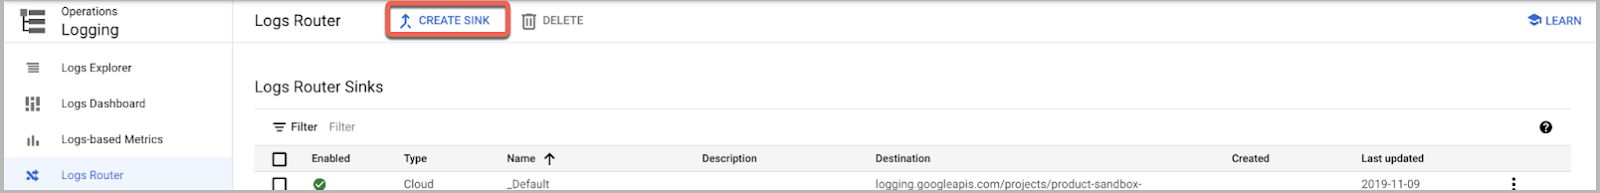
- Click Create Sink.
- As part of Create logs routing sink, add the following information.
- Enter a Sink Name. For example, "gcp-load-balance".
- Select "Cloud Pub/Sub" as the Sink Service.
- Set Sink Destination to the Pub/Sub topic you created in the Google Cloud Platform Source procedure. For example, "pub-sub-logs".
- In the Choose logs to include in sink section for
resource_type, use queryresource.type="http_load_balancer" OR resource.type="http_external_regional_lb_rule" OR resource.type="internal_http_lb_rule". Following are the three resource types for the different types of load balancers:
"http_load_balancer"- For global external application load balancer."http_external_regional_lb_rule"- For regional external application load balancer."internal_http_lb_rule"- For internal application load balancer.
You can include resource types associated with the load balancer that need to be monitored. 5. Click Create Sync.
By default, GCP logs are stored within Cloud Logging, but you can configure Log Router to exclude them as detailed here without affecting the export to Sumo Logic as outlined above.
Collecting metrics for the Google Cloud Load Balancer app
For metrics collection in Sumo Logic, use the GCP Metric source.
- Set up the Google Service Account.
- Set up a GCP Metric source in Sumo Logic. While setting up the source, select Cloud Load Balancer as the service from dropdown to get the Google Cloud function metrics.
Install the Google Cloud Load Balancing app
Now that you have set up collection for Google Cloud Load Balancing, install the Sumo Logic App to use the pre-configured searches and dashboards that provide visibility into your environment for real-time analysis of overall usage.
To install the app, do the following:
Next-Gen App: To install or update the app, you must be an account administrator or a user with Manage Apps, Manage Monitors, Manage Fields, Manage Metric Rules, and Manage Collectors capabilities depending upon the different content types part of the app.
- Select App Catalog.
- In the 🔎 Search Apps field, run a search for your desired app, then select it.
- Click Install App.
note
Sometimes this button says Add Integration.
- Click Next in the Setup Data section.
- In the Configure section of your respective app, complete the following fields.
- Field Name. If you already have collectors and sources set up, select the configured metadata field name (eg _sourcecategory) or specify other custom metadata (eg: _collector) along with its metadata Field Value.
- Click Next. You will be redirected to the Preview & Done section.
Post-installation
Once your app is installed, it will appear in your Installed Apps folder, and dashboard panels will start to fill automatically.
Each panel slowly fills with data matching the time range query received since the panel was created. Results will not immediately be available but will be updated with full graphs and charts over time.
Viewing Google Cloud Load Balancing dashboards
All dashboards have a set of filters that you can apply to the entire dashboard. Use these filters to drill down and examine the data to a granular level.
- You can change the time range for a dashboard or panel by selecting a predefined interval from a drop-down list, choosing a recently used time range, or specifying custom dates and times. Learn more.
- You can use template variables to drill down and examine the data on a granular level. For more information, see Filtering Dashboards with Template Variables.
- Most Next-Gen apps allow you to provide the scope at the installation time and are comprised of a key (
_sourceCategoryby default) and a default value for this key. Based on your input, the app dashboards will be parameterized with a dashboard variable, allowing you to change the dataset queried by all panels. This eliminates the need to create multiple copies of the same dashboard with different queries.
Under the installed app folder, you will see different folders for different types of Application load balancers named as follows:
- Global External
- Internal
- Regional External
Each folder has its own set of dashboard based on respective logs and metrics.
For log-based dashboards, filters are based metric values. In metrics load balancers, the names for regional external and internal load balancer are prefixed with "URL_MAP". Panel queries are adjusted accordingly, ensuring filters functions as expected.
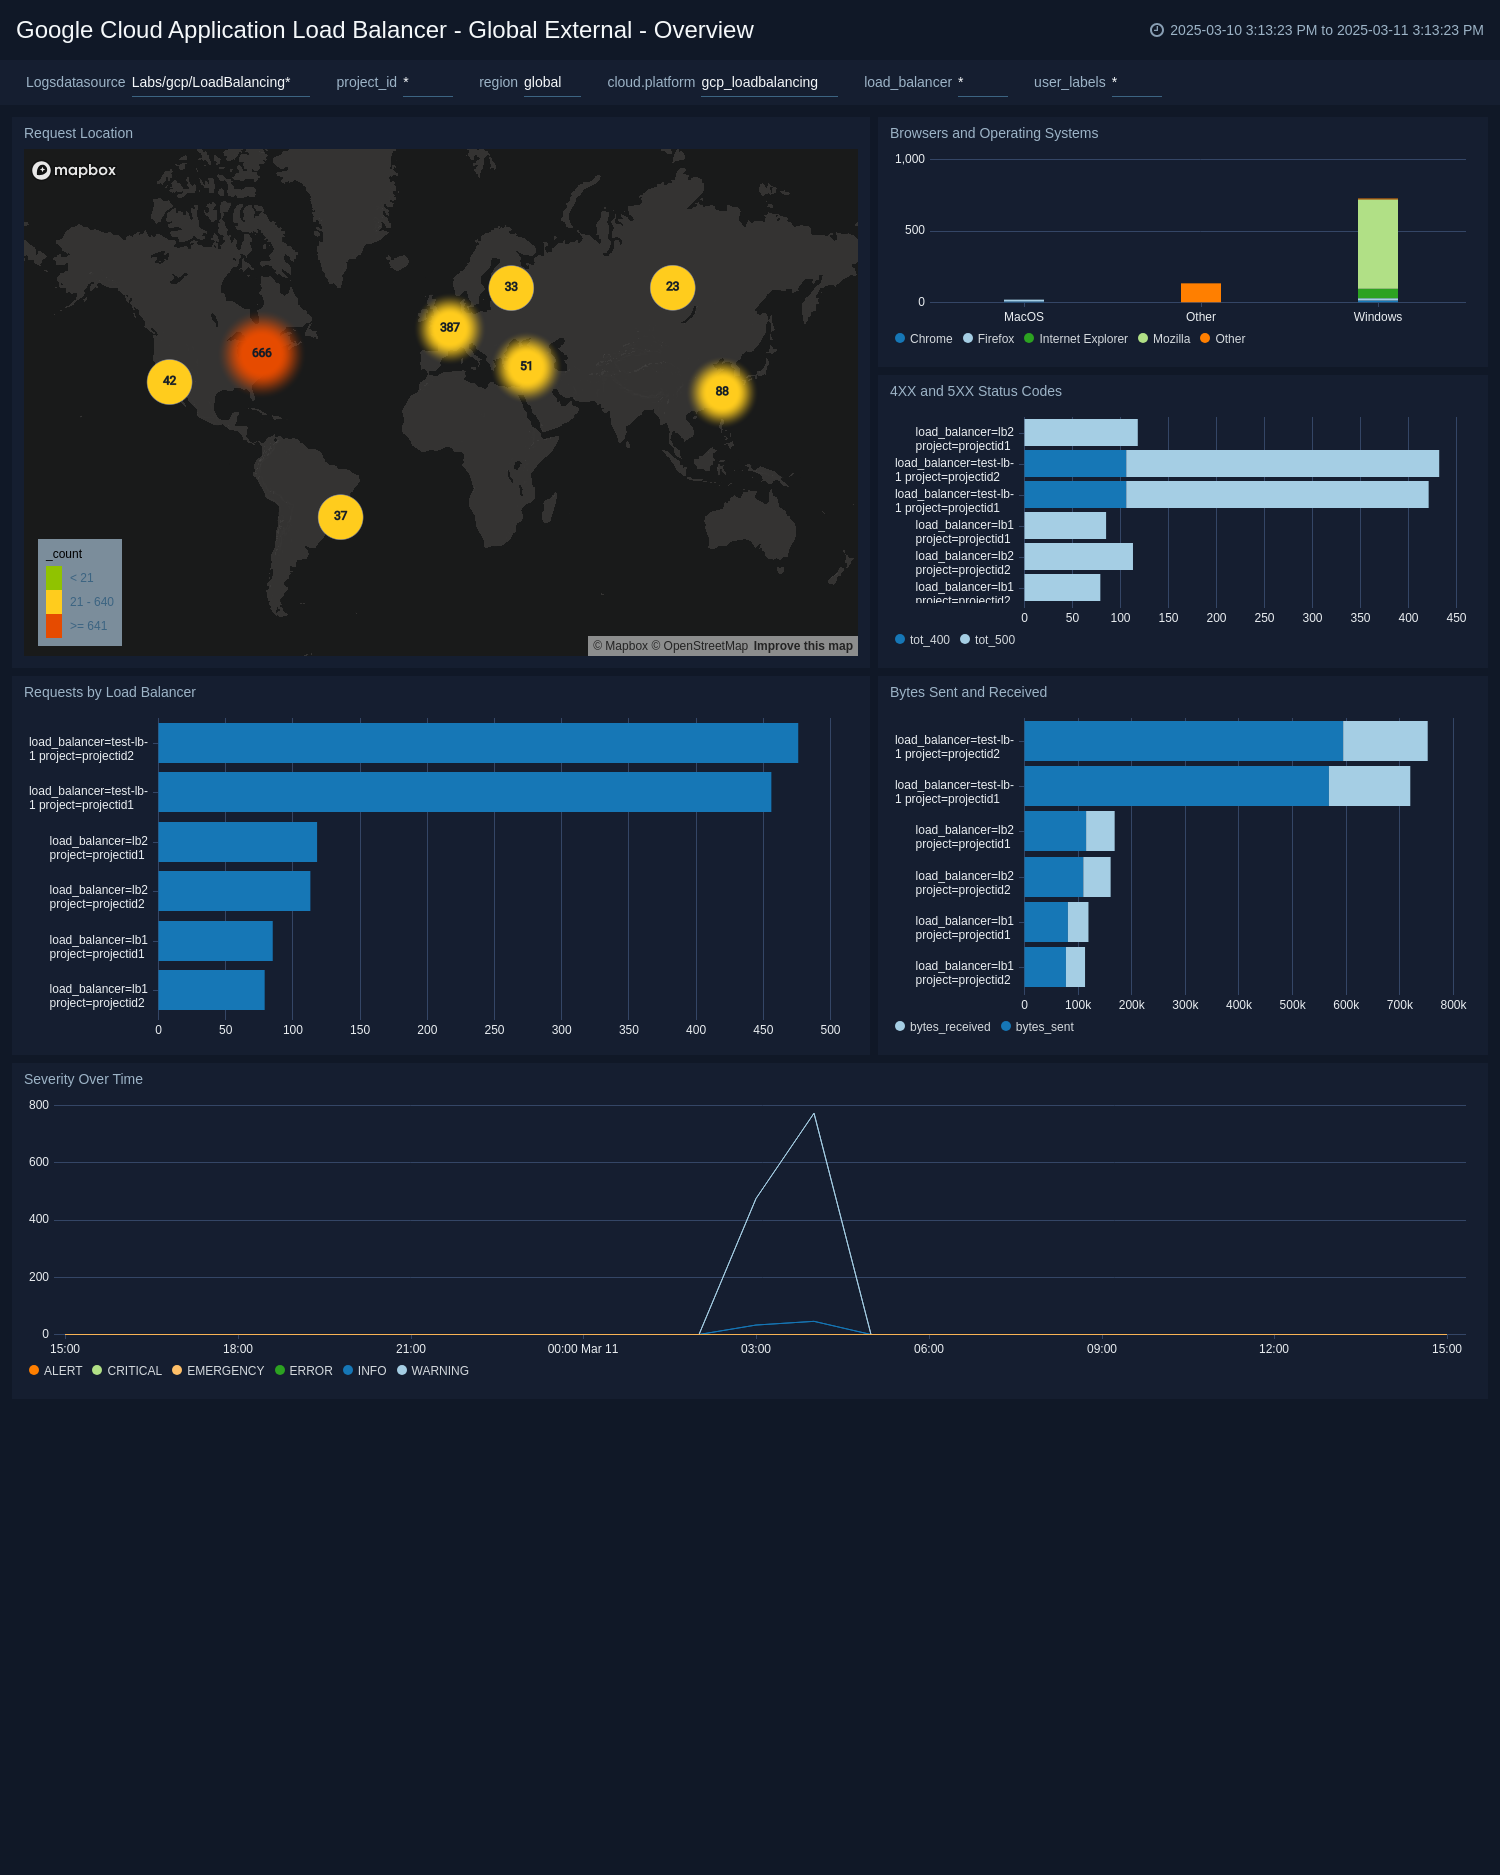
Global External - Overview
See an overview of Google Cloud Load Balancing activity, including request locations, browsers and operating systems used, error status codes, requests by load balancer, bytes sent and received, and message severity over time.
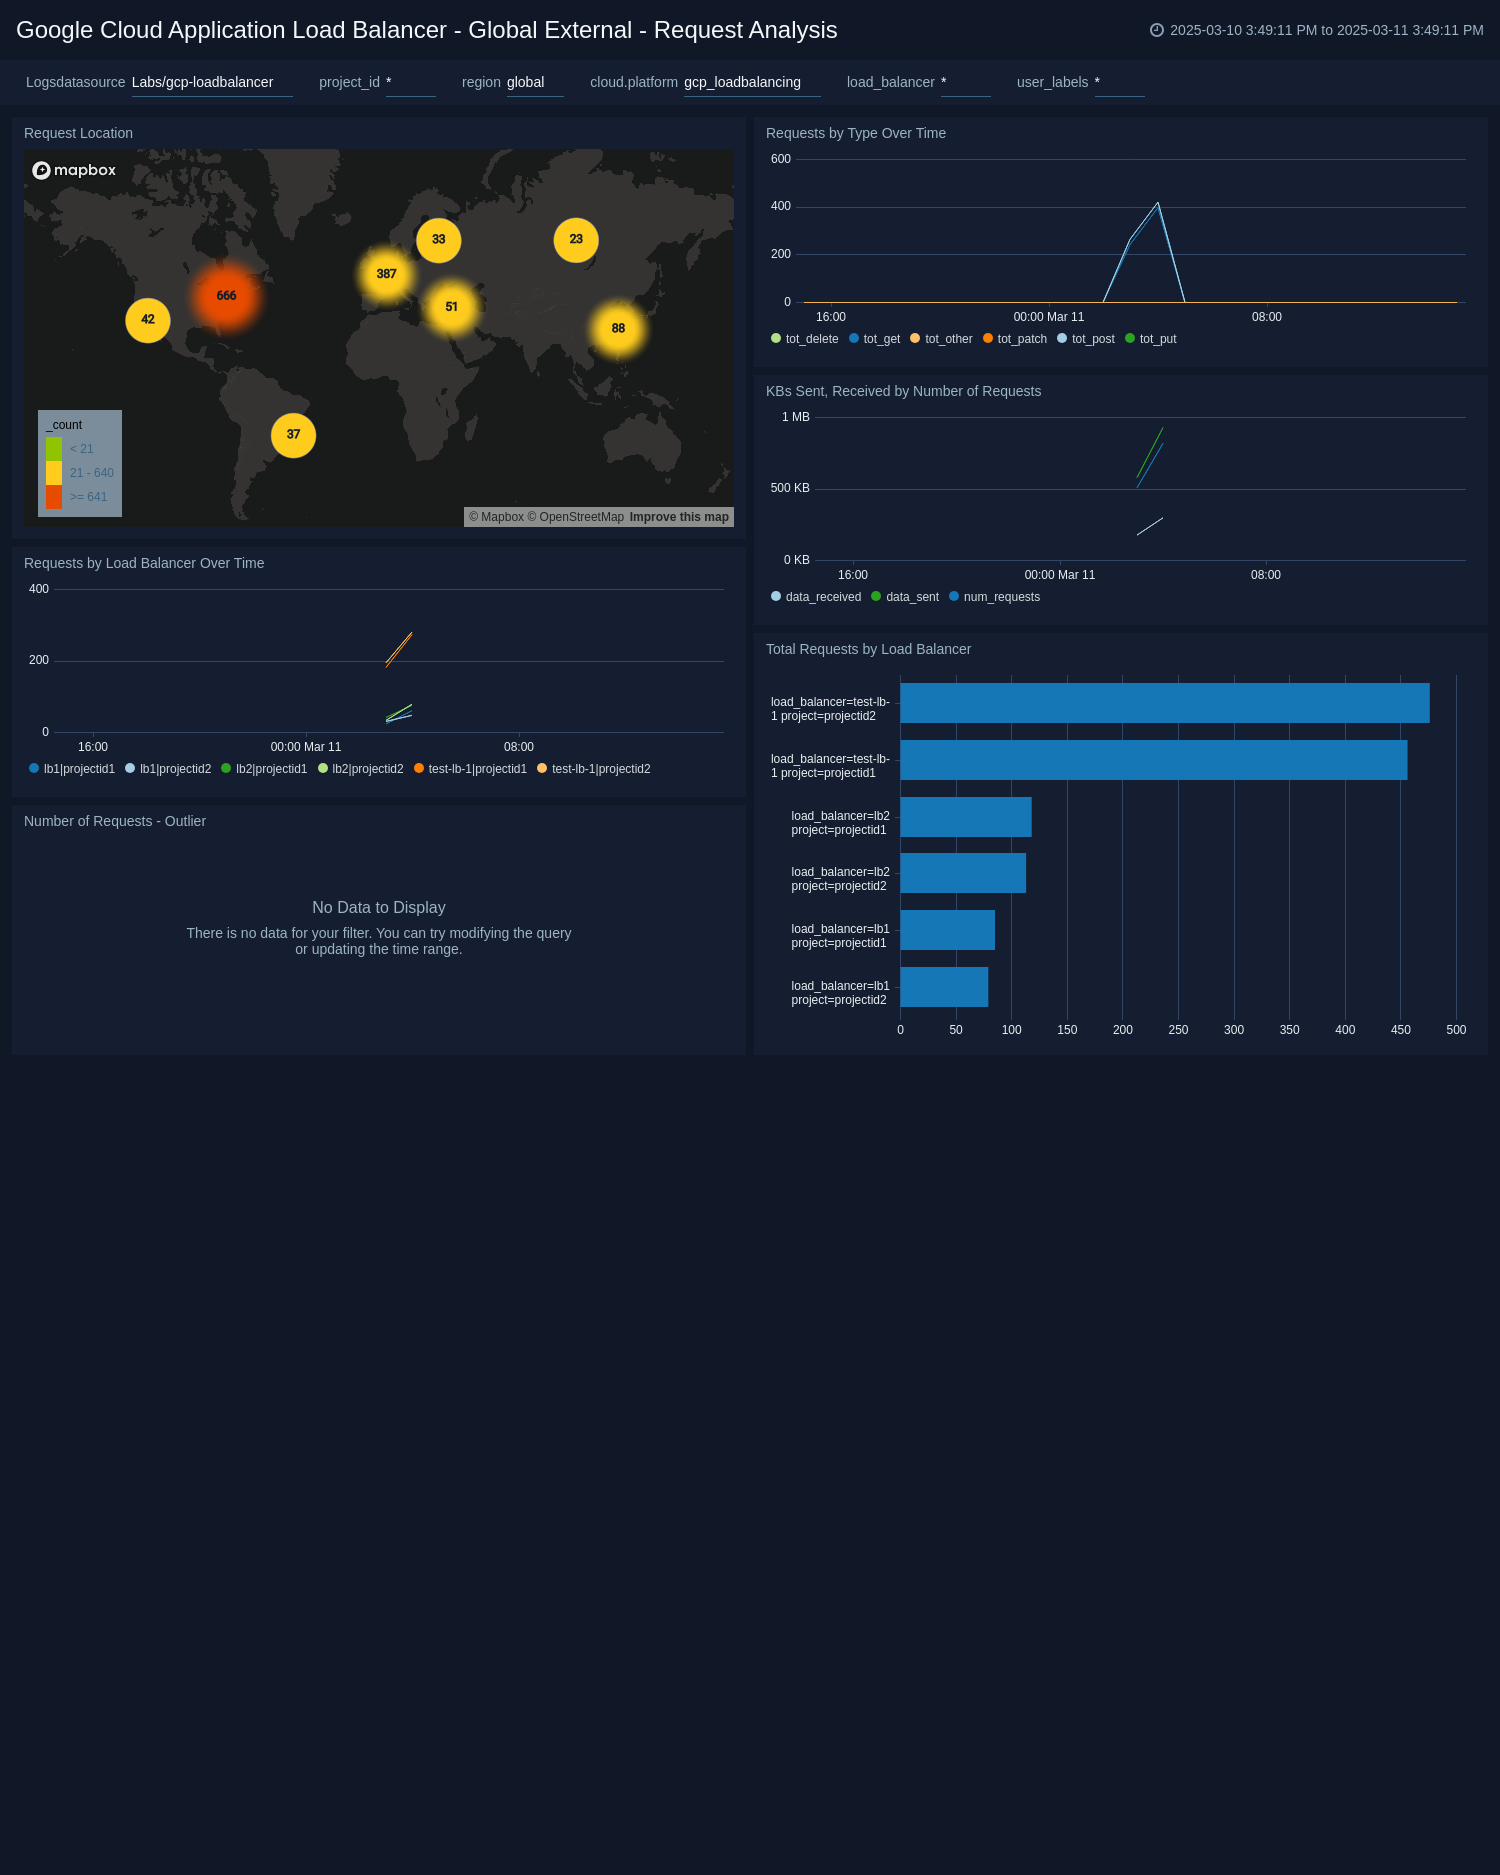
Global External - Request Analysis
See information about request activity in Google Cloud Load Balancing, including request locations, requests by type over time, requests by load balancer over time, KBs sent and received by number of requests, and total requests by load balancer.
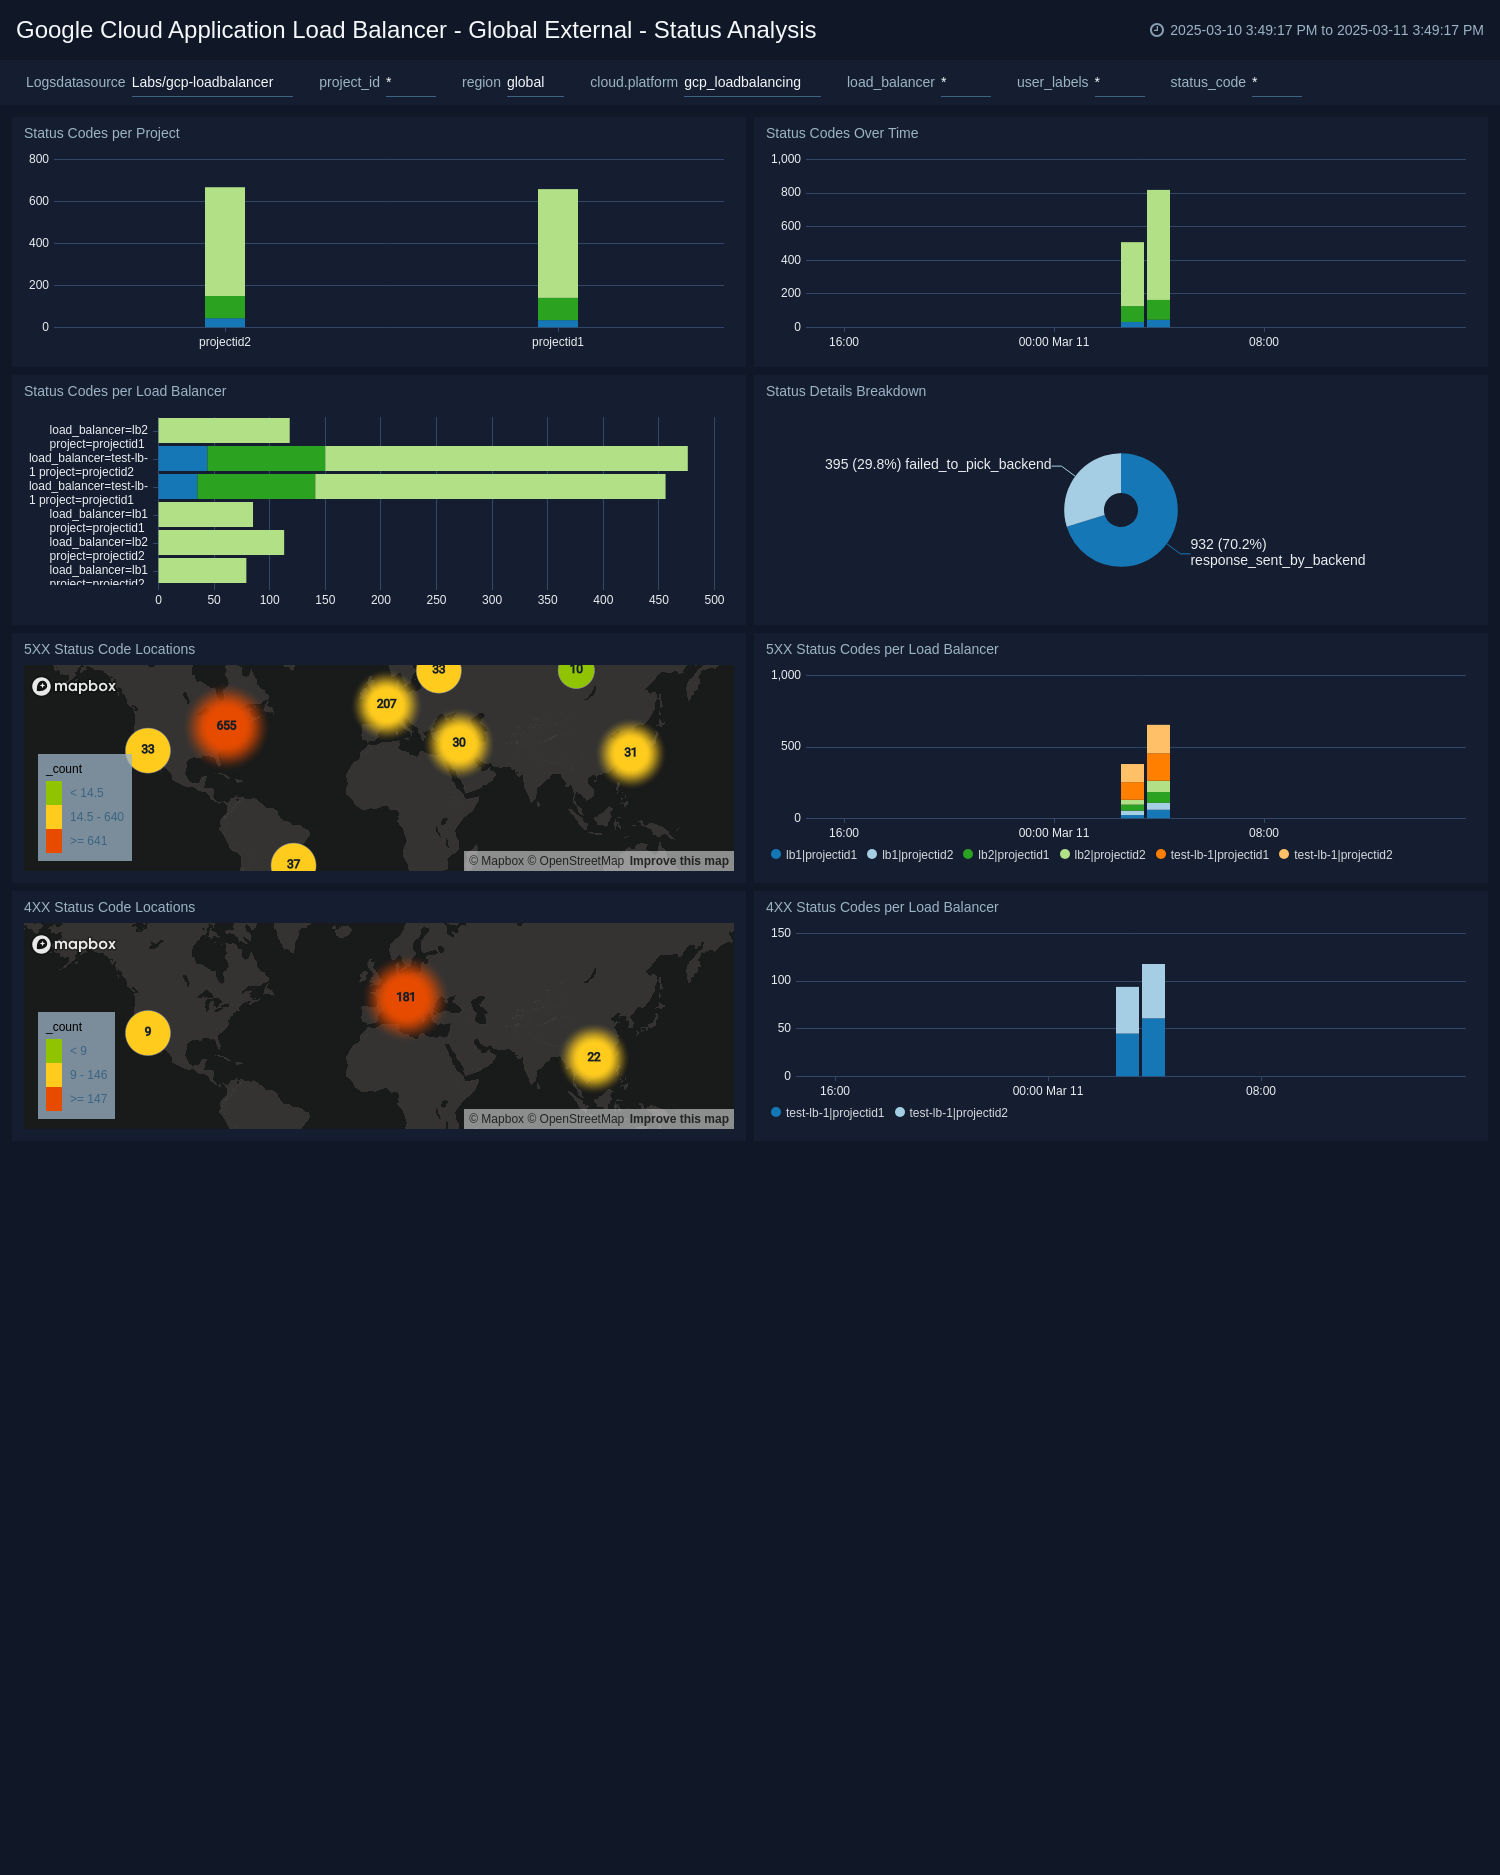
Global External - Status Analysis
See information about the status of requests in Google Cloud Load Balancing, including status codes per project, over time, and by load balancer; location of 4xx and 5xx responses; and 4xx and 5xx responses by load balancer.
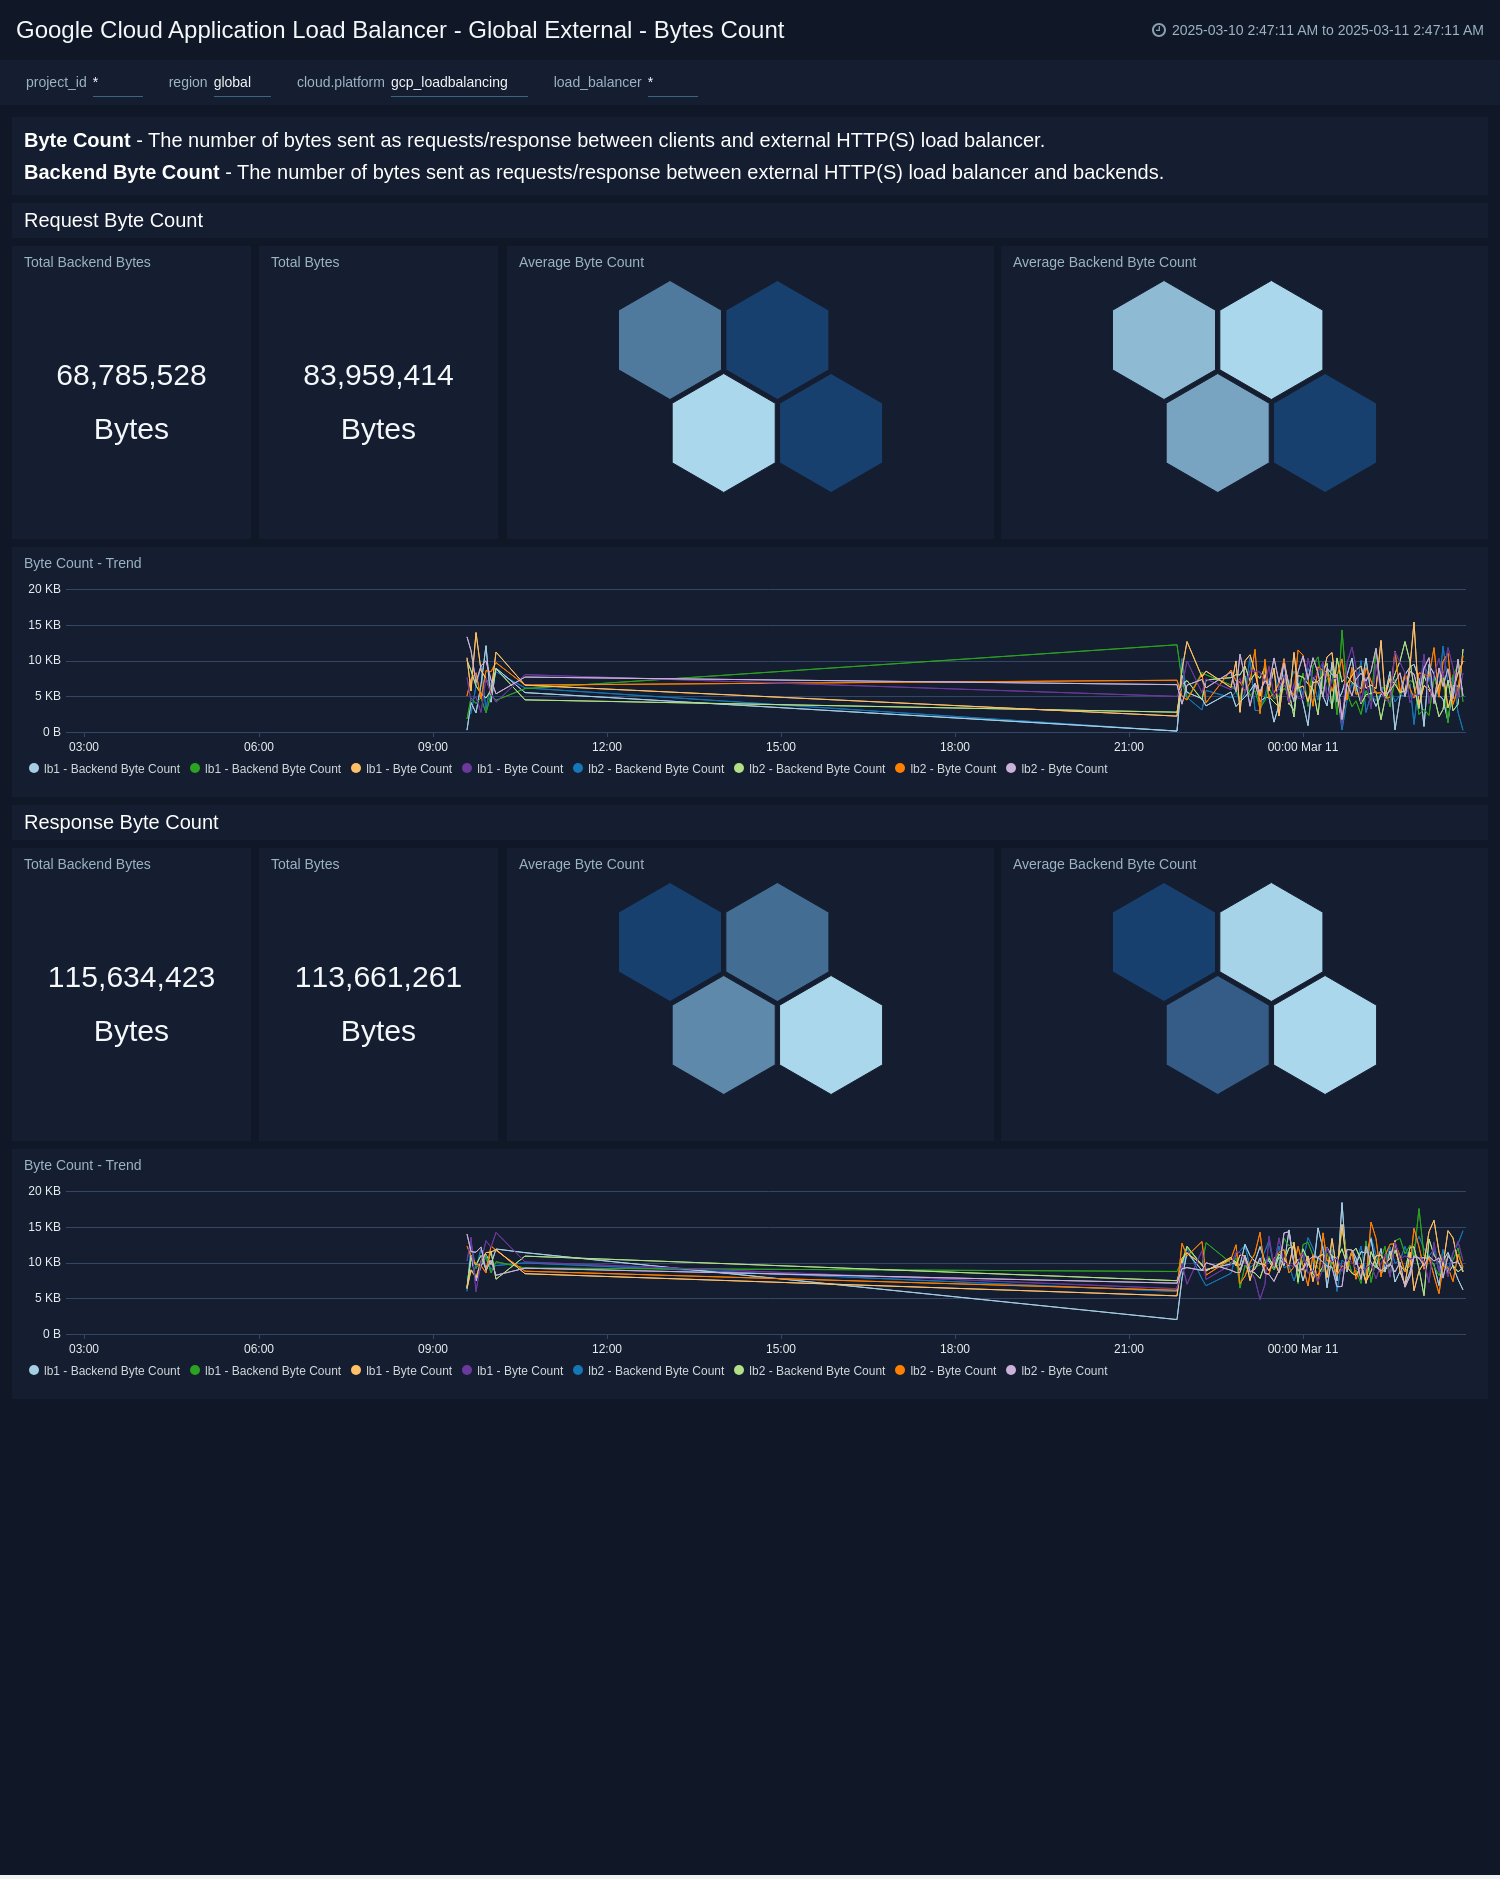
Global External - Bytes count
This dashboard help you monitor Byte Count between client- load balancer and load balancer - backend. You can monitor total bytes, average bytes and trend for request and response.
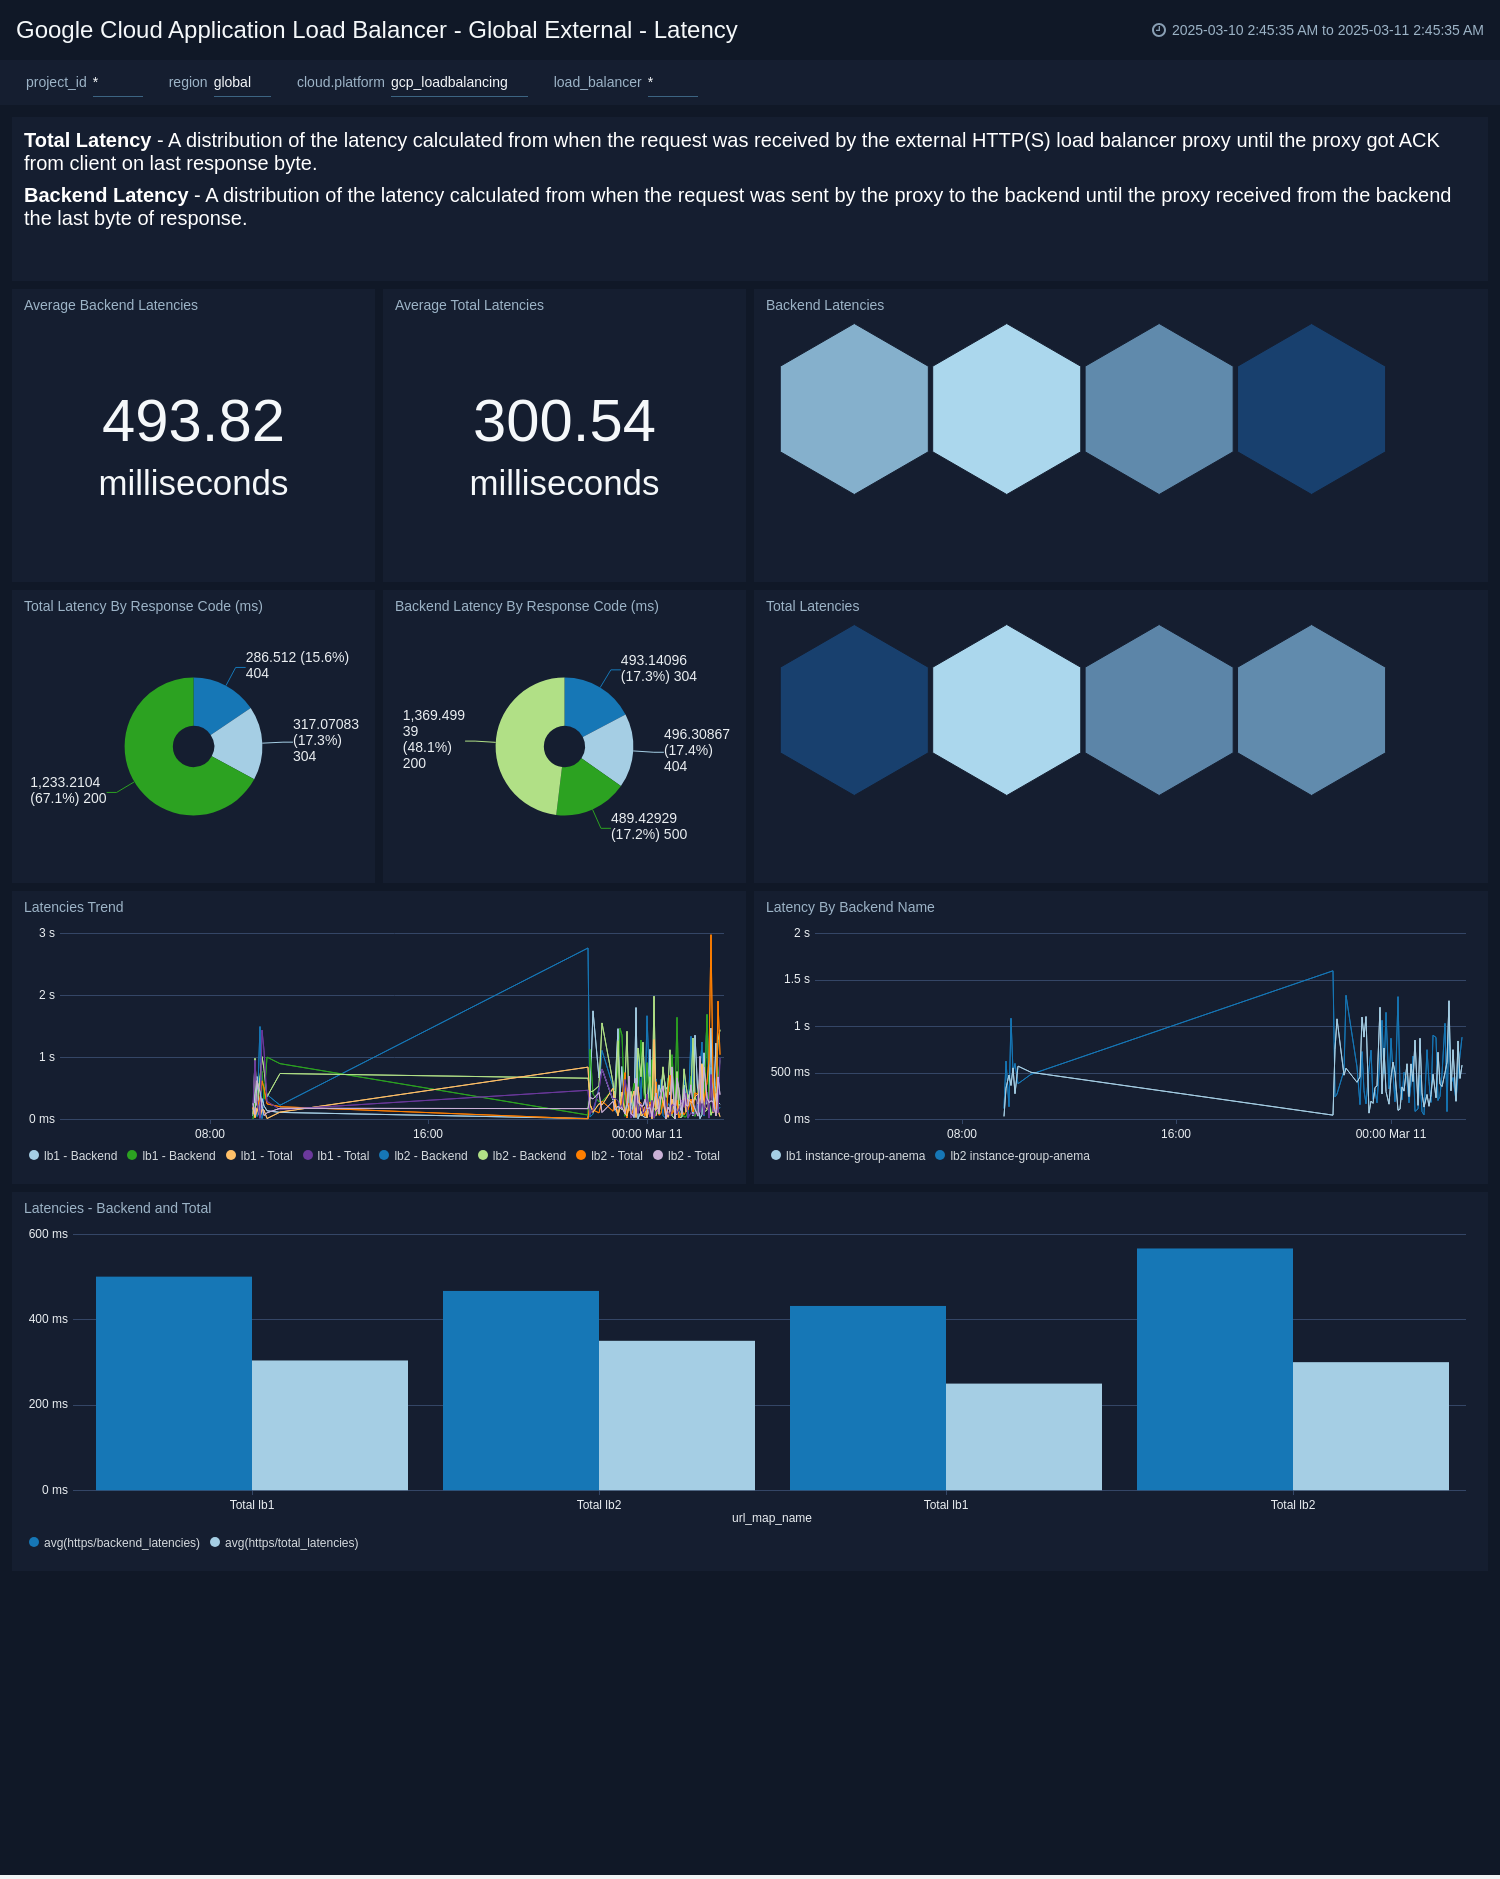
Global External - Latency
This dashboard helps you monitor average latency between client- load balancer and load balancer - backend. You can also monitor latency by response code, latency trends and latency by load balancer.
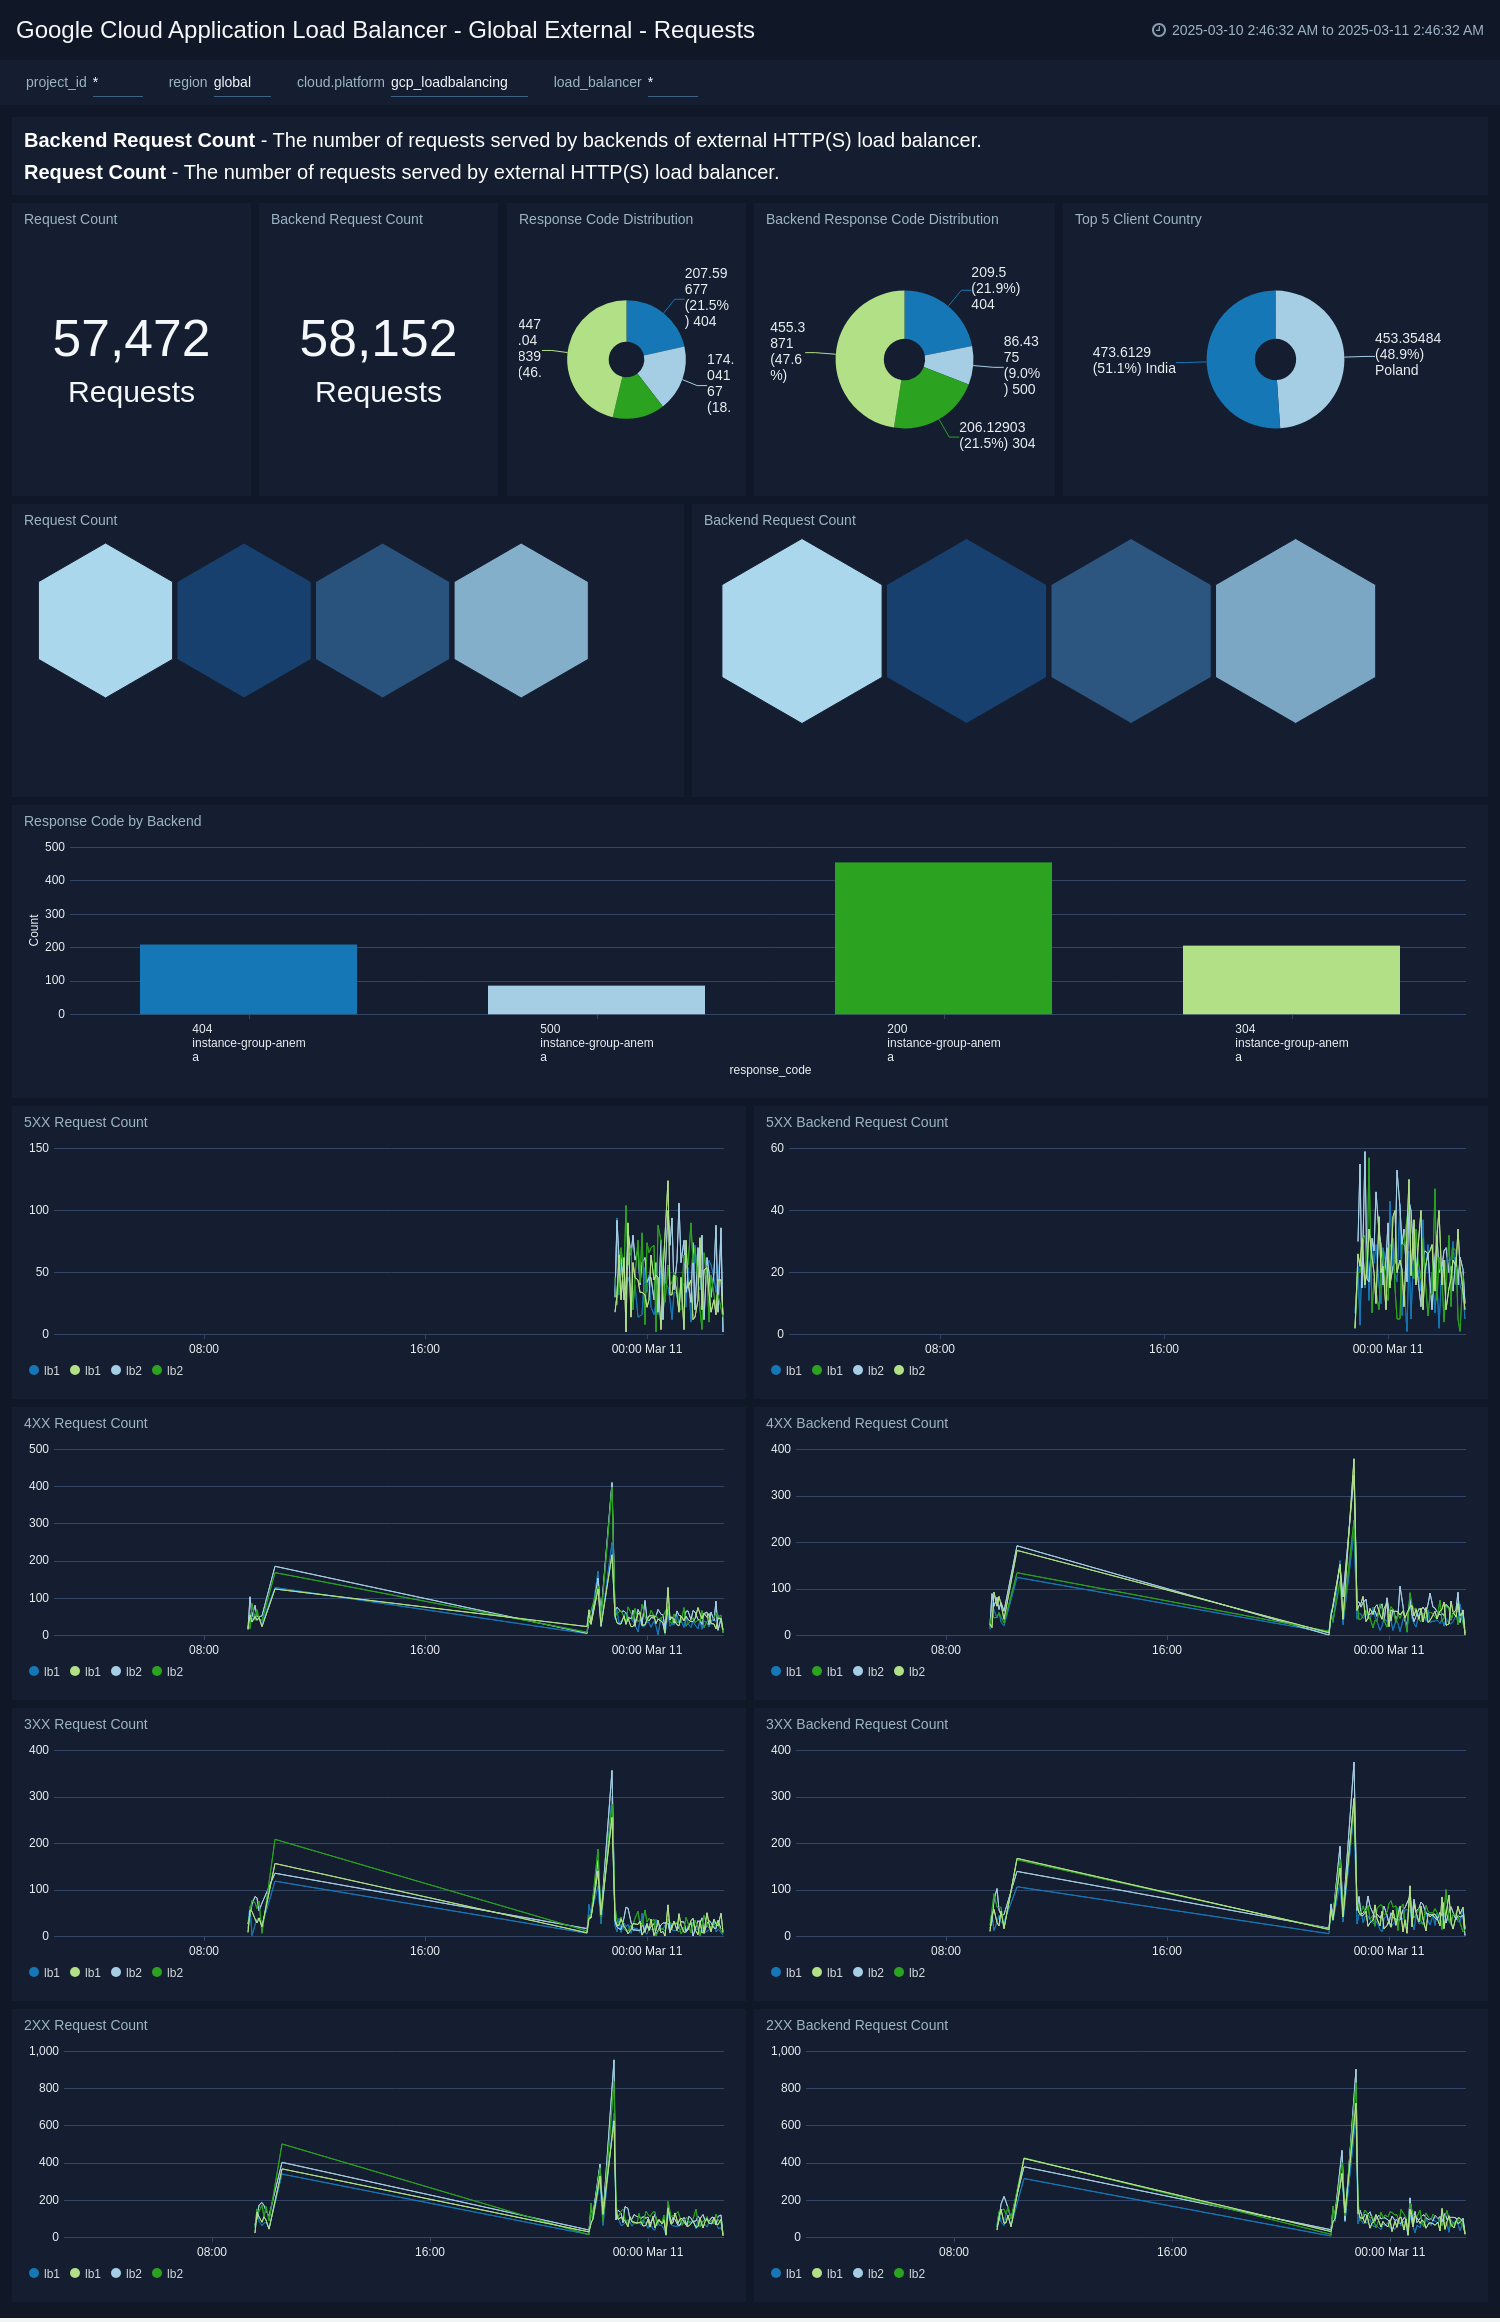
Global External - Requests
This dashboard helps you monitor total request count between client - load balancer and load balancer - backend. You can also monitor request count by response code, response code by backends, and trends for different response code classes - 2x, 3xx, 4xx and 5xx.
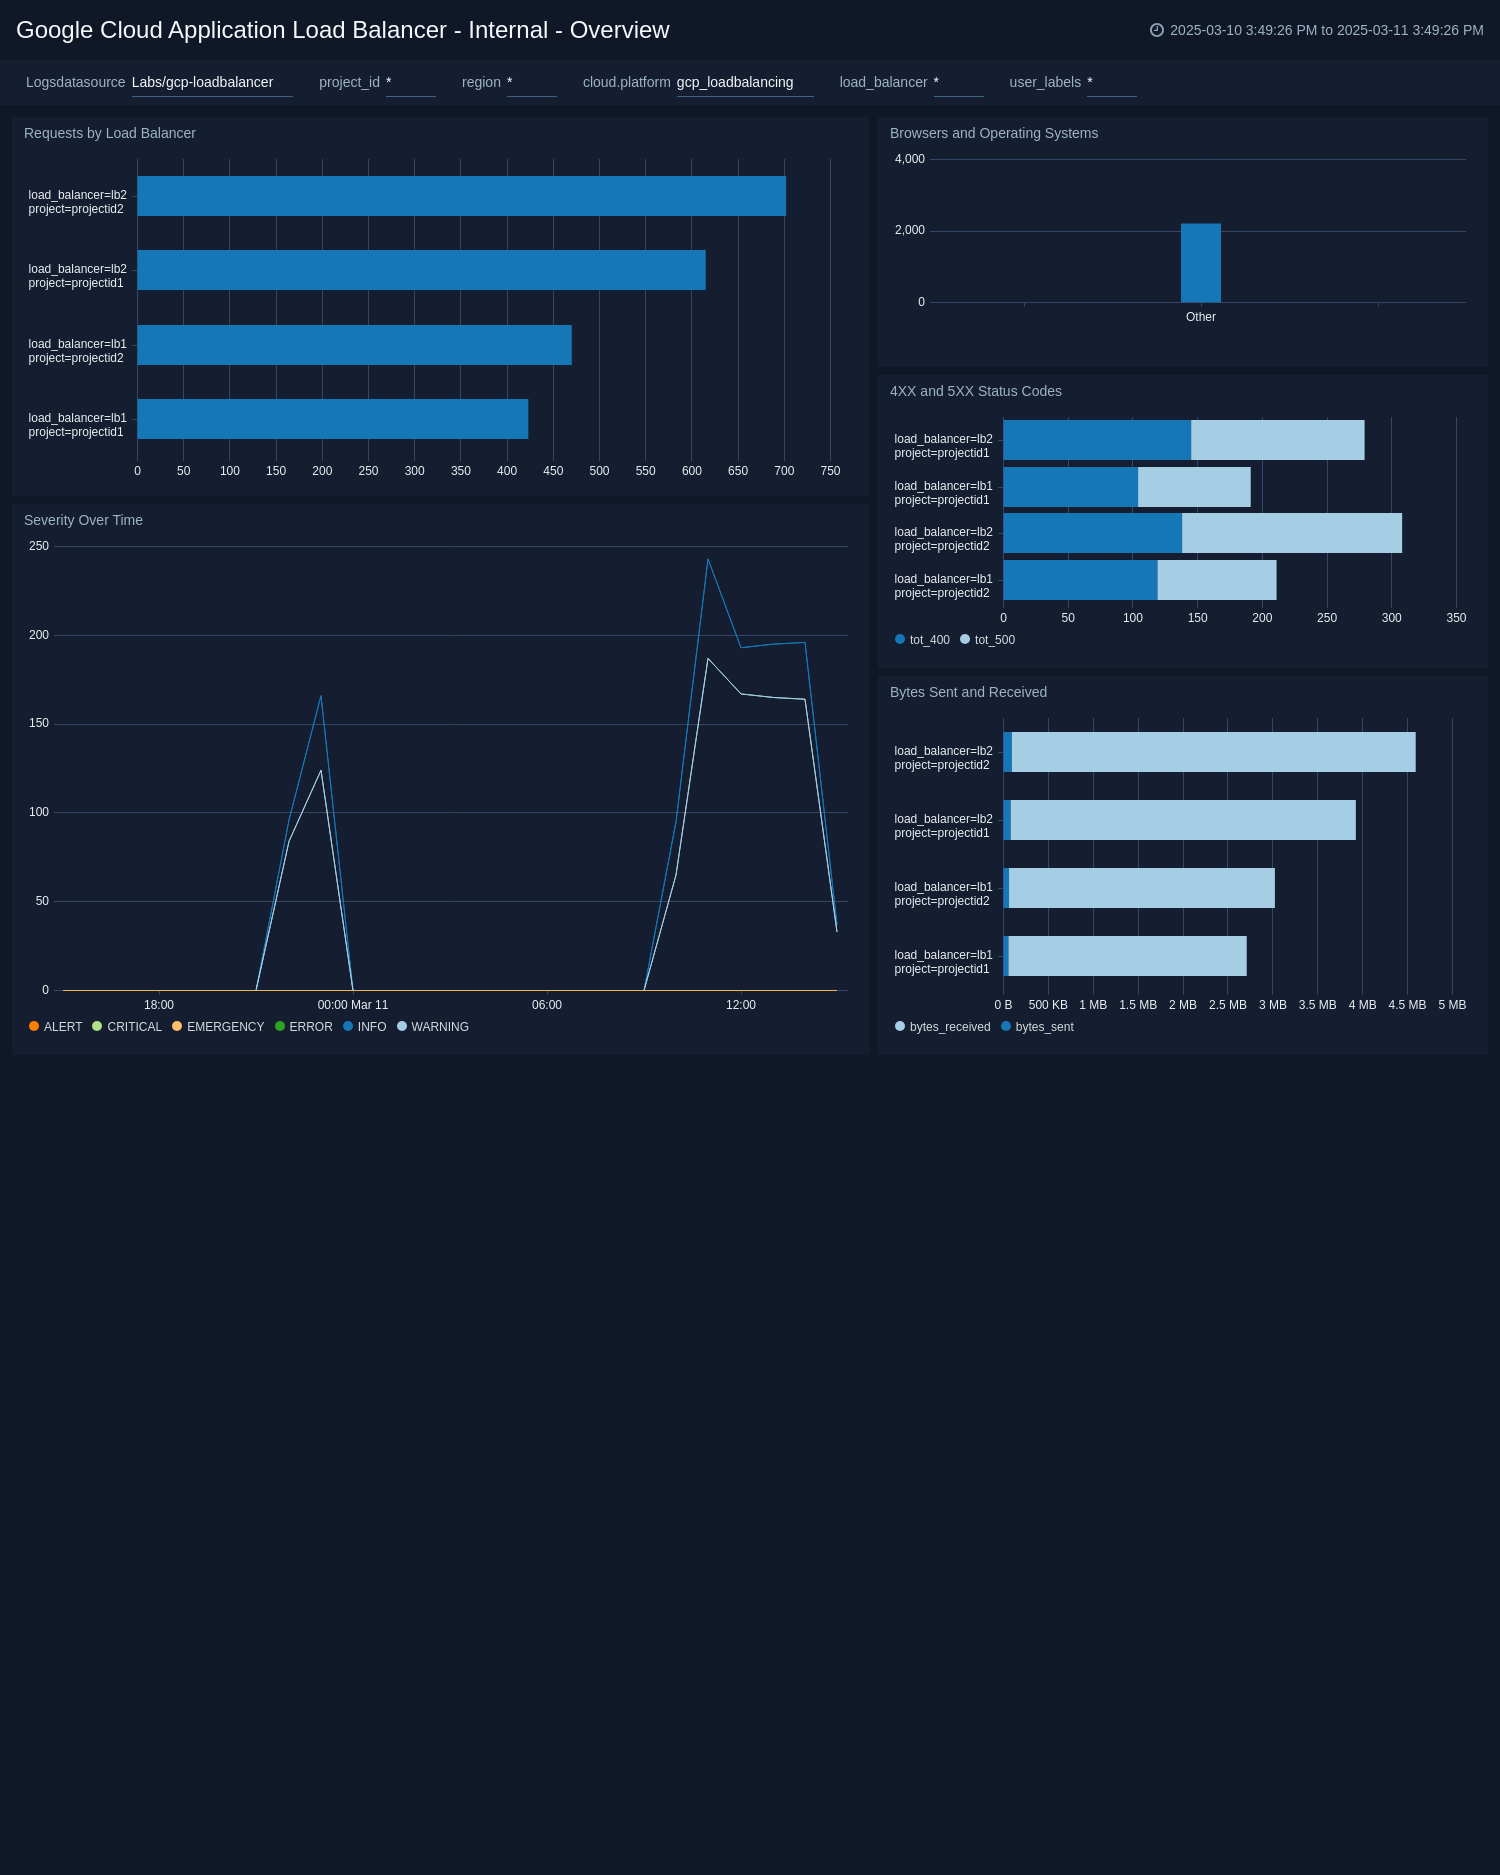
Internal - Overview
See an overview of Google Cloud Load Balancing activity, including request locations, browsers and operating systems used, error status codes, requests by load balancer, bytes sent and received, and message severity over time.
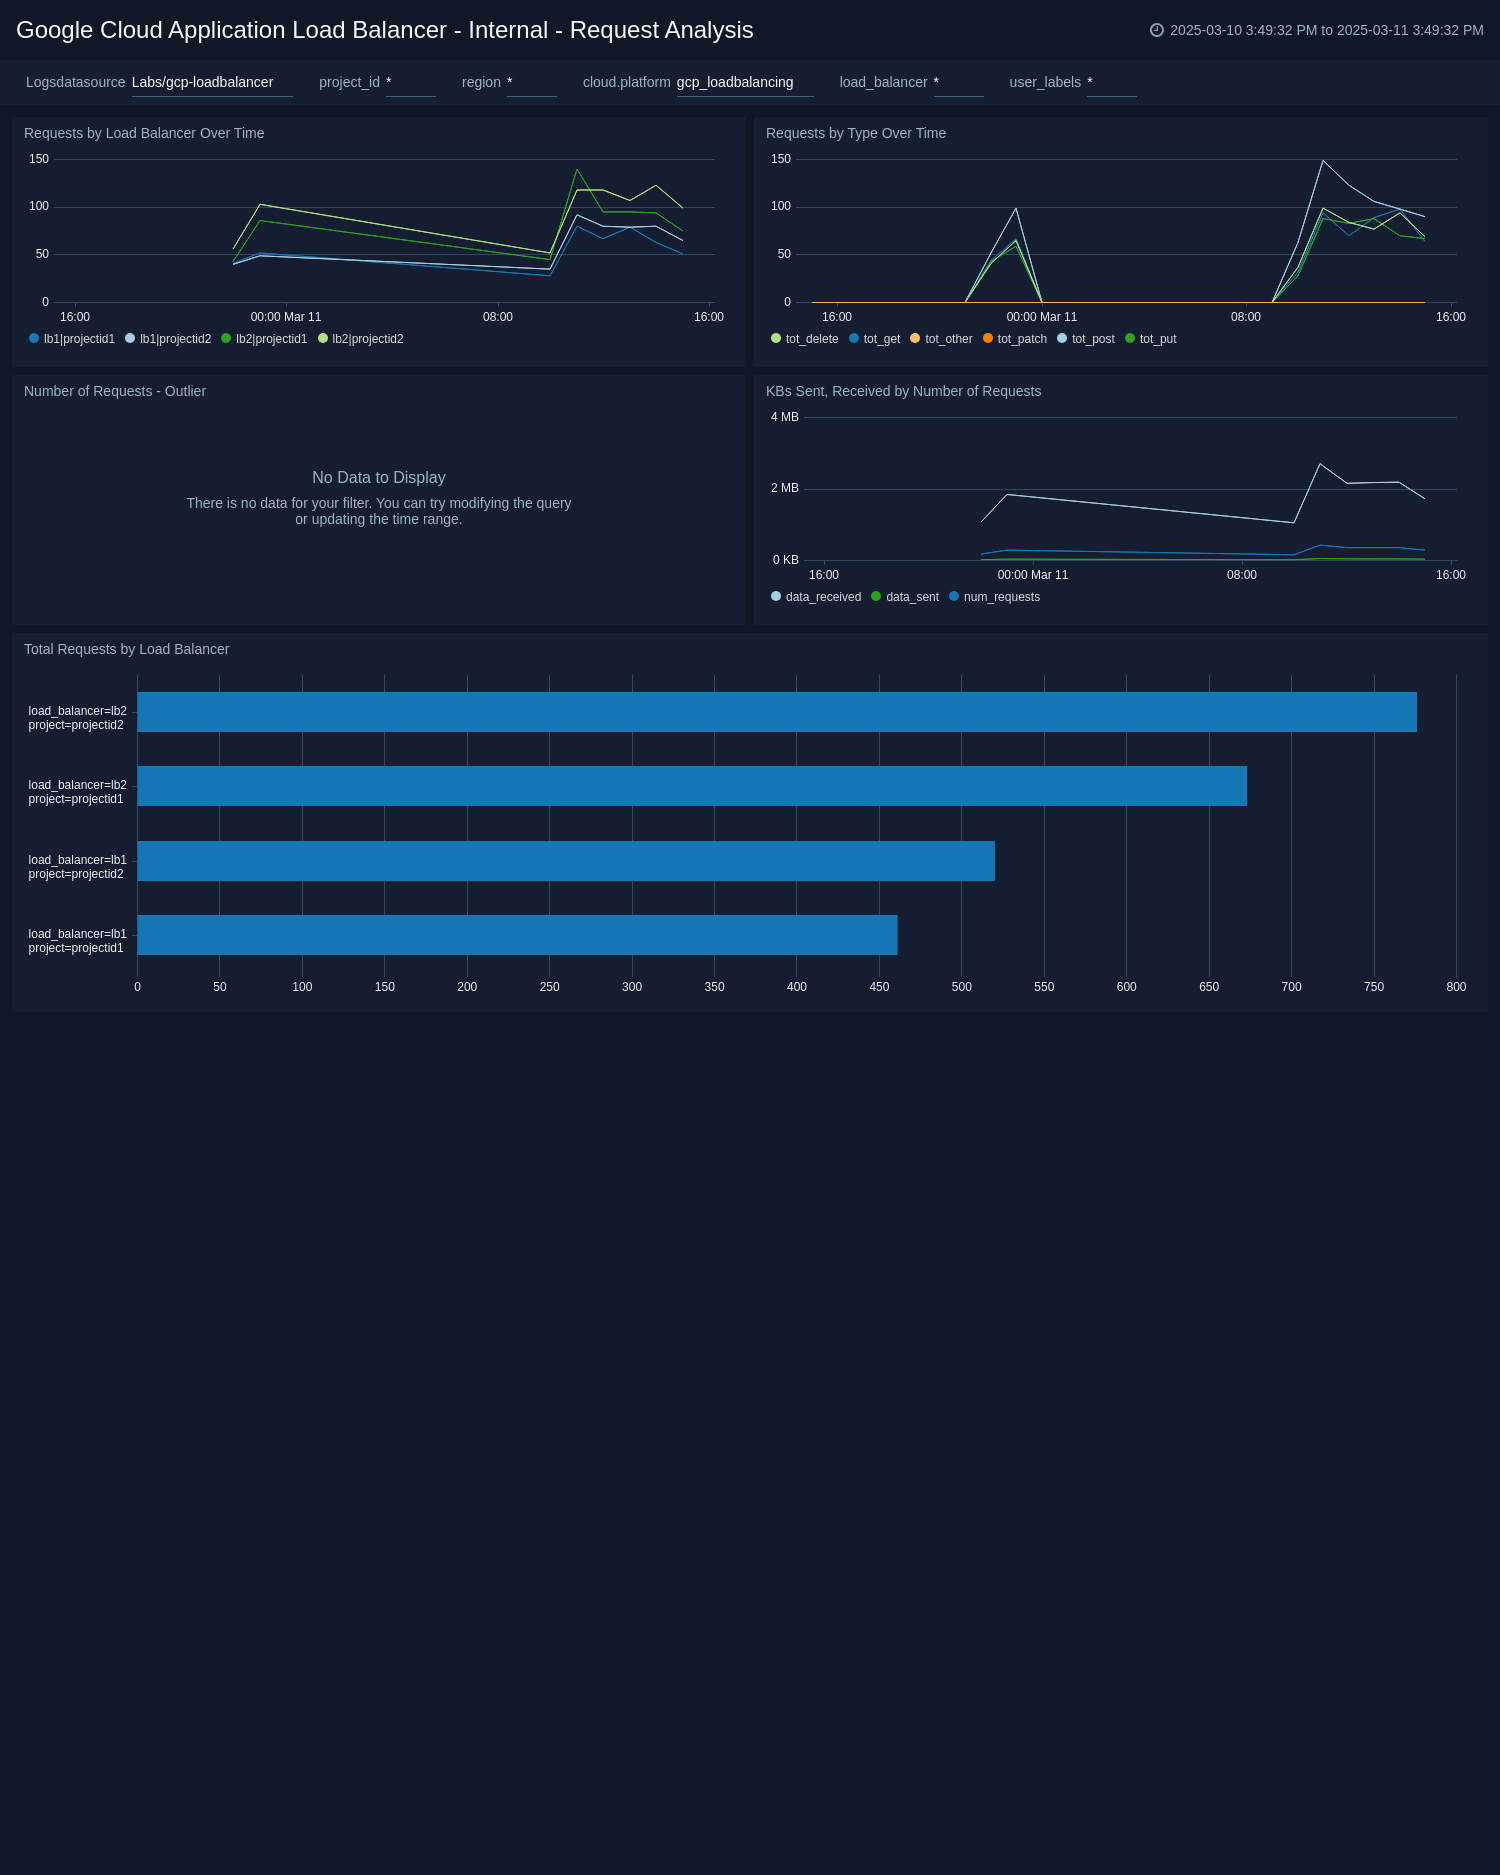
Internal - Request Analysis
See information about request activity in Google Cloud Load Balancing, including request locations, requests by type over time, requests by load balancer over time, KBs sent and received by number of requests, and total requests by load balancer.
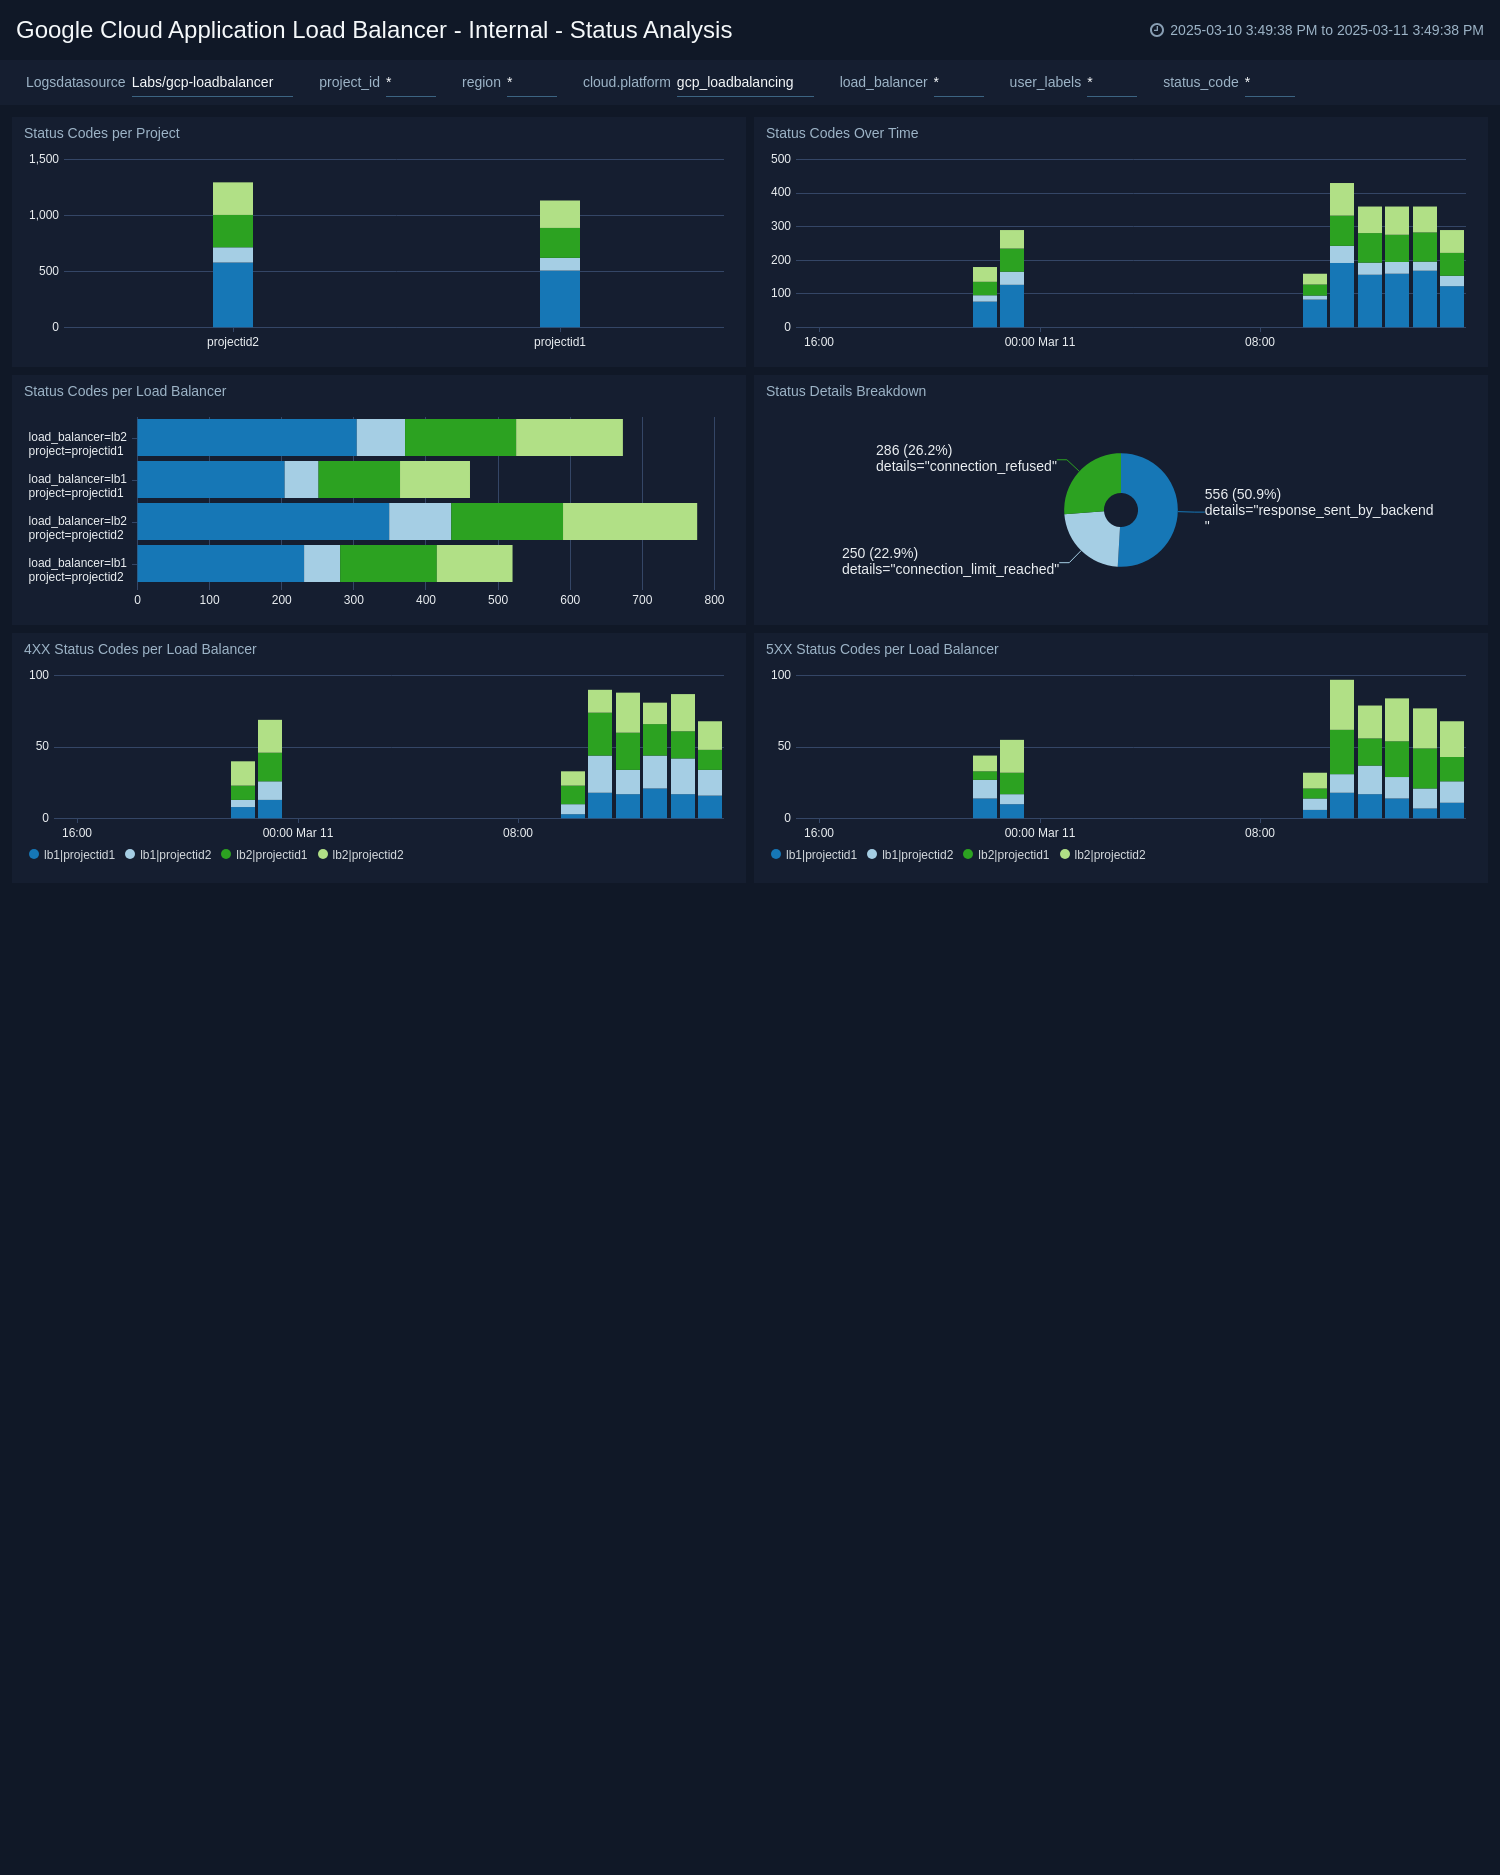
Internal - Status Analysis
See information about the status of requests in Google Cloud Load Balancing, including status codes per project, over time, and by load balancer; location of 4xx and 5xx responses; and 4xx and 5xx responses by load balancer.
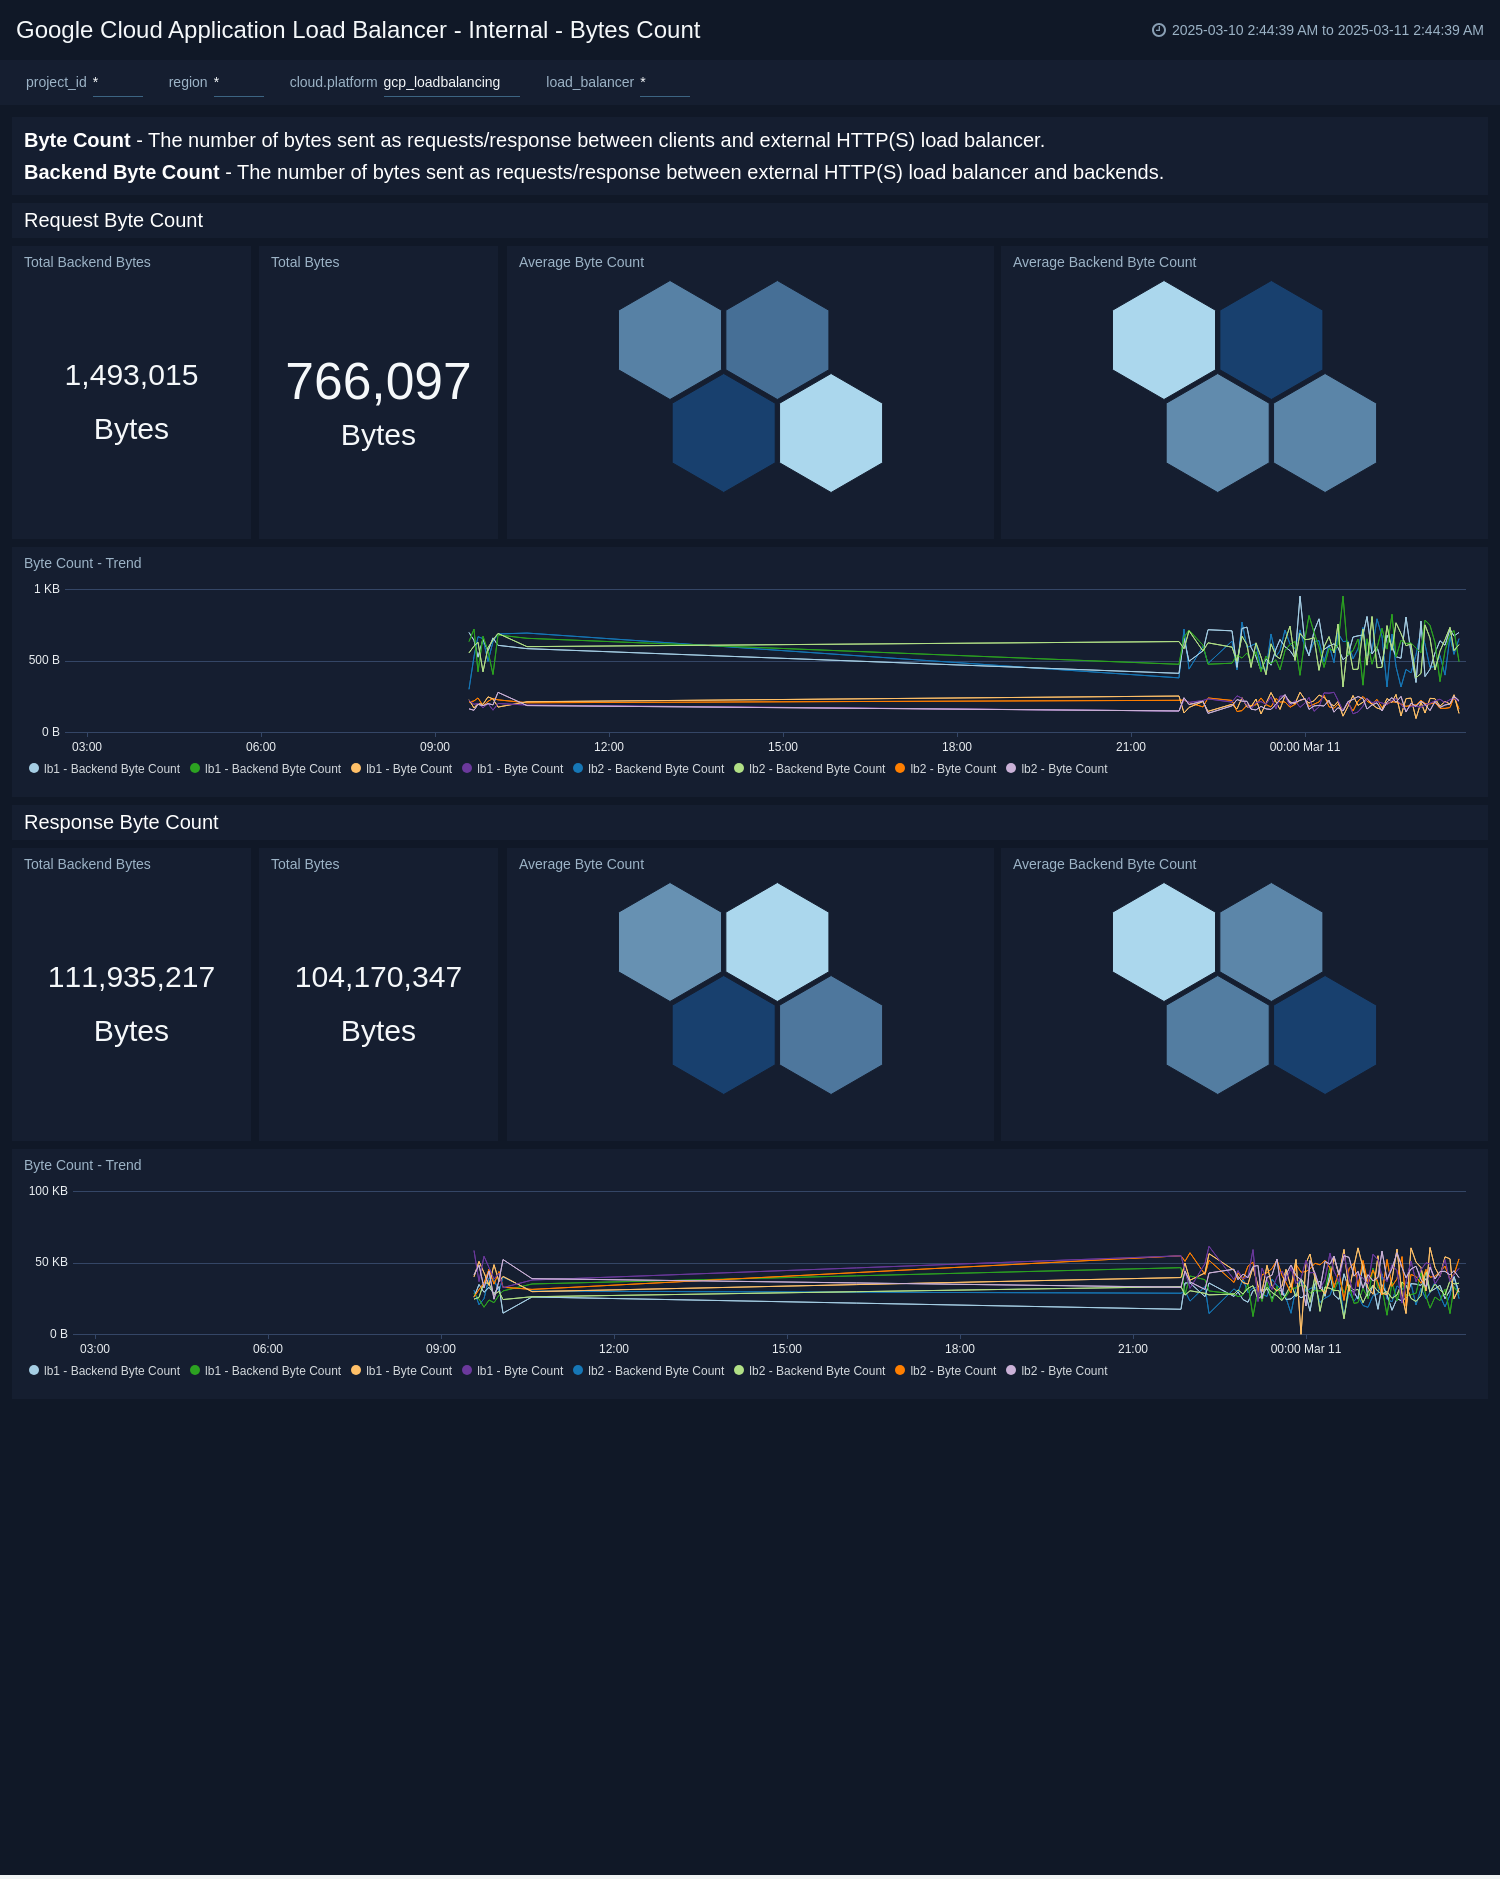
Internal - Bytes count
This dashboard help you monitor Byte Count between client- load balancer and load balancer - backend. You can monitor total bytes, average bytes and trend for request and response.
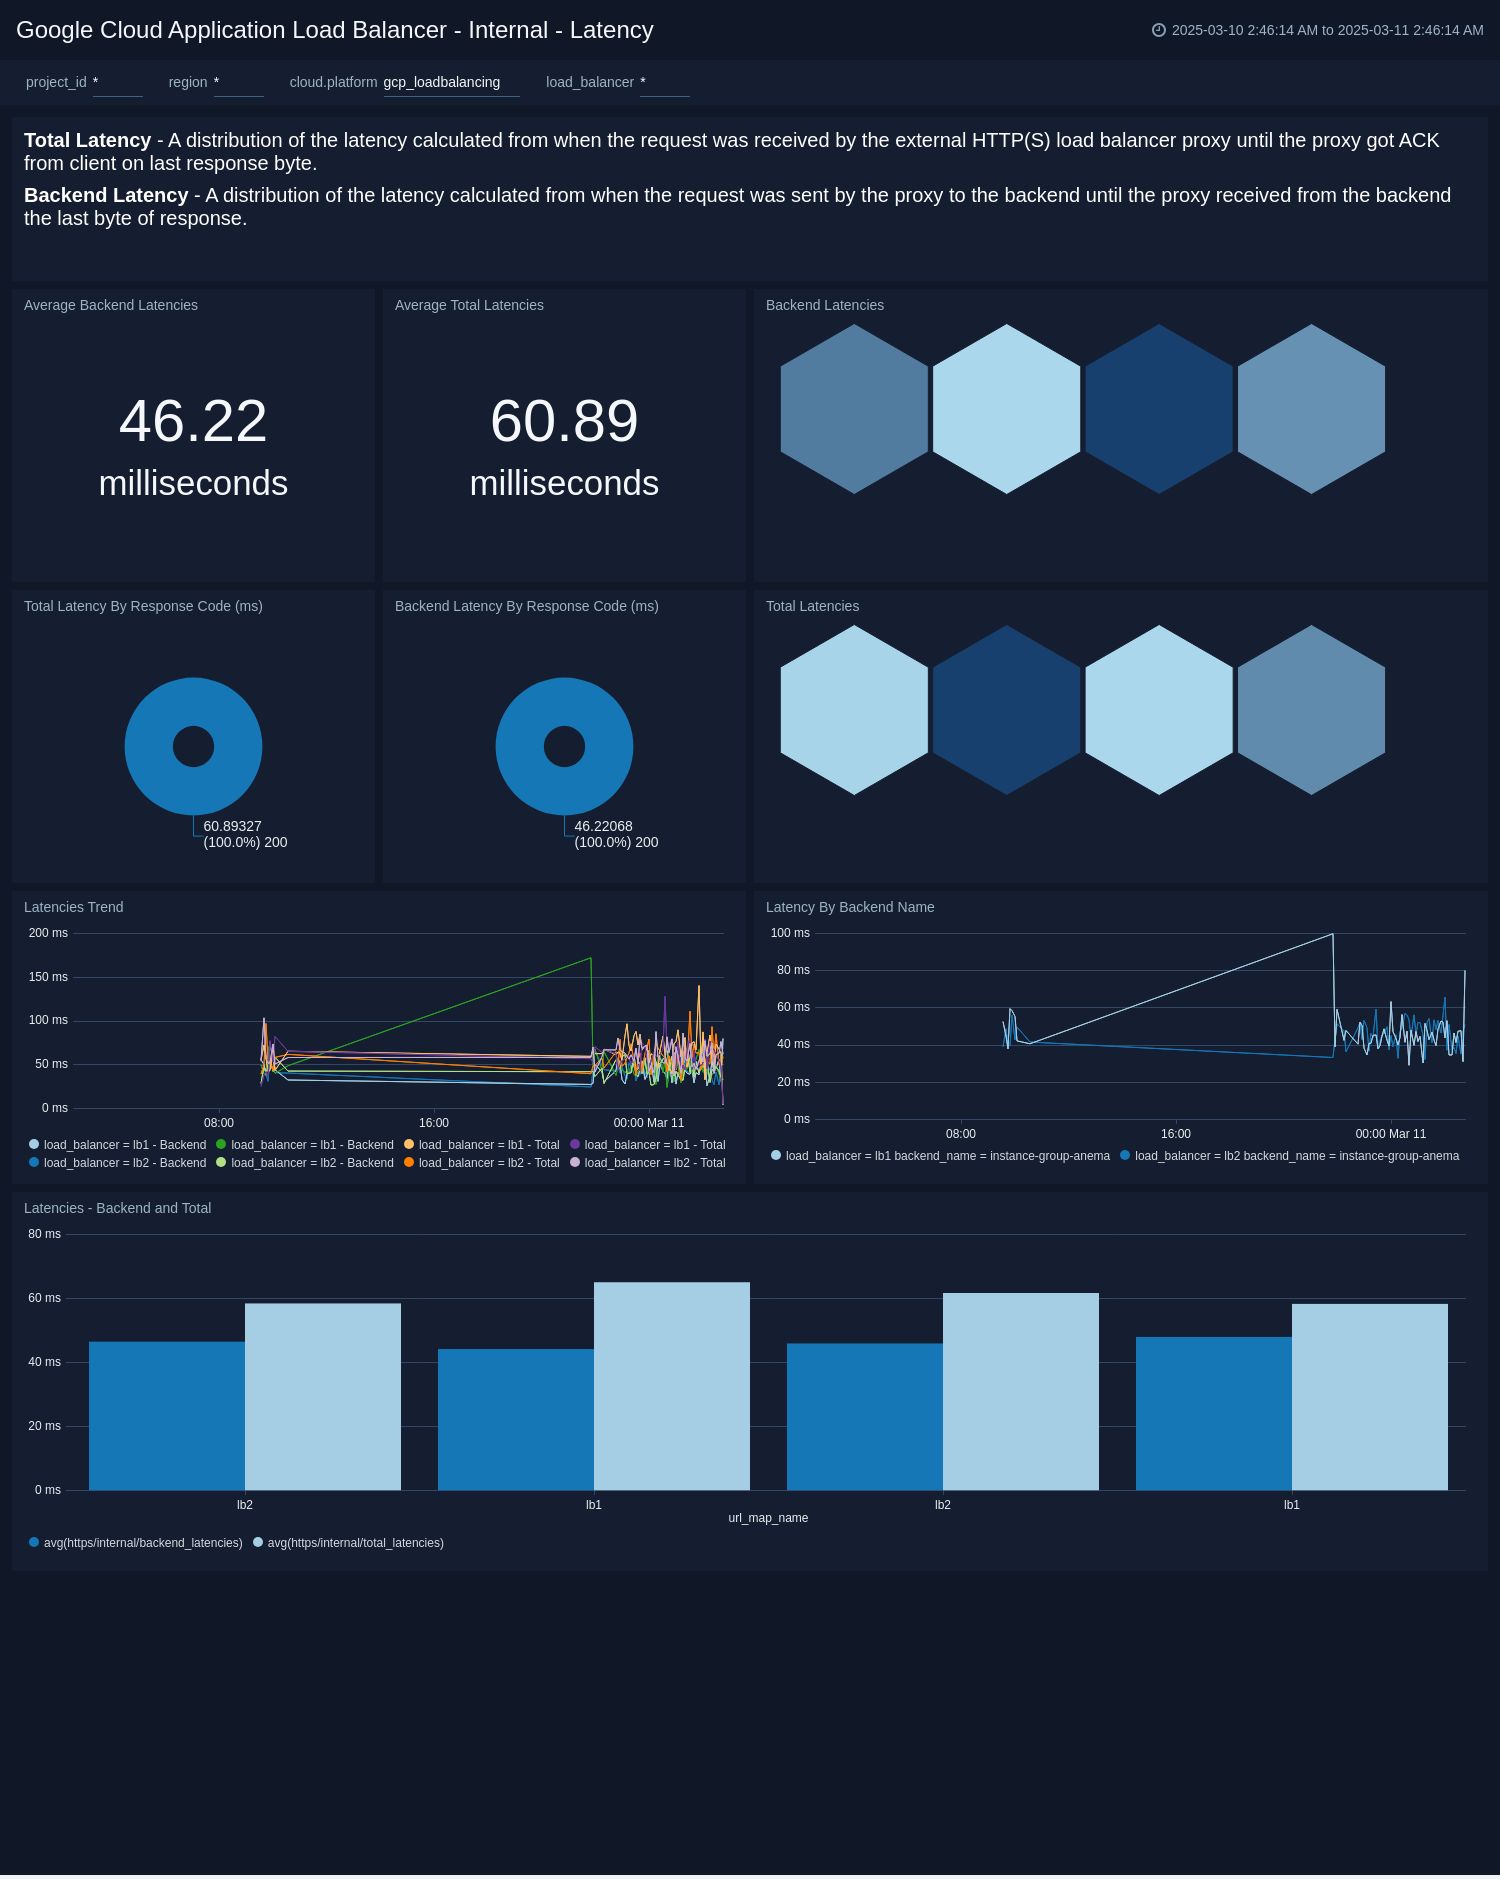
Internal - Latency
This dashboard helps you monitor average latency between client- load balancer and load balancer - backend. You can also monitor latency by response code, latency trends and latency by load balancer.
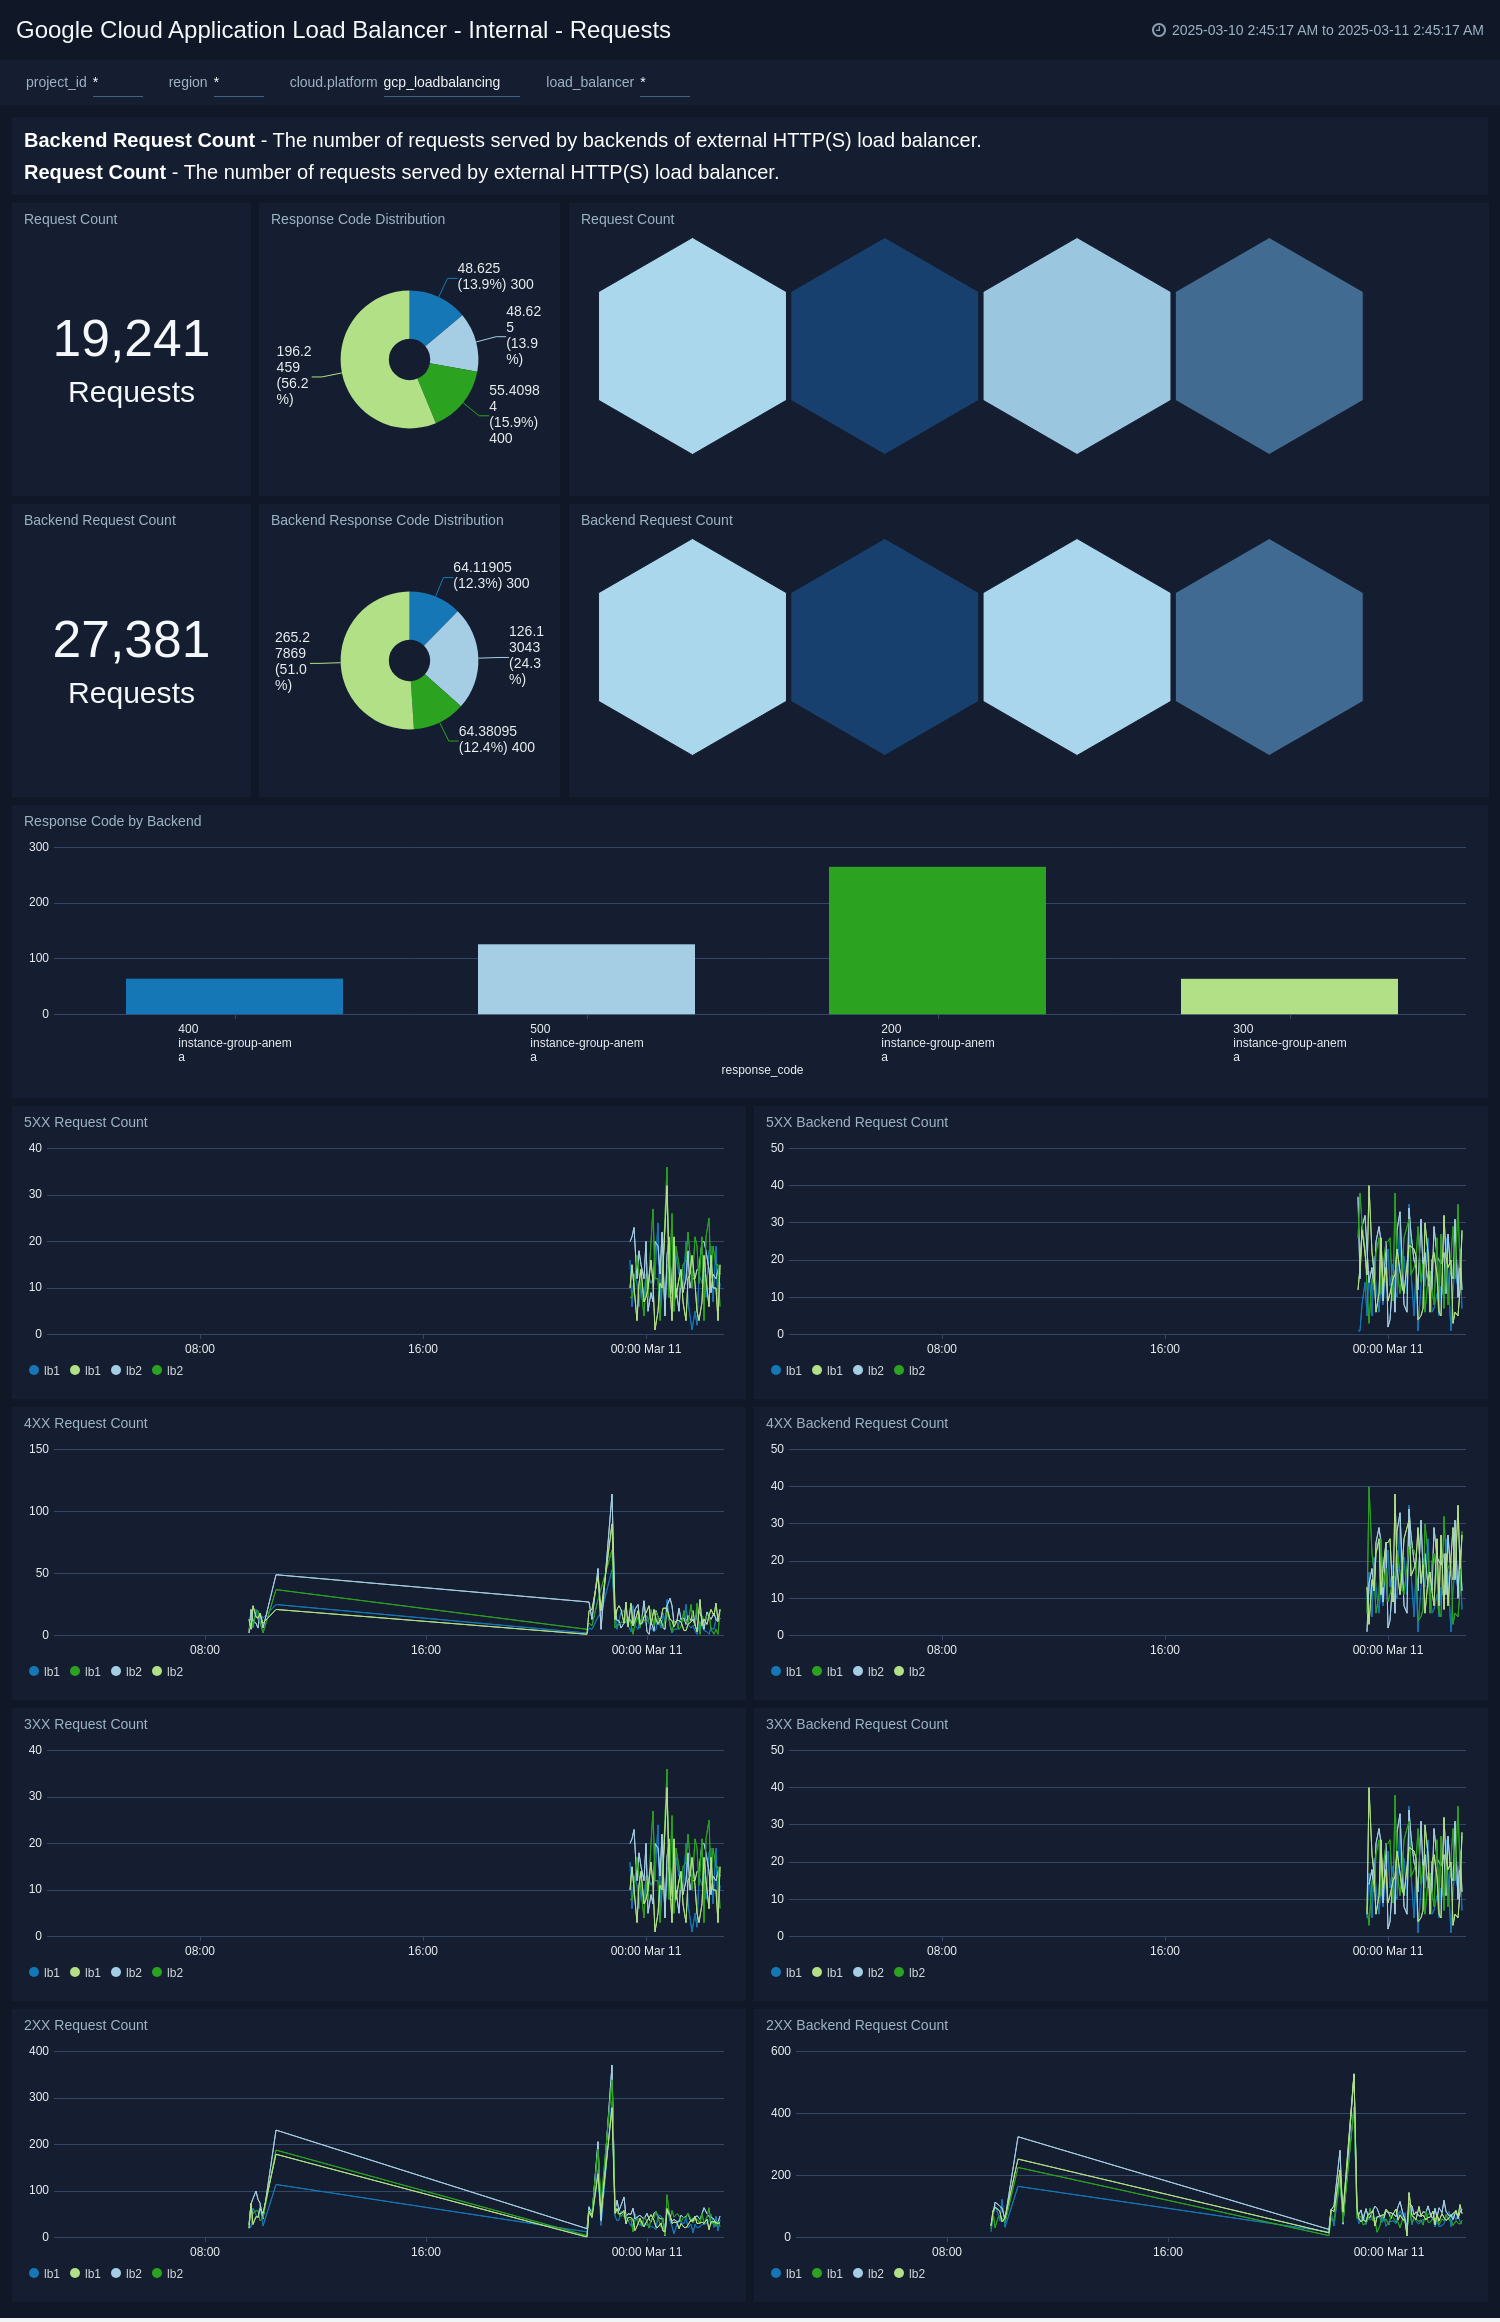
Internal - Requests
This dashboard helps you monitor total request count between client- load balancer and load balancer - backend. You can also monitor request count by response code, response code by backends, and trends for different response code classes - 2x, 3xx, 4xx and 5xx
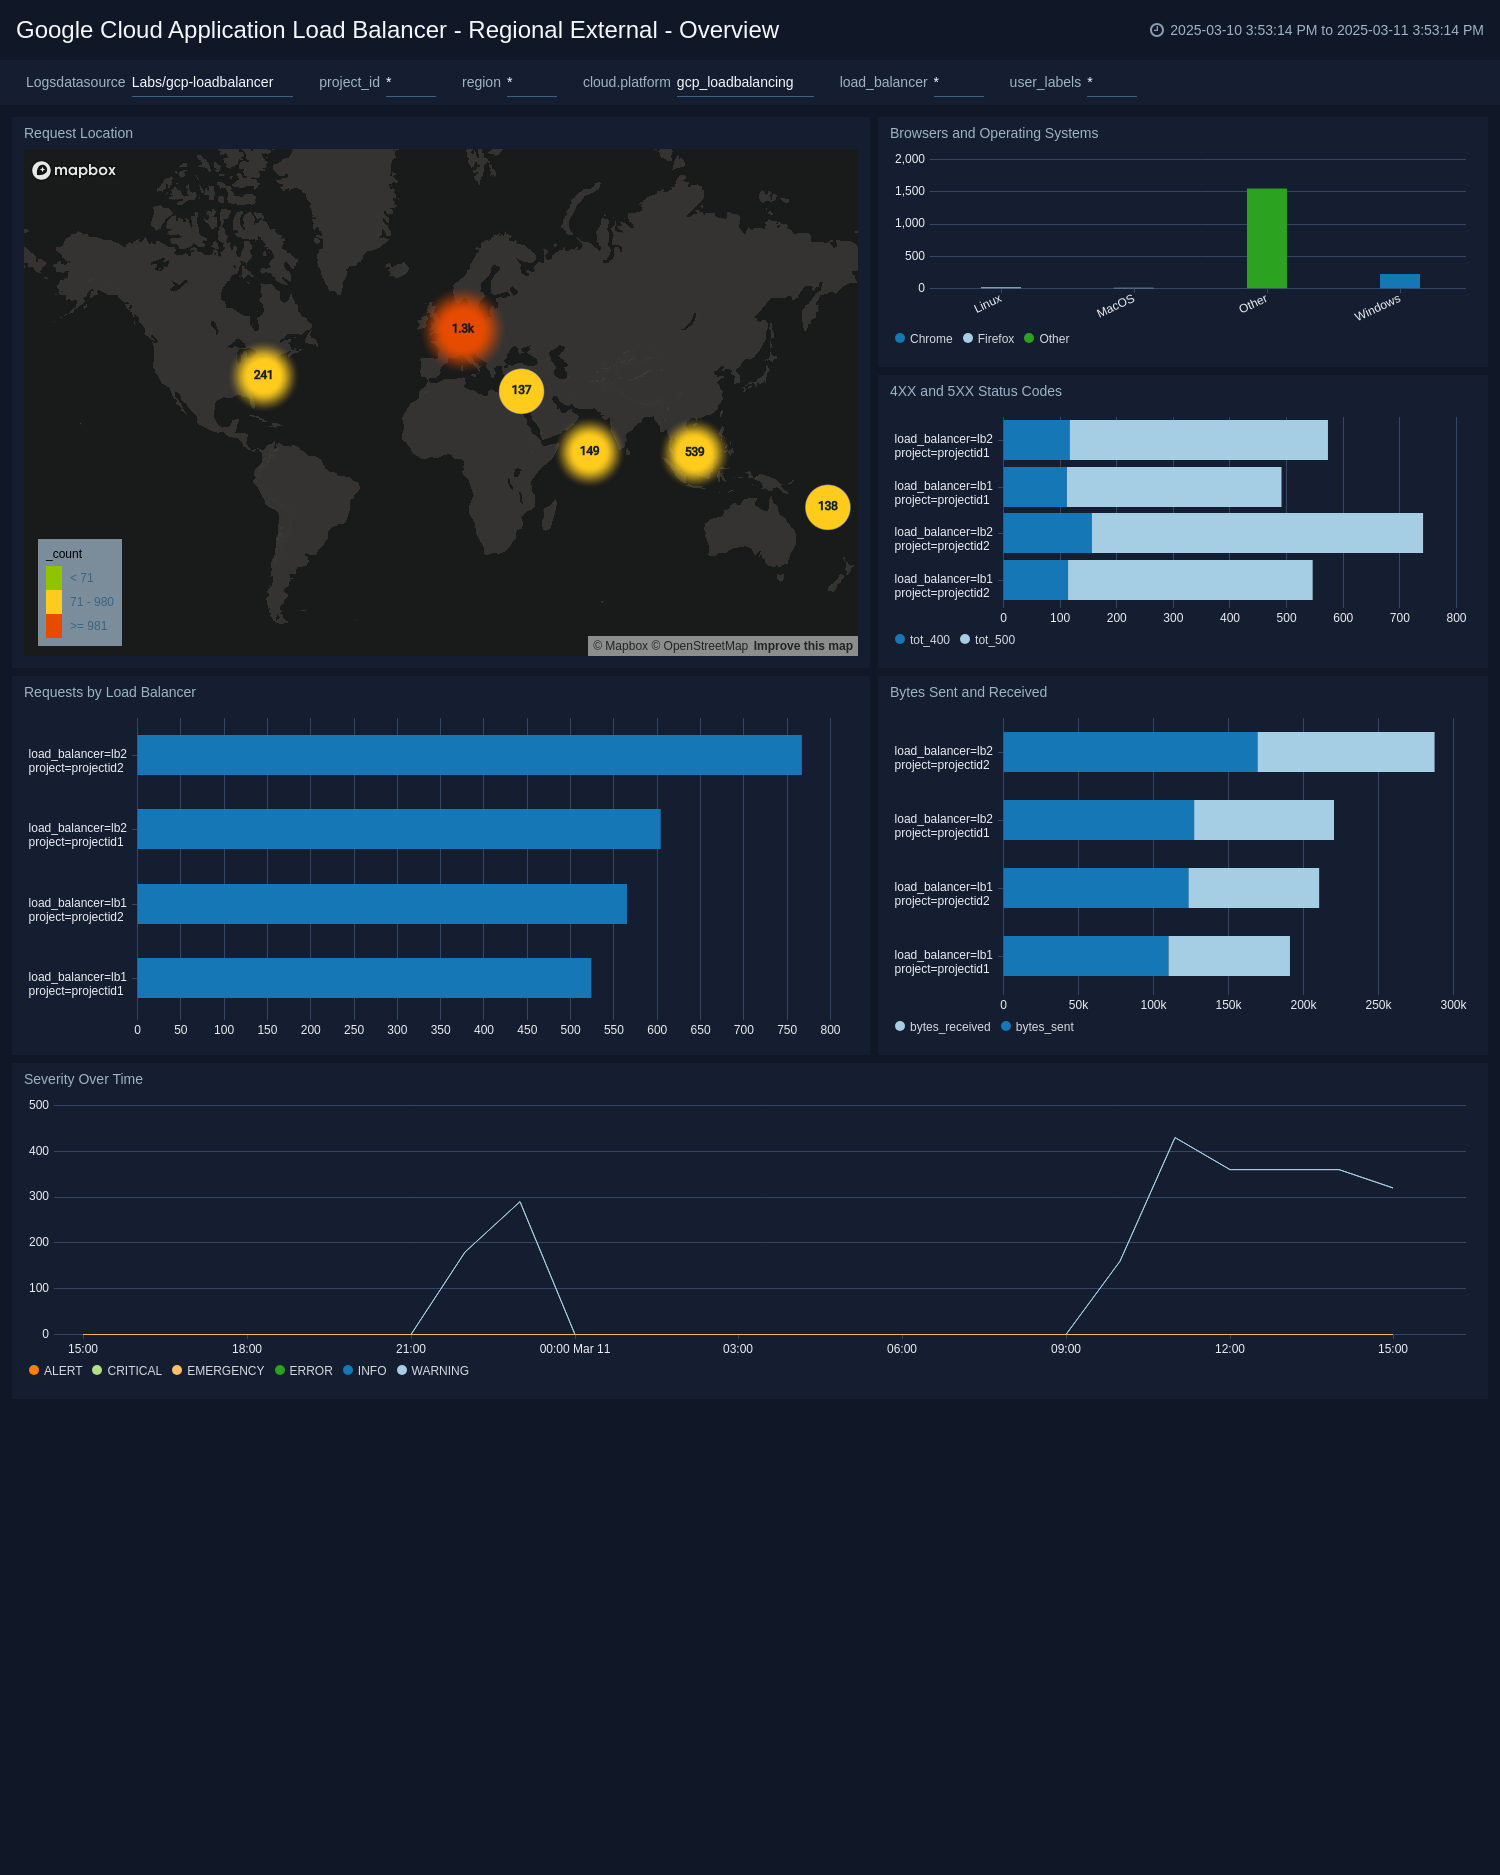
Regional External - Overview
See an overview of Google Cloud Load Balancing activity, including request locations, browsers and operating systems used, error status codes, requests by load balancer, bytes sent and received, and message severity over time.
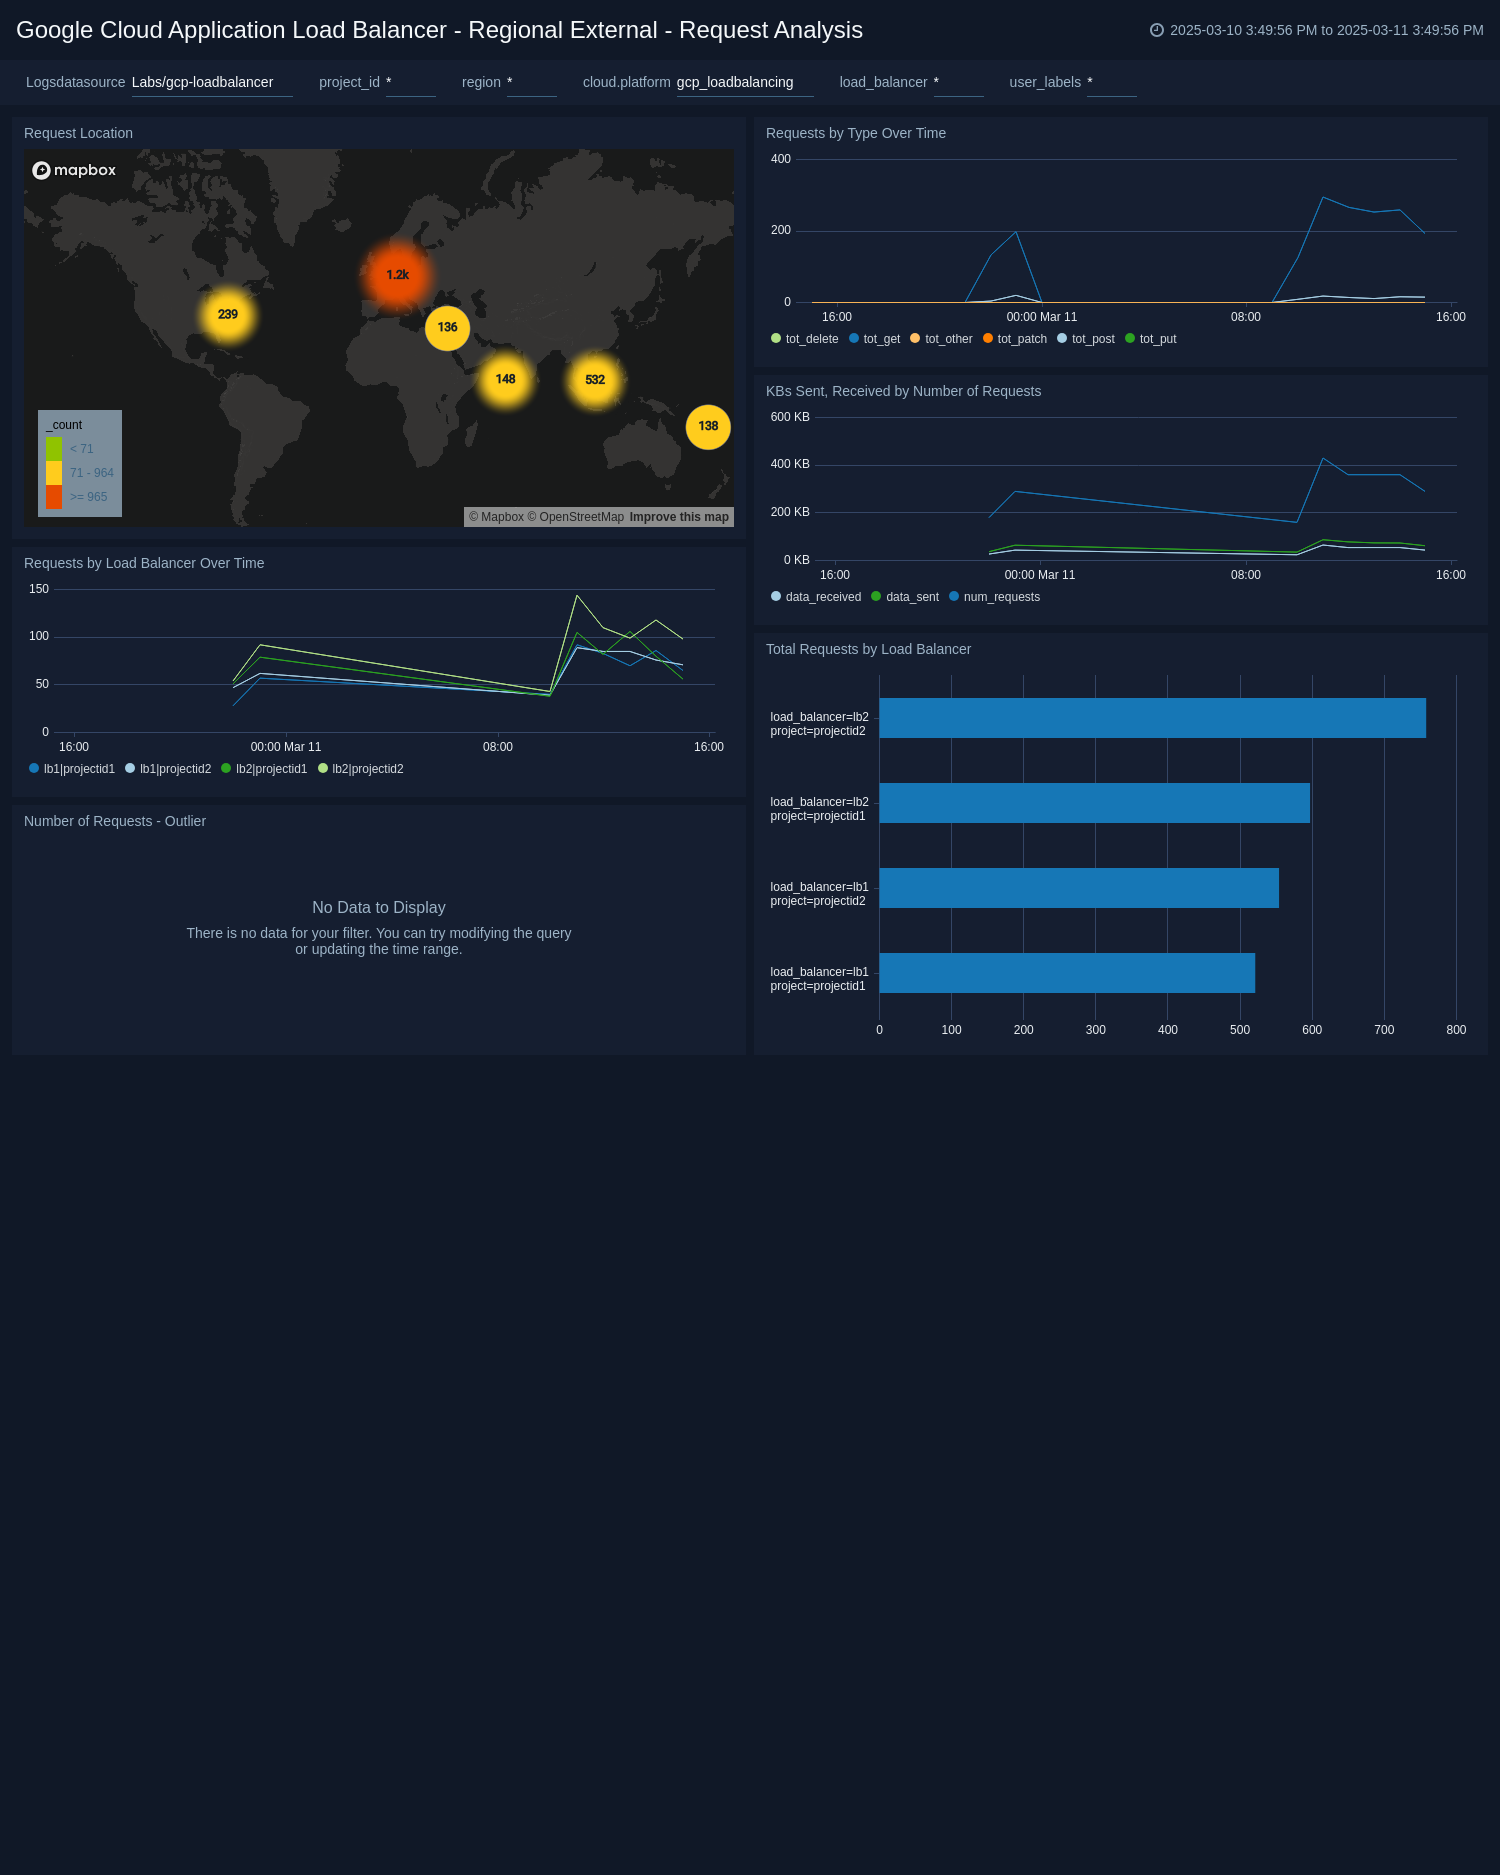
Regional External - Request Analysis
See information about request activity in Google Cloud Load Balancing, including request locations, requests by type over time, requests by load balancer over time, KBs sent and received by number of requests, and total requests by load balancer.
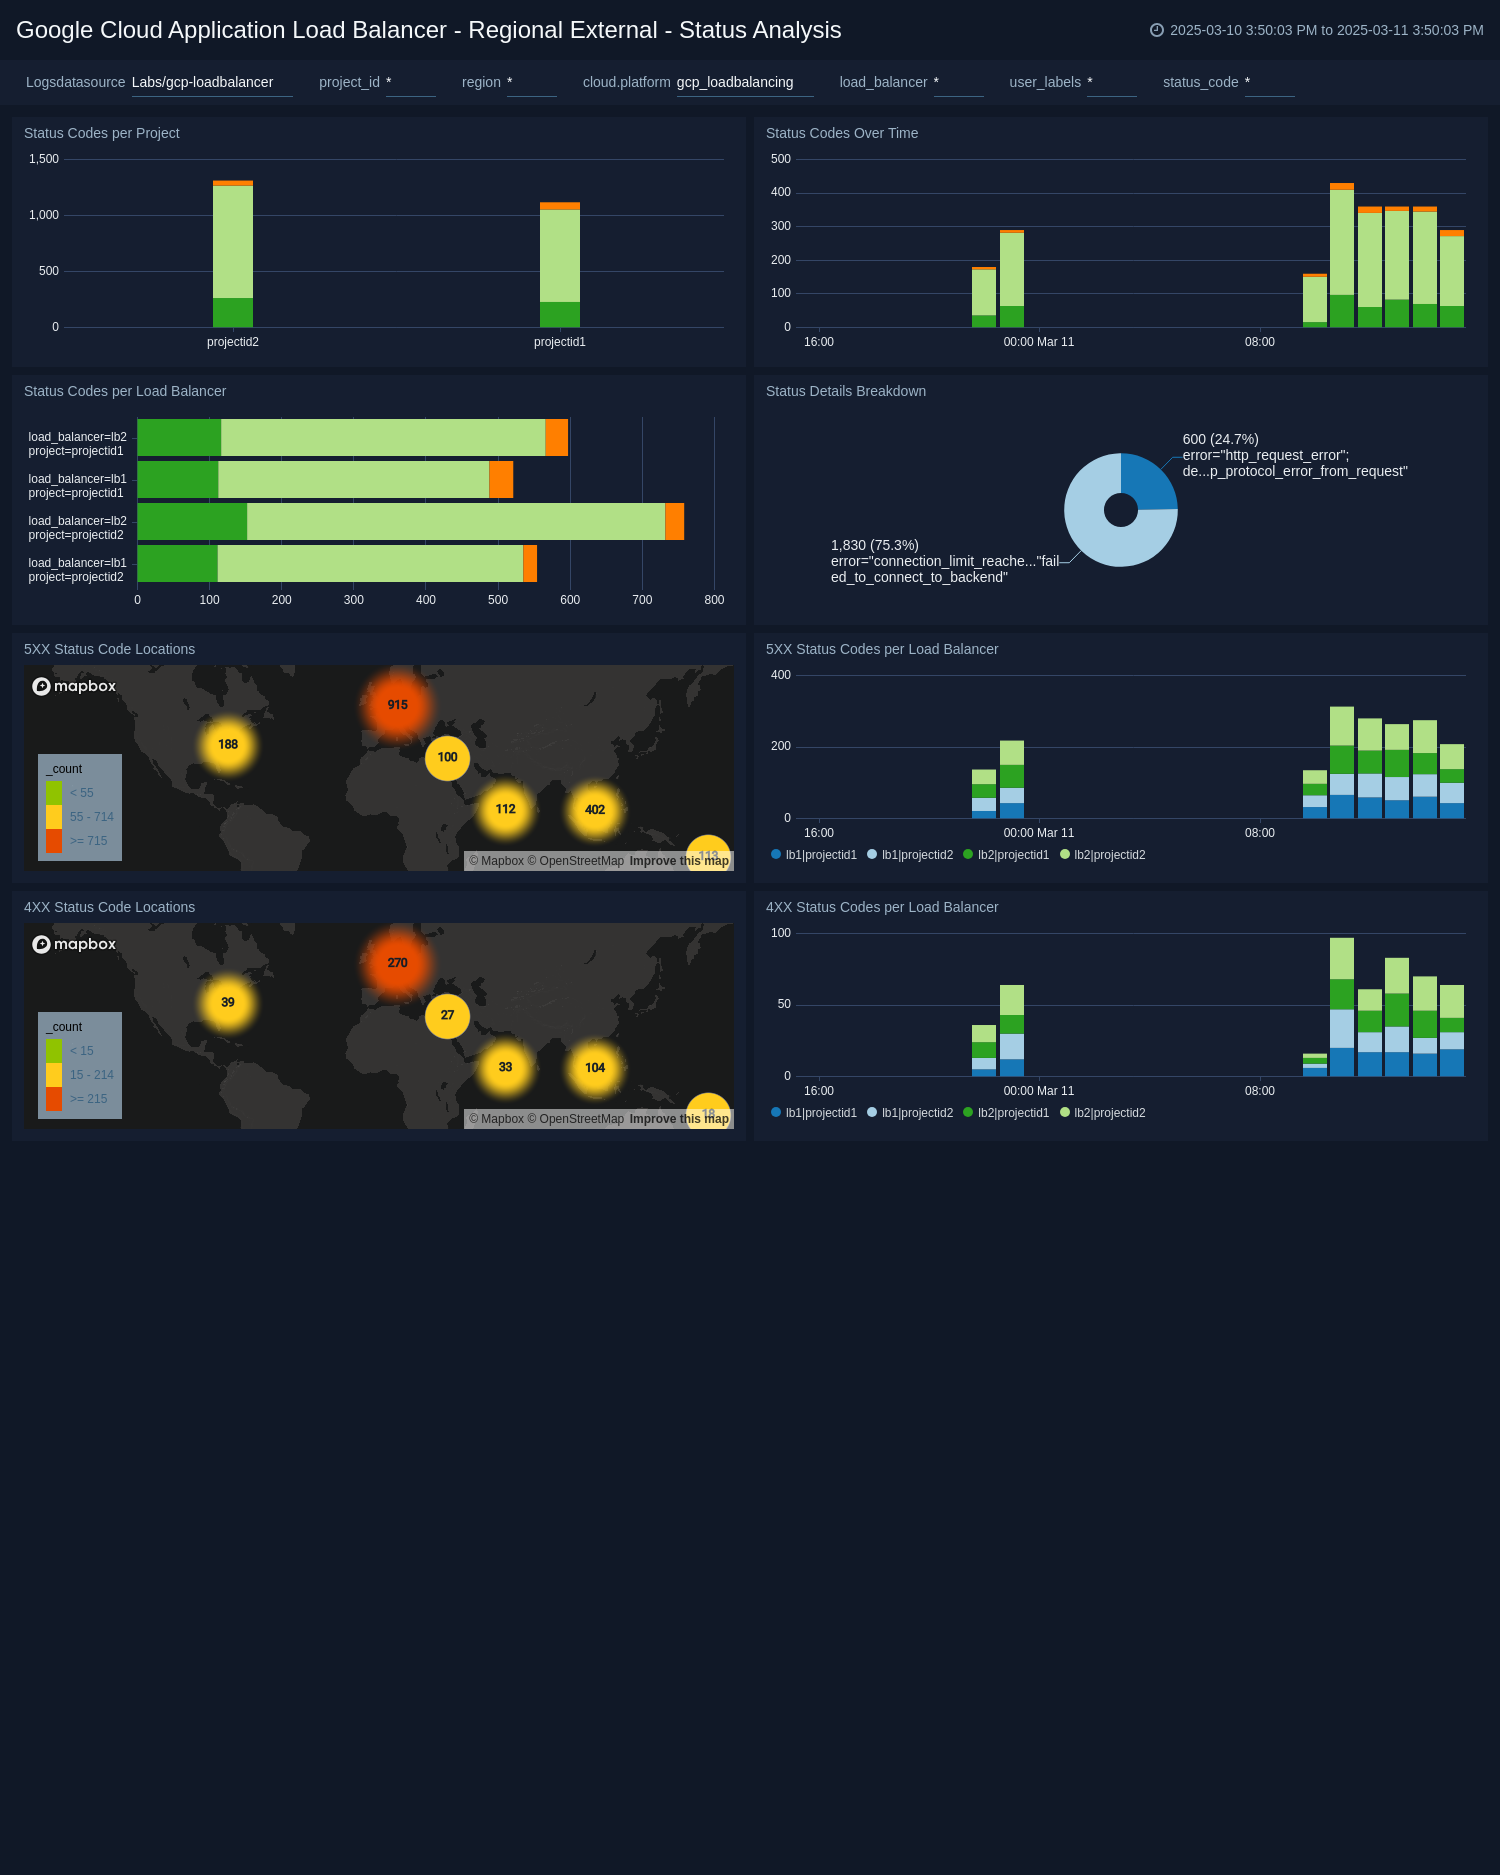
Regional External - Status Analysis
See information about the status of requests in Google Cloud Load Balancing, including status codes per project, over time, and by load balancer; location of 4xx and 5xx responses; and 4xx and 5xx responses by load balancer.
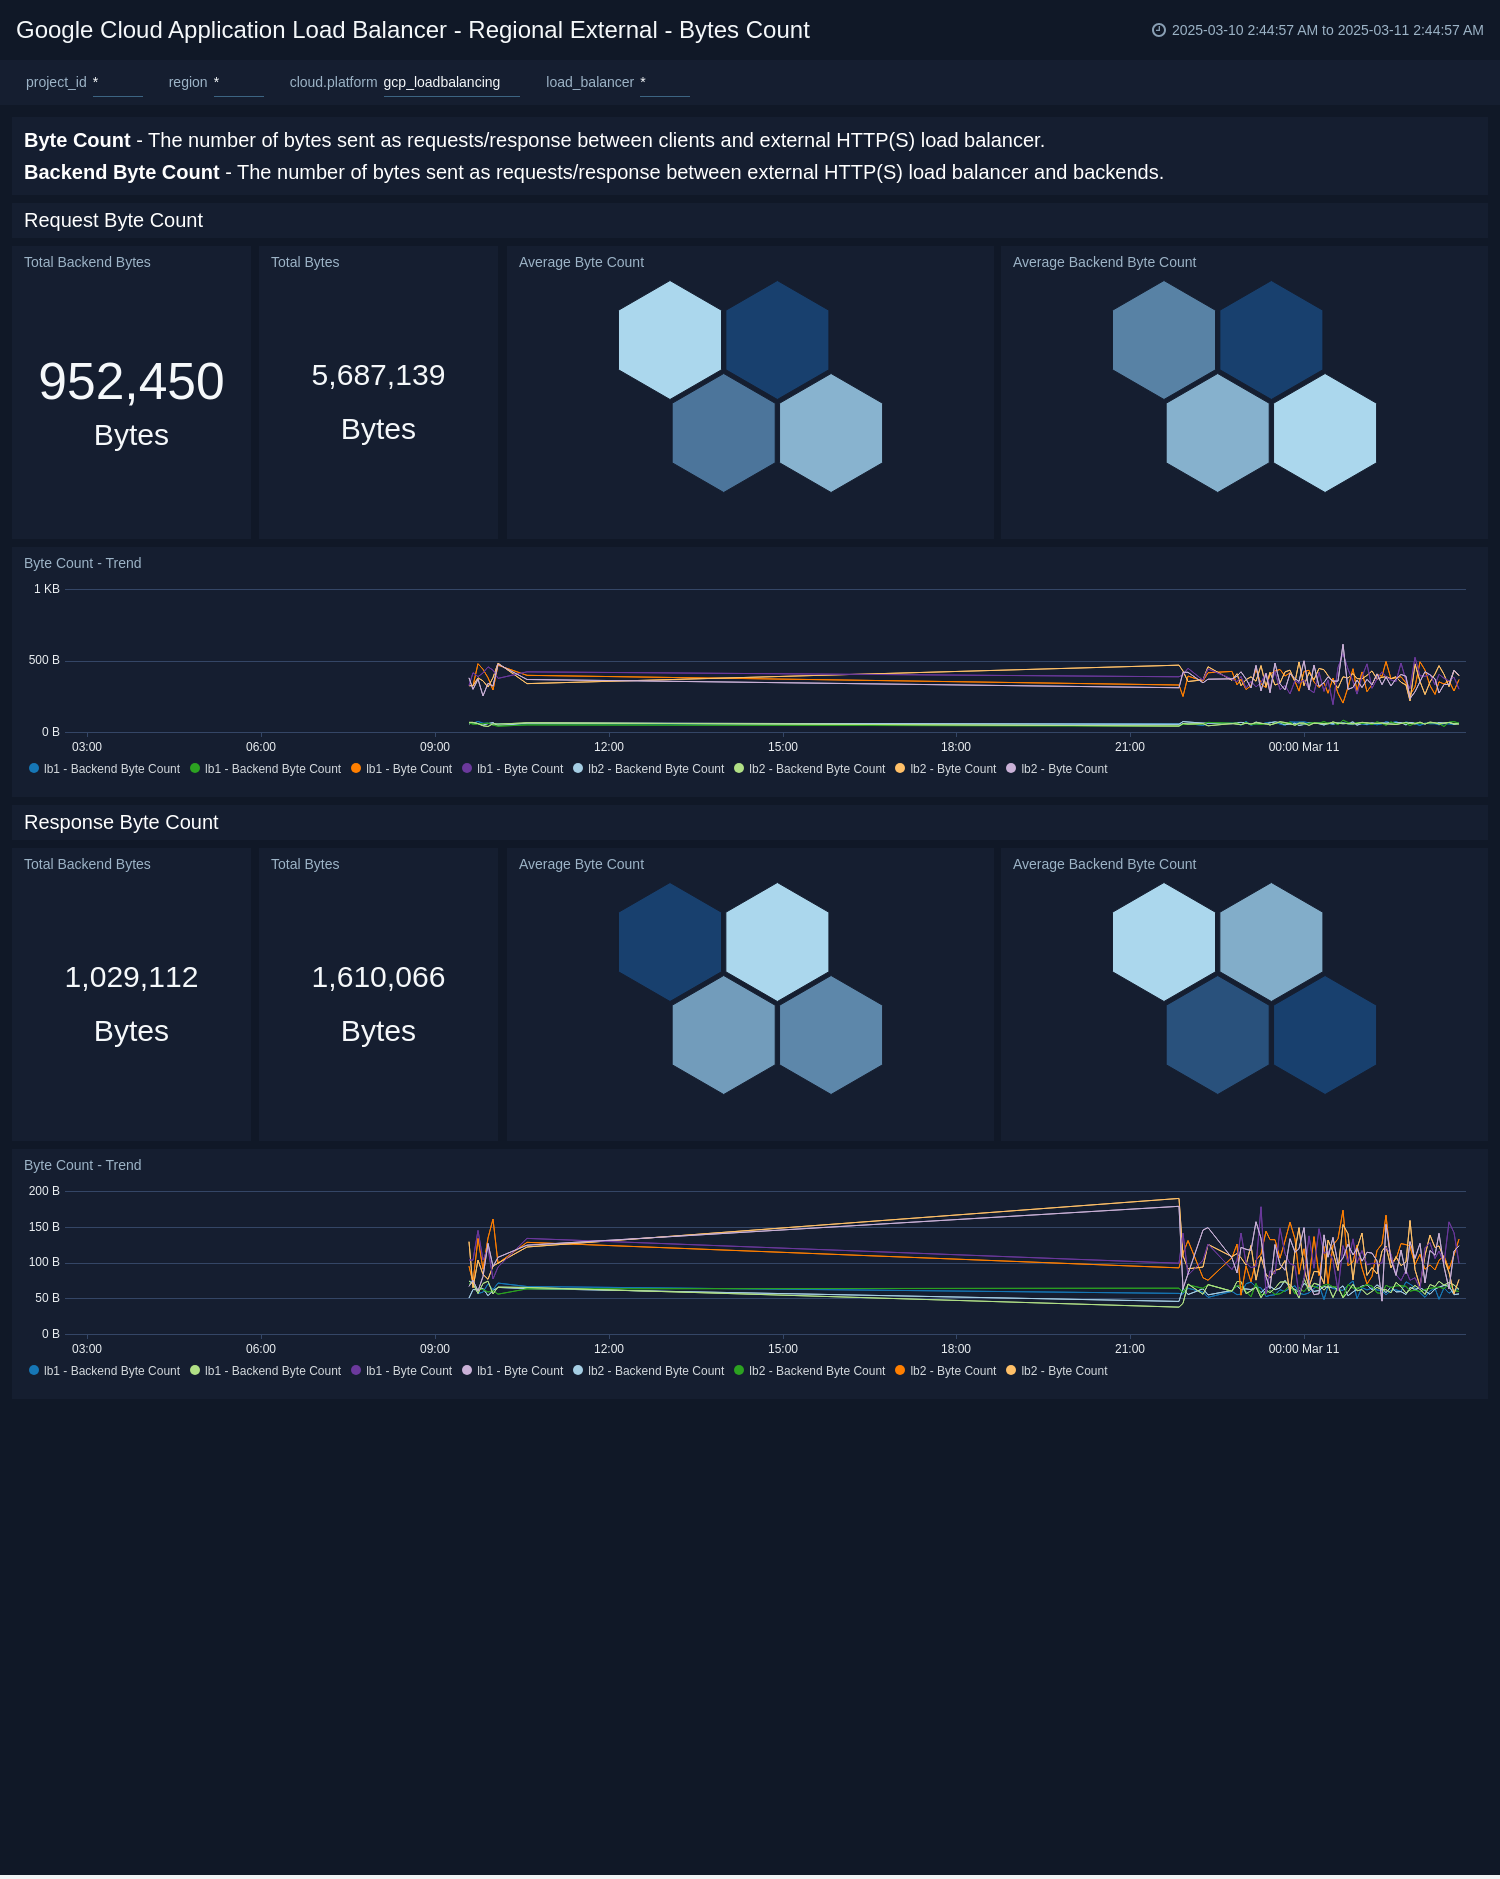
Regional External - Bytes count
This dashboard help you monitor Byte Count between client- load balancer and load balancer - backend. You can monitor total bytes, average bytes and trend for request and response.
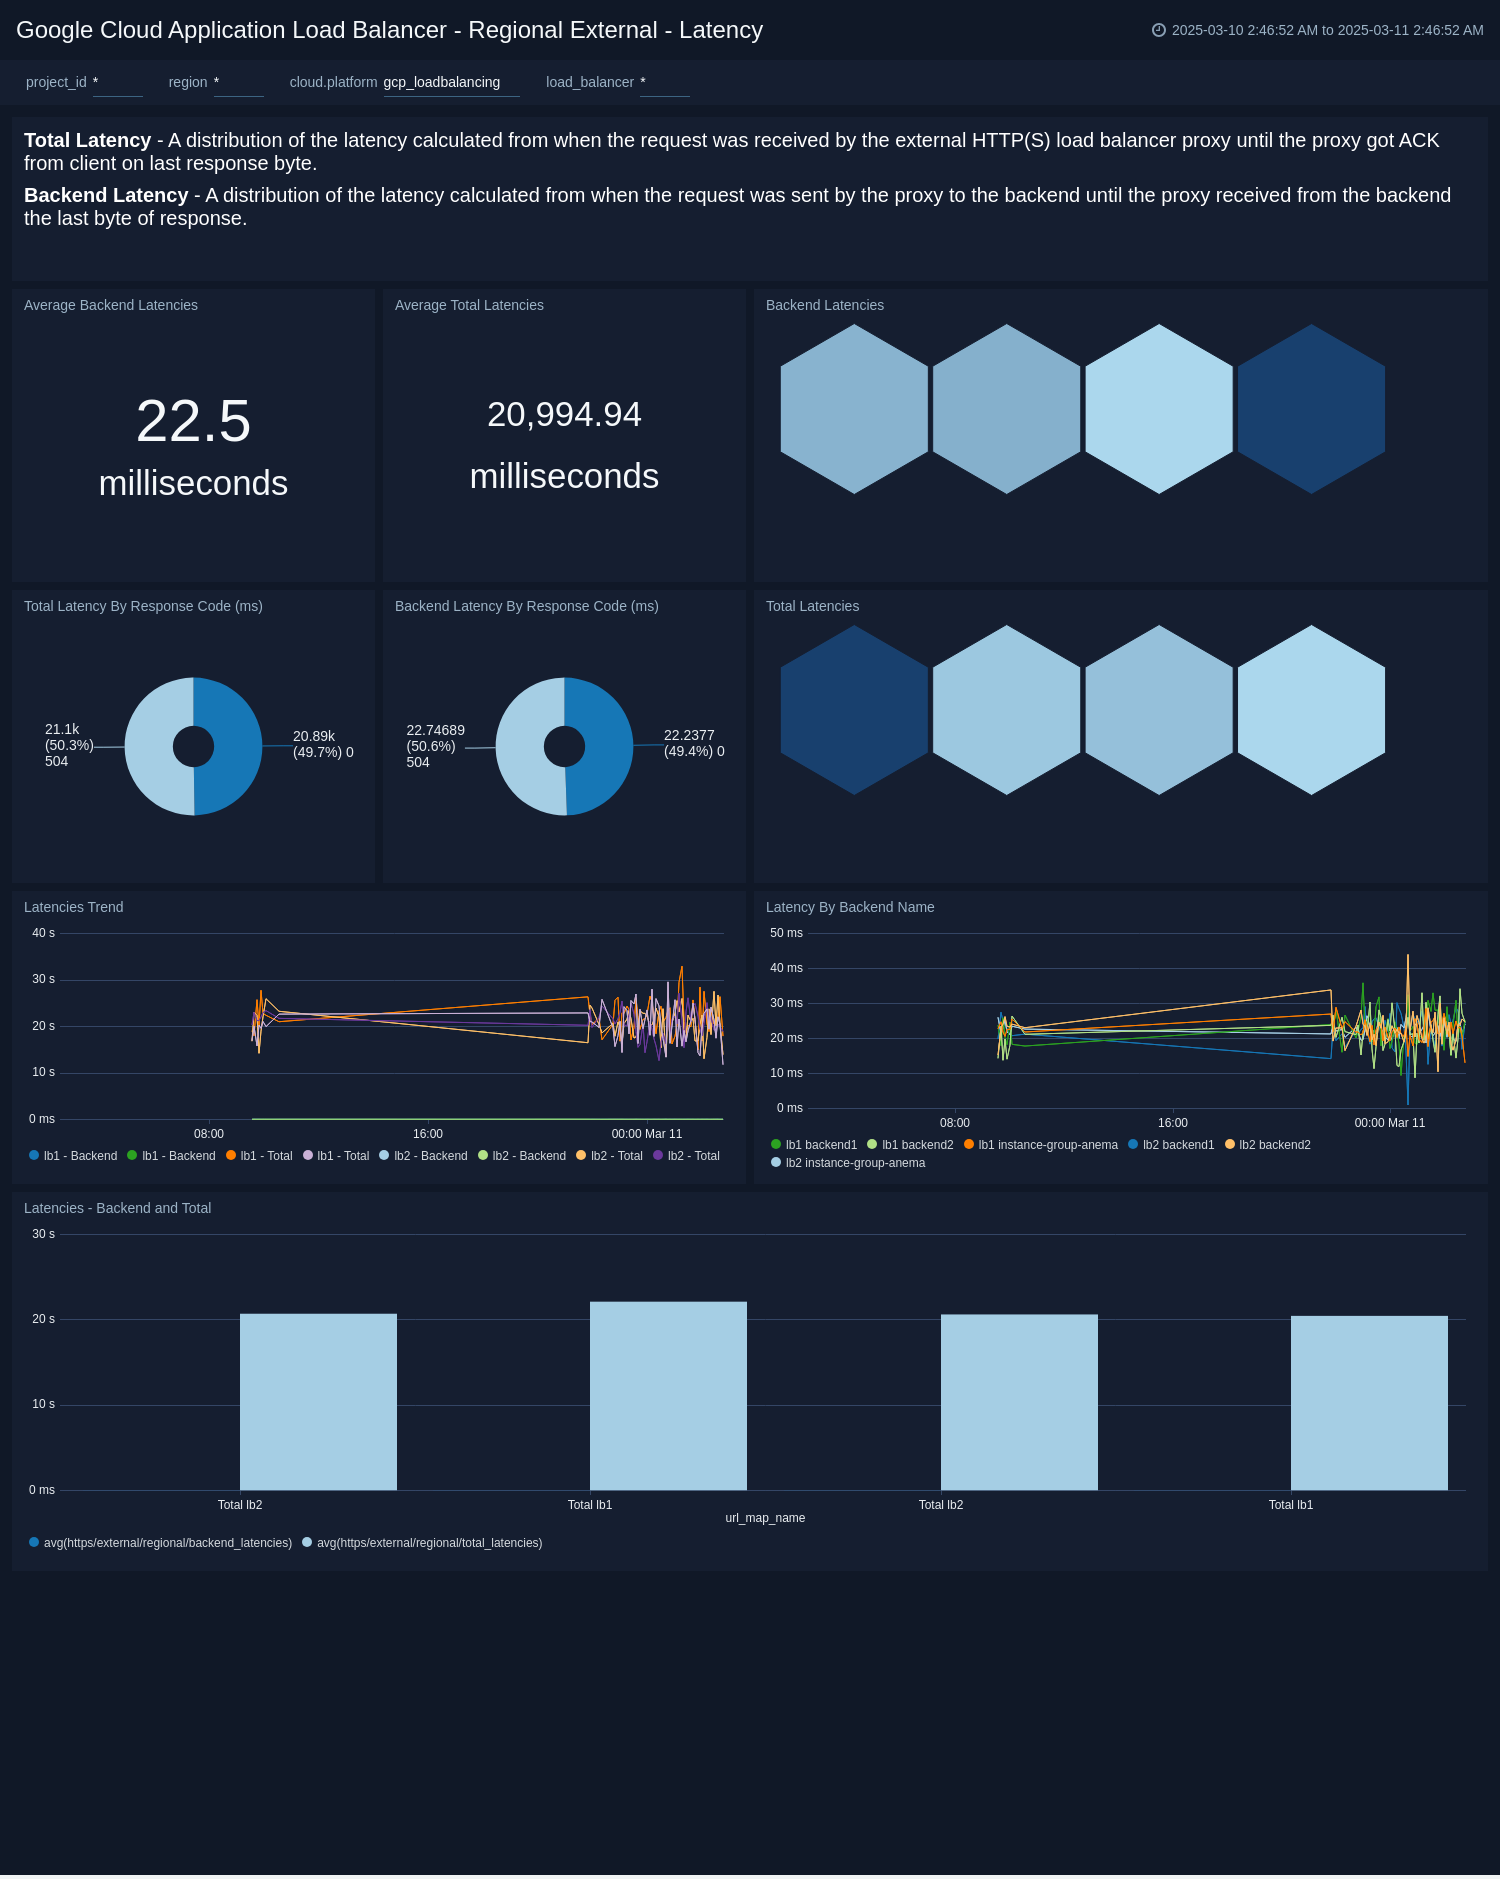
Regional External - Latency
This dashboard helps you monitor average latency between client- load balancer and load balancer - backend. You can also monitor latency by response code, latency trends and latency by load balancer.
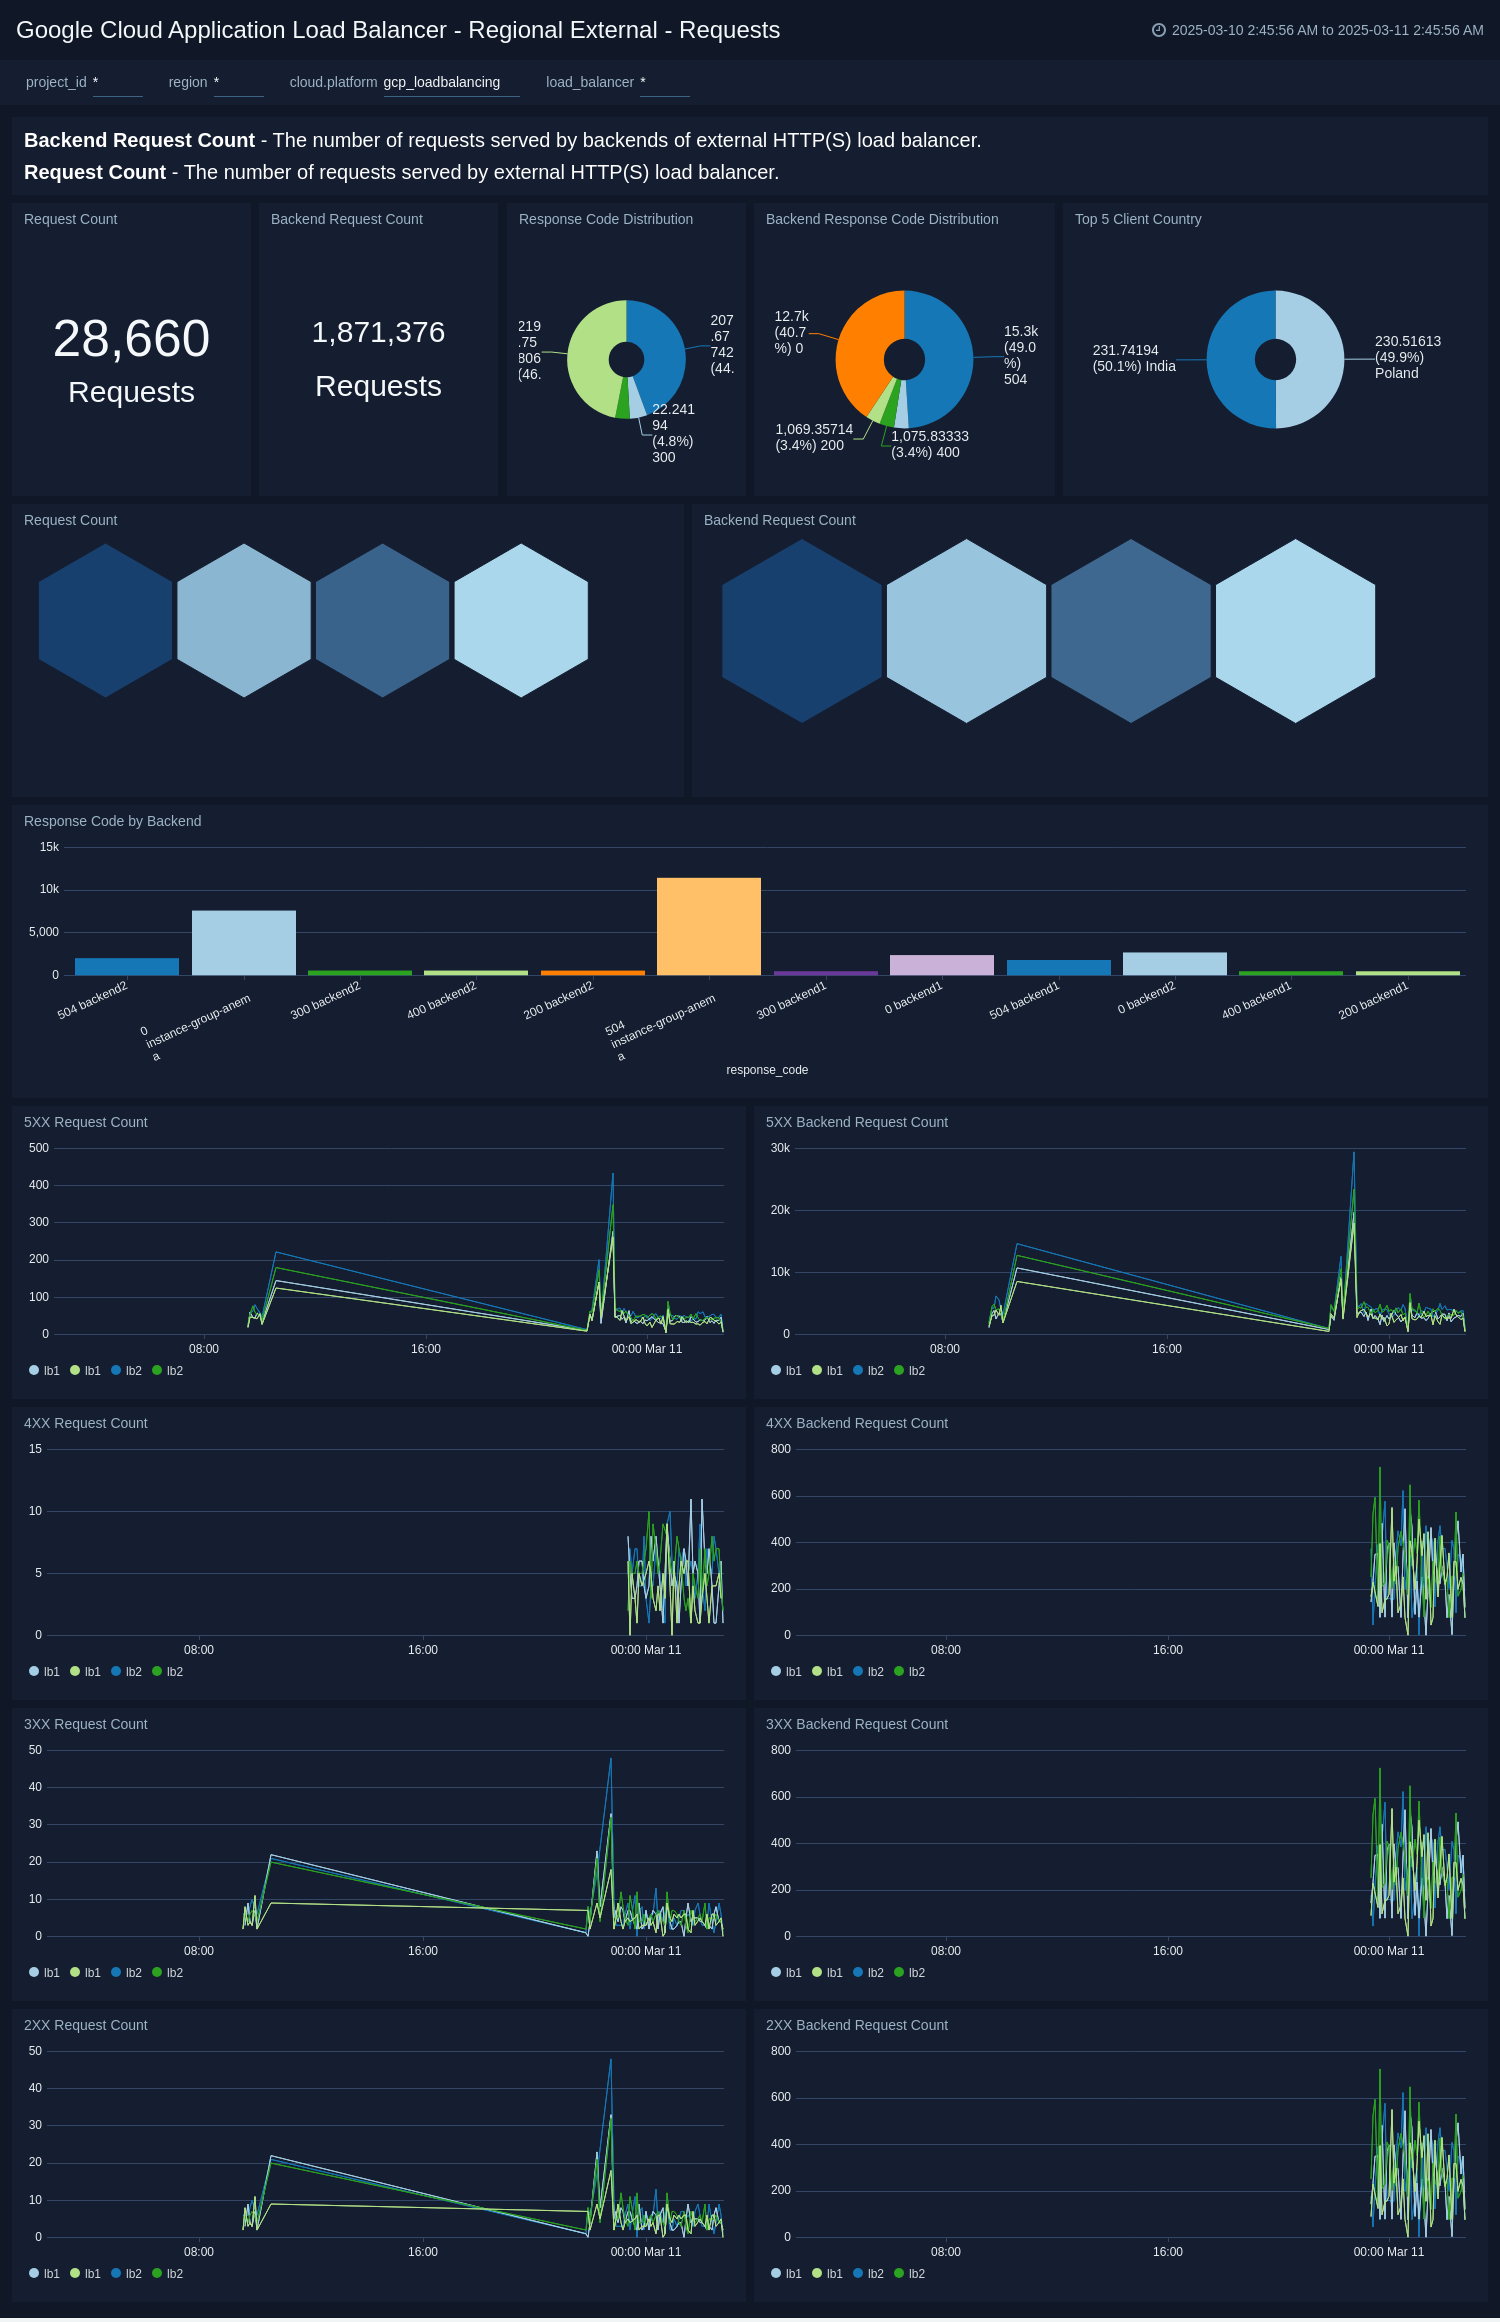
Regional External - Requests
This dashboard helps you monitor total request count between client- load balancer and load balancer - backend. You can also monitor request count by response code, response code by backends, and trends for different response code classes - 2x, 3xx, 4xx and 5xx
Upgrade/Downgrade the Google Cloud Load Balancing app (Optional)
To update the app, do the following:
Next-Gen App: To install or update the app, you must be an account administrator or a user with Manage Apps, Manage Monitors, Manage Fields, Manage Metric Rules, and Manage Collectors capabilities depending upon the different content types part of the app.
- Select App Catalog.
- In the Search Apps field, search for and then select your app.
Optionally, you can identify apps that can be upgraded in the Upgrade available section. - To upgrade the app, select Upgrade from the Manage dropdown.
- If the upgrade does not have any configuration or property changes, you will be redirected to the Preview & Done section.
- If the upgrade has any configuration or property changes, you will be redirected to the Setup Data page.
- In the Configure section of your respective app, complete the following fields.
- Field Name. If you already have collectors and sources set up, select the configured metadata field name (eg _sourcecategory) or specify other custom metadata (eg: _collector) along with its metadata Field Value.
- Click Next. You will be redirected to the Preview & Done section.
Post-update
Your upgraded app will be installed in the Installed Apps folder and dashboard panels will start to fill automatically.
See our Release Notes changelog for new updates in the app.
To revert the app to a previous version, do the following:
- Select App Catalog.
- In the Search Apps field, search for and then select your app.
- To version down the app, select Revert to < previous version of your app > from the Manage dropdown.
Uninstalling the Google Cloud Load Balancing app (Optional)
To uninstall the app, do the following:
- Select App Catalog.
- In the 🔎 Search Apps field, run a search for your desired app, then select it.
- Click Uninstall.
Create monitors for GCP load balancer app
From your App Catalog:
- From the Sumo Logic navigation, select App Catalog.
- In the Search Apps field, search for and then select your app.
- Make sure the app is installed.
- Navigate to What's Included tab and scroll down to the Monitors section.
- Click Create next to the pre-configured monitors. In the create monitors window, adjust the trigger conditions and notifications settings based on your requirements.
- Scroll down to Monitor Details.
- Under Location click on New Folder.
note
By default, monitor will be saved in the root folder. So to make the maintenance easier, create a new folder in the location of your choice.
- Enter Folder Name. Folder Description is optional.
tip
Using app version in the folder name will be helpful to determine the versioning for future updates.
- Click Create. Once the folder is created, click on Save.
GCP load balancer alerts
These alerts are metric based and will work for all three type of Application load balancers.
| Alert Name | Alert Description and Conditions | Alert Condition | Recover Condition |
|---|---|---|---|
GCP Application Load Balancer - High 4XX Errors | This alert fires where there are too many HTTP requests (default >5%) with a response status of 4xx within an interval of 5 minutes are detected for any type of application load balancer. | Count >= 5 | Count < 5 |
GCP Application Load Balancer - High 5XX Errors | This alert fires where there are too many HTTP requests (default >5%) with a response status of 5xx within an interval of 5 minutes are detected for any type of application load balancer. | Count >= 5 | Count < 5 |
GCP Application Load Balancer - High Latency | This alert fires when we detect that the average latency for a given Application load balancer (any type) within a time interval of 5 minutes is greater than given value (default three seconds). | Count >= 3000 | Count < 3000 |