Azure Active Directory
Azure Active Directory is a cloud-based directory and identity management service that provides directory services, application access management, and identity protection. The Sumo Logic app for Azure helps you to monitor activity in the Azure Active Directory. These dashboards provide insight into role management, user management, group management, successful and failed sign-in events, directory management, and application management data that helps you understand your users' experience.
Log types
The app uses the following log types:
Only global administrators, security administrators, security readers, and report readers can view sign-ins and enable collection for Sign-in Events.
The Sumo Logic app for Azure Active Directory presents information about activity in Azure Active Directory, including role management, user management, group management, directory management, and application management.
Prerequisites
- An Azure subscription must be associated (attached) to AAD. For more information, see the Azure Active Directory documentation.
- To export Azure Activity logs to reports, be sure you have met the Azure Active Directory requirements.
Collect logs for the Azure Active Directory app
To set up the logs collection in Sumo Logic:
- Follow the directions outlined in Azure Event Hubs Source for Logs to create an Azure event hub with the proper credentials, and to configure the event hub source in Sumo Logic.
- Follow the directions outlined in Microsoft Entra to stream activity logs to an event hub.
- Sign in to the Microsoft Entra admin center as at least a Security Administrator.
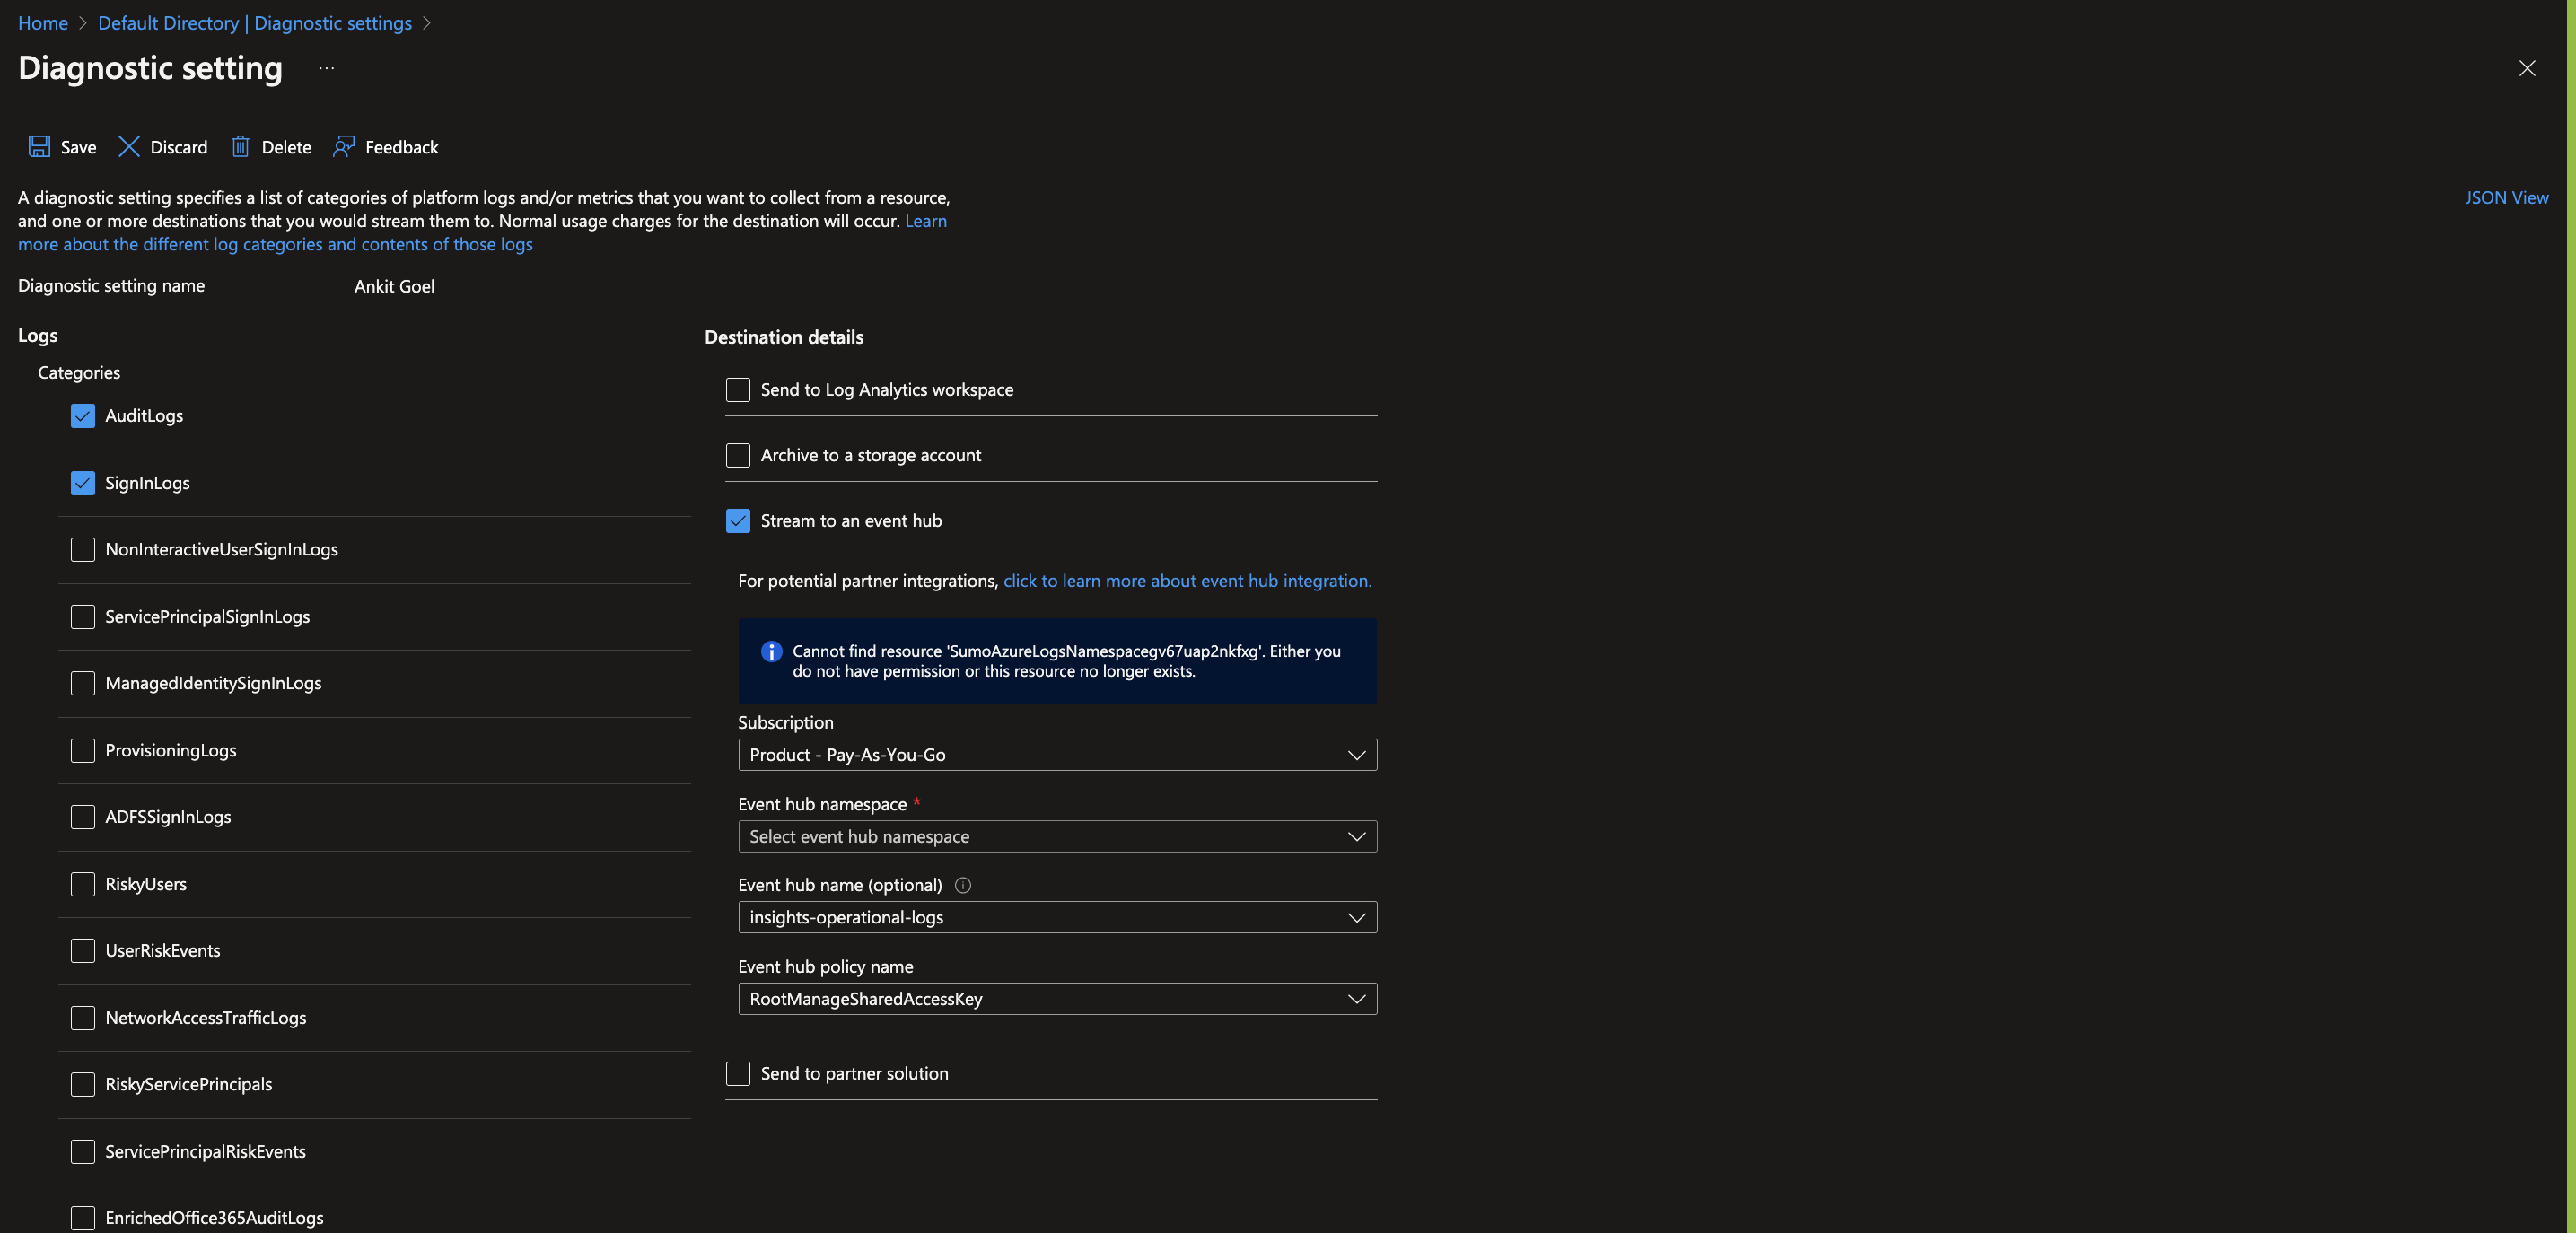
- Browse to Identity > Monitoring & health > Diagnostic settings. You can also select Export Settings from either the Audit Logs or Sign-ins page.
- Select + Add diagnostic setting to create a new integration or select Edit setting for an existing integration.
- Enter a Diagnostic setting name. If you're editing an existing integration, you can't change the name.
- Select the log categories that you want to stream (Audit and Sign-in logs).
- Select the Stream to an event hub check box.
- Select the Azure subscription, event hubs namespace, and event hub where you want to route the logs.
When you configure the event hubs source, define your source category to ease the querying process. A hierarchical approach allows you to make use of wildcards. For example: Azure/AAD/Logs.
Install the Azure Active Directory app
Now that you have set up collection for the Azure Active Directory, install the Sumo Logic app to use the pre-configured searches and dashboards that provide visibility into your environment for real-time analysis of overall usage.
To install the app, do the following:
Next-Gen App: To install or update the app, you must be an account administrator or a user with Manage Apps, Manage Monitors, Manage Fields, Manage Metric Rules, and Manage Collectors capabilities depending upon the different content types part of the app.
- Select App Catalog.
- In the 🔎 Search Apps field, run a search for your desired app, then select it.
- Click Install App.
note
Sometimes this button says Add Integration.
- Click Next in the Setup Data section.
- In the Configure section of your respective app, complete the following fields.
- Field Name. If you already have collectors and sources set up, select the configured metadata field name (eg _sourcecategory) or specify other custom metadata (eg: _collector) along with its metadata Field Value.
- Click Next. You will be redirected to the Preview & Done section.
Post-installation
Once your app is installed, it will appear in your Installed Apps folder, and dashboard panels will start to fill automatically.
Each panel slowly fills with data matching the time range query received since the panel was created. Results will not immediately be available but will be updated with full graphs and charts over time.
Viewing Azure Active Directory dashboards
All dashboards have a set of filters that you can apply to the entire dashboard. Use these filters to drill down and examine the data to a granular level.
- You can change the time range for a dashboard or panel by selecting a predefined interval from a drop-down list, choosing a recently used time range, or specifying custom dates and times. Learn more.
- You can use template variables to drill down and examine the data on a granular level. For more information, see Filtering Dashboards with Template Variables.
- Most Next-Gen apps allow you to provide the scope at the installation time and are comprised of a key (
_sourceCategoryby default) and a default value for this key. Based on your input, the app dashboards will be parameterized with a dashboard variable, allowing you to change the dataset queried by all panels. This eliminates the need to create multiple copies of the same dashboard with different queries.
Overview
See an overview of Azure Active Directory activity, including operation names, audit event categories, log levels, and result types.
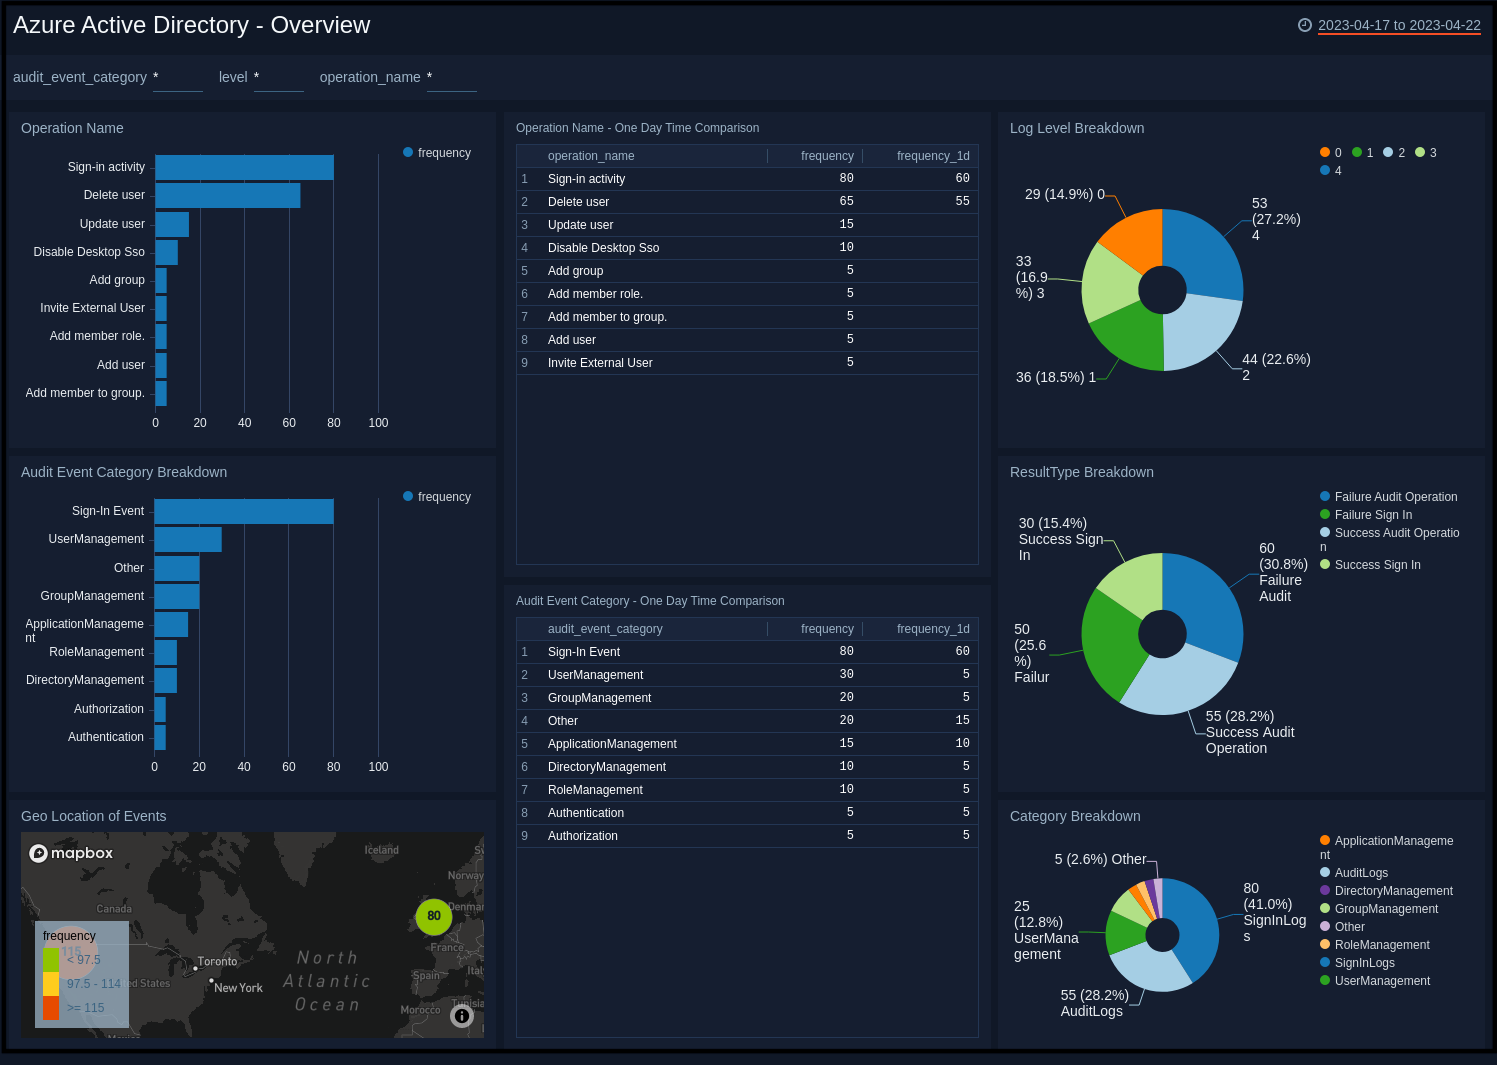
Operation Name. Shows the name of operations, and a count of how many times they happened on a bar chart, for the last 24 hours.
Operation Name - One Day Time Comparison. Shows an aggregation table with the names of operations that have happened in the last 24 hours along with a count, and compares it to the count of operations from one day before.
Log Level Breakdown. Shows a breakdown of the level of logs on a pie chart for the last 24 hours.
Audit Event Category Breakdown. Shows a breakdown of the category of audit events along with a count on a bar chart for the last 24 hours.
Audit Event Category - One Day Time Comparison. Shows an aggregation table with the categories of audit events in the last 24 hours along with a count, and compares it to the count of categories from one day before.
ResultType Breakdown. Shows a breakdown of the types of results (success or failure) on a pie chart, for the last 24 hours.
Geo Location of Events. Performs a geo lookup query and displays the location and number of events on a map of the world for the last 24 hours.
Category Breakdown. Shows a breakdown of the categories on a pie chart for the last 24 hours.
Role Management
See information about role management in Azure Activity Directory, including role updates, successful events, and users added or removed from roles.
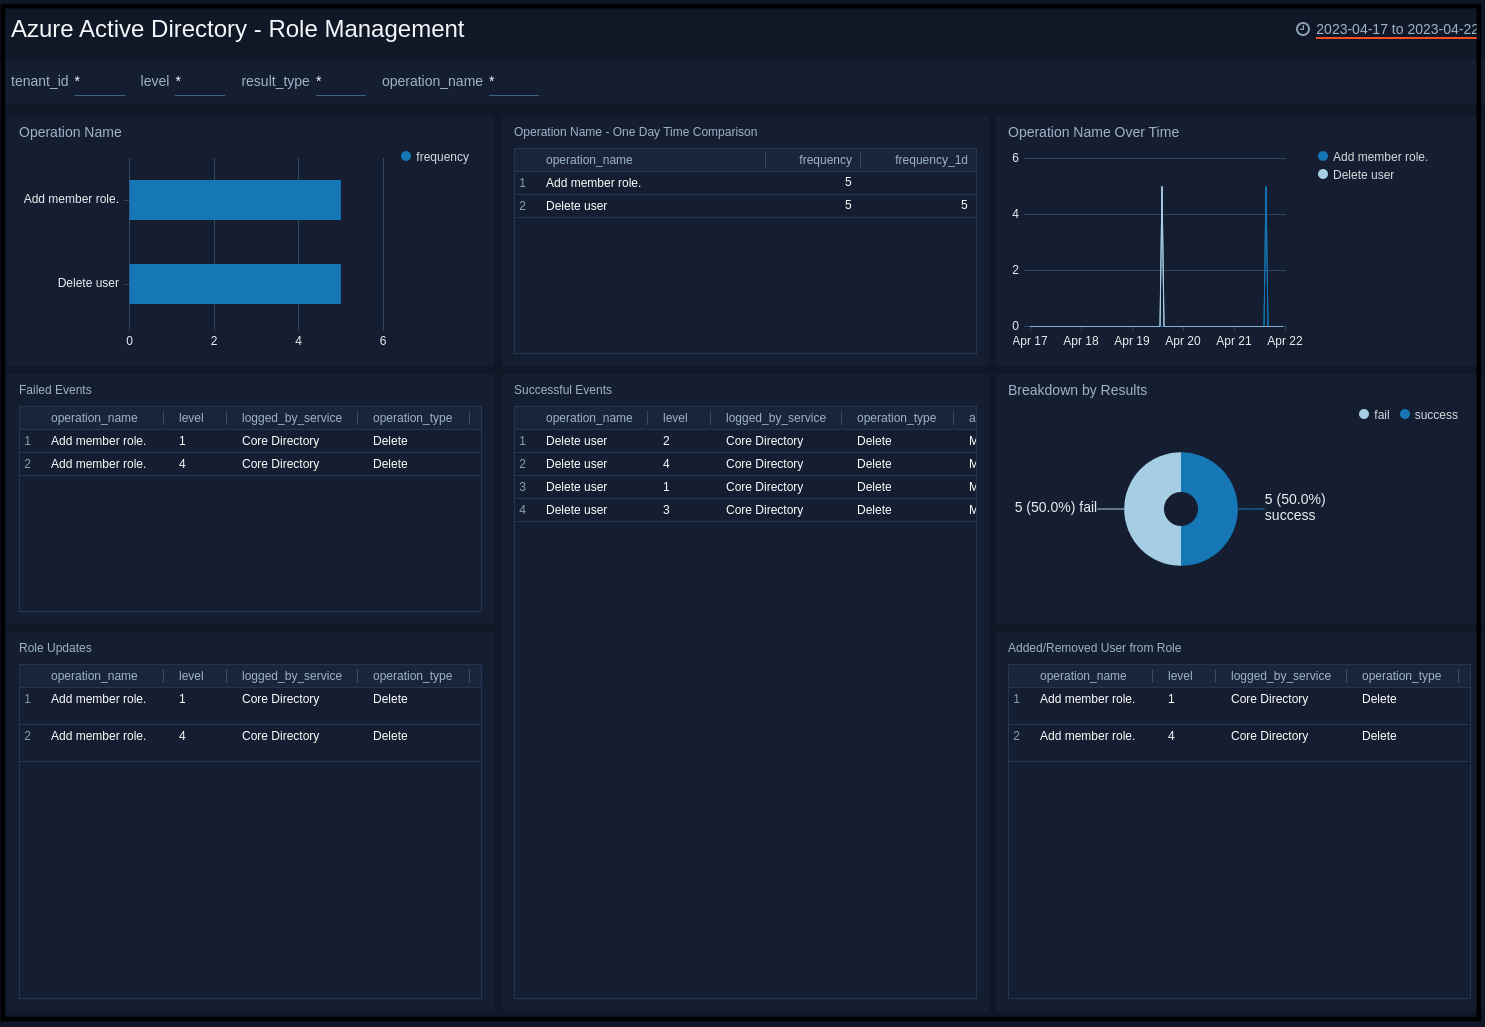
Operation Name. Shows the name of role management operations, and a count of how many times they happened on a bar chart, for the last 24 hours.
Operation Name - One Day Time Comparison. Shows an aggregation table with the names of role management operations that have happened in the last 24 hours along with a count, and compares it to the count of operations from one day before.
Operation Name Over Time. Shows a count of role management operations along with the name on a line chart for the last 24 hours.
Failed Events. Shows an aggregation table of failed events with columns for the operation names, result types, result description identity, and count for the last 24 hours.
Successful Events. Shows an aggregation table of successful events with columns for the operation names, result types, result description identity, target name, and target source name for the last 24 hours.
Breakdown by Results. Shows a breakdown of the types of results (success or failure) on a pie chart, for the last 24 hours.
Role Updates. Shows an aggregation table of role updates with columns for the operation names, result types, result description identity, role name, target source name, and count for the last 24 hours.
Added/Removed User from Role. Shows an aggregation table of users added or removed from a role with columns for the operation names, result types, result description identity, user name, and target source name for the last 24 hours.
User Management
See information about user management in Azure Activity Directory, including external user invites, updated and deleted users, users added and outliers in user management events.
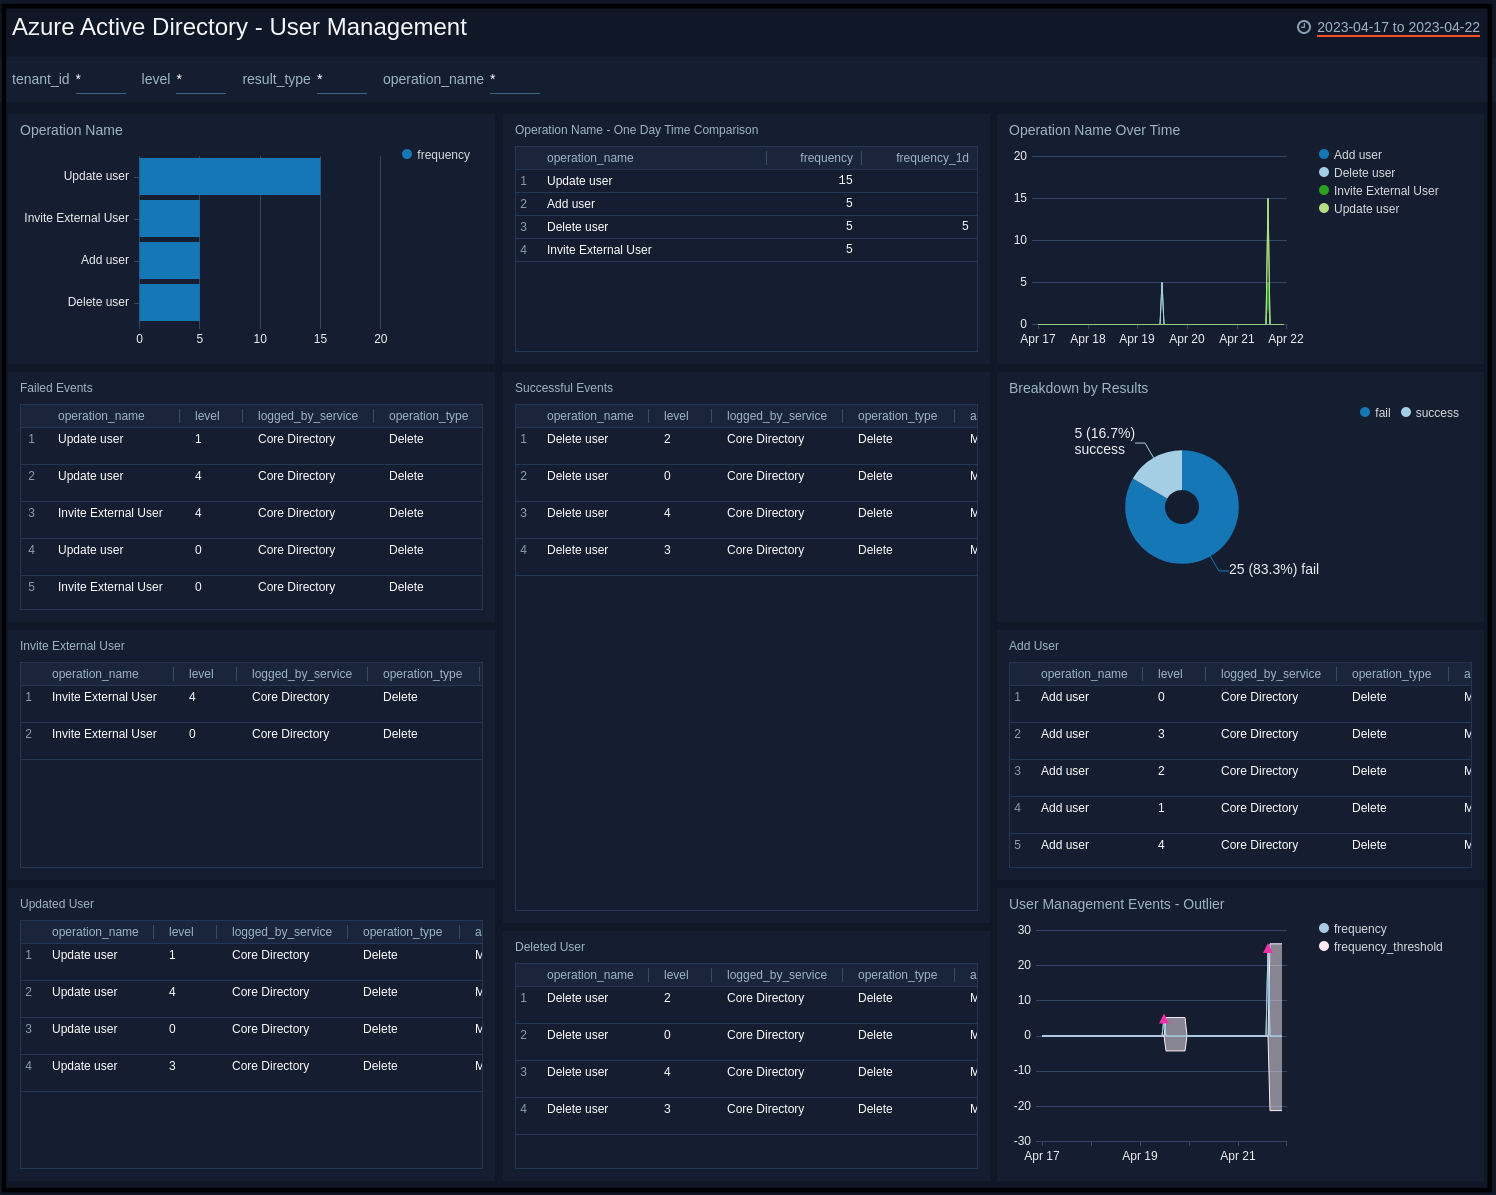
Operation Name. Shows the name of user management operations, and a count of how many times they happened on a bar chart, for the last 24 hours.
Operation Name - One Day Time Comparison. Shows an aggregation table with the names of user management operations that have happened in the last 24 hours along with a count, and compares it to the count of operations from one day before.
Operation Name Over Time. Shows a count of user management operations along with the name on a line chart for the last 24 hours.
Failed Events. Shows an aggregation table of failed events with columns for the operation names, result types, result descriptions, identity, and count for the last 24 hours.
Successful Events. Shows an aggregation table of successful events with columns for the operation names, identity, result types, and count for the last 24 hours.
Breakdown by Results. Shows a breakdown of the types of results (success or failure) on a pie chart, for the last 24 hours.
Invite External User. Shows an aggregation table of successful events with columns for the time, operation names, result types, target source name, identity, result description, and count for the last 24 hours.
Add User. Shows an aggregation table of added users with columns for the time, operation names, result types, target source name, identity, and count for the last 24 hours.
Updated User. Shows an aggregation table of updated users with columns for the time, operation names, result types, target source name, identity, and count for the last 24 hours.
Deleted User. Shows an aggregation table of deleted users with columns for the time, operation names, result types, target source name, identity, and count for the last 24 hours.
User Management Events - Outlier. Shows outliers in user management events with count and thresholds on a line chart, for the last 24 hours.
Application Management
See information about application management in Azure Activity Directory, including application consent, deleted applications, applications added or updated, and service principal updates.
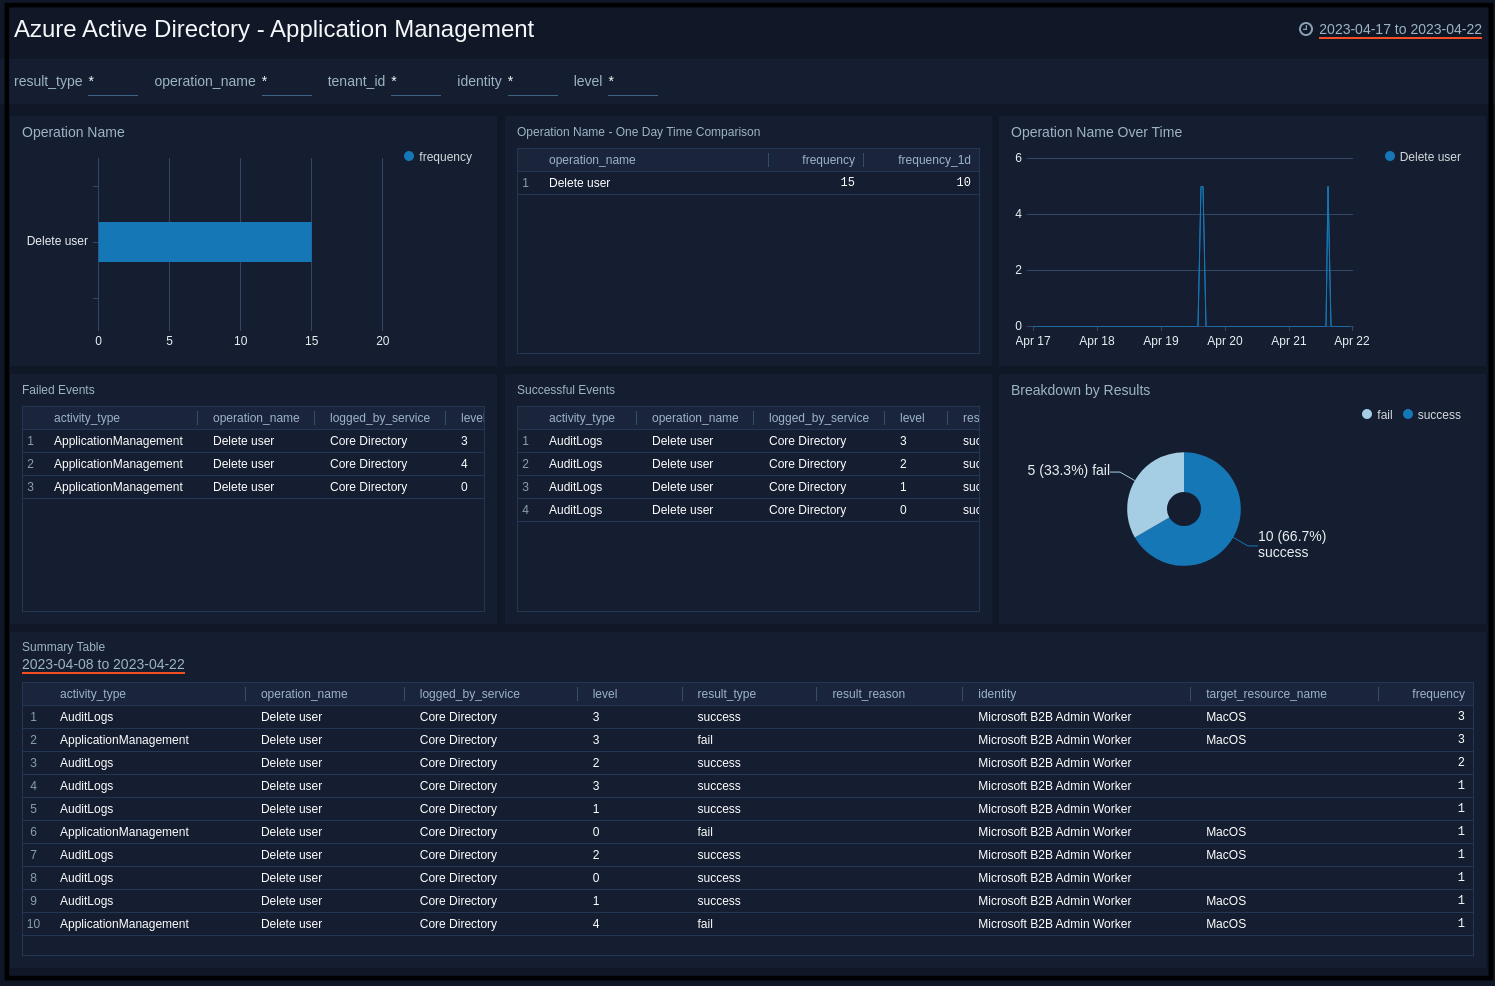
Operation Name. Shows the name of application management operations, and a count of how many times they happened on a bar chart, for the last 24 hours.
Operation Name - One Day Time Comparison. Shows an aggregation table with the names of application management operations that have happened in the last 24 hours along with a count, and compares it to the count of operations from one day before.
Operation Name Over Time. Shows a count of application management operations along with the name on a line chart for the last 24 hours.
Failed Events. Shows an aggregation table of failed events with columns for the operation names, result types, result descriptions, identity, and count for the last 24 hours.
Successful Events. Shows an aggregation table of successful events with columns for the operation names, result types, result descriptions, identity, and count for the last 24 hours.
Breakdown by Results. Shows a breakdown of the types of results (success or failure) on a pie chart, for the last 24 hours.
Application Management Events - Outlier. Shows outliers in application management events with count and thresholds on a line chart, for the last 24 hours.
Deleted Applications. Shows an aggregation table of deleted applications with columns for the operation names, result types, result descriptions, identity, target source name, and count for the last 24 hours.
Service Principal Updates. Shows an aggregation table of service principal updates with columns for the operation names, result types, result descriptions, identity, target source name, and count for the last 24 hours.
Consent Given to Application. Shows an aggregation table of consent given to applications with columns for the operation names,result types, result descriptions, identity, target source name, and count for the last 24 hours.
Applications Added or Updated. Shows an aggregation table of applications added or updated with columns for the operation names, result types, result descriptions, identity, target source name, and count for the last 24 hours.
Directory Management
See information about directory management in Azure Activity Directory, including failed events, successful events, and disables desktop SSOs. Operation Name. Shows the name of directory management operations, and a count of how many times they happened on a bar chart, for the last 24 hours.
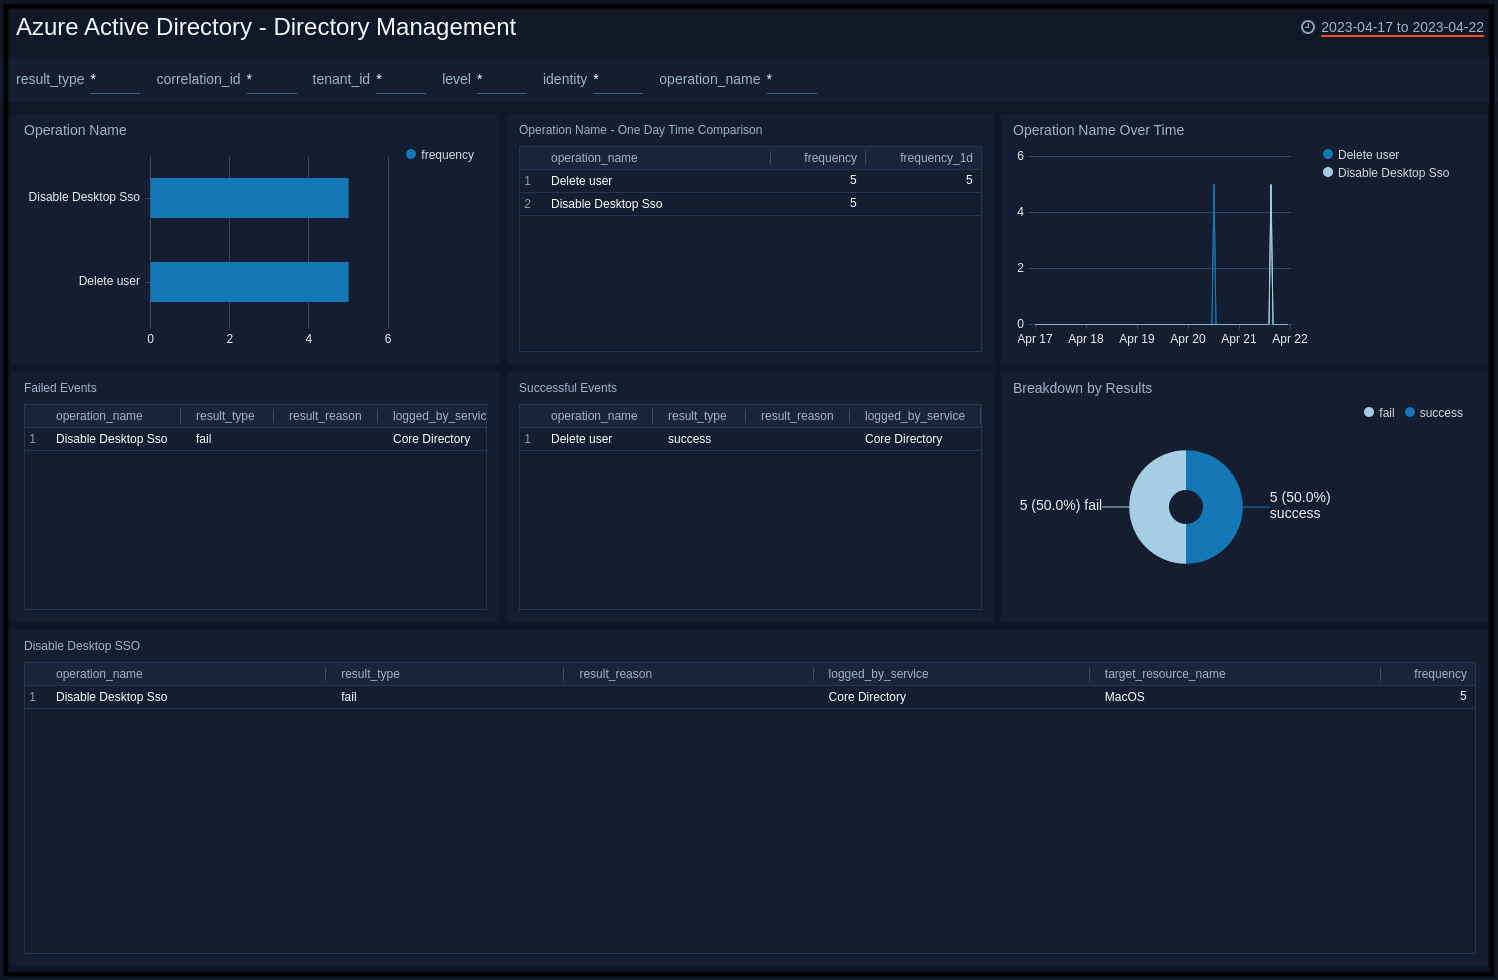
Operation Name - One Day Time Comparison. Shows an aggregation table with the names of directory management operations that have happened in the last 24 hours along with a count, and compares it to the count of operations from one day before.
Operation Name Over Time. Shows a count of directory management operations along with the name on a line chart for the last 24 hours.
Failed Events. Shows an aggregation table of failed events with columns for the operation names, result types, result descriptions, identity, and count for the last 24 hours.
Successful Events. Shows an aggregation table of successful events with columns for the operation names, result types, result descriptions, identity, and count for the last 24 hours.
Breakdown by Results. Shows a breakdown of the types of results (success or failure) on a pie chart, for the last 24 hours.
Disable Desktop SSO. Shows an aggregation table of disabled desktop SSOs with columns for the operation names, result types, result descriptions, identity, target source name, and count for the last 24 hours.
Group Management
See information about group management in Azure Activity Directory, including groups added, and a list of members added or removed from groups.
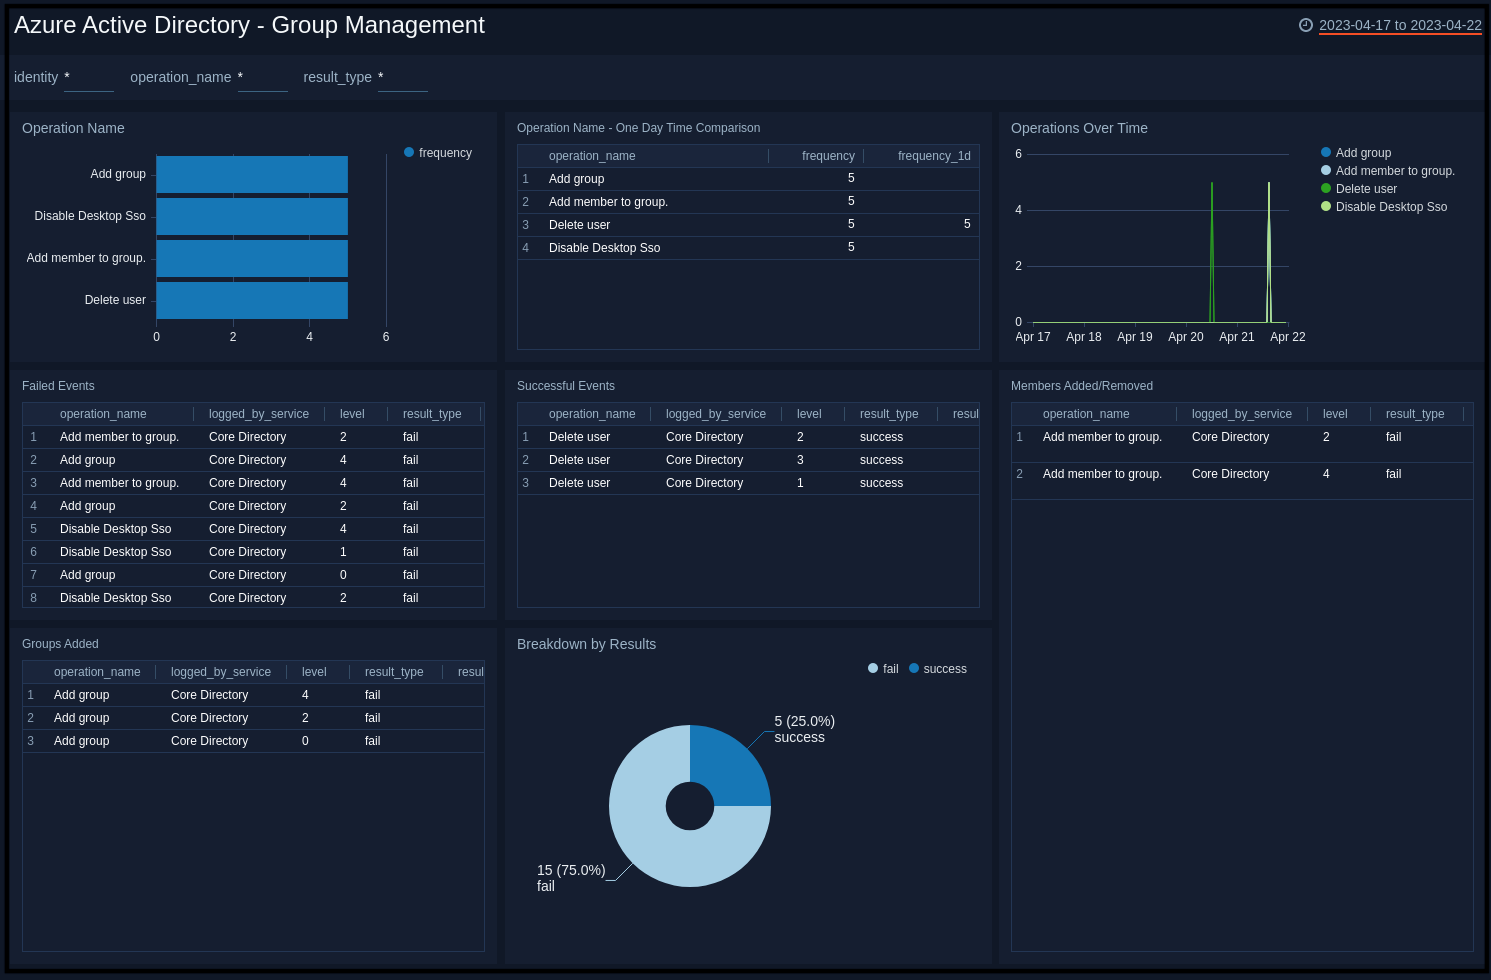
Operation Name. Shows the name of group management operations, and a count of how many times they happened on a bar chart, for the last 24 hours.
Operation Name - One Day Time Comparison. Shows an aggregation table with the names of group management operations that have happened in the last 24 hours along with a count, and compares it to the count of operations from one day before.
Operations Over Time. Shows a count of group management operations along with the name on a line chart for the last 24 hours.
Failed Events. Shows an aggregation table of failed events with columns for the operation names, result types, result descriptions, identity, and count for the last 24 hours.
Successful Events. Shows an aggregation table of successful events with columns for the operation names, result types, result descriptions, identity, and count for the last 24 hours.
Members Added/Removed. Shows an aggregation table of successful events with columns for the time, operation names, result types, target source name, identity, display name, and count for the last 24 hours.
Groups Added. Shows an aggregation table of groups added with columns for the time, operation names, result types, target source name, identity, and count for the last 24 hours.
Breakdown by Results. Shows a breakdown of the types of results (success or failure) on a pie chart, for the last 24 hours.
Authorization/Authentication/Other
See information about Authorization in Azure Active Directory including the name of authorization operations done, successful and failed authorization events, and breakdown of results.
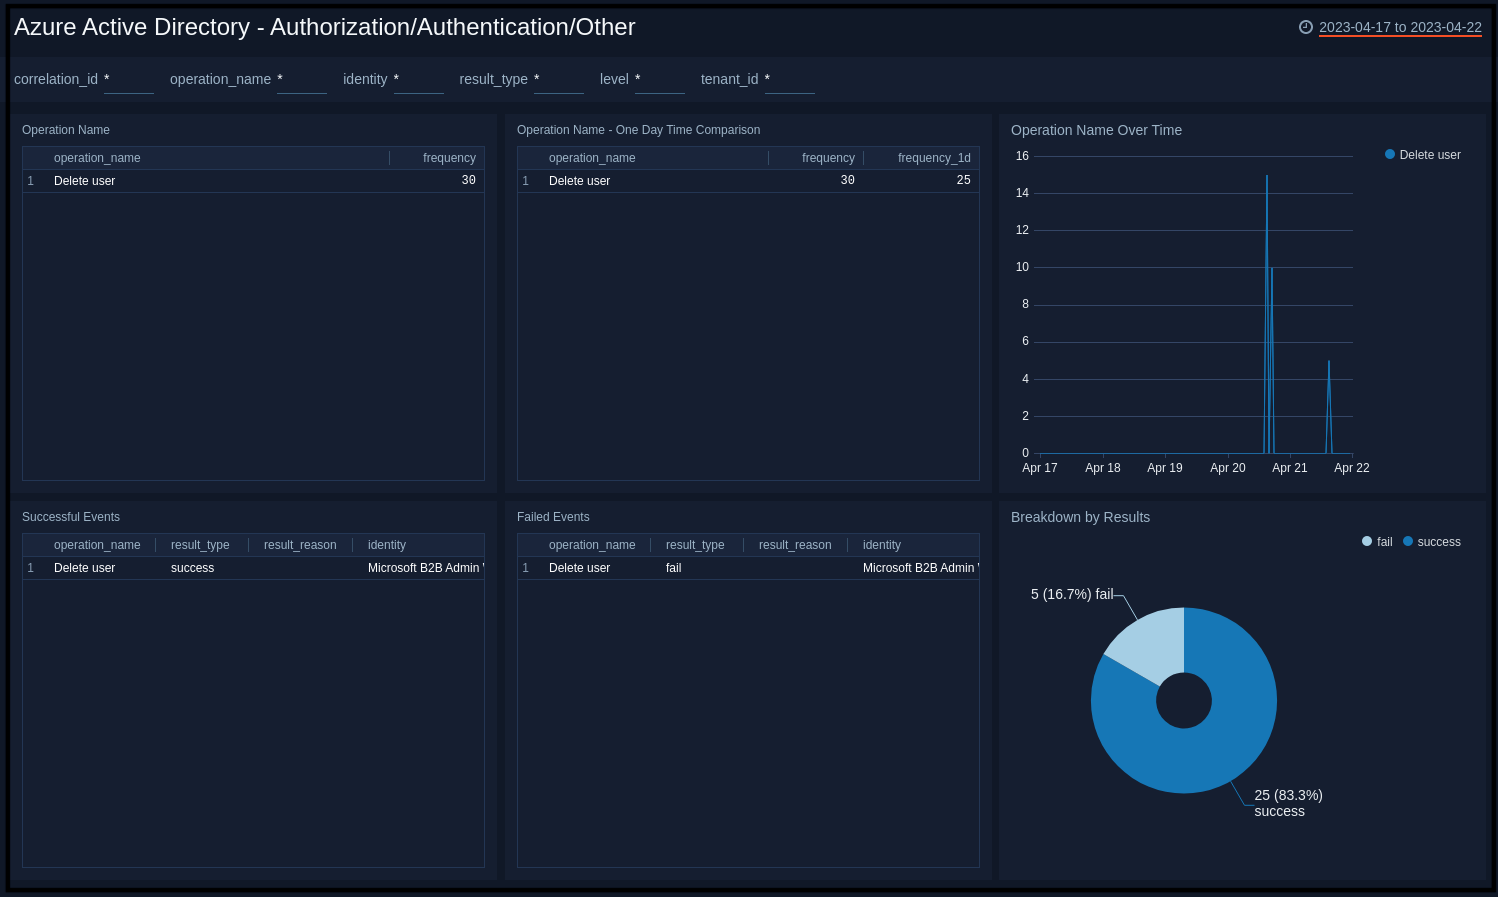
Operation Name. Shows the name of authorizations or authentication, and a count of how many times they happened on a bar chart, for the last 24 hours.
Operation Name - One Day Time Comparison. Shows an aggregation table with the names of authorizations or authentication that have happened in the last 24 hours along with a count, and compares it to the count of operations from one day before.
Operations Over Time. Shows a count of authorizations or authentication along with the name on a line chart for the last 24 hours.
Successful Events. Shows an aggregation table of successful events with columns for the operation names, result types, result descriptions, target source name, identity, and count for the last 24 hours.
Failed Events. Shows an aggregation table of failed events with columns for the operation names, result types, result descriptions, identity, target source name, and count for the last 24 hours.
Breakdown by Results. Shows a breakdown of the types of results (success or failure) on a pie chart, for the last 24 hours.
Successful Sign-In Events
See information about successful sign-in events in your Azure AD, including the geo-location of sign-in activity, risky sign-ins, breakdown by browser & application, and any anomalies in the login count.
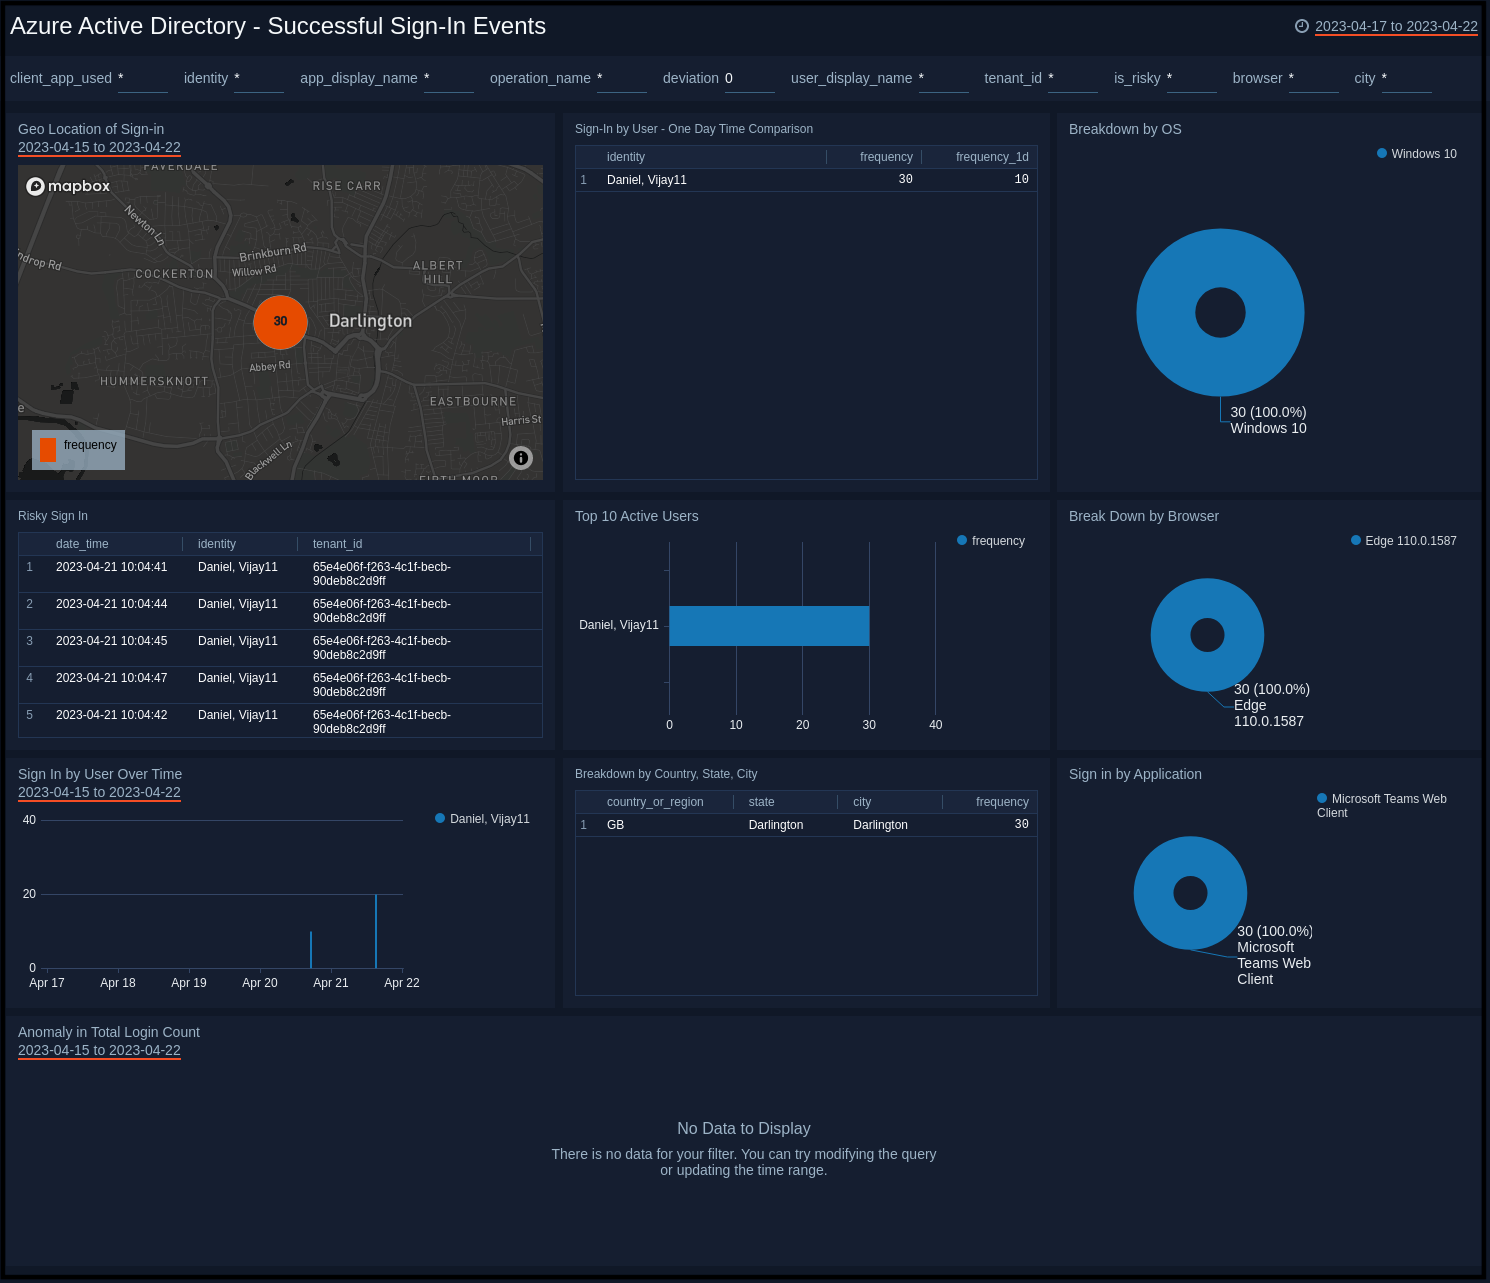
Geo Location of Sign-in. Performs a geo lookup query and displays the location and number of successful sign-in events on a map of the world for the last 24 hours.
Sign-In by User - One Day Time Comparison. Shows an aggregation table with the names of users with successful sign-in events in the last 24 hours along with a count, and compares it to the count of operations from one day before.
Breakdown by OS. Shows breakdown of the operating system that is the source of sign-in events.
Risky Sign In. Shows risky successful sign-in events.
Top 10 Active Users. Shows top 10 active users with successful sign-ins.
Break Down by Browser. Shows breakdown of the browser that is the source of sign-in events.
Sign In by User Over Time. Shows trend of successful sign-in events over time.
Breakdown by Country, State, City. Shows breakdown by country, state, and city.
Sign in by Application. Shows successful sign-in events by Application.
Anomaly in Total Login Count. Shows any Anomaly in the total successful login count over 7 days.
Failure Sign-in Events
See information about failure sign-in events in your Azure AD, including the geo-location of sign-in activity, risky sign-ins, breakdown by browser & application, and any anomalies in the login count.
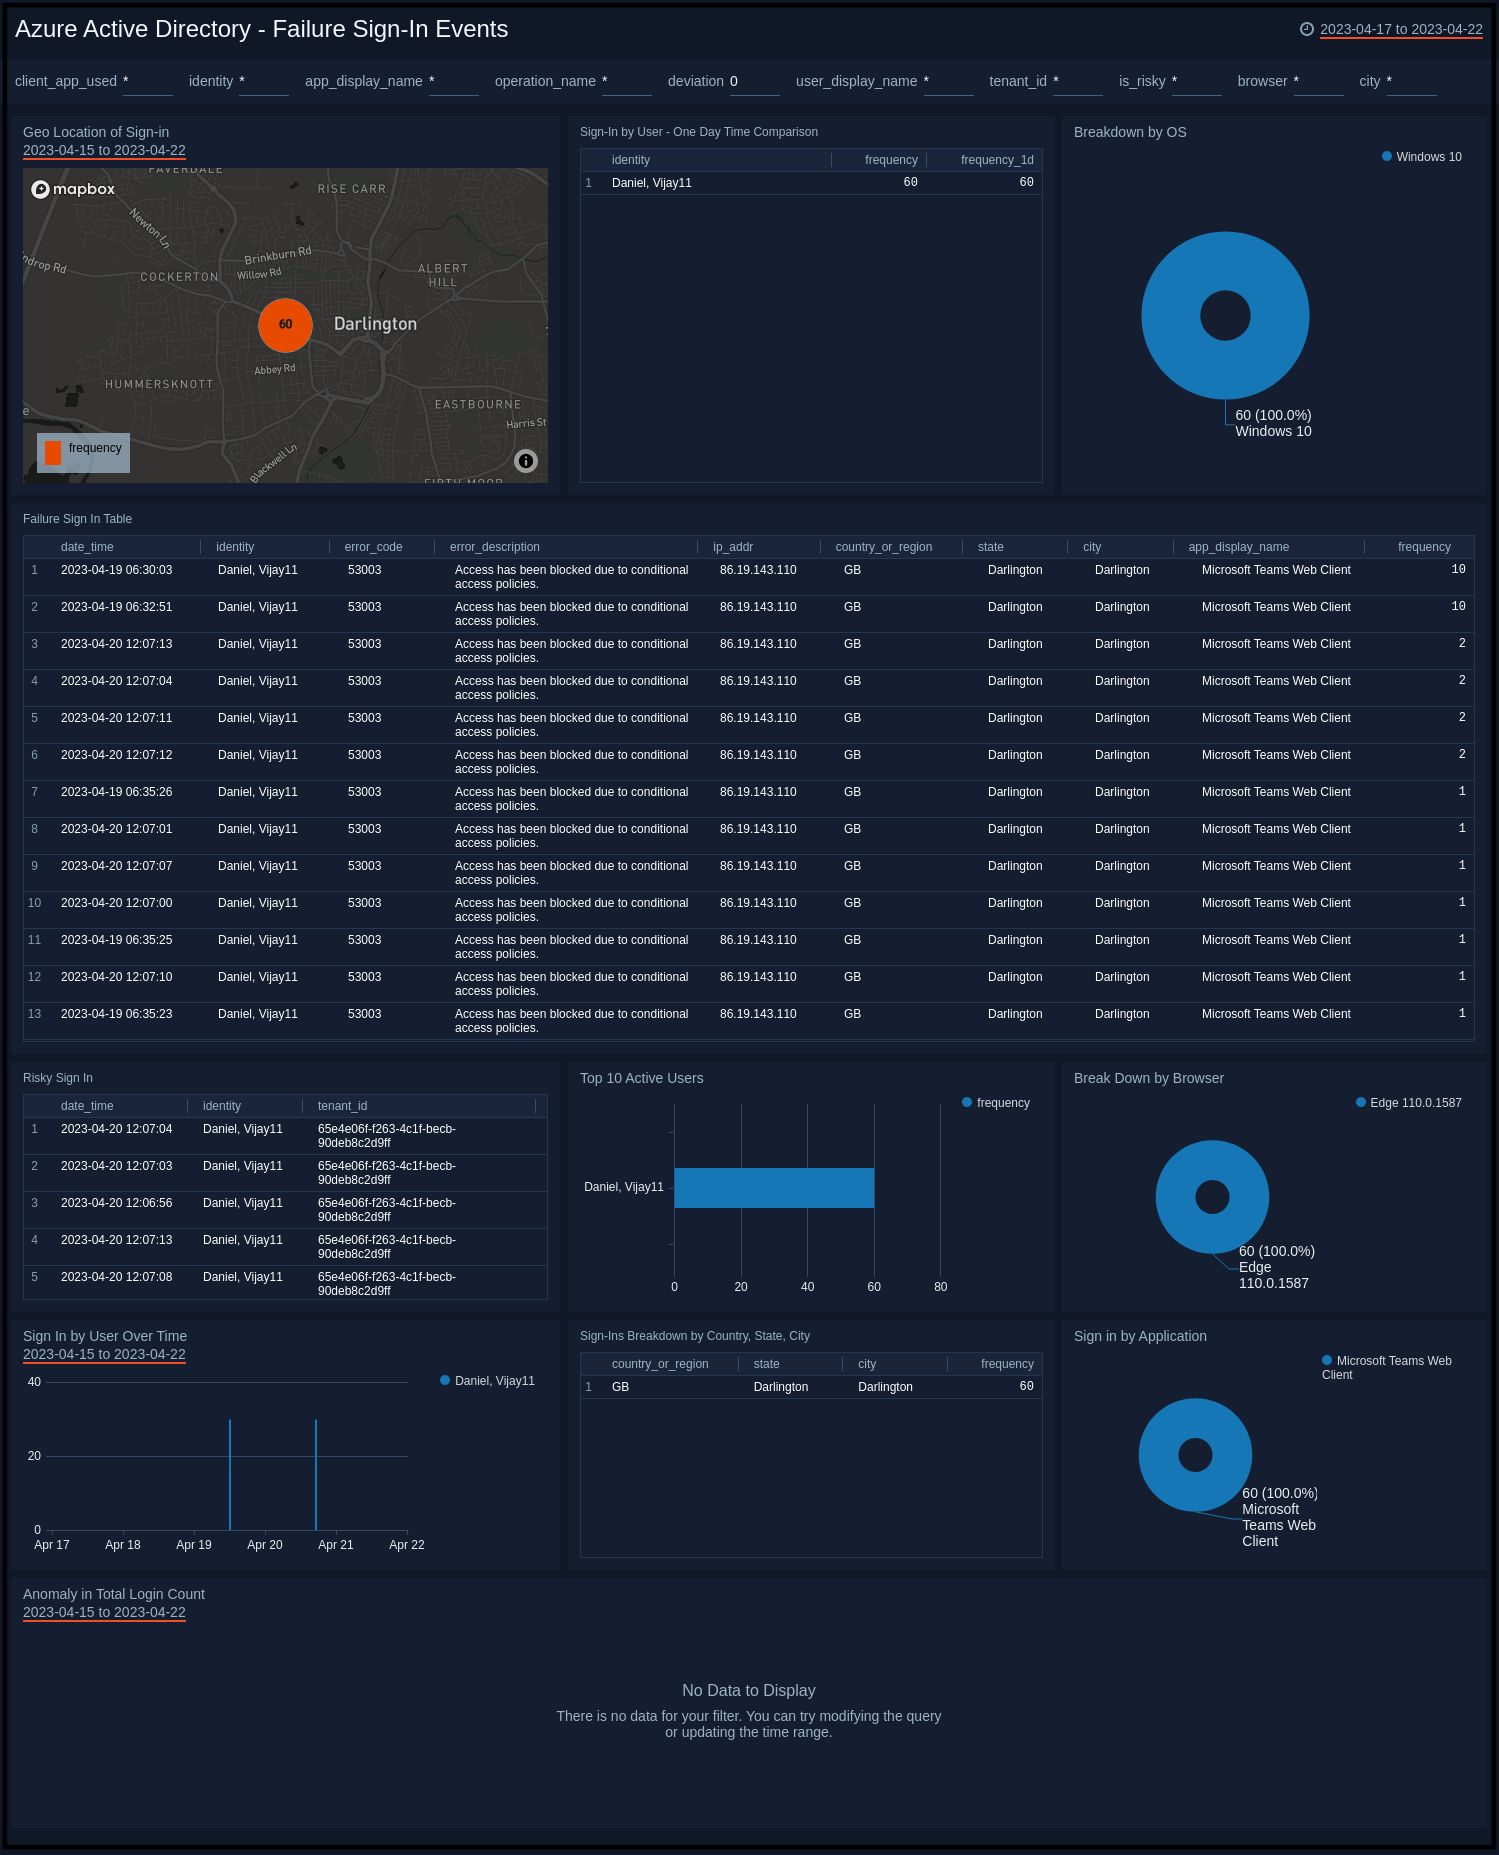
Geo Location of Sign-in. Performs a geo lookup query and displays the location and number of failure sign-in events on a map of the world for the last 24 hours.
Sign-In by User - One Day Time Comparison. Shows an aggregation table with the names of users with failed sign-in events in the last 24 hours along with a count, and compares it to the count of operations from one day before.
Breakdown by OS. Shows breakdown of the operating system that is the source of sign-in events.
Failure Sign In Table. Shows an aggregation table of failure sign-in events with columns for the date time, identity, error code, description, IP address, state, city, country, and source application name with the count for the last 24 hours.
Risky Sign In. Shows risky failure sign-in events.
Top 10 Active Users. Shows top 10 active users with failure sign-in events.
Break Down by Browser. Shows breakdown of the browser that is the source of sign-in events.
Sign In by User Over Time. Shows trend of failure sign-in events over time.
Breakdown by Country, State, City. Shows breakdown by country, state, and city.
Sign in by Application. Shows failure sign-in events by Application.
Anomaly in Total Login Count. Shows any Anomaly in the total failure login count over 7 days.
Upgrade/Downgrade the Azure Active Directory app (Optional)
To update the app, do the following:
Next-Gen App: To install or update the app, you must be an account administrator or a user with Manage Apps, Manage Monitors, Manage Fields, Manage Metric Rules, and Manage Collectors capabilities depending upon the different content types part of the app.
- Select App Catalog.
- In the Search Apps field, search for and then select your app.
Optionally, you can identify apps that can be upgraded in the Upgrade available section. - To upgrade the app, select Upgrade from the Manage dropdown.
- If the upgrade does not have any configuration or property changes, you will be redirected to the Preview & Done section.
- If the upgrade has any configuration or property changes, you will be redirected to the Setup Data page.
- In the Configure section of your respective app, complete the following fields.
- Field Name. If you already have collectors and sources set up, select the configured metadata field name (eg _sourcecategory) or specify other custom metadata (eg: _collector) along with its metadata Field Value.
- Click Next. You will be redirected to the Preview & Done section.
Post-update
Your upgraded app will be installed in the Installed Apps folder and dashboard panels will start to fill automatically.
See our Release Notes changelog for new updates in the app.
To revert the app to a previous version, do the following:
- Select App Catalog.
- In the Search Apps field, search for and then select your app.
- To version down the app, select Revert to < previous version of your app > from the Manage dropdown.
Uninstalling the Azure Active Directory app (Optional)
To uninstall the app, do the following:
- Select App Catalog.
- In the 🔎 Search Apps field, run a search for your desired app, then select it.
- Click Uninstall.