Active Directory JSON - Classic Collector
The Sumo Logic app for Active Directory JSON (2012+) helps you monitor your Windows Active Directory deployment by analyzing Active Directory logs in the JSON based event log format. The app includes predefined searches and dashboards that provide user activity into your environment for real-time analysis of overall usage.
We recommend using the Active Directory JSON App in combination with the Windows JSON App.
Log types
Standard Windows event channels include:
- Security
- System
- Application
Custom event channels, such as PowerShell or Internet Explorer are also supported.
Sample log messages
{
	"TimeCreated":"2020-10-12T08:00:02+000001500Z",
	"EventID":"5137",
	"Task":14081,
	"Correlation":"",
	"Keywords":"Audit Success",
	"Channel":"Security",
	"Opcode":"Info",
	"Security":"",
	"Provider":{
		"Guid":"{54849625-5478-4994-a5ba-3e3b0328c30d}",
		"Name":"Microsoft-Windows-Security-Auditing"
	},
	"EventRecordID":5383143,
	"Execution":{
		"ThreadID":880,
		"ProcessID":776
	},
	"Version":0,
	"Computer":"EC2AMAZ-6D5CO5AB123.test.format",
	"Level":"Information",
	"EventData":{
		"DSType":"%%14676",
		"SubjectUserSid":"S-1-5-21-916893464-2020-10-12T08:00:02-2020-10-12T08:00:02-500",
		"OpCorrelationID":"{cdb02928-b7a6-4373-9b12-4e371f30c30d}",
		"SubjectUserName":"Administrator",
		"DSName":"test.format",
		"AppCorrelationID":"-",
		"ObjectGUID":"{56bf5011-b09d-43f5-bcd2-06a1d917c402}",
		"ObjectDN":"CN=TomJerry,OU=Domain Controllers,DC=test,DC=format",
		"SubjectLogonId":"0x73199",
		"ObjectClass":"computer",
		"SubjectDomainName":"TEST"
	},
	"Message":"A directory service object was created.\r\n\t\r\nSubject:\r\n\tSecurity ID:\t\tTEST\\Administrator\r\n\tAccount Name:\t\tAdministrator\r\n\tAccount Domain:\t\tTEST\r\n\tLogon ID:\t\t0x73199\r\n\t\r\nDirectory Service:\r\n\tName:\ttest.format\r\n\tType:\tActive Directory Domain Services\r\n\t\r\nObject:\r\n\tDN:\tCN=TomJerry,OU=Domain Controllers,DC=test,DC=format\r\n\tGUID:\t{56bf5011-b09d-43f5-bcd2-06a1d917c402}\r\n\tClass:\tcomputer\r\n\t\r\nOperation:\r\n\tCorrelation ID:\t{cdb02928-b7a6-4373-9b12-4e371f30c30d}\r\n\tApplication Correlation ID:\t-"
}
Sample queries
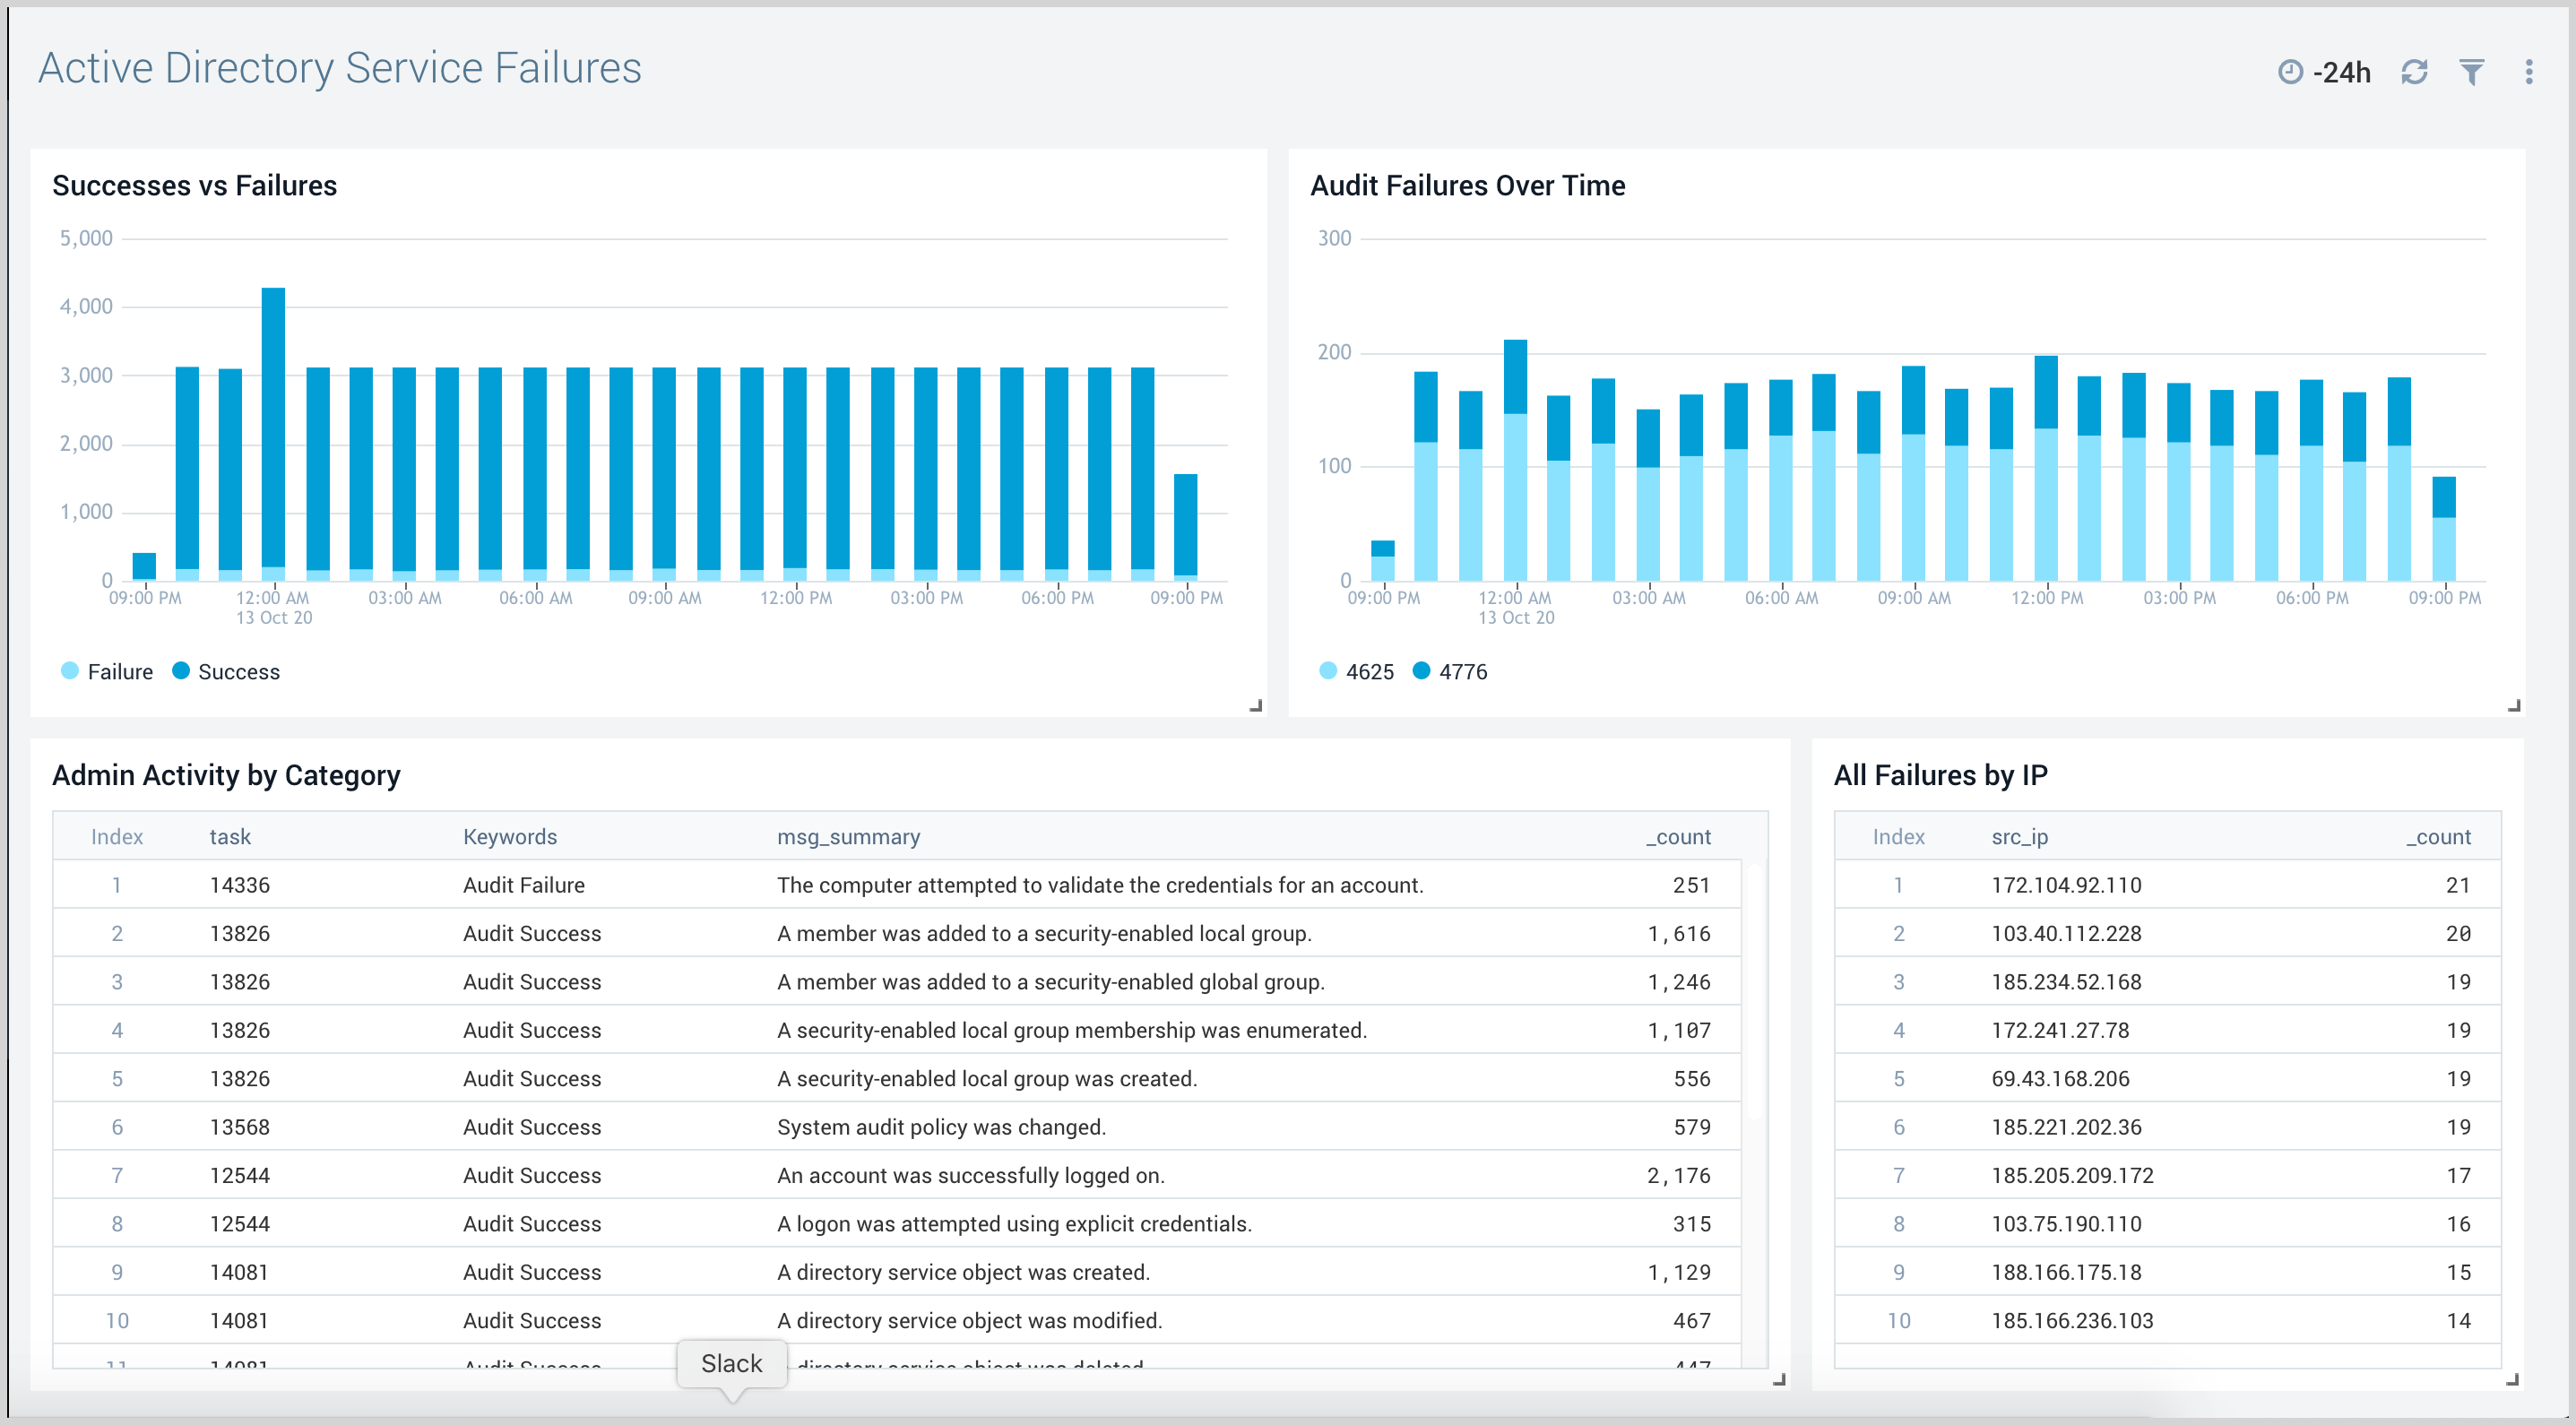
The sample query is from Successes Vs Failures panel from Active Directory Service Failures dashboard.
_sourceCategory=Labs/windows-jsonformat
| json "EventID", "Computer", "Keywords" as event_id, host, keywords nodrop
| if (keywords = "Audit Failure", "Failure", "Success") as status
| where host matches "*"
| timeslice 1h
| count as EventCount by  status, _timeslice
| transpose row _timeslice column status
Collecting logs
This section provides instructions on configuring log collection for the Active Directory JSON App so that logs are collected from the Microsoft Windows Event Log and ingested into Sumo Logic.
Configure a Collector and a Source
To configure a collector and source, do the following:
- Configure an Installed Windows collector through the user interface or from the command line.
- Configure either a local or remote Windows Event Log source. To configure a Windows Event Log source set the following:
- Event Format. Select Collect using JSON format.
- Collect using JSON format. Events are formatted into JSON that is designed to work with Sumo Logic features, making it easier for you to reference your data.
- Event Collection Level. When JSON format is selected you have to select Complete Message from the dropdown. Complete Message will ingest the entire event content along with metadata.
For more information on local or remote Windows Event Log Source configuration, refer to Local Windows Event Log Source and Remote Windows Event Log Source.
Installing the Active Directory JSON app
To install the app, do the following:
Next-Gen App: To install or update the app, you must be an account administrator or a user with Manage Apps, Manage Monitors, Manage Fields, Manage Metric Rules, and Manage Collectors capabilities depending upon the different content types part of the app.
- Select App Catalog.
- In the 🔎 Search Apps field, run a search for your desired app, then select it.
- Click Install App.
note
Sometimes this button says Add Integration.
- Click Next in the Setup Data section.
- In the Configure section of your respective app, complete the following fields.
- Field Name. If you already have collectors and sources set up, select the configured metadata field name (eg _sourcecategory) or specify other custom metadata (eg: _collector) along with its metadata Field Value.
- Click Next. You will be redirected to the Preview & Done section.
Post-installation
Once your app is installed, it will appear in your Installed Apps folder, and dashboard panels will start to fill automatically.
Each panel slowly fills with data matching the time range query received since the panel was created. Results will not immediately be available but will be updated with full graphs and charts over time.
Viewing Active Directory JSON dashboards
All dashboards have a set of filters that you can apply to the entire dashboard. Use these filters to drill down and examine the data to a granular level.
- You can change the time range for a dashboard or panel by selecting a predefined interval from a drop-down list, choosing a recently used time range, or specifying custom dates and times. Learn more.
- You can use template variables to drill down and examine the data on a granular level. For more information, see Filtering Dashboards with Template Variables.
- Most Next-Gen apps allow you to provide the scope at the installation time and are comprised of a key (
_sourceCategoryby default) and a default value for this key. Based on your input, the app dashboards will be parameterized with a dashboard variable, allowing you to change the dataset queried by all panels. This eliminates the need to create multiple copies of the same dashboard with different queries.
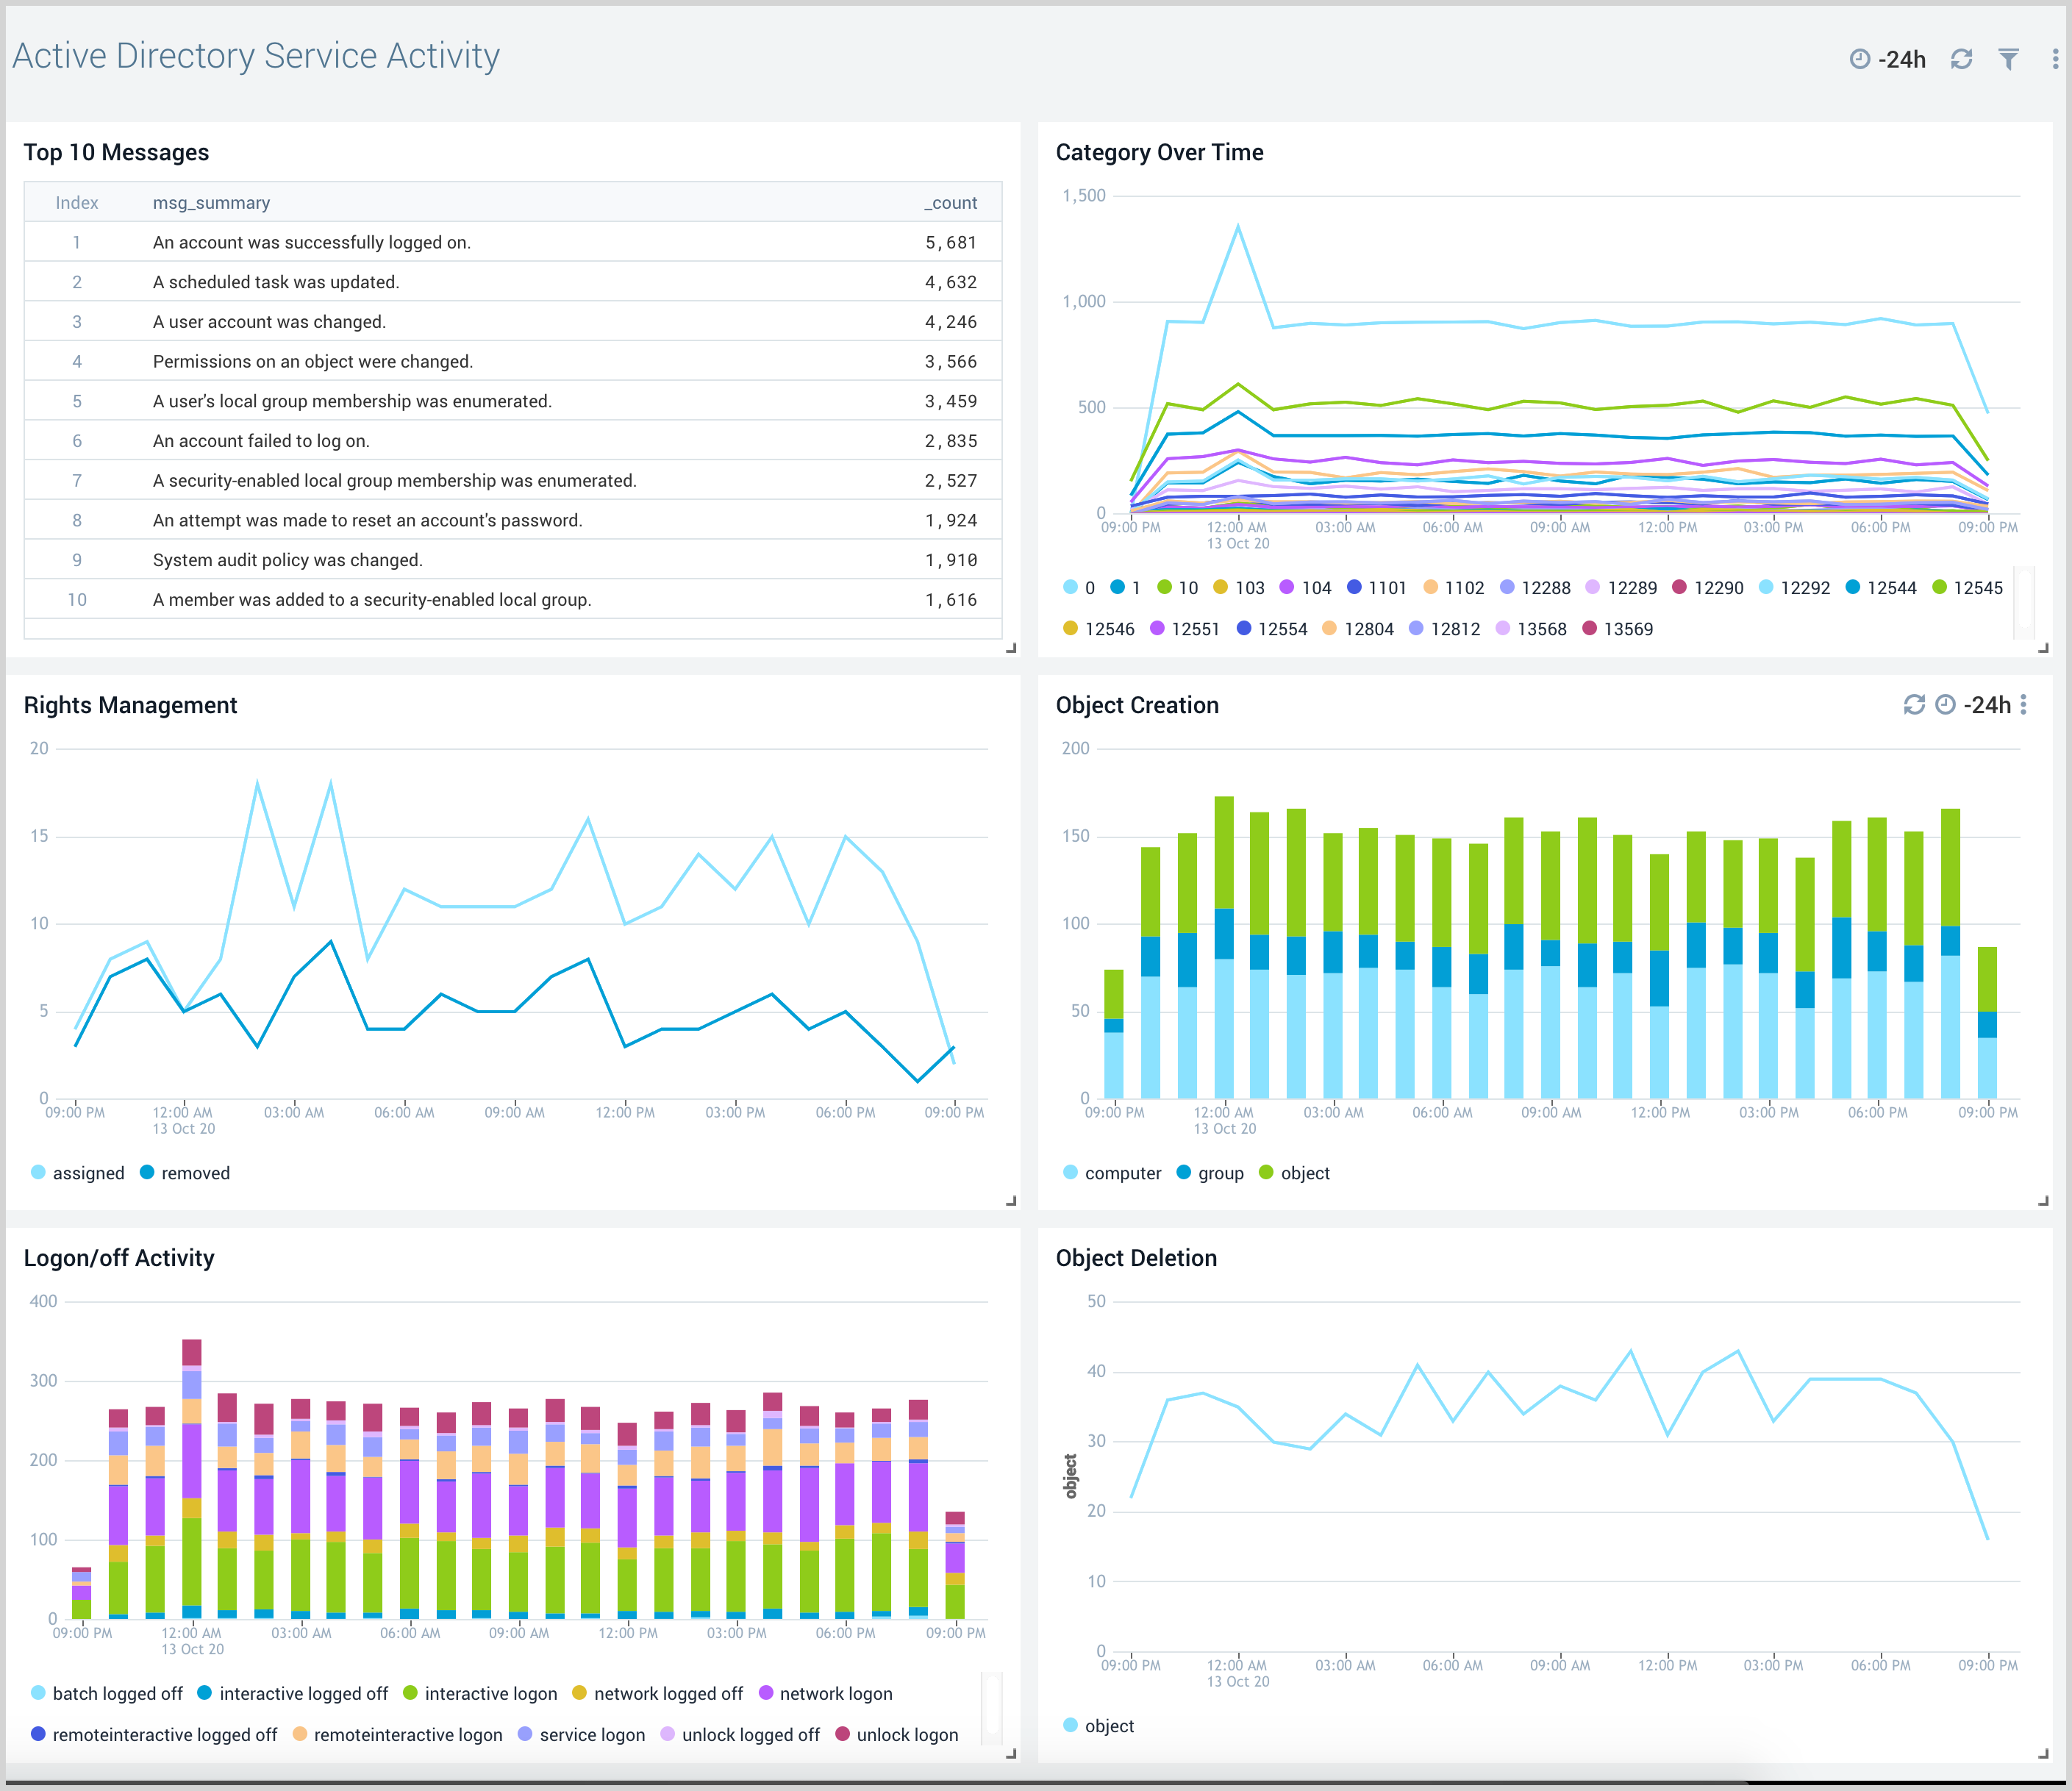
Service Activity
The Active Directory Service Activity dashboard provides insights into overall active directory services like messages overtime, logon/off activity, object creation, and deletion.
Use this dashboard to:
- Monitor object creation and deletion activities.
- Monitor rights assigned to a user or rights removed from a user.
- Monitor logon/logoff activity by various logon types.
- Monitor top 10 activities with concise message.
Service Failures
The Active Directory Service Failures dashboard provides an at-a-glance view of success, failures, and audit failures overtime.
Use this dashboard to:
- Monitor success and failure trends to check for any deviation from normal.
- Monitor all failed audit events along with administrative activities by event categories.
- Track IP addresses associated with failed activities.
Upgrade/Downgrade the Active Directory JSON app (Optional)
To update the app, do the following:
Next-Gen App: To install or update the app, you must be an account administrator or a user with Manage Apps, Manage Monitors, Manage Fields, Manage Metric Rules, and Manage Collectors capabilities depending upon the different content types part of the app.
- Select App Catalog.
- In the Search Apps field, search for and then select your app.
Optionally, you can identify apps that can be upgraded in the Upgrade available section. - To upgrade the app, select Upgrade from the Manage dropdown.
- If the upgrade does not have any configuration or property changes, you will be redirected to the Preview & Done section.
- If the upgrade has any configuration or property changes, you will be redirected to the Setup Data page.
- In the Configure section of your respective app, complete the following fields.
- Field Name. If you already have collectors and sources set up, select the configured metadata field name (eg _sourcecategory) or specify other custom metadata (eg: _collector) along with its metadata Field Value.
- Click Next. You will be redirected to the Preview & Done section.
Post-update
Your upgraded app will be installed in the Installed Apps folder and dashboard panels will start to fill automatically.
See our Release Notes changelog for new updates in the app.
To revert the app to a previous version, do the following:
- Select App Catalog.
- In the Search Apps field, search for and then select your app.
- To version down the app, select Revert to < previous version of your app > from the Manage dropdown.
Uninstalling the Active Directory JSON app (Optional)
To uninstall the app, do the following:
- Select App Catalog.
- In the 🔎 Search Apps field, run a search for your desired app, then select it.
- Click Uninstall.