IIS 7

The IIS 7 App monitors the performance and reliability of your Microsoft Internet Information Services (IIS) infrastructure, identifying customer-facing and internal operational issues. Additionally, you can monitor customer paths and interactions to learn how customers are using your product. The app consists of predefined searches and Dashboards, which provide visibility into your environment for real-time or historical analysis.
Log types
IIS 7 Logs (IIS 7.5 logs are used) are generated as local files and written to this directory by default: C:\inetpub\Logs\LogFiles\W3SVC1. The App assumes the following format:
# Fields: date time s-ip cs-method cs-uri-stem cs-uri-query s-port
cs-username c-ip cs(User-Agent) sc-status sc-substatus
sc-win32-status time-taken
For details on setting fields to log, see http://technet.microsoft.com/en-us/library/cc754702(v=ws.10).aspx.
Sumo Logic expects W3C format with these fields for our Field Extraction Rules and IIS 7 Application: (https://msdn.microsoft.com/en-us/library/ms525807(v=vs.90).aspx).
- Date
- Time
- ServerIP
- Method
- UriStem
- UriQuery
- Server Port
- UserName
- ClientIP
- UserAgent
- Referer
- Protocol Status
- Protocol Substatus
- Win32Status
- TimeTaken
For more information about the IIS 7 log (IIS 7.5 logs are used) format, see https://www.iis.net/learn/manage/provisioning-and-managing-iis/configure-logging-in-iis.
Sample log messages
2016-11-17 22:34:34 10.0.0.167 GET /favicon.ico - 80 - 12.177.21.34 Mozilla/5.0+(Macintosh;+Intel+Mac+OS+X+10_7_5)+AppleWebKit/537.36+(KHTML,+like+Gecko)+Chrome/27.0.1453.110+Safari/537.36 404 0 2 1405 547 78
2016-11-17 22:34:34 10.0.0.98 GET /Trade/Images/VS-ConfigWeb.png - 80 - 156.74.250.7 Mozilla/5.0+(Windows+NT+6.1;+WOW64;+rv:14.0)+Gecko/20100101+Firefox/14.0.1 304 0 0 209 748 7
Sample queries
The following query samples are taken from the IIS 7 App.
The following query is taken from the Requests by App Over Time panel on the IIS 7 Traffic Insights - App Requests Dashboard.
_sourceCategory=IIS*
| parse regex "\d+-\d+-\d+ \d+:\d+:\d+ (?<server_ip>\S+) (?<method>\S+) (?<cs_uri_stem>/\S+?) "
| parse regex field=cs_uri_stem "/(?<app>[^\./]+)/" nodrop
| if (isNull(app) || app="","Others",app) as app
| timeslice 1m
| count by app,_timeslice
| transpose row _timeslice column app
The following query is taken from the OSes and Browsers panel of the IIS 7 Traffic Insights - Content and Client Platform Dashboard.
_sourceCategory=IIS*
| parse regex "\d+-\d+-\d+ \d+:\d+:\d+ (?<server_ip>\S+) (?<method>\S+) (?<cs_uri_stem>/\S+?) \S+ \d+ (?<user>\S+) (?<client_ip>[\.\d]+) (?<agent>\S+) "
| if ((agent matches "*Windows NT*") or (agent matches "*Windows+NT*") or (agent matches "*Windows *") or (agent matches "*Win32*") or (agent matches "*Win64*"), "Windows", "Other") as OS |
if (agent matches "*Macintosh*","MacOS",OS) as OS |
if ((agent matches "*Windows Phone*") or (agent matches "*Windows+Phone*"),"Windows Phone",OS) as OS |
if (agent matches "*Linux*","Linux",OS) as OS |
if (agent matches "*iPad*","iPad",OS) as OS |
if (agent matches "*iPhone*","iPhone",OS) as OS |
if (agent matches "*Android*","Android",OS) as OS |
if (agent matches "*Darwin*","Darwin",OS) as OS |
if (agent matches "*CrOS*","Google Chrome",OS) as OS |
if (agent matches "*MSIE*","Internet Explorer","Other") as Browser |
if (agent matches "Internet Explorer","Internet Explorer", Browser) as Browser |
if (agent matches "*Trident*","Internet Explorer", Browser) as Browser |
if (agent matches "*Firefox*","Firefox",Browser) as Browser |
if (agent matches "*Safari*","Safari", Browser) as Browser |
if (agent matches "*Chrome*","Chrome", Browser) as Browser |
if (agent matches "Opera*","Opera", Browser) as Browser |
if (agent matches "Dolphin*","Dolphin", Browser) as Browser
| count(agent) by OS,Browser
| transpose row os column browser as *
Collecting logs for IIS 7
This procedure explains how to enable logging from Microsoft Internet Information Services (IIS) on your Windows server and ingest the logs into Sumo Logic.
Prerequisites
To prepare for logging IIS 7 events, perform the following two tasks.
To enable logging on your IIS Server, do the following:
- Open the Server Manager Console
- Select Roles
- Select Web Server (IIS)
- Select the host from which to collect IIS logs
- In the right-hand pane, select Logging
- For the option One log file per select Site
- For the Log File Format, choose W3C so that you can select the fields to log
- Click Select Fields, and then select the checkboxes for these fields:
Sumo Logic expects these fields in IIS logs for the IIS 7 Application and Field Extraction Rule by default.
- Date
- Time
- ServerIP
- Method
- UriStem
- UriQuery
- Server Port
- UserName
- ClientIP
- UserAgent
- Referer
- Protocol Status
- Protocol Substatus
- Win32Status
- TimeTaken
- Click OK to save your configuration
To confirm that the log files are being created, do the following:
- Open a command-line window and change directories to
C:\inetpub\Logs\LogFiles. This is the same path you will enter when you configure the Source to collect these files. - Under the
\W3SVC1directory, you should see one or more files with a.logextension. If the file is present, you can collect it.
Step 1: Configure a Collector
Configure an Installed Collector (Windows). Sumo Logic recommends that you install the collector on the same system that hosts the logs.
Step 2: Configure a Source
To collect logs from IIS 7, use an Installed Collector and a Local File Source. You may also configure a Remote File Source, but the configuration is more complex. Sumo Logic recommends using a Local File Source if possible.
- Configure a Local File Source.
- Configure the Local File Source Fields as follows:
- Name: Required (for example, "IIS")
- Description. (Optional)
- File Path (Required).
C:\inetpub\Logs\LogFiles\W3SVC1\*.log - Collection start time. Choose how far back you would like to begin collecting historical logs. For example, choose 7 days ago to begin collecting logs with a last modified date within the last seven days.
- Source Host. Sumo Logic uses the hostname assigned by the operating system by default, but you can enter a different hostname.
- Source Category (Required). For example, "IIS_prod". (The Source Category metadata field is a fundamental building block to organize and label Sources. For details, see Best Practices.)
- Configure the Advanced section: 7. Timestamp Parsing Settings: Make sure the setting matches the timezone on the log files. 8. Enable Timestamp Parsing: Select Extract timestamp information from log file entries. 9. Time Zone: Select the option to Use time zone from log file. If none is present use: and set the timezone to UTC. 10. Timestamp Format: Select the option to Automatically detect the format. 11. Encoding. UTF-8 is the default, but you can choose another encoding format from the menu if your IIS logs are encoded differently. 12. Enable Multiline Processing. Disable the option to detect messages spanning multiple lines. Because IIS logs are single-line log files, disabling this option will improve the performance of the collection and ensure that your messages are submitted correctly to Sumo Logic.
- Click Save.
After a few minutes, your new Source should be propagated down to the Collector and will begin submitting your IIS log files to the Sumo Logic service.
Field Extraction Rules
FER to normalize the fields. Field Extraction Rule named AppObservabilityIIS7FER is automatically created for IIS 7/8 Application Components.
Installing the IIS 7 app
To install the app, do the following:
Next-Gen App: To install or update the app, you must be an account administrator or a user with Manage Apps, Manage Monitors, Manage Fields, Manage Metric Rules, and Manage Collectors capabilities depending upon the different content types part of the app.
- Select App Catalog.
- In the 🔎 Search Apps field, run a search for your desired app, then select it.
- Click Install App.
note
Sometimes this button says Add Integration.
- Click Next in the Setup Data section.
- In the Configure section of your respective app, complete the following fields.
- Field Name. If you already have collectors and sources set up, select the configured metadata field name (eg _sourcecategory) or specify other custom metadata (eg: _collector) along with its metadata Field Value.
- Click Next. You will be redirected to the Preview & Done section.
Post-installation
Once your app is installed, it will appear in your Installed Apps folder, and dashboard panels will start to fill automatically.
Each panel slowly fills with data matching the time range query received since the panel was created. Results will not immediately be available but will be updated with full graphs and charts over time.
As part of the app installation process, the following fields will be created by default:
methodcs_user_agentc_iptime_takenserver_ips_portsc_win32_statussc_statuscs_uri_querysc_substatuscs_uri_stemcs_username
Viewing IIS 7 dashboards
All dashboards have a set of filters that you can apply to the entire dashboard. Use these filters to drill down and examine the data to a granular level.
- You can change the time range for a dashboard or panel by selecting a predefined interval from a drop-down list, choosing a recently used time range, or specifying custom dates and times. Learn more.
- You can use template variables to drill down and examine the data on a granular level. For more information, see Filtering Dashboards with Template Variables.
- Most Next-Gen apps allow you to provide the scope at the installation time and are comprised of a key (
_sourceCategoryby default) and a default value for this key. Based on your input, the app dashboards will be parameterized with a dashboard variable, allowing you to change the dataset queried by all panels. This eliminates the need to create multiple copies of the same dashboard with different queries.
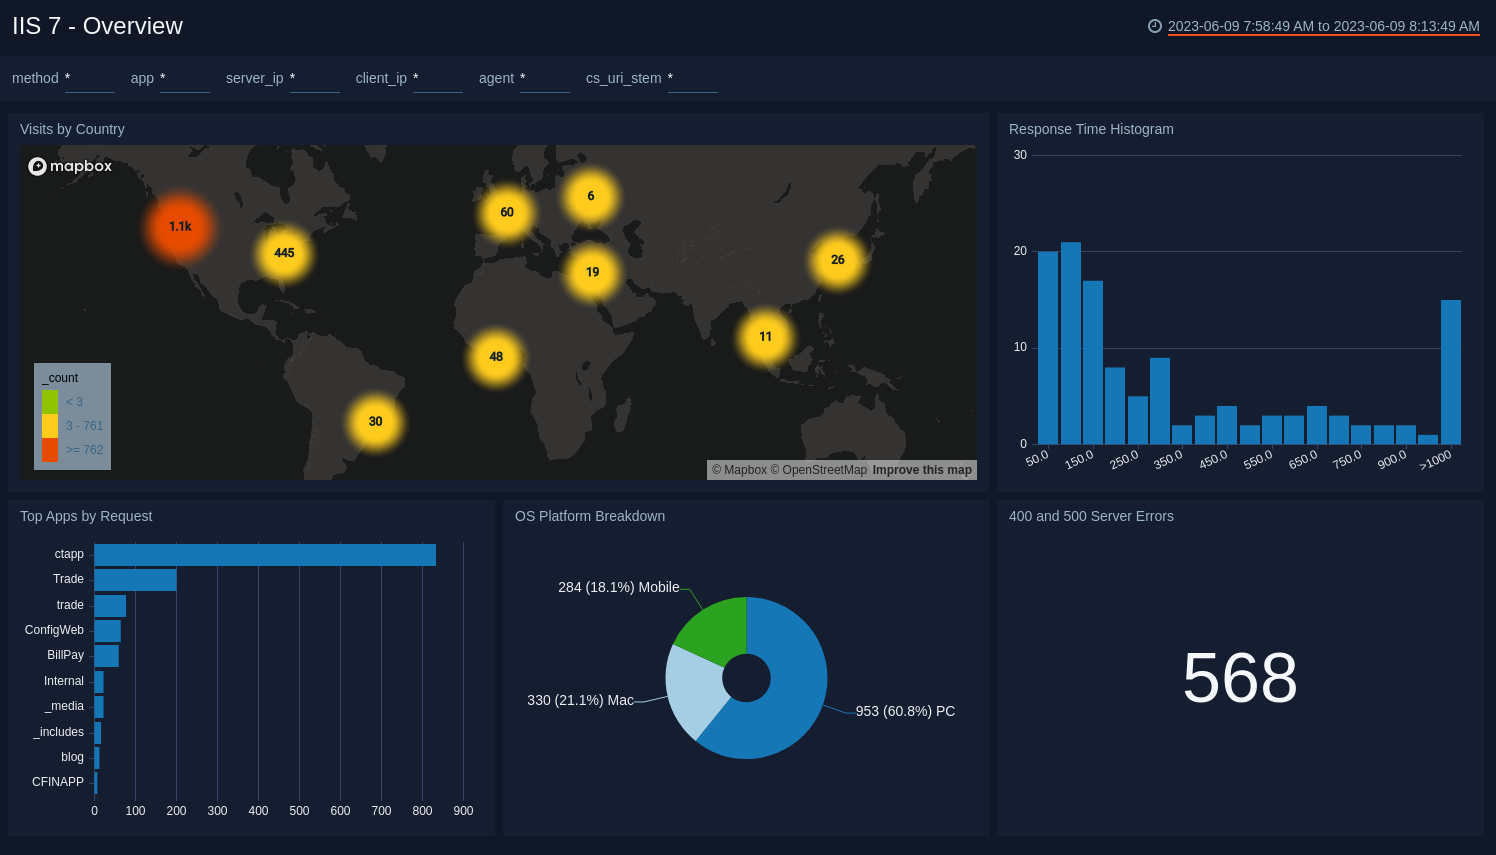
Overview Dashboard
The IIS 7 - Overview Dashboard provides a high-level view of user visits by country, the number of requests and the response time, top applications used to make requests, operating systems (OSes) used, and the number of server errors.
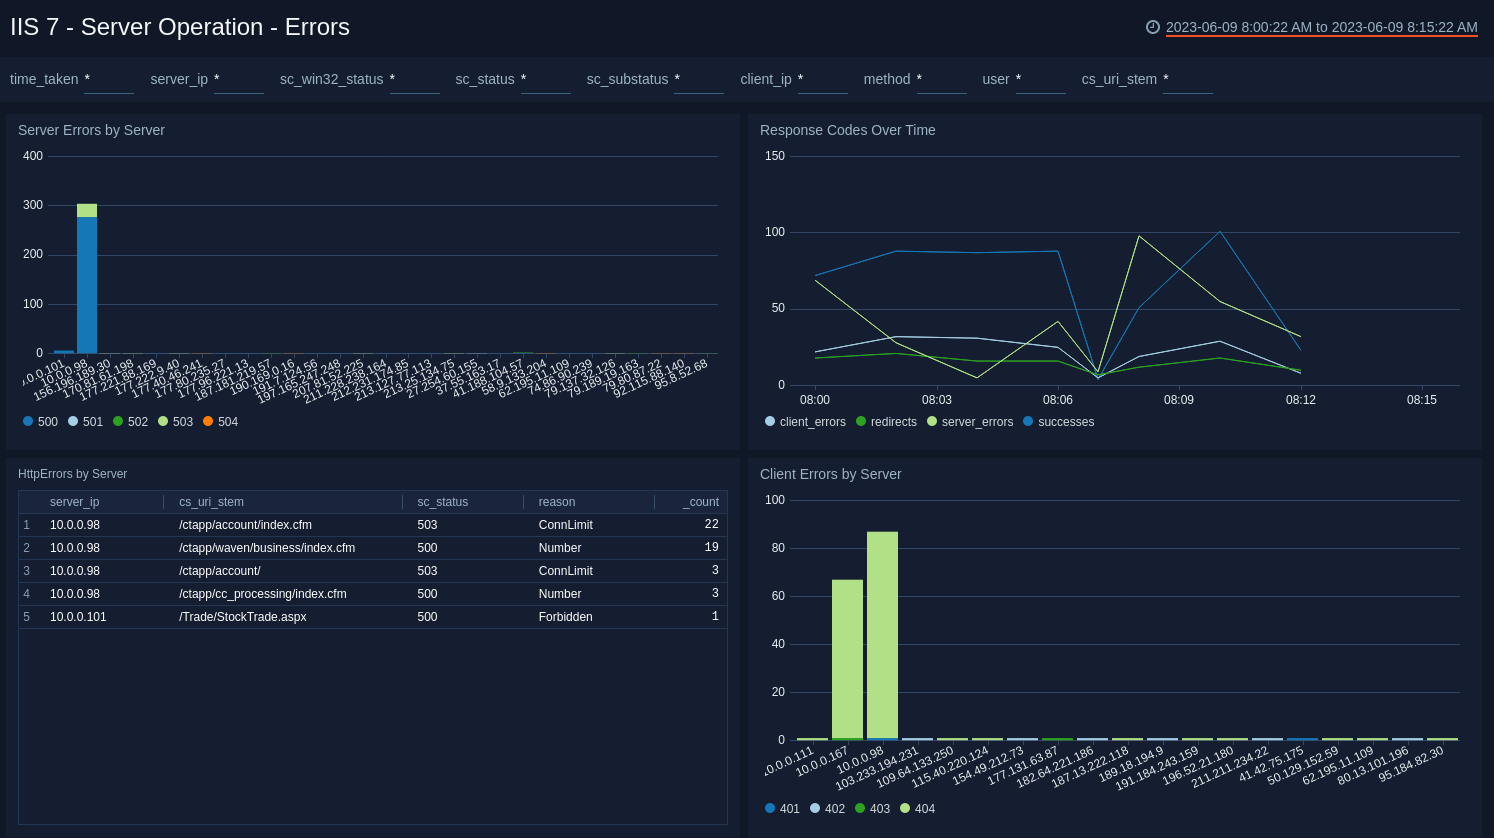
Server Operation - Errors
The IIS 7 - Server Operation - Errors Dashboard provides information on server errors by IP address, response code trends, HTTP errors by server IP address, and client errors by IP address.
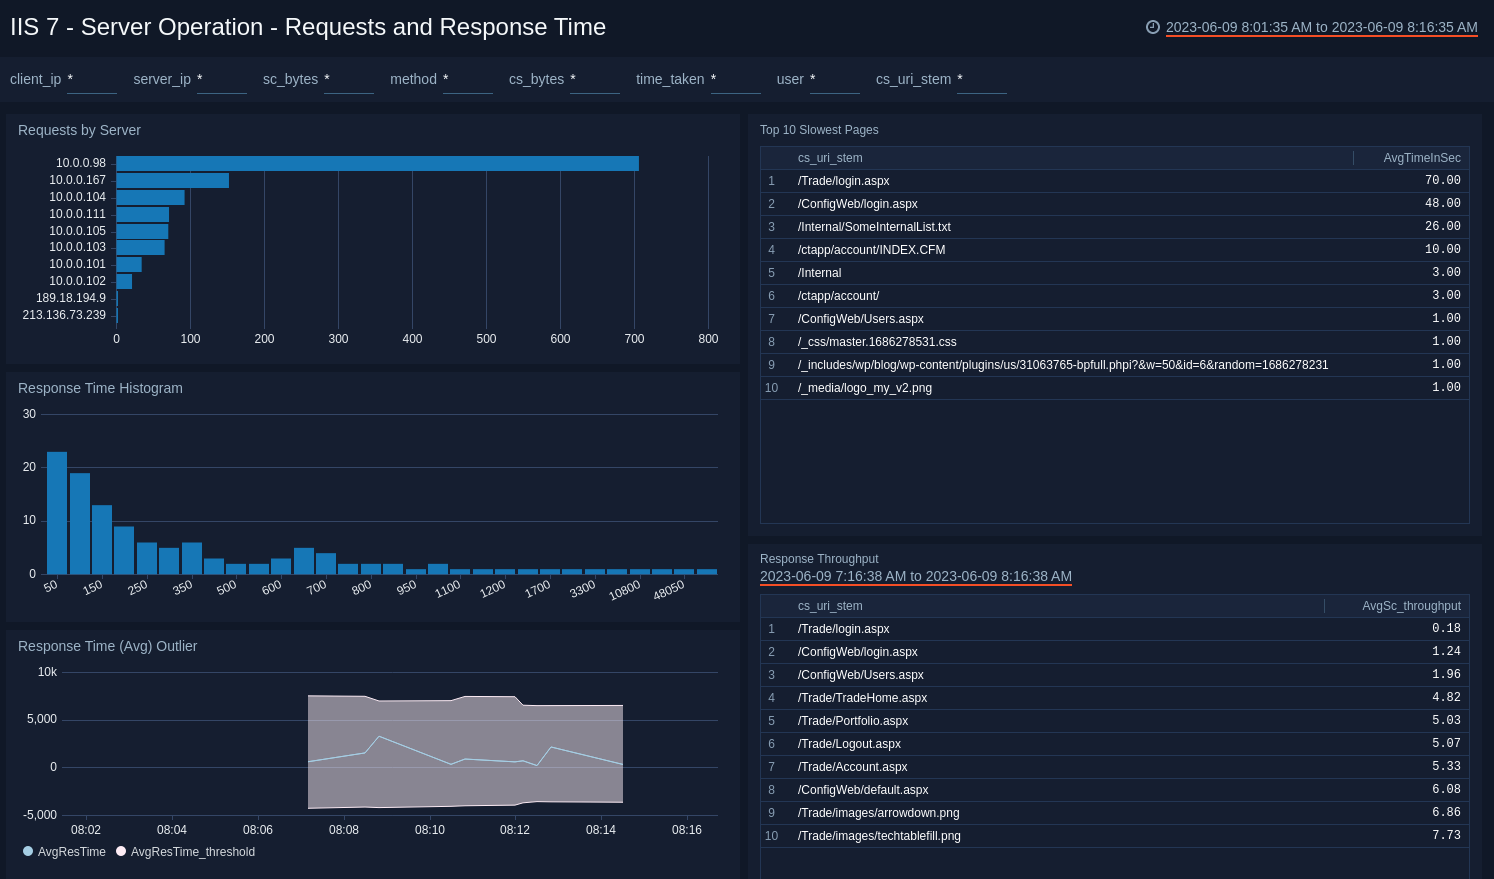
Server Operation - Requests and Response Time
The IIS 7 - Server Operation - Requests and Response Time Dashboard provides information on requests by server IP address, the top 10 slowest web pages, the number of requests and the response time per timeslice, top 10 server IP addresses response throughput time in bytes per second, and cumulative response times percentiles.
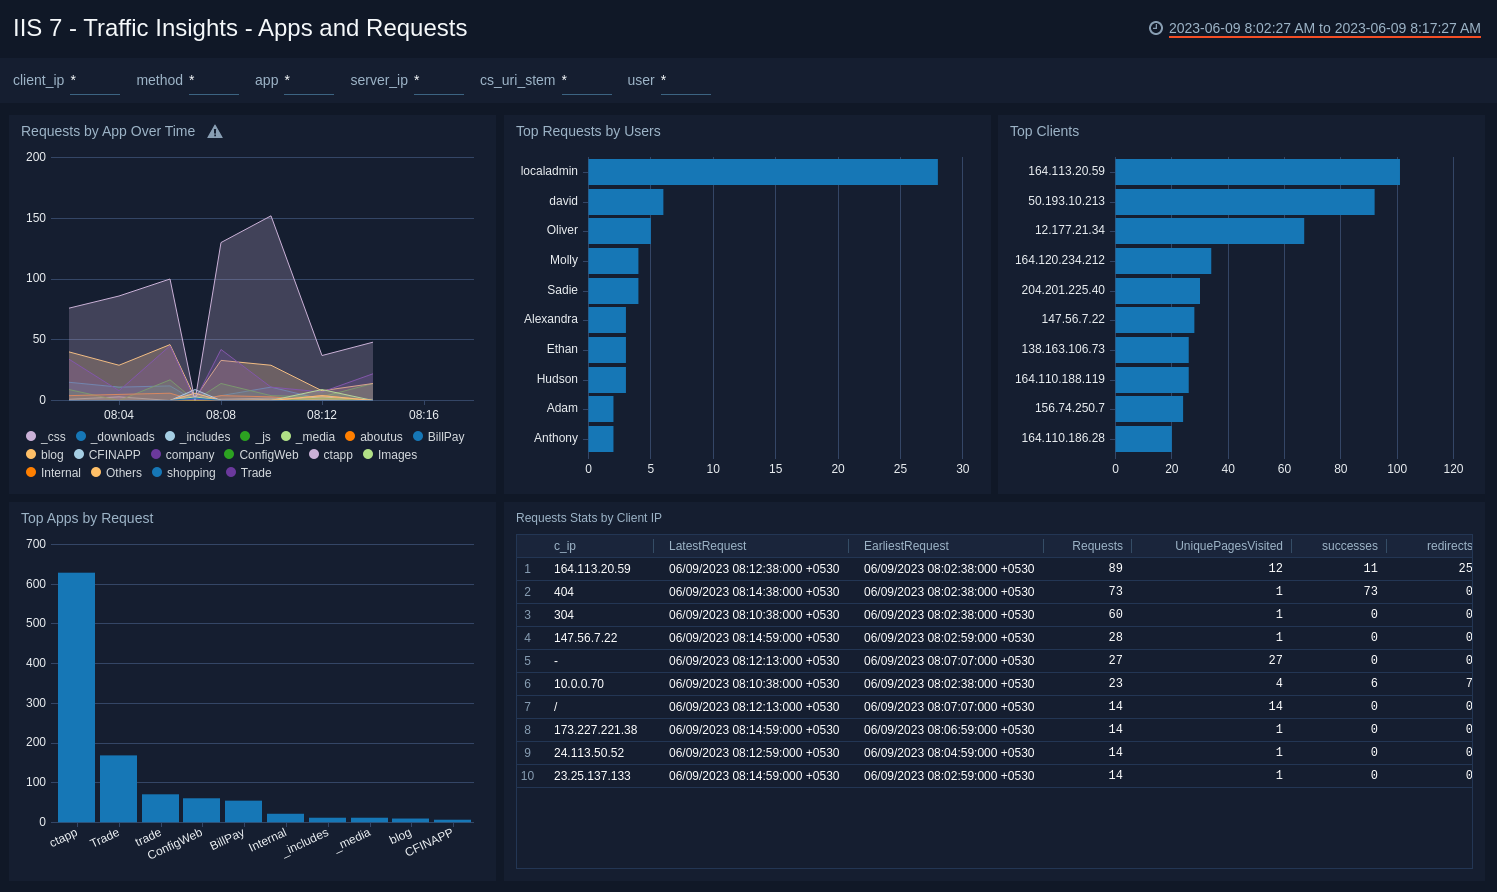
Traffic Insights - Apps and Requests
The IIS 7 - Traffic Insights - Apps and Requests Dashboard provides information on the requests made by each application, the top 10 applications and the number of requests received, the top 10 users making requests, cumulative user request percentiles, the top 10 clients by IP address and the number of requests made, and cumulative client request percentiles.
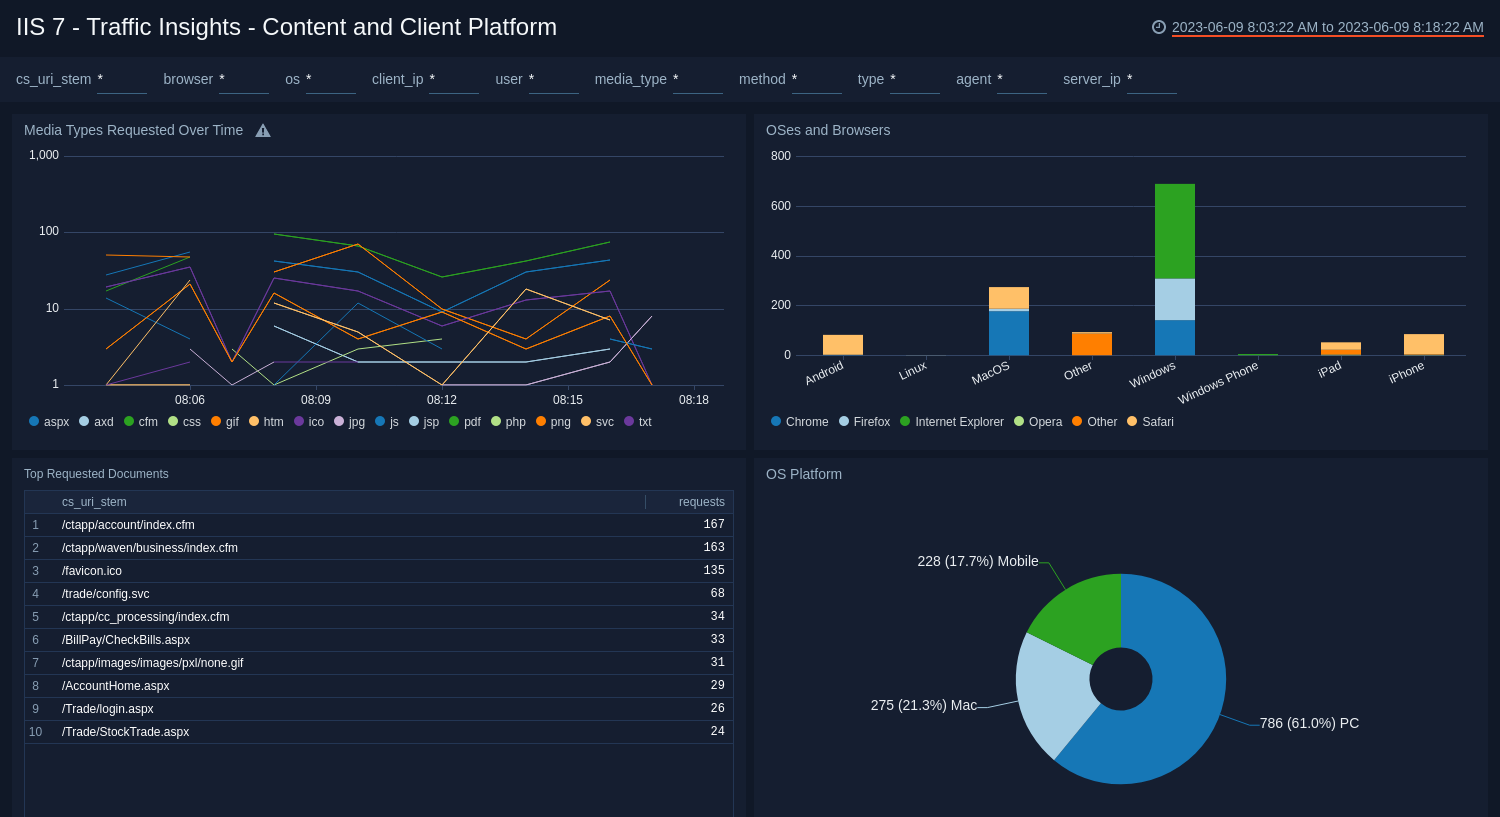
Traffic Insights - Content and Client Platform
The IIS 7 - Traffic Insights - Content and Client Platform Dashboard provides information on the number of media file types requested, the top 10 documents requested, the operating systems and web browsers used by visitors, and the operating system platforms used by visitors.
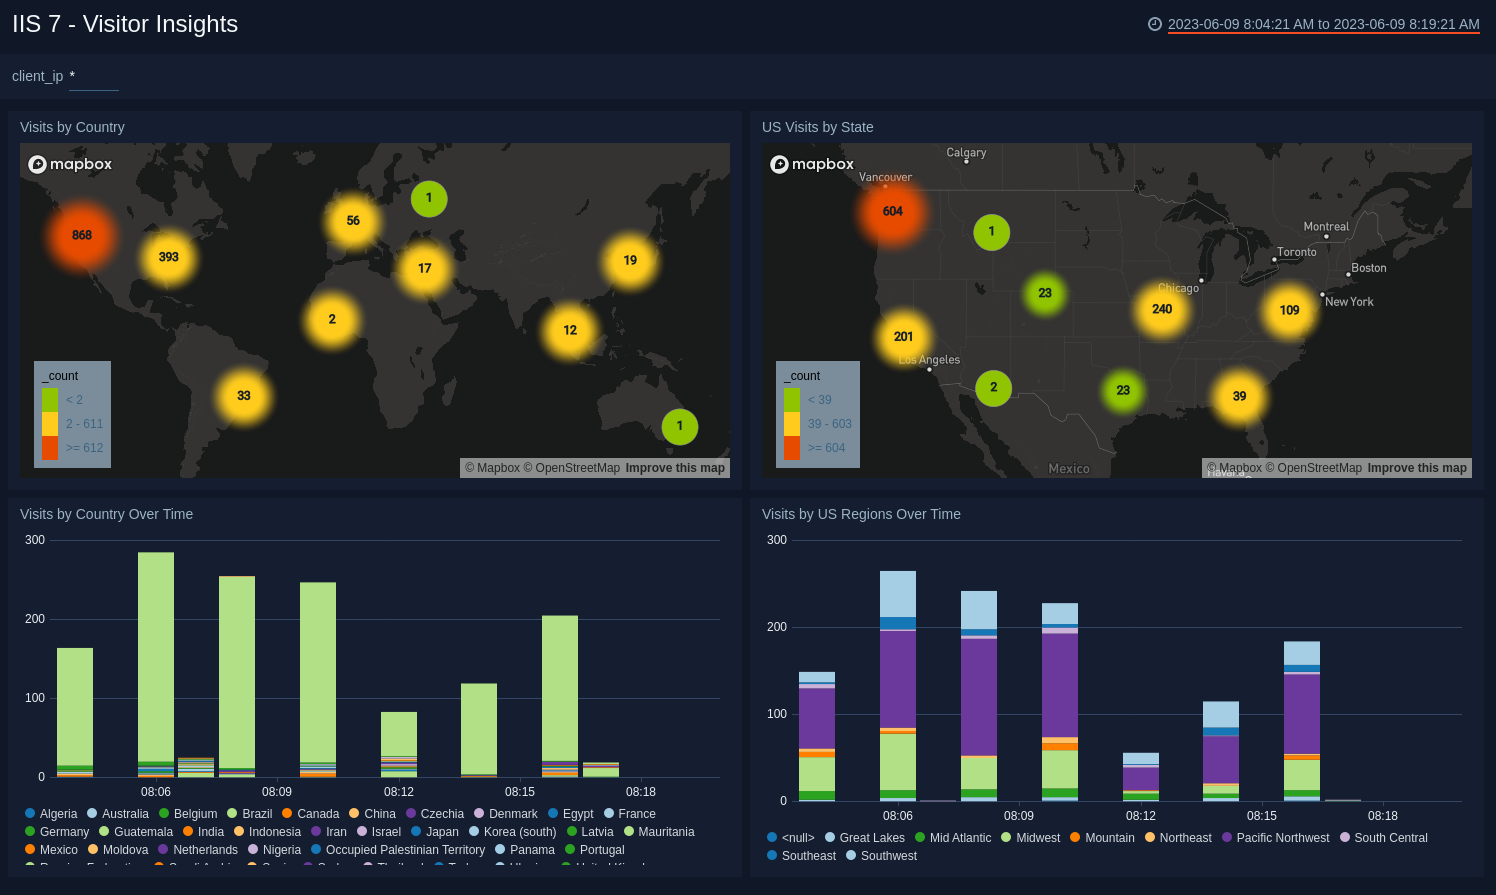
Visitor Insights
The IIS 7 - Visitor Insights Dashboard provides information on the geographic locations and number of users by client IP address, the number of visitors per country, locations, and number of users by client IP address by US state, and the number of visitors per US state.