Microsoft SQL Server for Linux - OpenTelemetry Collector

The Sumo Logic app for Microsoft SQL Server is a logs-based app that provides insight into your SQL Server for Linux. The app consists of predefined dashboards, providing visibility into your environment for real-time or historical analysis on backup, restore mirroring, general health and operations of your system.
This app has been tested with following SQL Server versions:
- Microsoft SQL Server 2016
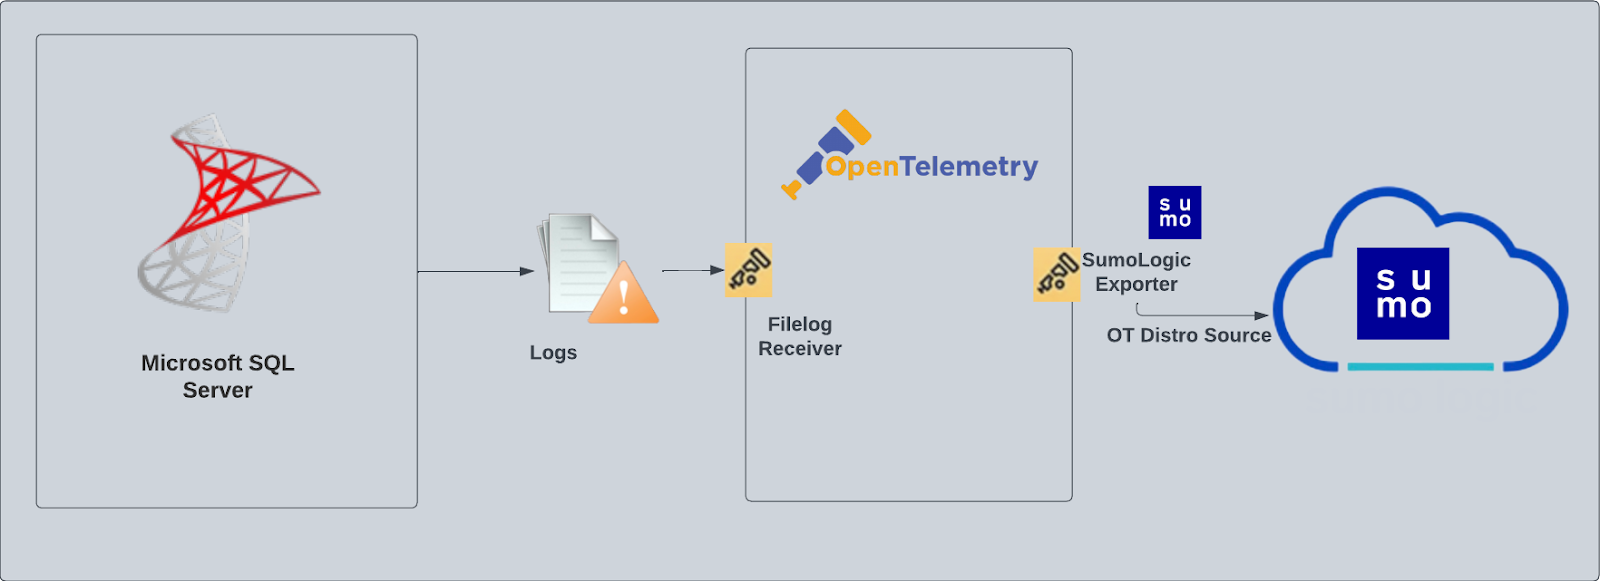
SQL Server logs are sent to Sumo Logic through OpenTelemetry filelog receiver.
Fields creation in Sumo Logic for SQL Server
Following are the Fields which will be created as part of SQL Server app install if not already present.
db.cluster.name. User configured. Enter a name to identify this SQL Server cluster. This cluster name will be shown in the Sumo Logic dashboards.db.system. Has a fixed value of sqlserver.deployment.environment. User configured. This is the deployment environment where the SQL Server cluster resides. For example dev, prod, or qa.sumo.datasource. Has a fixed value of sqlserver.
Prerequisites
Make sure logging is turned on in SQL Server. Follow this documentation to enable it.
The Microsoft SQL Server app's queries and dashboards depend on logs from the SQL Server ERRORLOG, which is typically found in: /var/opt/mssql/log/errorlog.
The ERRORLOG is typically in UTF-16LE encoding, however, be sure to verify the file encoding used in your SQL Server configuration.
For Linux systems with ACL Support, the otelcol install process should have created the ACL grants necessary for the otelcol system user to access default log locations. You can verify the active ACL grants using the getfacl command. Install the ACL in your Linux environment, if not installed.
The required ACL may not be supported for some rare cases, for example, Linux OS Distro, which is officially not supported by Sumo Logic. In this case, you can run the following command to explicitly grant the permissions.
sudo setfacl -R -m d:u:otelcol-sumo:r-x,d:g:otelcol-sumo:r-x,u:otelcol-sumo:r-x,g:otelcol-sumo:r-x <PATH_TO_LOG_FILE>
Run the above command for all the log files in the directory that need to be ingested, which are not residing in the default location.
If Linux ACL Support is not available, traditional Unix-styled user and group permission must be modified. It should be sufficient to add the otelcol system user to the specific group that has access to the log files.
Collection configuration and app installation
As part of data collection setup and app installation, you can select the App from App Catalog and click on Install App. Follow the steps below.
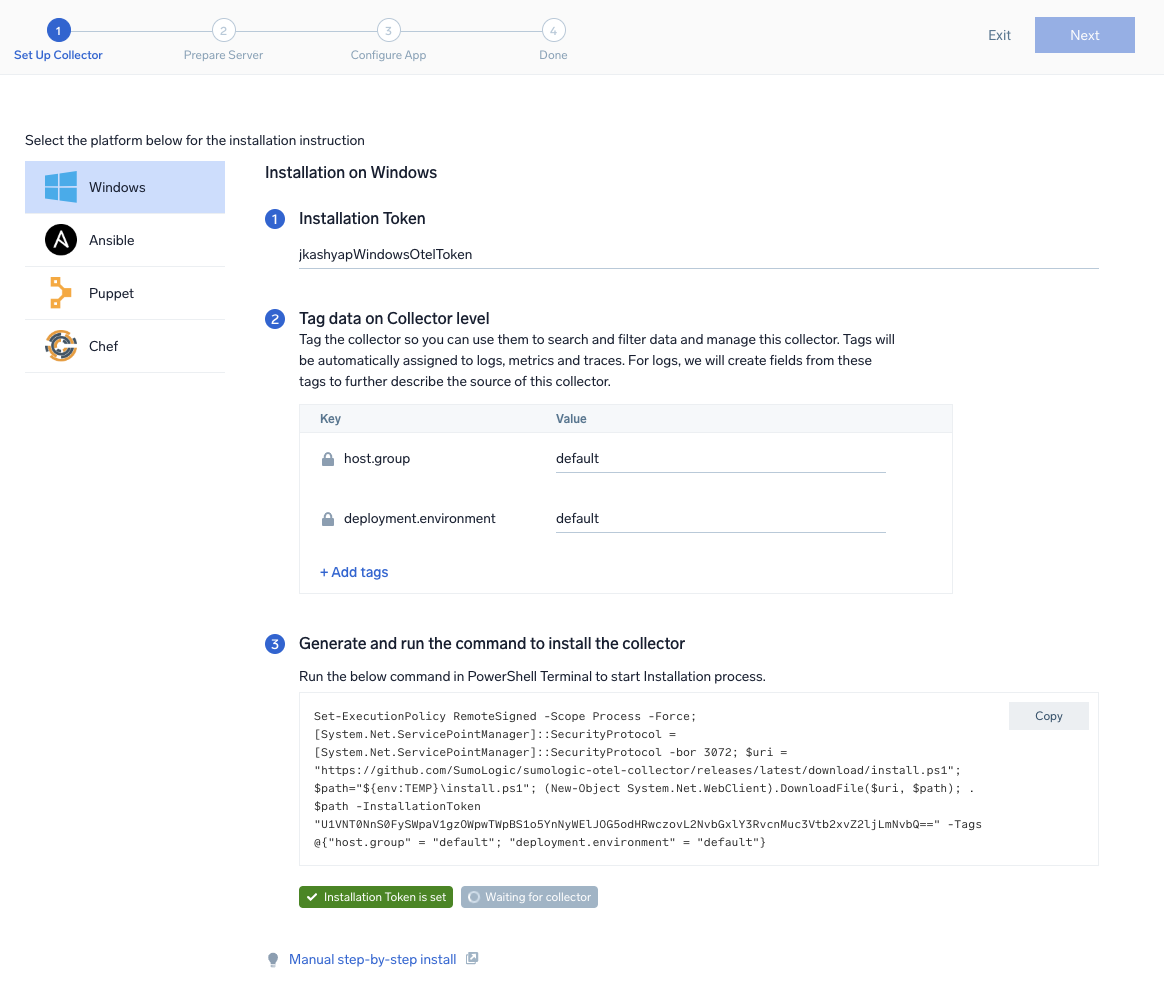
Step 1: Set up Collector
If you want to use an existing OpenTelemetry Collector, you can skip this step by selecting the Use an existing Collector option.
To create a new Collector:
- Select the Add a new Collector option.
- Select the platform where you want to install the Sumo Logic OpenTelemetry Collector.
This will generate a command that you can execute in the machine environment you need to monitor. Once executed, it will install the Sumo Logic OpenTelemetry Collector.
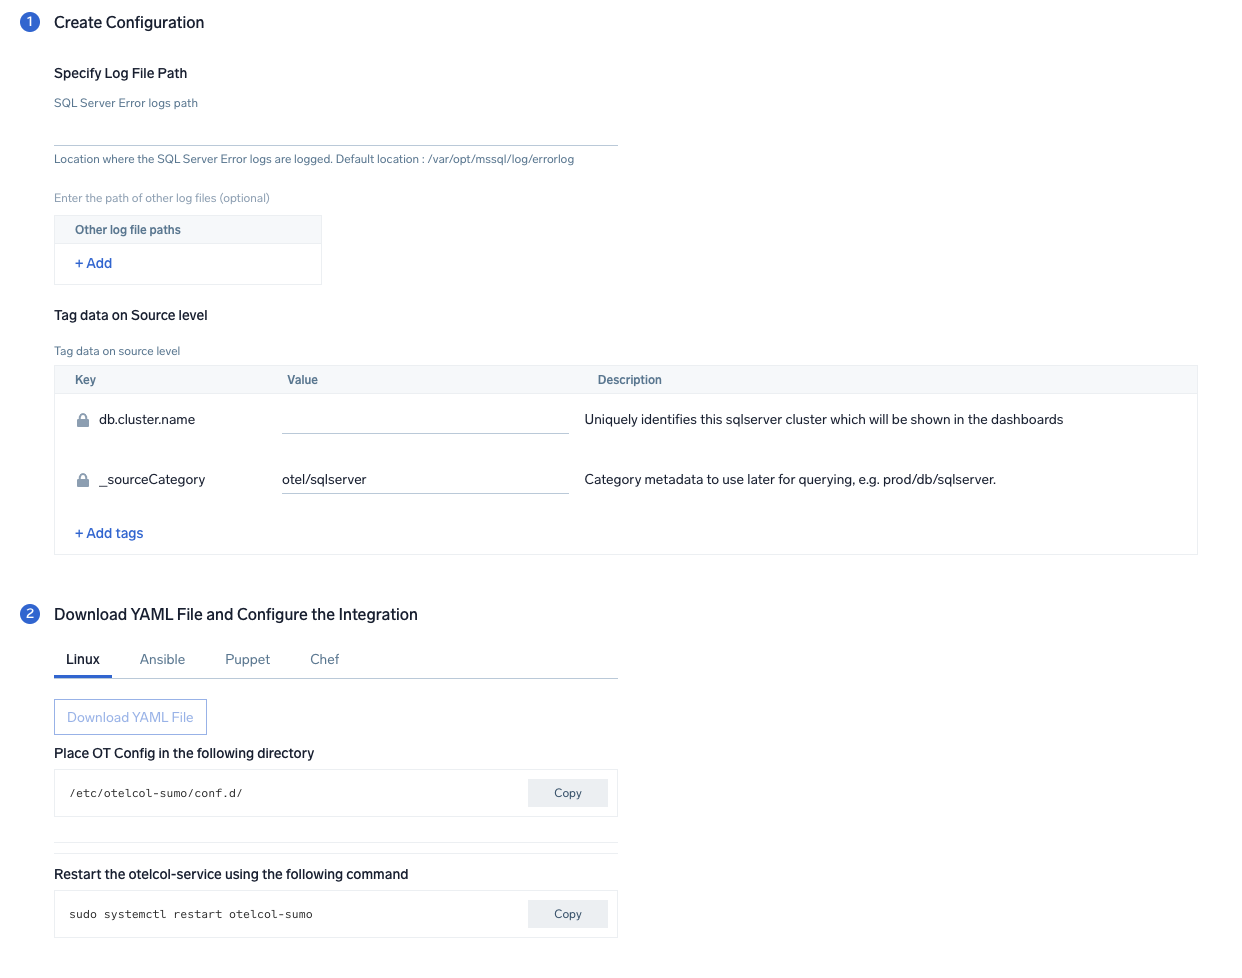
Step 2: Configure integration
The Microsoft SQL Server app's queries and dashboards depend on logs from the SQL Server ERRORLOG, which is typically found in:
/var/opt/mssql/log/errorlog
You can add any custom fields which you want to tag along with the data ingested in Sumo. Click on the Download YAML File button to get the YAML file.
Step 3: Send logs to Sumo Logic
Once you have downloaded the YAML file as described in the previous step, follow the below steps based on your platform.
- Linux
- Chef
- Ansible
- Puppet
- Copy the yaml file to
/etc/otelcol-sumo/conf.d/folder in the SQL Server instance which needs to be monitored. - Restart the collector using:
sudo systemctl restart otelcol-sumo
- Copy the yaml file into your Chef cookbook files directory
files/<downloaded_yaml_file>. - Use a Chef file resource in a recipe to manage it.
cookbook_file '/etc/otelcol-sumo/conf.d/<downloaded_yaml_file>' do mode 0644 notifies :restart, 'service[otelcol-sumo]', :delayed end - Add the recipe to your collector setup to start collecting the data. Every team typically has their established way of applying the Chef recipe. The resulting Chef recipe should look something like:
cookbook_file '/etc/otelcol-sumo/conf.d/<downloaded_yaml_file>' do
mode 0644
notifies :restart, 'service[otelcol-sumo]', :delayed
end
- Place the file into your Ansible playbook files directory.
- Run the Ansible playbook.
ansible-playbook -i inventory install_sumologic_otel_collector.yaml
-e '{"installation_token": "<YOUR_TOKEN>", "collector_tags": {<YOUR_TAGS>}, "src_config_path": "files/conf.d"}'
- Place the file into your Puppet module files directory
modules/install_otel_collector/files/<downloaded_yaml>. - Use a Puppet file resource to manage it.
file { '/etc/otelcol-sumo/conf.d/<downloaded_yaml_file>':
    ensure => present,
    source => 'puppet:///modules/install_otel_collector/<downloaded_yaml_file>',
    mode => '0644',
    notify => Service[otelcol-sumo],
} - Apply the Puppet manifest. Every team typically has their established way of applying the Puppet manifest. The resulting Puppet manifest should look something like:
node 'default' {
    class { 'install_otel_collector'
      installation_token => '<YOUR_TOKEN>',
      collector_tags => { <YOUR_TAGS> },
    }

    service { 'otelcol-sumo':
      provider => 'systemd',
      ensure => running,
      enable => true,
      require => Class['install_otel_collector'],
    }

    file { '/etc/otelcol-sumo/conf.d/<downloaded_yaml_file>':
      ensure => present,
      source => 'puppet:///modules/install_otel_collector/<downloaded_yaml_file>',
      mode => '0644',
      notify => Service[otelcol-sumo],
    }
  }
After successfully executing the above command, Sumo Logic will start receiving data from your host machine.
Click Next. This will install the app (dashboards and monitors) to your Sumo Logic Org.
Dashboard panels will start to fill automatically. It's important to note that each panel fills with data matching the time range query and received since the panel was created. Results won't immediately be available, but within 20 minutes, you'll see full graphs and maps.
Sample log messages
2023-01-09 13:23:31.276 Logon Login succeeded for user 'NT SERVICE\SQLSERVERAGENT'. Connection made using Windows authentication. [CLIENT: ]
Sample queries
Following is the query from Error and warning count panel from the SQL Server app - Overview dashboard:
 %"db.cluster.name"=* %"deployment.environment"=*  %"sumo.datasource"=sqlserver ("Error:" or "Warning:") | json "log" as _rawlog nodrop
| if (isEmpty(_rawlog), _raw, _rawlog) as _raw
| parse regex "\s+(?<Logtype>Error|Warning):\s+(?<message>.*)$"
| count by LogType
Viewing Microsoft SQL Server dashboards
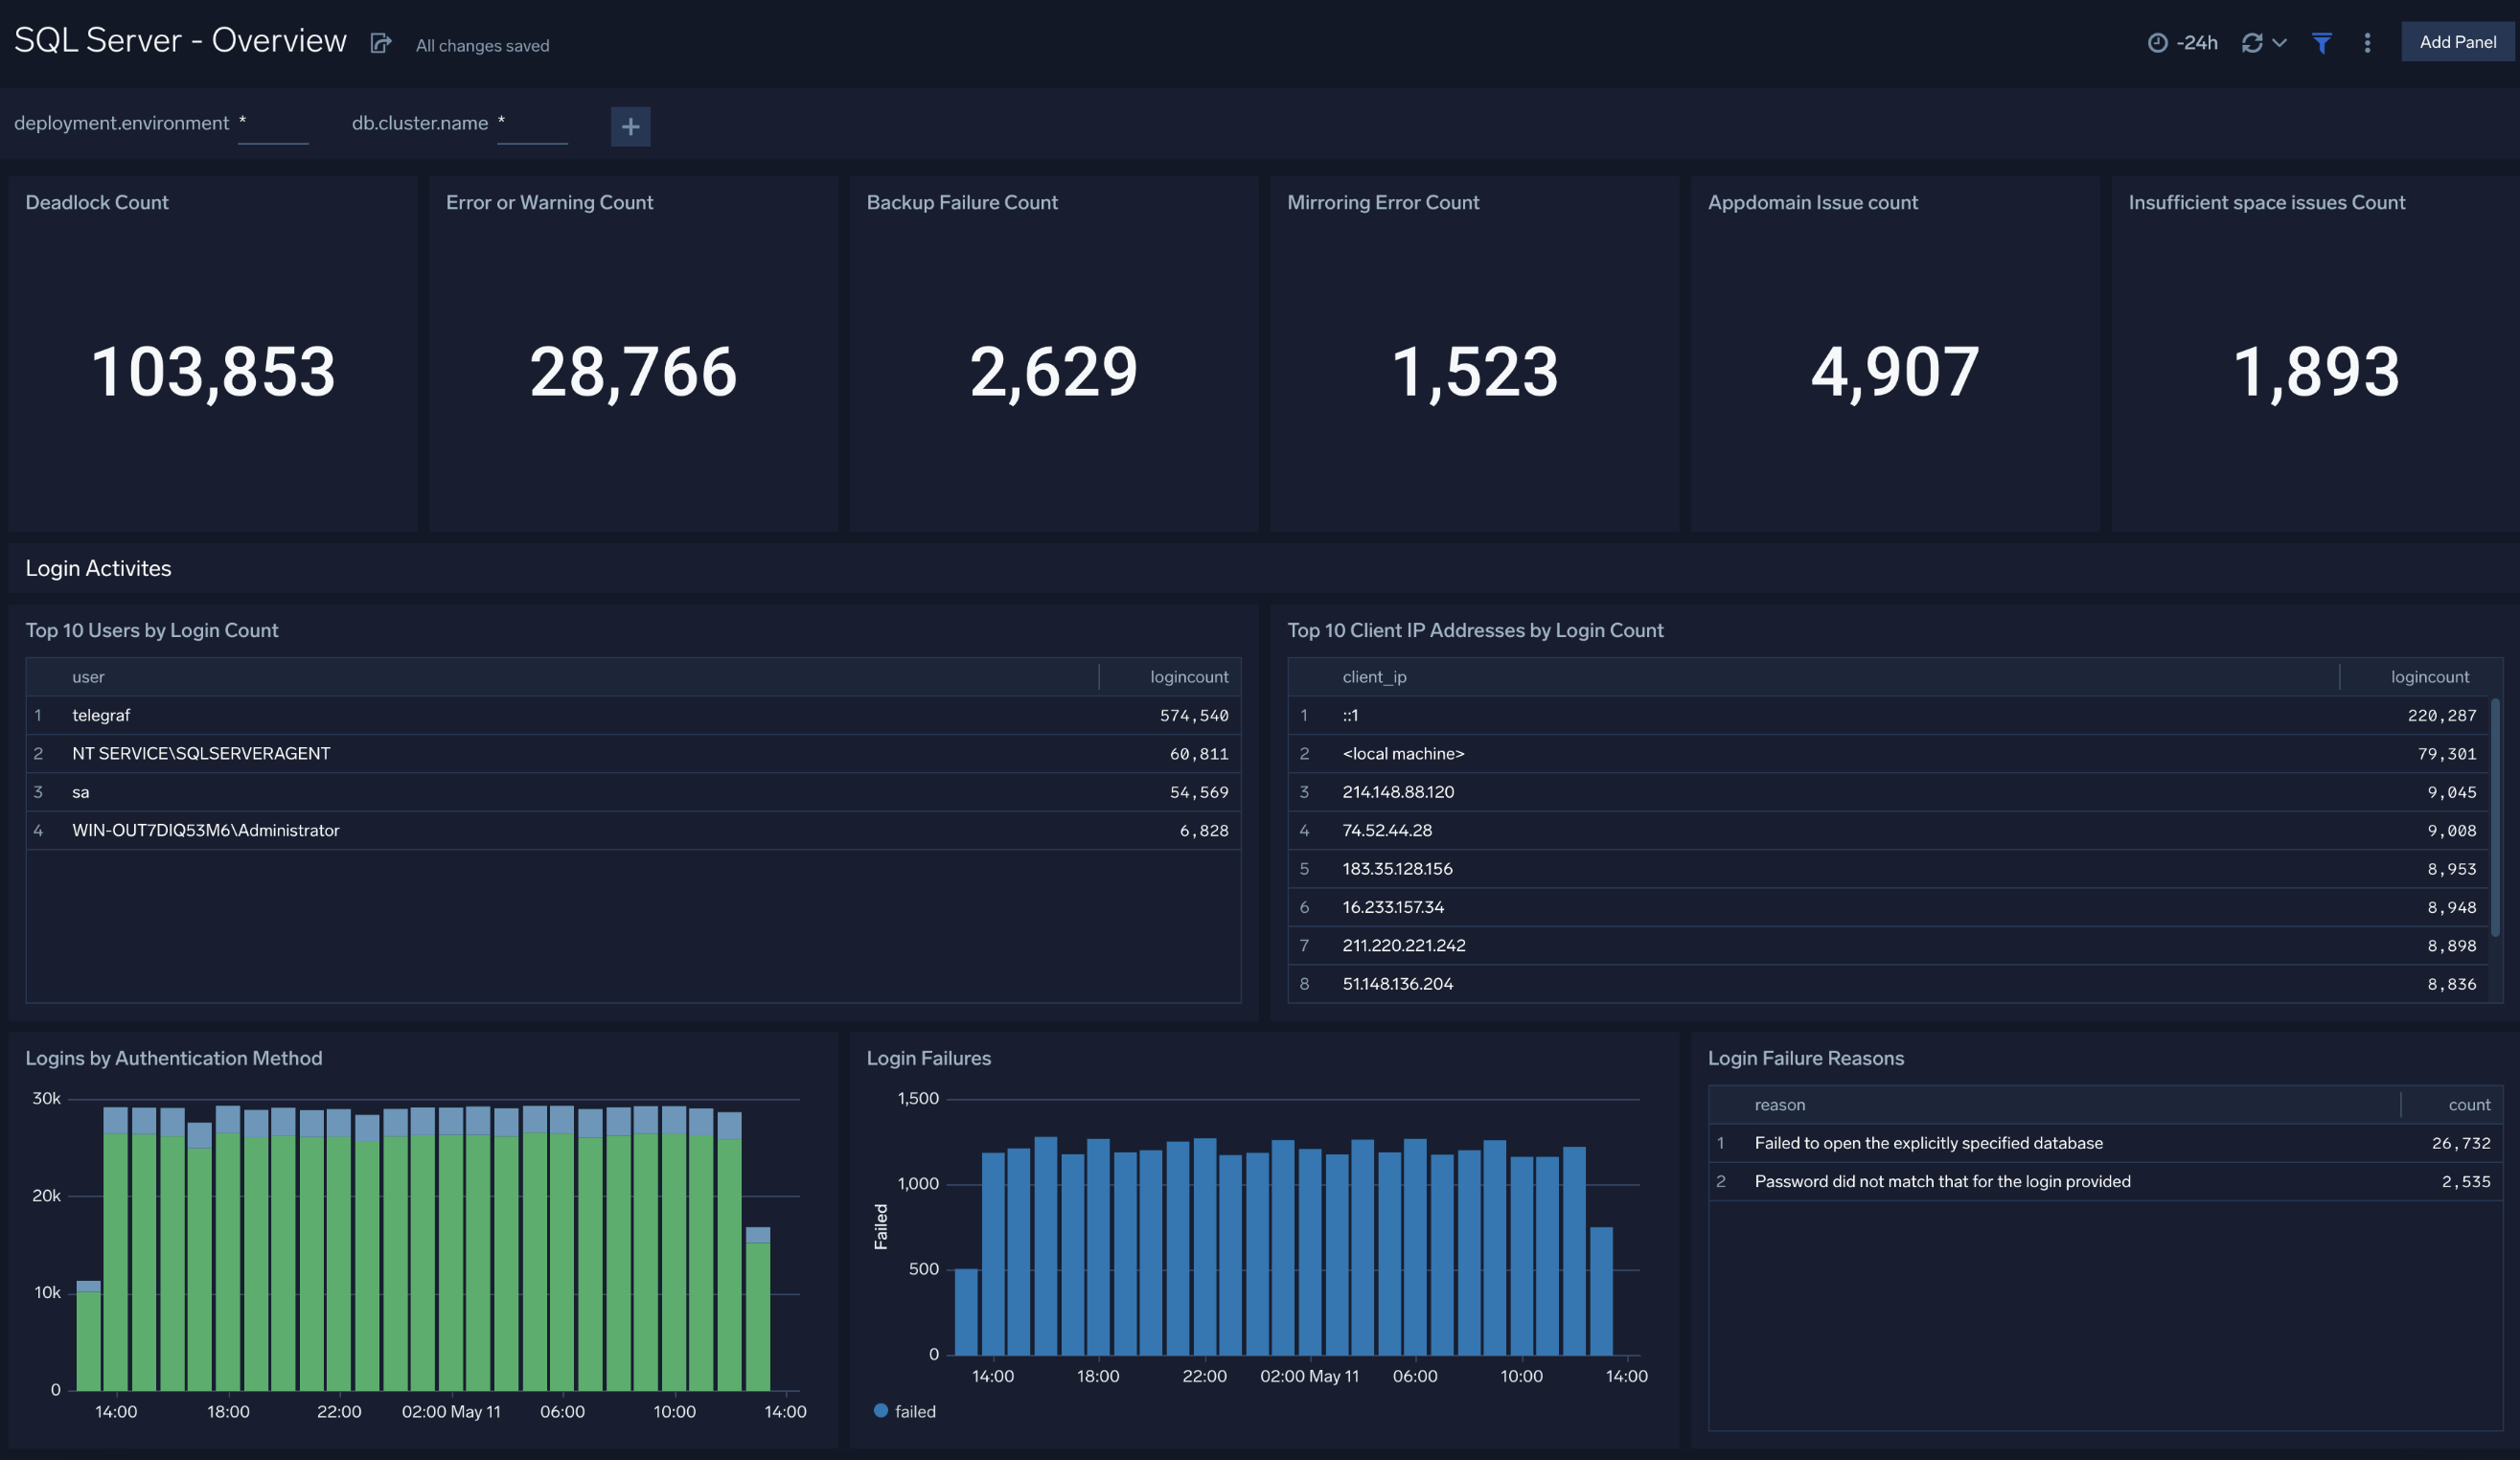
Overview
The SQL Server - Overview dashboard provides a snapshot overview of your SQL Server instance. Use this dashboard to understand CPU, memory, and disk utilization of your SQL Server(s) deployed in your cluster. This dashboard also provides login activities and methods by users.
Use this dashboard to:
- Keep track of deadlocks, errors, backup failures, mirroring errors, and insufficient space issue counts.
- Examine login activities, failures, and failure reasons.
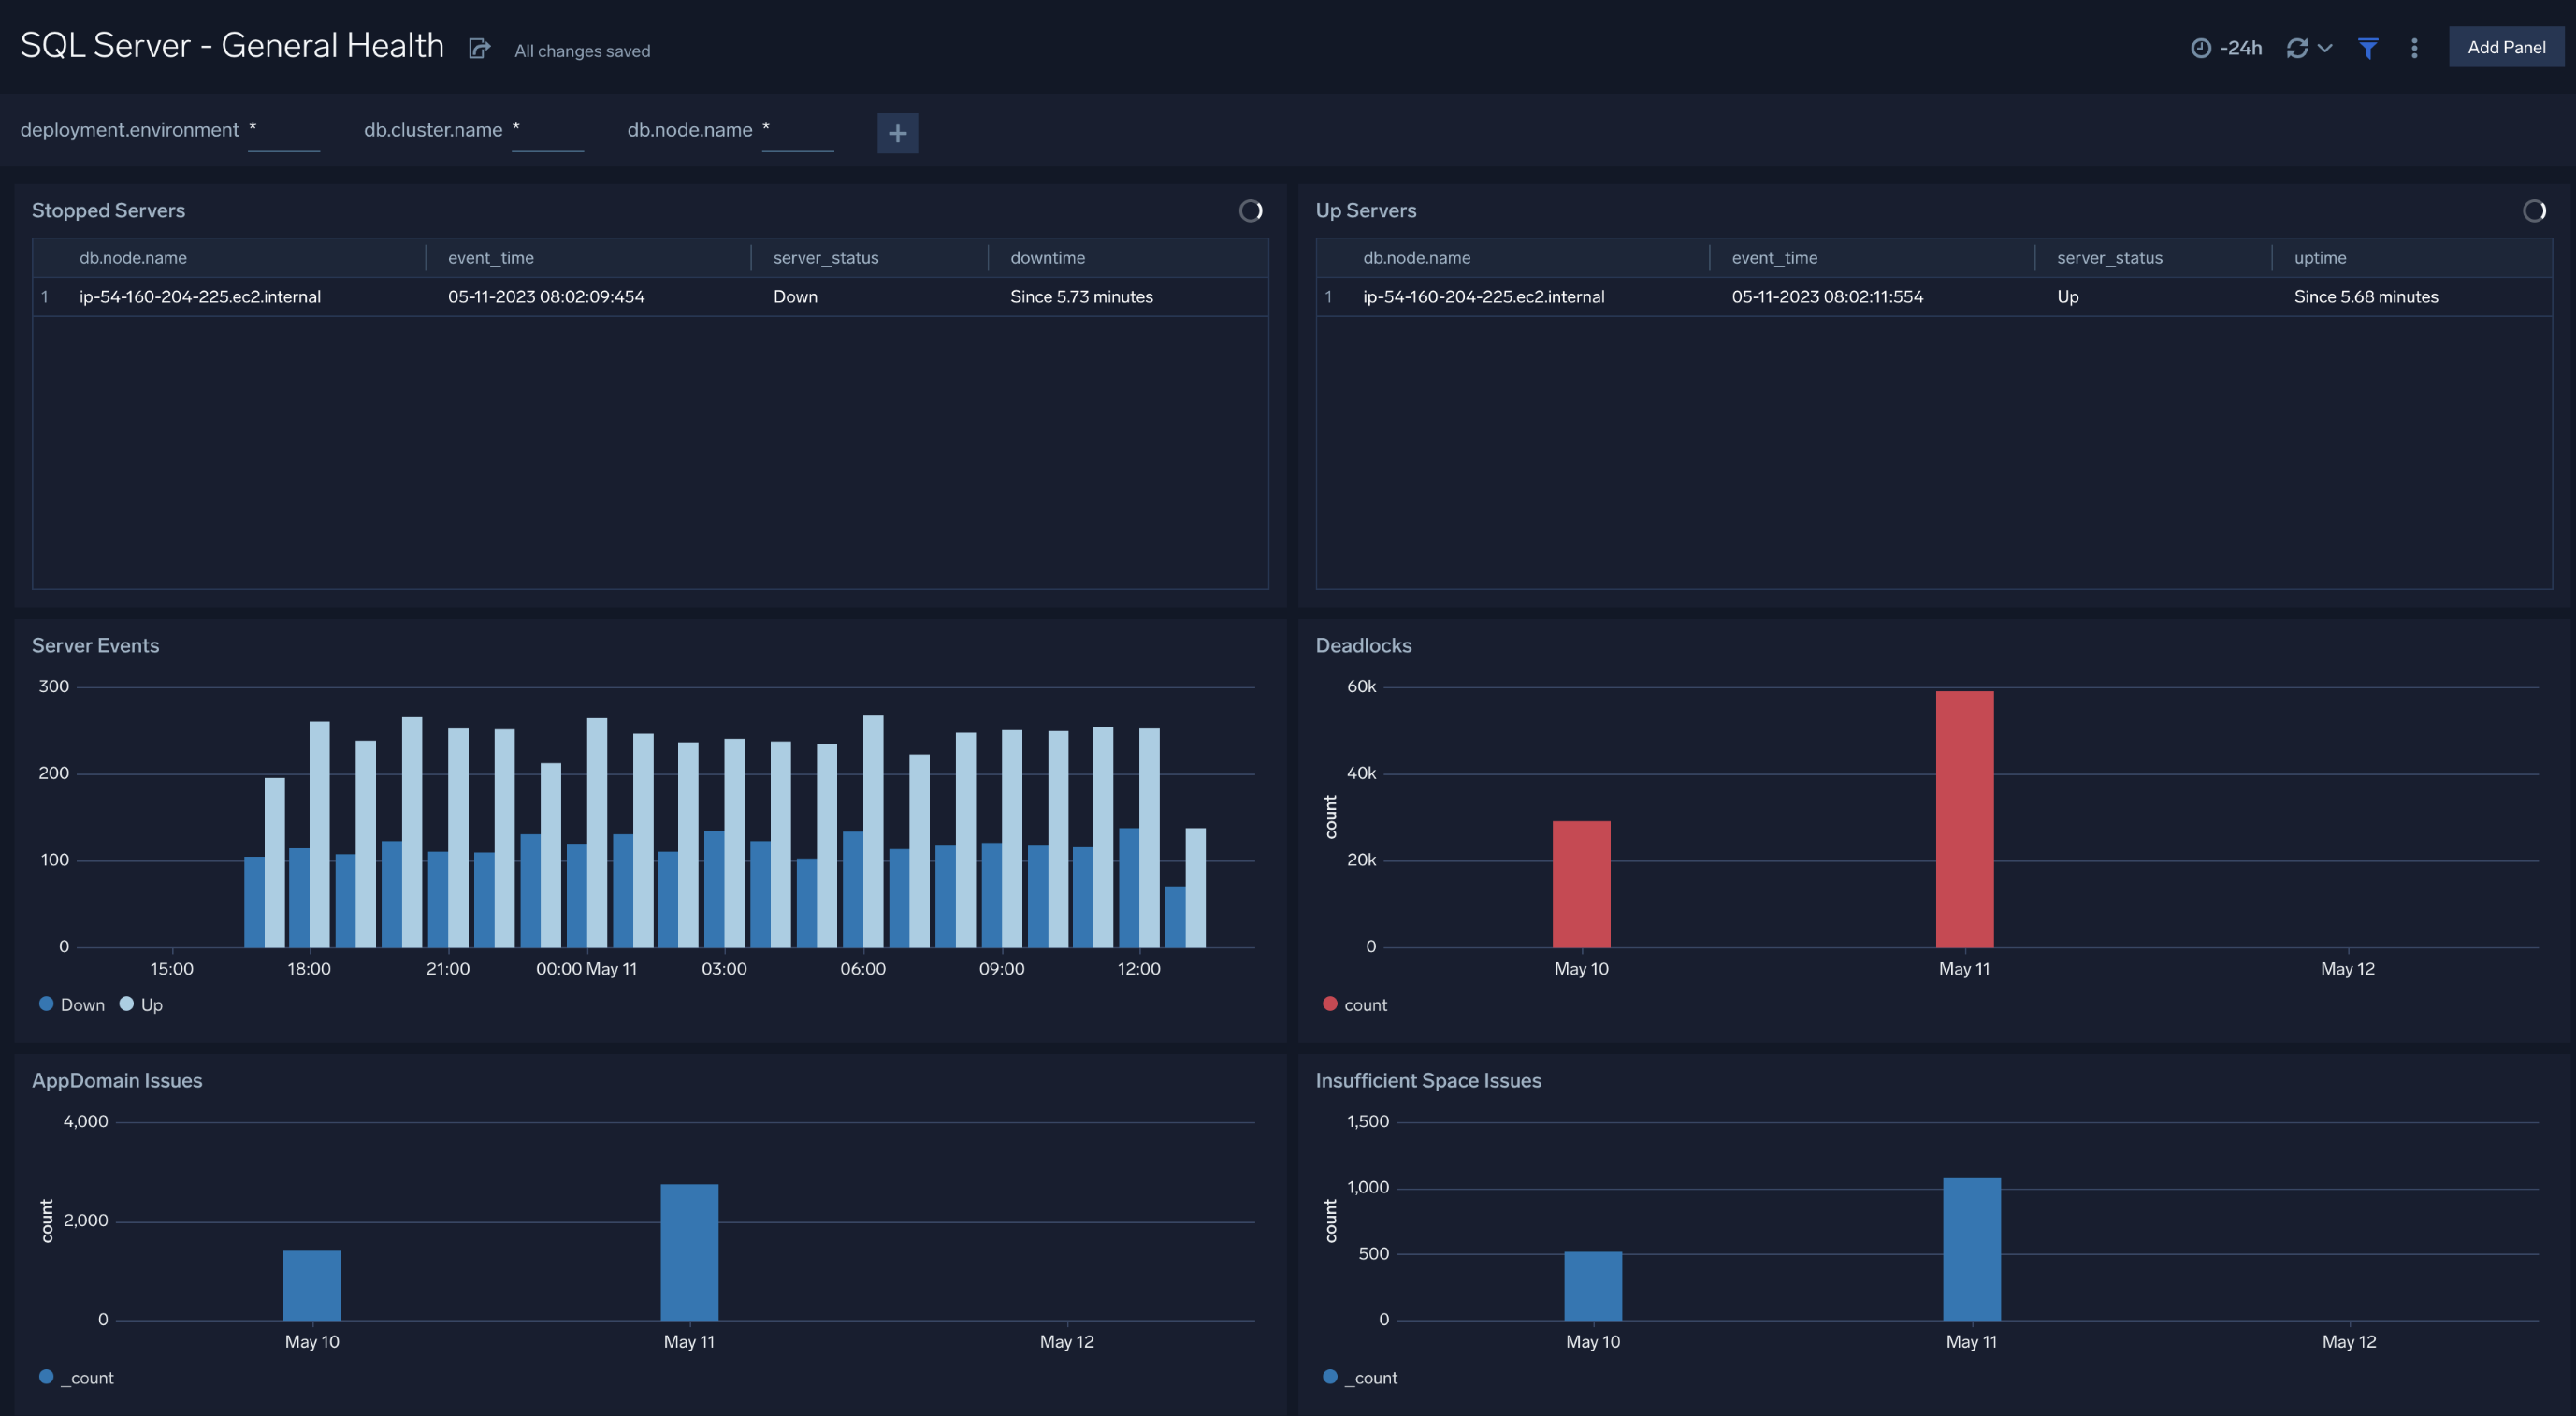
General Health
The SQL Server - General Health dashboard provides you the overall health of SQL Server. Use this dashboard to analyze server events including stopped/up servers and its corresponding down/uptime, monitor disk space percentage utilization, wait time trend, and app-domain issues by SQL server.
Use this dashboard to:
- Analyze server events including stopped/up servers and its corresponding down/uptime.
- Monitor server events trends including SQL Server wait time.
- Get insight into app-domain and percentage disk utilization issues by SQL Server.
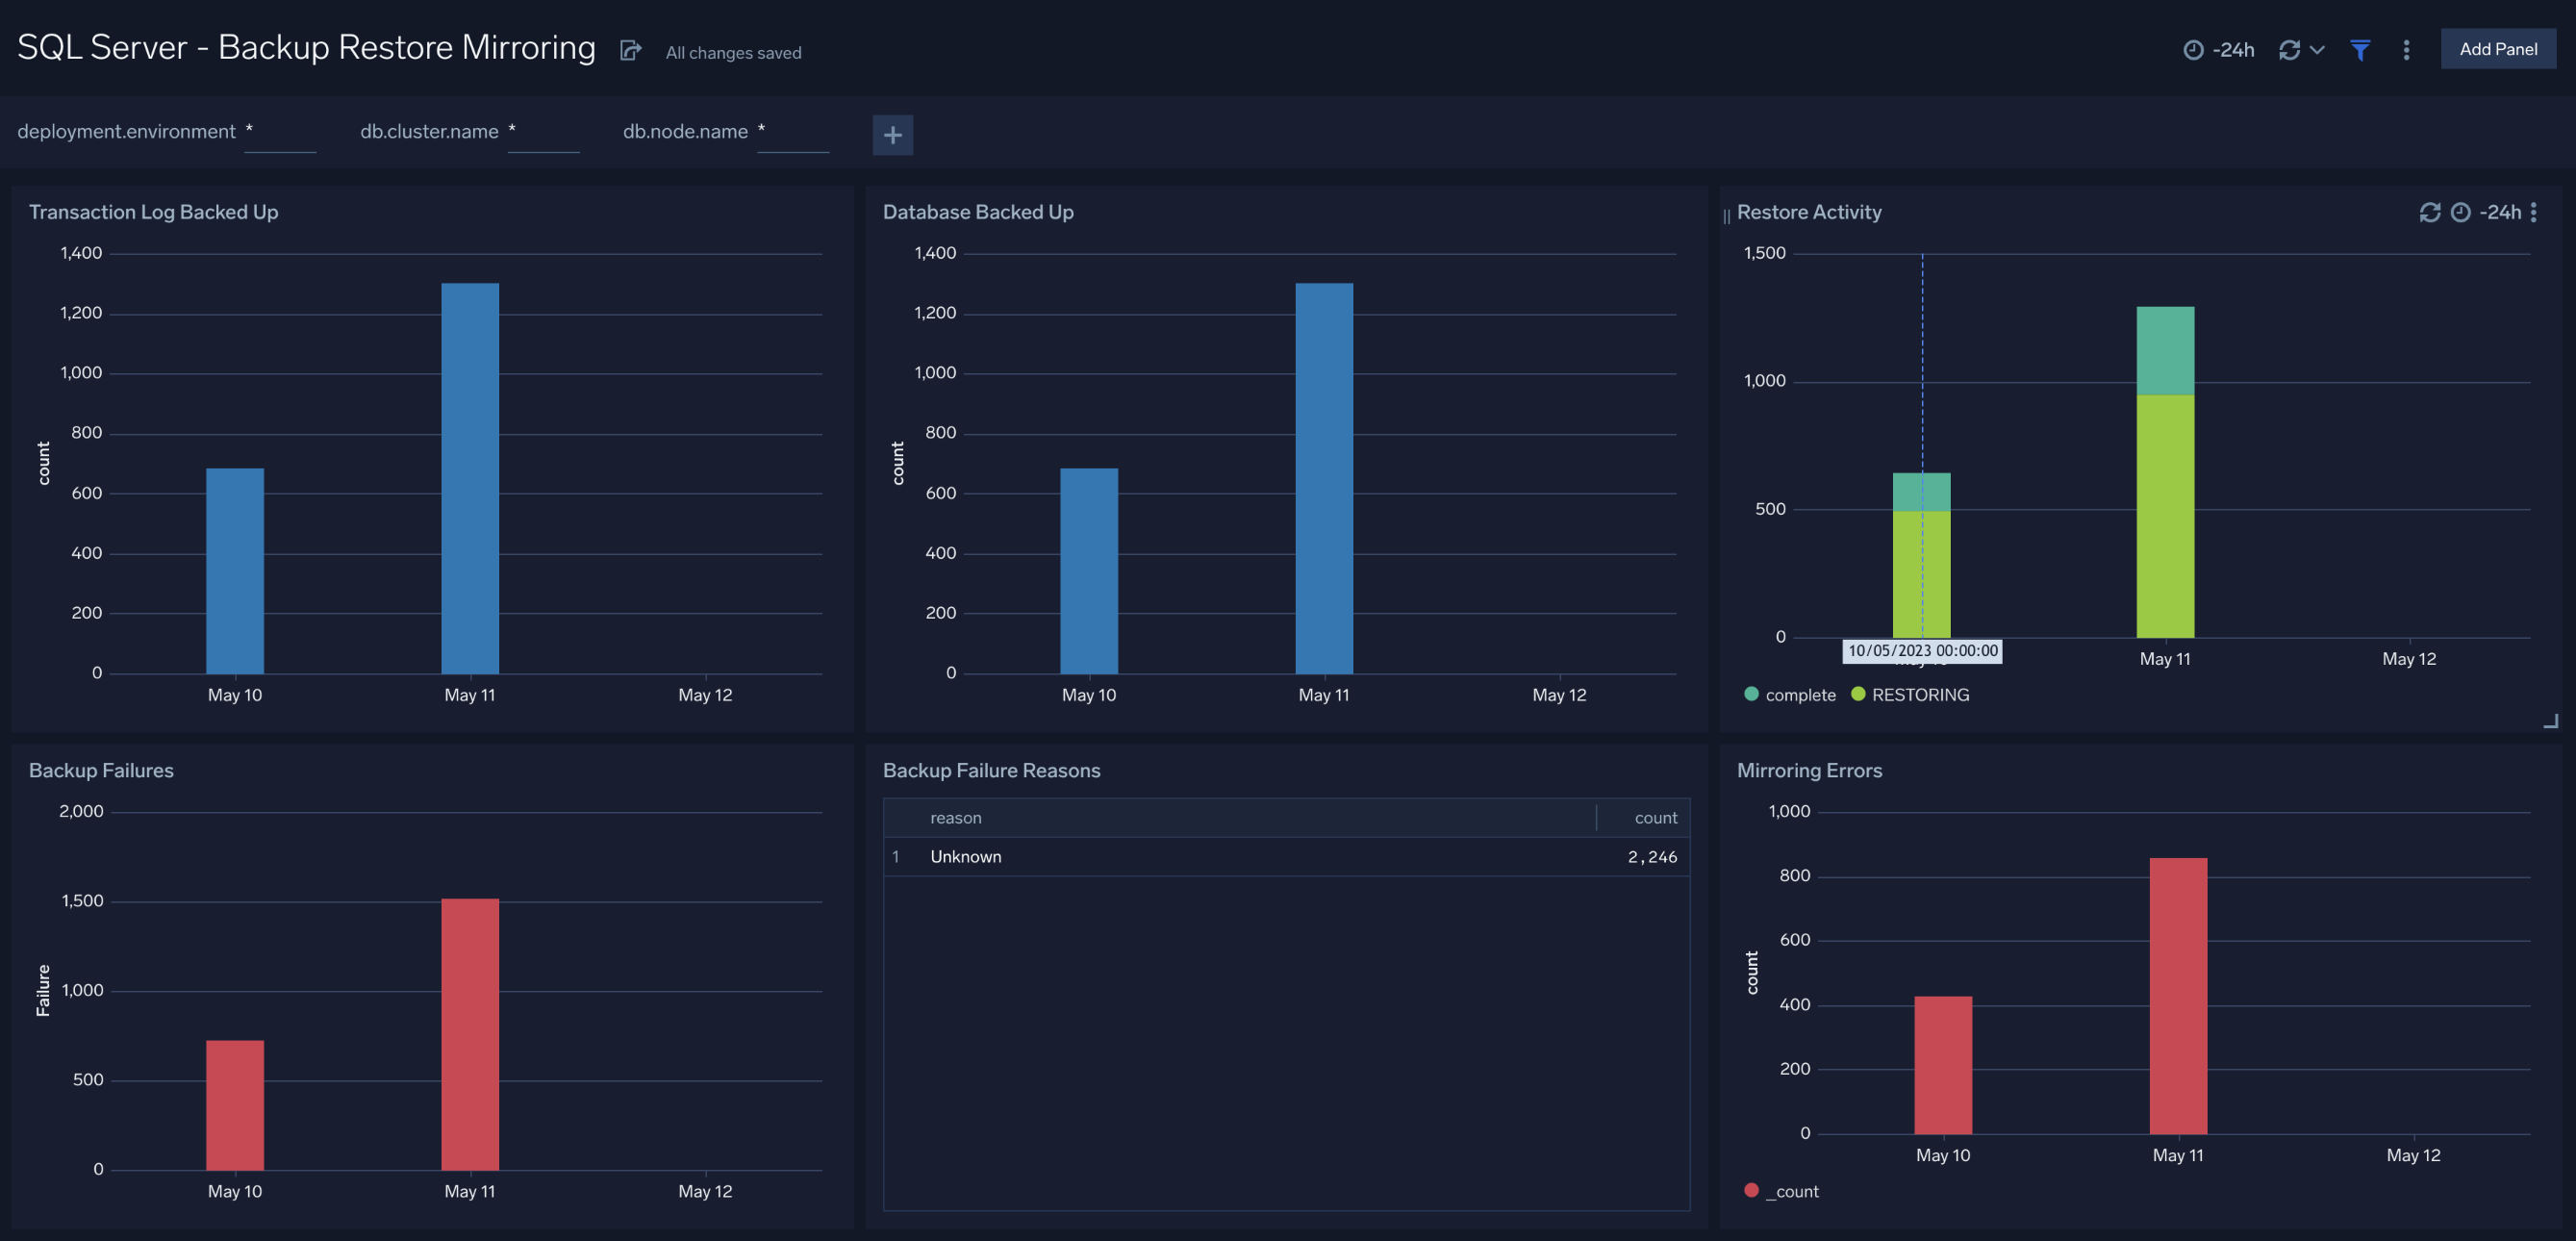
Backup Restore Mirroring
The SQL Server - Backup Restore Mirroring dashboard provides information about:
- Transaction log backup events
- Database backup events
- Restore activities
- Backup failures and reasons
- Mirroring errors
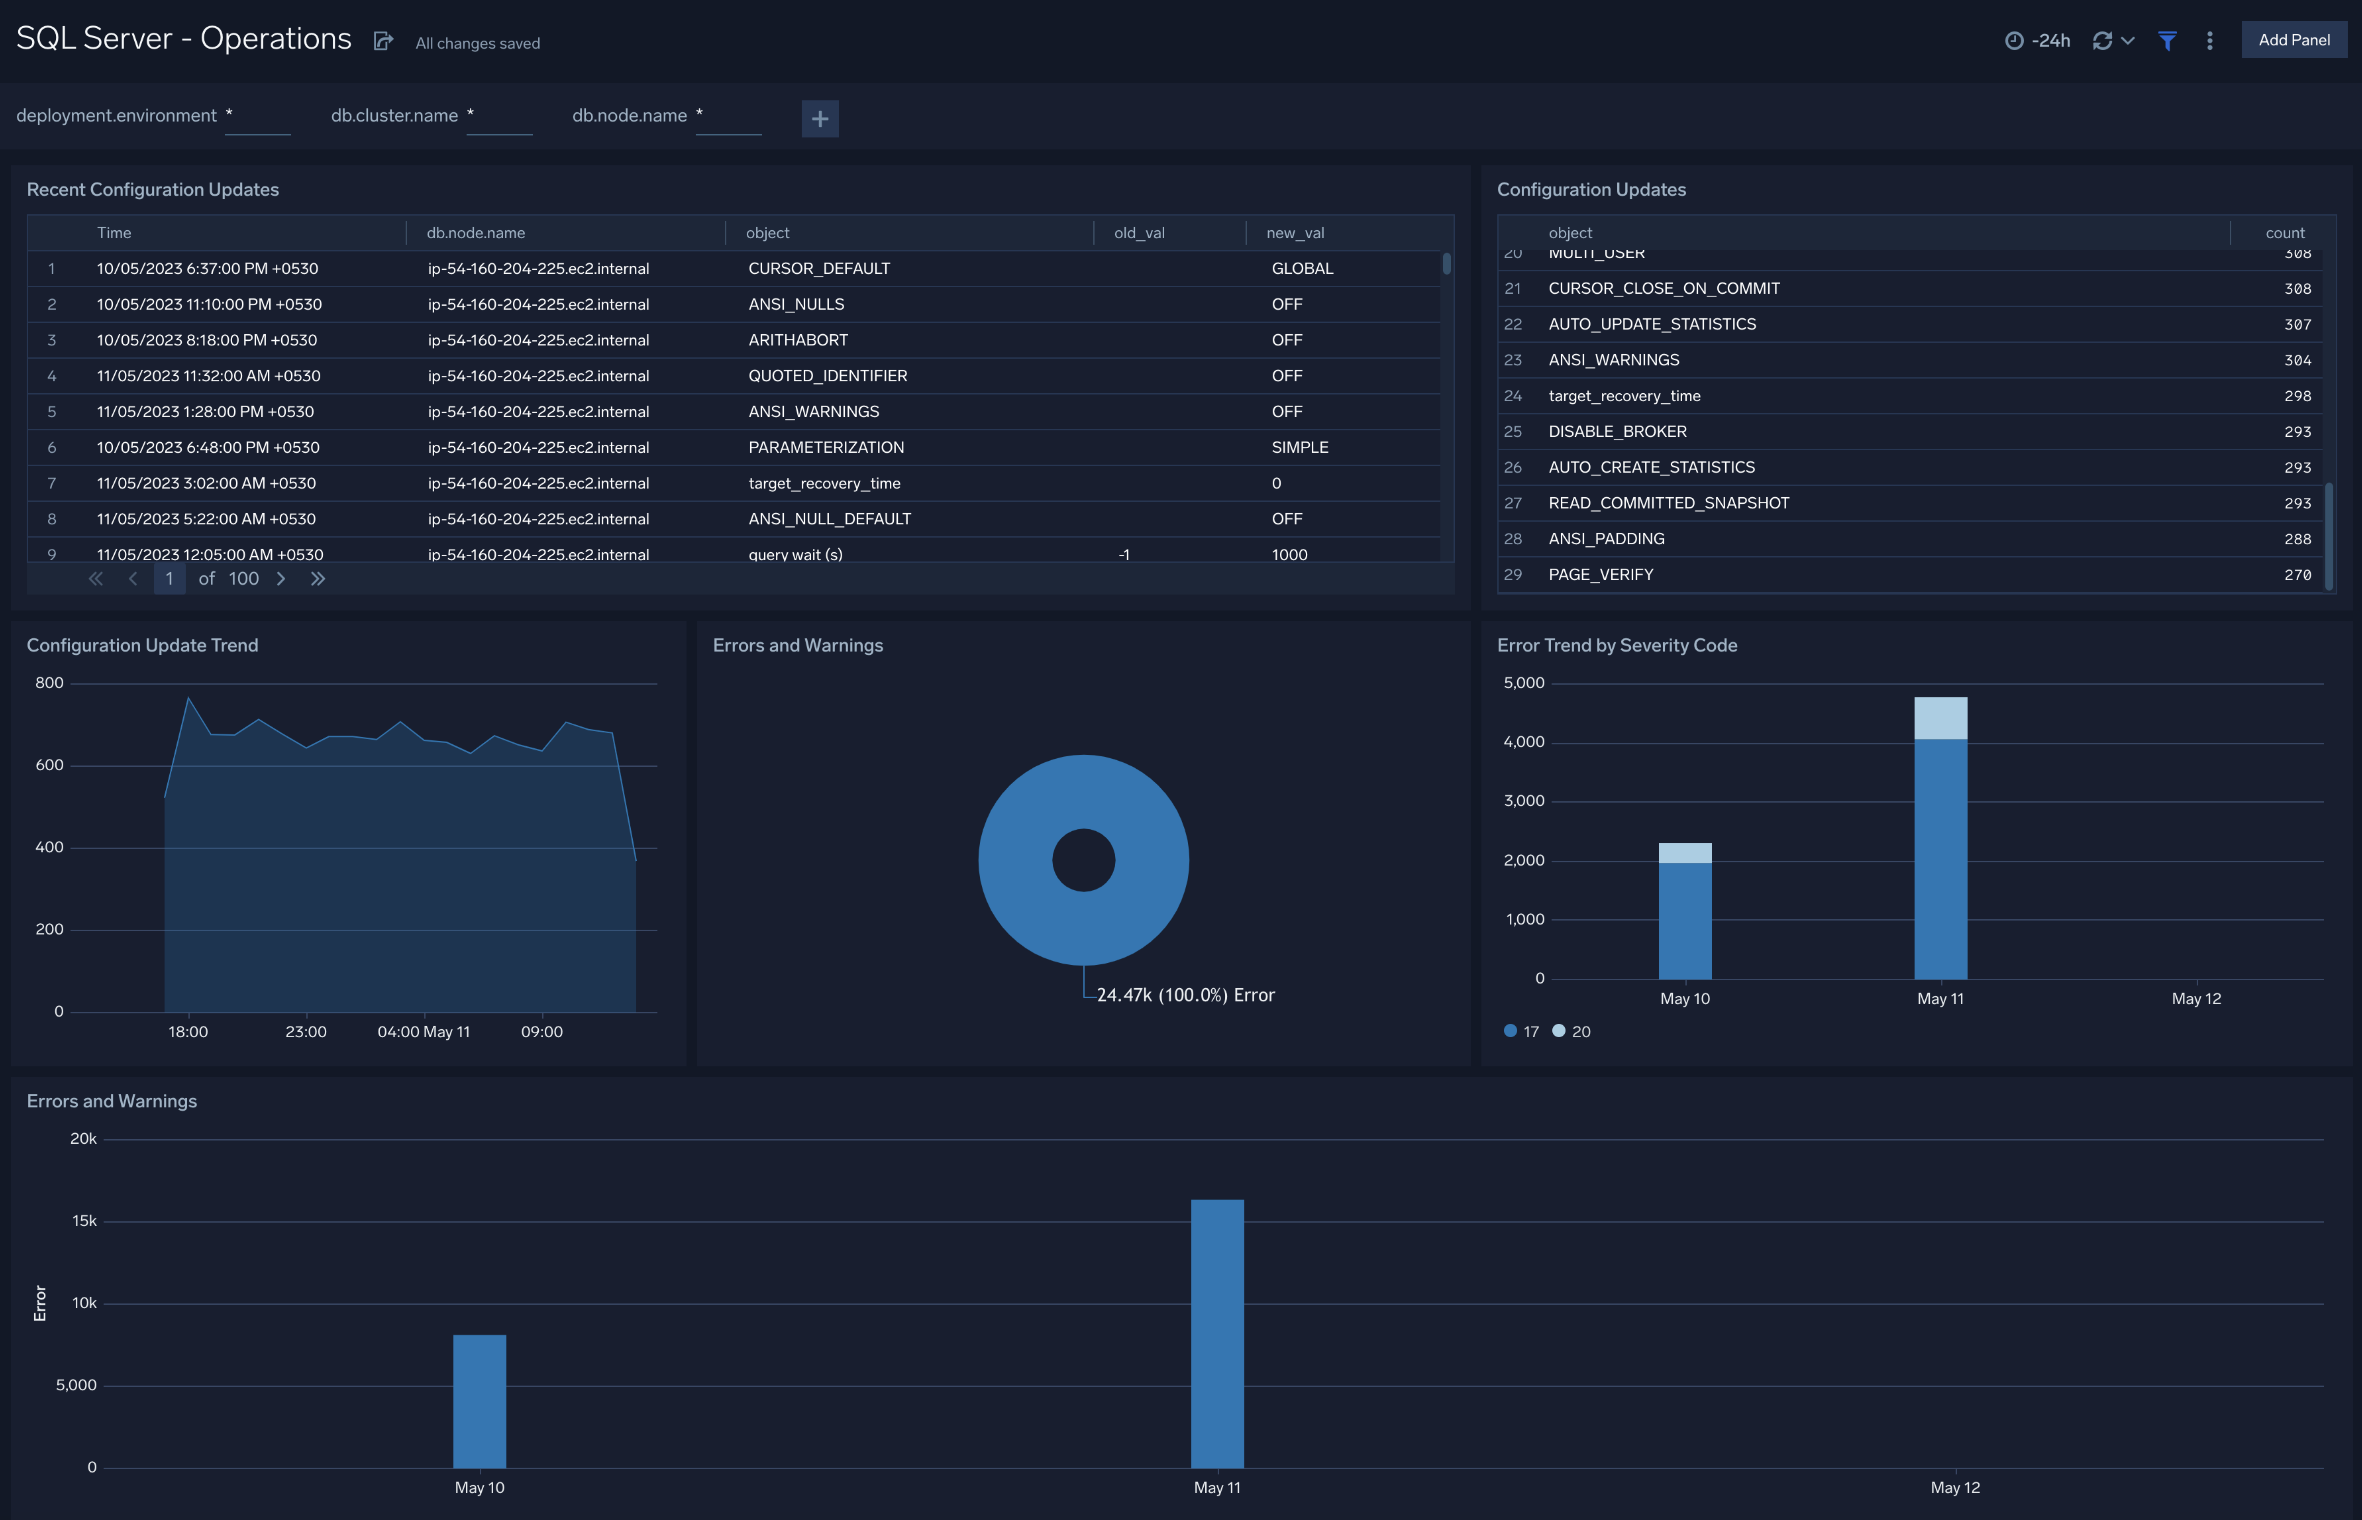
Operations
The SQL Server - Operations dashboard displays recent server configuration changes, number and type of configuration updates, error and warnings, high severity error, and warning trends.
Use this dashboard to:
- Get insights into configuration changes and updates to SQL server instances.
- Monitor any errors and warnings.
Create monitors for SQL Server Linux app
From your App Catalog:
- From the Sumo Logic navigation, select App Catalog.
- In the Search Apps field, search for and then select your app.
- Make sure the app is installed.
- Navigate to What's Included tab and scroll down to the Monitors section.
- Click Create next to the pre-configured monitors. In the create monitors window, adjust the trigger conditions and notifications settings based on your requirements.
- Scroll down to Monitor Details.
- Under Location click on New Folder.
note
By default, monitor will be saved in the root folder. So to make the maintenance easier, create a new folder in the location of your choice.
- Enter Folder Name. Folder Description is optional.
tip
Using app version in the folder name will be helpful to determine the versioning for future updates.
- Click Create. Once the folder is created, click on Save.
SQL Server Linux alerts
| Name | Description | Alert Condition | Recover Condition |
|---|---|---|---|
SQL Server - AppDomain | This alert is triggered when AppDomain-related issues are detected in your SQL Server instance. | Count >= 1 | Count < 1 |
SQL Server - Backup Fail | This alert is triggered when the SQL Server backup fails. | Count >= 1 | Count < 1 |
SQL Server - Deadlock | This alert is triggered when deadlocks are detected in a SQL Server instance. | Count > 5 | Count <= 5 |
SQL Server - Instance Down | This alert is triggered when the SQL Server instance is down for 5 minutes. | Count > 0 | Count <= 0 |
SQL Server - Insufficient Space | This alert is triggered when the SQL Server instance cannot allocate a new page for the database due to insufficient disk space in the filegroup. | Count > 0 | Count <= 0 |
SQL Server - Login Fail | This alert is triggered when the user is unable to login to the SQL Server. | Count >= 1 | Count < 1 |
SQL Server - Mirroring Error | This alert is triggered when an error occurs in SQL Server mirroring. | Count >= 1 | Count < 1 |