Microsoft SQL Server - OpenTelemetry Collector

The SQL Server app is a unifies logs and metrics app to help you monitor the availability, performance, health, and resource utilization of your Microsoft SQL Server database clusters. Preconfigured dashboards provide insight into cluster status, performance, operations as well as backup and restore operations along with Performance metrics and metrics for transaction and transaction logs.
This app has been tested with following SQL Server versions:
Microsoft SQL Server 2022
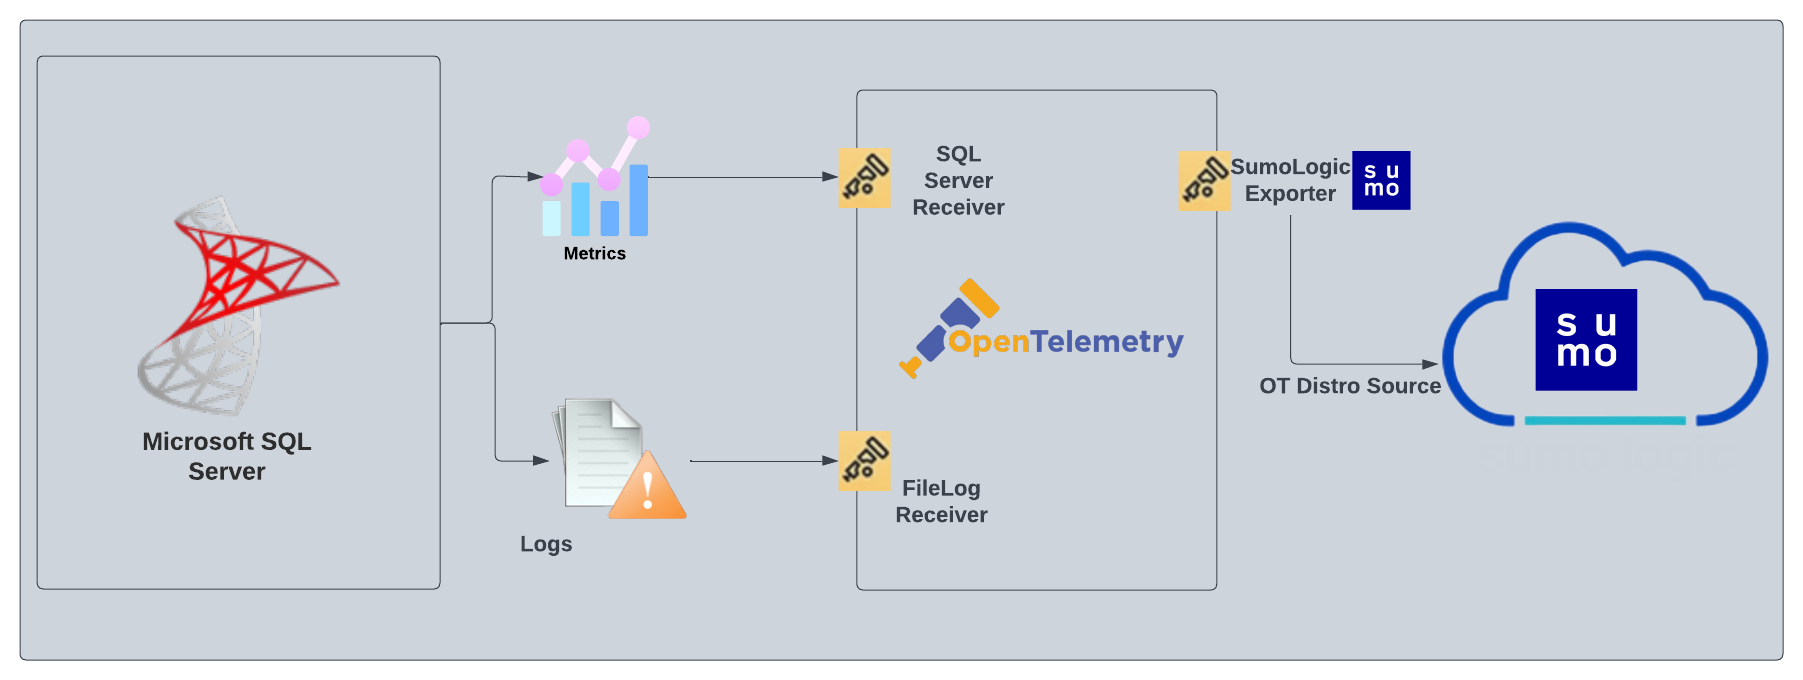
The diagram below illustrates the components of the SQL Server collection for each database server. OpenTelemetry collector runs on the same host as SQL Server, and uses the SQL Server receiver to obtain SQL Server metrics. This receiver grabs metrics about a Microsoft SQL Server instance using the Windows Performance Counters (Windows only) and by connecting to SQL Server using the credentials (Windows and Linux both) SQL Server logs are sent to Sumo Logic through OpenTelemetry filelog receiver.
This app includes built-in monitors. For details on creating custom monitors, refer to Create monitors for Microsoft SQL Server app.
Fields creation in Sumo Logic for SQL Server
Following are the Fields which will be created as part of SQL Server app installation, if not already present.
db.cluster.name. User configured. Enter a name to identify this SQL Server cluster. This cluster name will be shown in the Sumo Logic dashboards.db.system. Has a fixed value of sqlserver.deployment.environment. User configured. This is the deployment environment where the SQL Server cluster resides. For example dev, prod, or qa.sumo.datasource. Has a fixed value of sqlserver.
Prerequisites
For metrics collection
The SQL server receiver for OpenTelemetry grabs metrics about a Microsoft SQL Server instance using different methods:
Windows:
- Uses Windows Performance Counters for collecting system-level metrics
- Connects directly to SQL Server using credentials for database-specific metrics
Linux:
- Connects to SQL Server using credentials (Windows Authentication is not available on Linux)
- Requires SQL Server authentication
For logs collection
Make sure logging is turned on in SQL Server. Follow this documentation to enable it.
The Microsoft SQL Server App's queries and dashboards depend on logs from the SQL Server ERRORLOG, which is typically found in:
Windows: C:\Program Files\Microsoft SQL Server\MSSQL<version>.MSSQLSERVER\MSSQL\Log\ERRORLOG*
Linux: /var/opt/mssql/log/errorlog* (default path for SQL Server on Linux)
The ERRORLOG is typically in UTF-16LE encoding on Windows and Linux both. Be sure to verify the file encoding used in your SQL Server configuration.
ACL Support
For Windows systems, log files which are collected should be accessible by the SYSTEM group. Use the following set of PowerShell commands if the SYSTEM group does not have access.
$NewAcl = Get-Acl -Path "<PATH_TO_LOG_FILE>"
# Set properties
$identity = "NT AUTHORITY\SYSTEM"
$fileSystemRights = "ReadAndExecute"
$type = "Allow"
# Create new rule
$fileSystemAccessRuleArgumentList = $identity, $fileSystemRights, $type
$fileSystemAccessRule = New-Object -TypeName System.Security.AccessControl.FileSystemAccessRule -ArgumentList $fileSystemAccessRuleArgumentList
# Apply new rule
$NewAcl.SetAccessRule($fileSystemAccessRule)
Set-Acl -Path "<PATH_TO_LOG_FILE>" -AclObject $NewAcl
For Linux systems, ensure the OpenTelemetry collector process has read access to the log files:
# Grant read access to the collector user (adjust paths as needed)
sudo chmod +r /var/opt/mssql/log/errorlog*
Collection configuration and app installation
As part of data collection setup and app installation, you can select the App from App Catalog and click on Install App. Follow the steps below.
Step 1: Set up Collector
If you want to use an existing OTel Collector, then this step can be skipped by selecting the option of using an existing Collector.
If you want to create a new Collector, select the Add a new Collector option.
Select the platform for which you want to install the Sumo OpenTelemetry Collector.
This will generate a command you can execute on the machine that you need to monitor. Once executed, it will install the Sumo Logic OpenTelemetry Collector agent.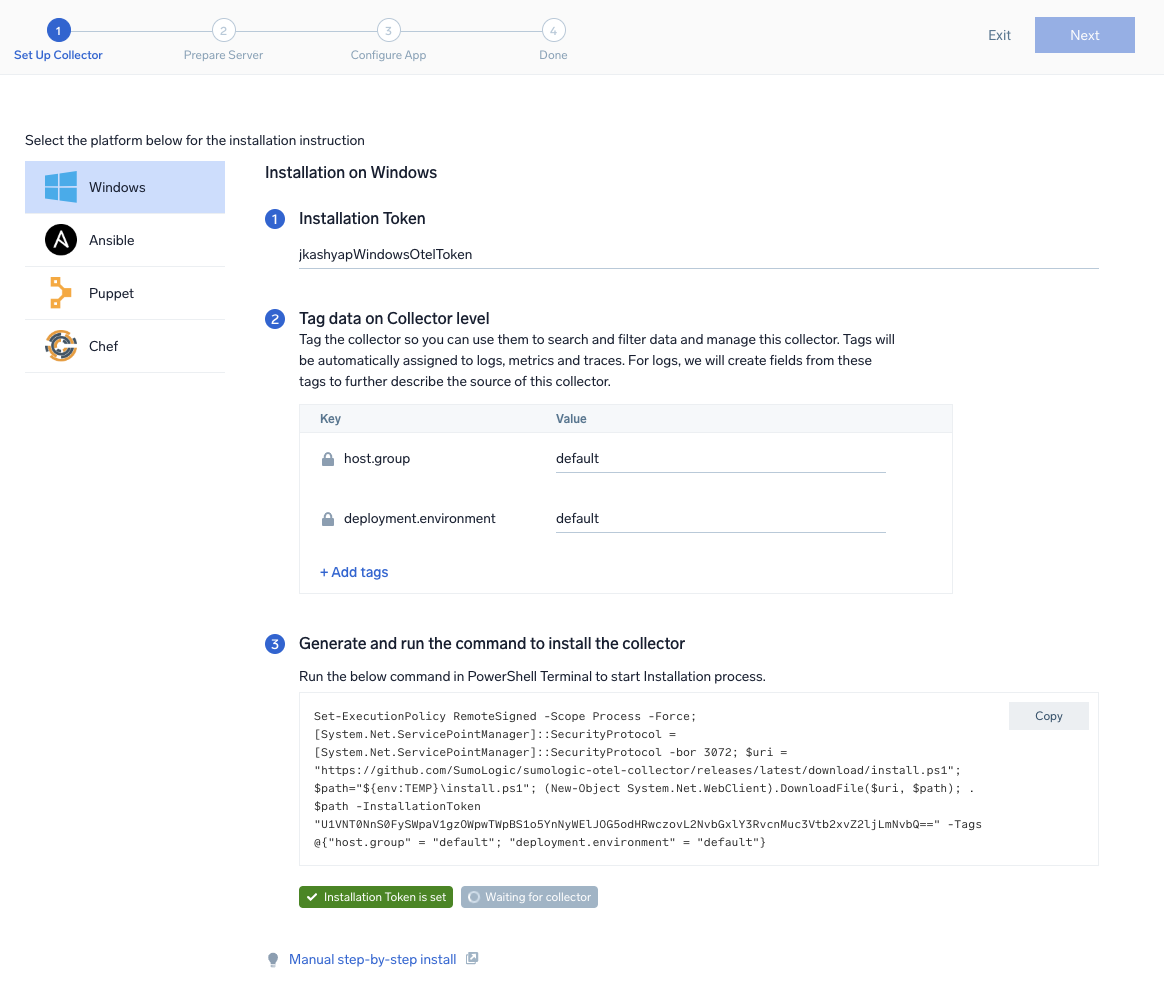
Step 2: Configure integration
-
Log File Path Configuration:
- Windows: The Microsoft SQL Server App's queries and dashboards depend on logs from the SQL Server ERRORLOG, which is typically found in:
C:\Program Files\Microsoft SQL Server\MSSQL<version>.MSSQLSERVER\MSSQL\Log\ERRORLOG* - Linux: For SQL Server on Linux, logs are typically located at:
/var/opt/mssql/log/errorlog*
- Windows: The Microsoft SQL Server App's queries and dashboards depend on logs from the SQL Server ERRORLOG, which is typically found in:
-
SQL Server Connection Configuration: To collect metrics, you'll need to provide connection details:
- Server Address: The hostname or IP address of your SQL Server instance (default: 0.0.0.0)
- Port: The port number for SQL Server connection (default: 1433)
- Username: SQL Server authentication username
- Password: SQL Server authentication password
-
Monitoring a Named SQL Server Instance (Windows Only)
To collect metrics from a specific named instance of SQL Server on a Windows host, enable the
Enable metric collection for SQL Server with a named instanceoption. For a default SQL Server setup, these settings are optional.- Computer Name: The computer name identifies the SQL Server name or IP address of the computer being monitored. This is the network name of the machine hosting SQL Server.
- Instance Name: The instance name identifies the specific SQL Server instance being monitored. This is required when SQL Server is installed as a named instance (e.g., SQLEXPRESS, INSTANCE01) rather than the default instance.
noteMonitoring metrics for named instance is not supported in linux.
-
You can add any custom fields which you want to tag along with the data ingested in Sumo Logic.
-
Click on the Download YAML File button to get the yaml file.

Step 3: Send logs to Sumo Logic
Once you have downloaded the YAML file as described in the previous step, follow the below steps based on your platform.
- Windows
- Linux
- Chef
- Ansible
- Puppet
- Copy the YAML file to
C:\ProgramData\Sumo Logic\OpenTelemetry Collector\config\conf.dfolder in the machine which needs to be monitored. - Restart the collector using:
Restart-Service -Name OtelcolSumo
- Copy the YAML file to
/etc/otelcol-sumo/conf.d/folder in the machine which needs to be monitored. - Restart the collector using:
sudo systemctl restart otelcol-sumo
- Copy the yaml file into your Chef cookbook files directory
files/<downloaded_yaml_file>. - Use a Chef file resource in a recipe to manage it.
cookbook_file '/etc/otelcol-sumo/conf.d/<downloaded_yaml_file>' do mode 0644 notifies :restart, 'service[otelcol-sumo]', :delayed end - Add the recipe to your collector setup to start collecting the data. Every team typically has their established way of applying the Chef recipe. The resulting Chef recipe should look something like:
cookbook_file '/etc/otelcol-sumo/conf.d/<downloaded_yaml_file>' do
mode 0644
notifies :restart, 'service[otelcol-sumo]', :delayed
end
- Place the file into your Ansible playbook files directory.
- Run the Ansible playbook.
ansible-playbook -i inventory install_sumologic_otel_collector.yaml
-e '{"installation_token": "<YOUR_TOKEN>", "collector_tags": {<YOUR_TAGS>}, "src_config_path": "files/conf.d"}'
- Place the file into your Puppet module files directory
modules/install_otel_collector/files/<downloaded_yaml>. - Use a Puppet file resource to manage it.
file { '/etc/otelcol-sumo/conf.d/<downloaded_yaml_file>':
    ensure => present,
    source => 'puppet:///modules/install_otel_collector/<downloaded_yaml_file>',
    mode => '0644',
    notify => Service[otelcol-sumo],
} - Apply the Puppet manifest. Every team typically has their established way of applying the Puppet manifest. The resulting Puppet manifest should look something like:
node 'default' {
    class { 'install_otel_collector'
      installation_token => '<YOUR_TOKEN>',
      collector_tags => { <YOUR_TAGS> },
    }

    service { 'otelcol-sumo':
      provider => 'systemd',
      ensure => running,
      enable => true,
      require => Class['install_otel_collector'],
    }

    file { '/etc/otelcol-sumo/conf.d/<downloaded_yaml_file>':
      ensure => present,
      source => 'puppet:///modules/install_otel_collector/<downloaded_yaml_file>',
      mode => '0644',
      notify => Service[otelcol-sumo],
    }
  }
After successfully executing the above command, Sumo Logic will start receiving data from your host machine.
Click Next. This will install the app (dashboards and monitors) to your Sumo Logic Org.
Dashboard panels will start to fill automatically. It's important to note that each panel fills with data matching the time range query and received since the panel was created. Results won't immediately be available, but within 20 minutes, you'll see full graphs and maps.
Sample log messages
2023-01-09 13:23:31.276 Logon Login succeeded for user 'NT SERVICE\SQLSERVERAGENT'. Connection made using Windows authentication. [CLIENT: ]
Sample metrics
{
  "queryId":"A",
  "_source":"EC2AMAZ-T30T53R-13b7b3fc-cc2f-4eb0-accb-2aa33e6fa01b",
  "_metricId":"K4oGmX1LMJ_iMZ4EeqGjJg",
  "_sourceName":"OTC Metric Input",
  "os.type":"windows",
  "sumo.datasource":"sqlserver",
  "db.system":"sqlserver",
  "_sourceCategory":"OTC Metric Input",
  "deployment.environment":"ec2WinDev",
  "host.name":"EC2AMAZ-T30T53R.ec2.internal",
  "metric":"sqlserver.transaction_log.flush.rate",
  "_collectorId":"00005AF3107A445C",
  "_sourceId":"0000000000000000",
  "unit":"{flushes}/s",
  "db.cluster.name":"sqlserverCluster",
  "_sourceHost":"EC2AMAZ-T30T53R",
  "sqlserver.database.name":"master",
  "_collector":"EC2AMAZ-T30T53R-13b7b3fc-cc2f-4eb0-accb-2aa33e6fa01b",
  "max":0.001388,
  "min":0,
  "avg":0.0007219,
  "sum":0.00361,
  "latest":0,
  "count":5
  }
Sample queries
This is a sample log query from the Error and warning count panel in the SQL Server App - Overview dashboard.
 %"db.cluster.name"=* %"deployment.environment"=*  %"sumo.datasource"=sqlserver ("Error:" or "Warning:") | json "log" as _rawlog nodrop
| if (isEmpty(_rawlog), _raw, _rawlog) as _raw
| parse regex "\s+(?<Logtype>Error|Warning):\s+(?<message>.*)$"
| count by LogType
This is a sample metrics query from the Page Buffer hit ratio % panel in the SQL Server - Performance Counters dashboard.
sumo.datasource=sqlserver deployment.environment=* db.cluster.name=* metric=sqlserver.page.buffer_cache.hit_ratio
Viewing Microsoft SQL Server dashboards
All dashboards have a set of filters that you can apply to the entire dashboard. Use these filters to drill down and examine the data to a granular level.
- You can change the time range for a dashboard or panel by selecting a predefined interval from a drop-down list, choosing a recently used time range, or specifying custom dates and times. Learn more.
- You can use template variables to drill down and examine the data on a granular level. For more information, see Filtering Dashboards with Template Variables.
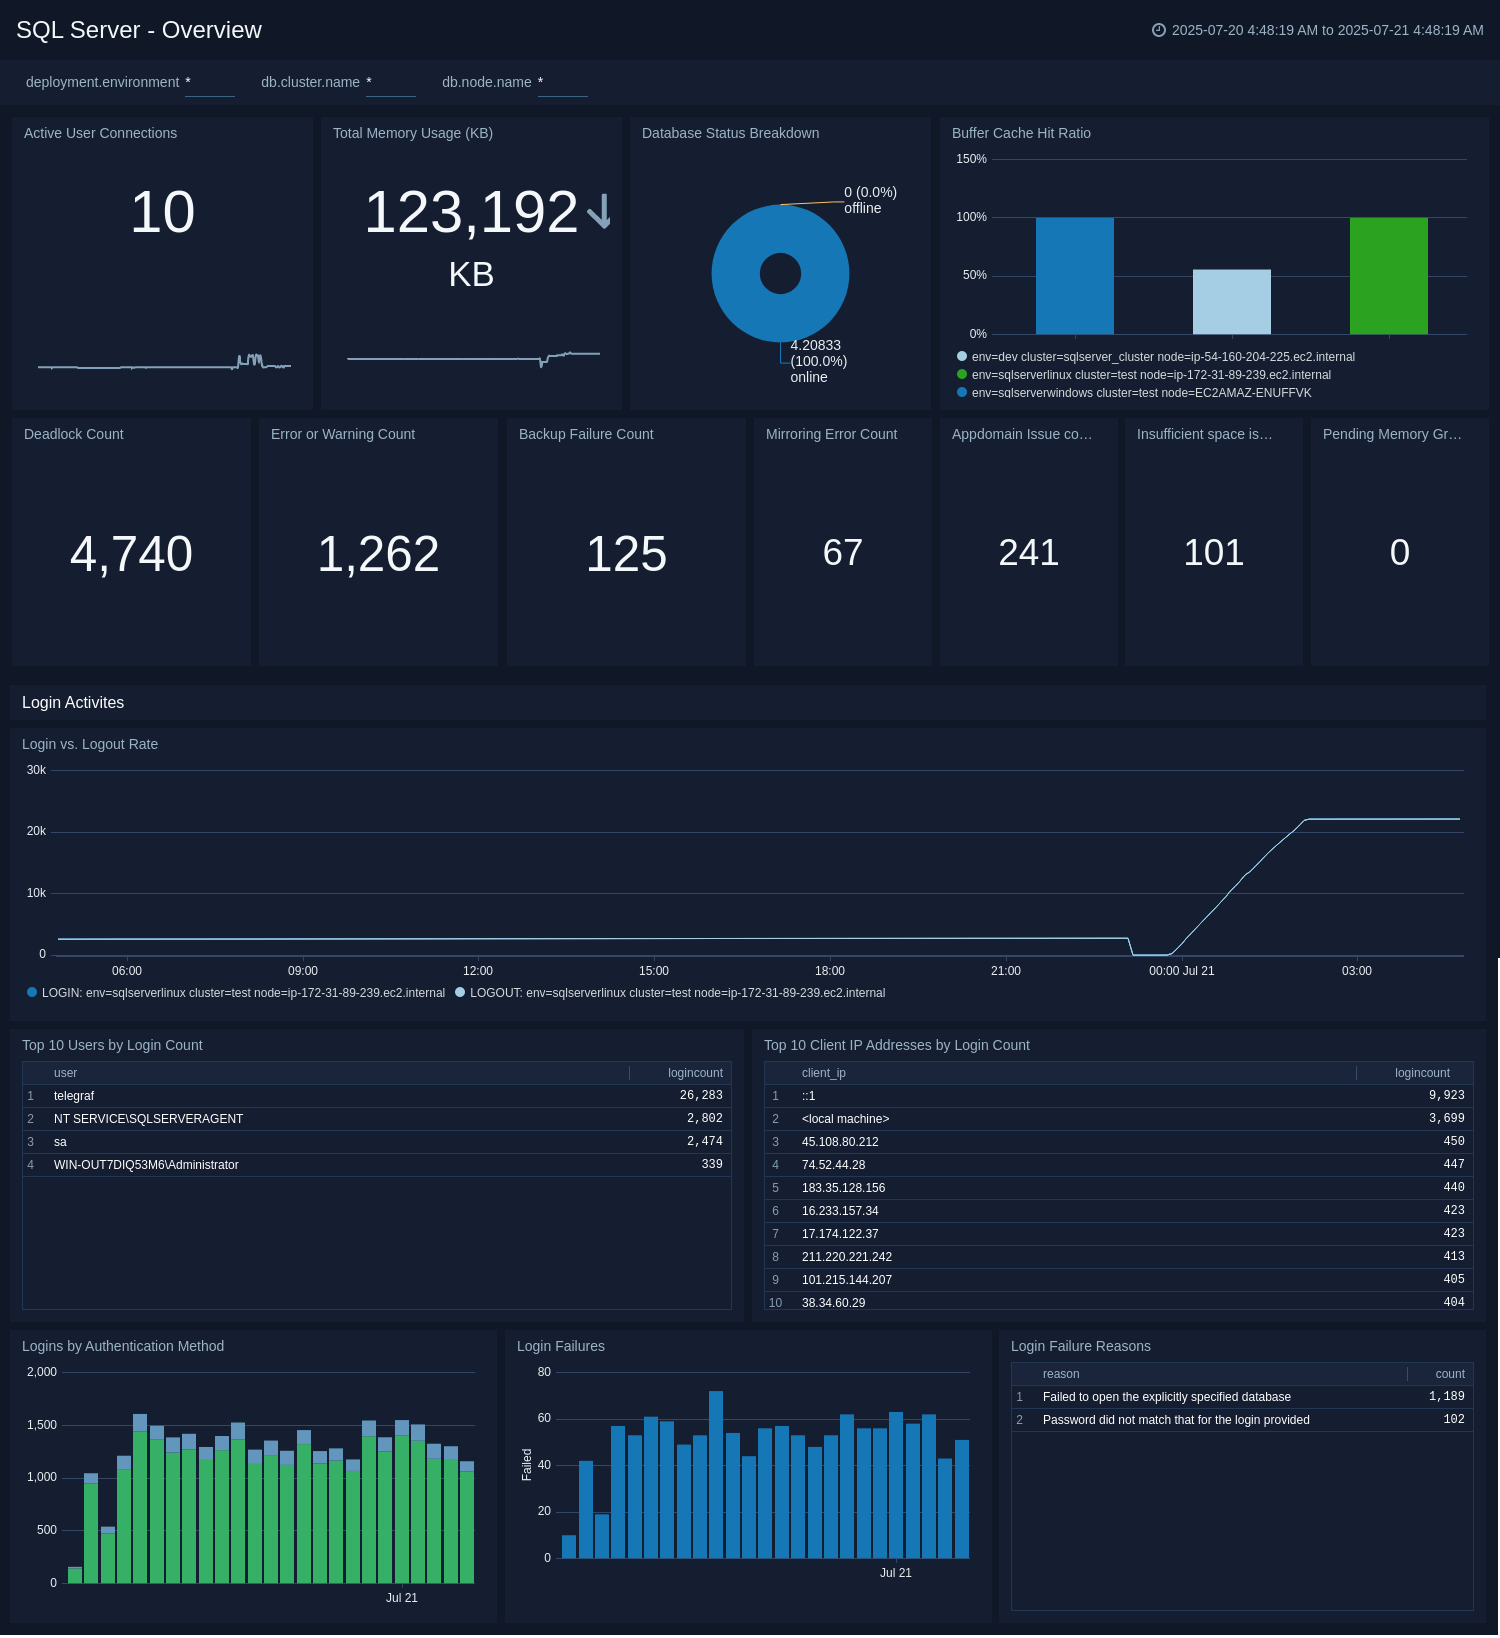
Overview
The SQL Server - Overview dashboard provides a snapshot overview of your SQL Server instance. Use this dashboard to understand CPU, Memory, and Disk utilization of your SQL Server(s) deployed in your cluster. This dashboard also provides information on login activities and methods by users.
Use this dashboard to:
- Keep track of Deadlock, Error, Backup failure, mirroring errors, and insufficient space issue counts.
- Examine Login activities, failures, and failure reasons.
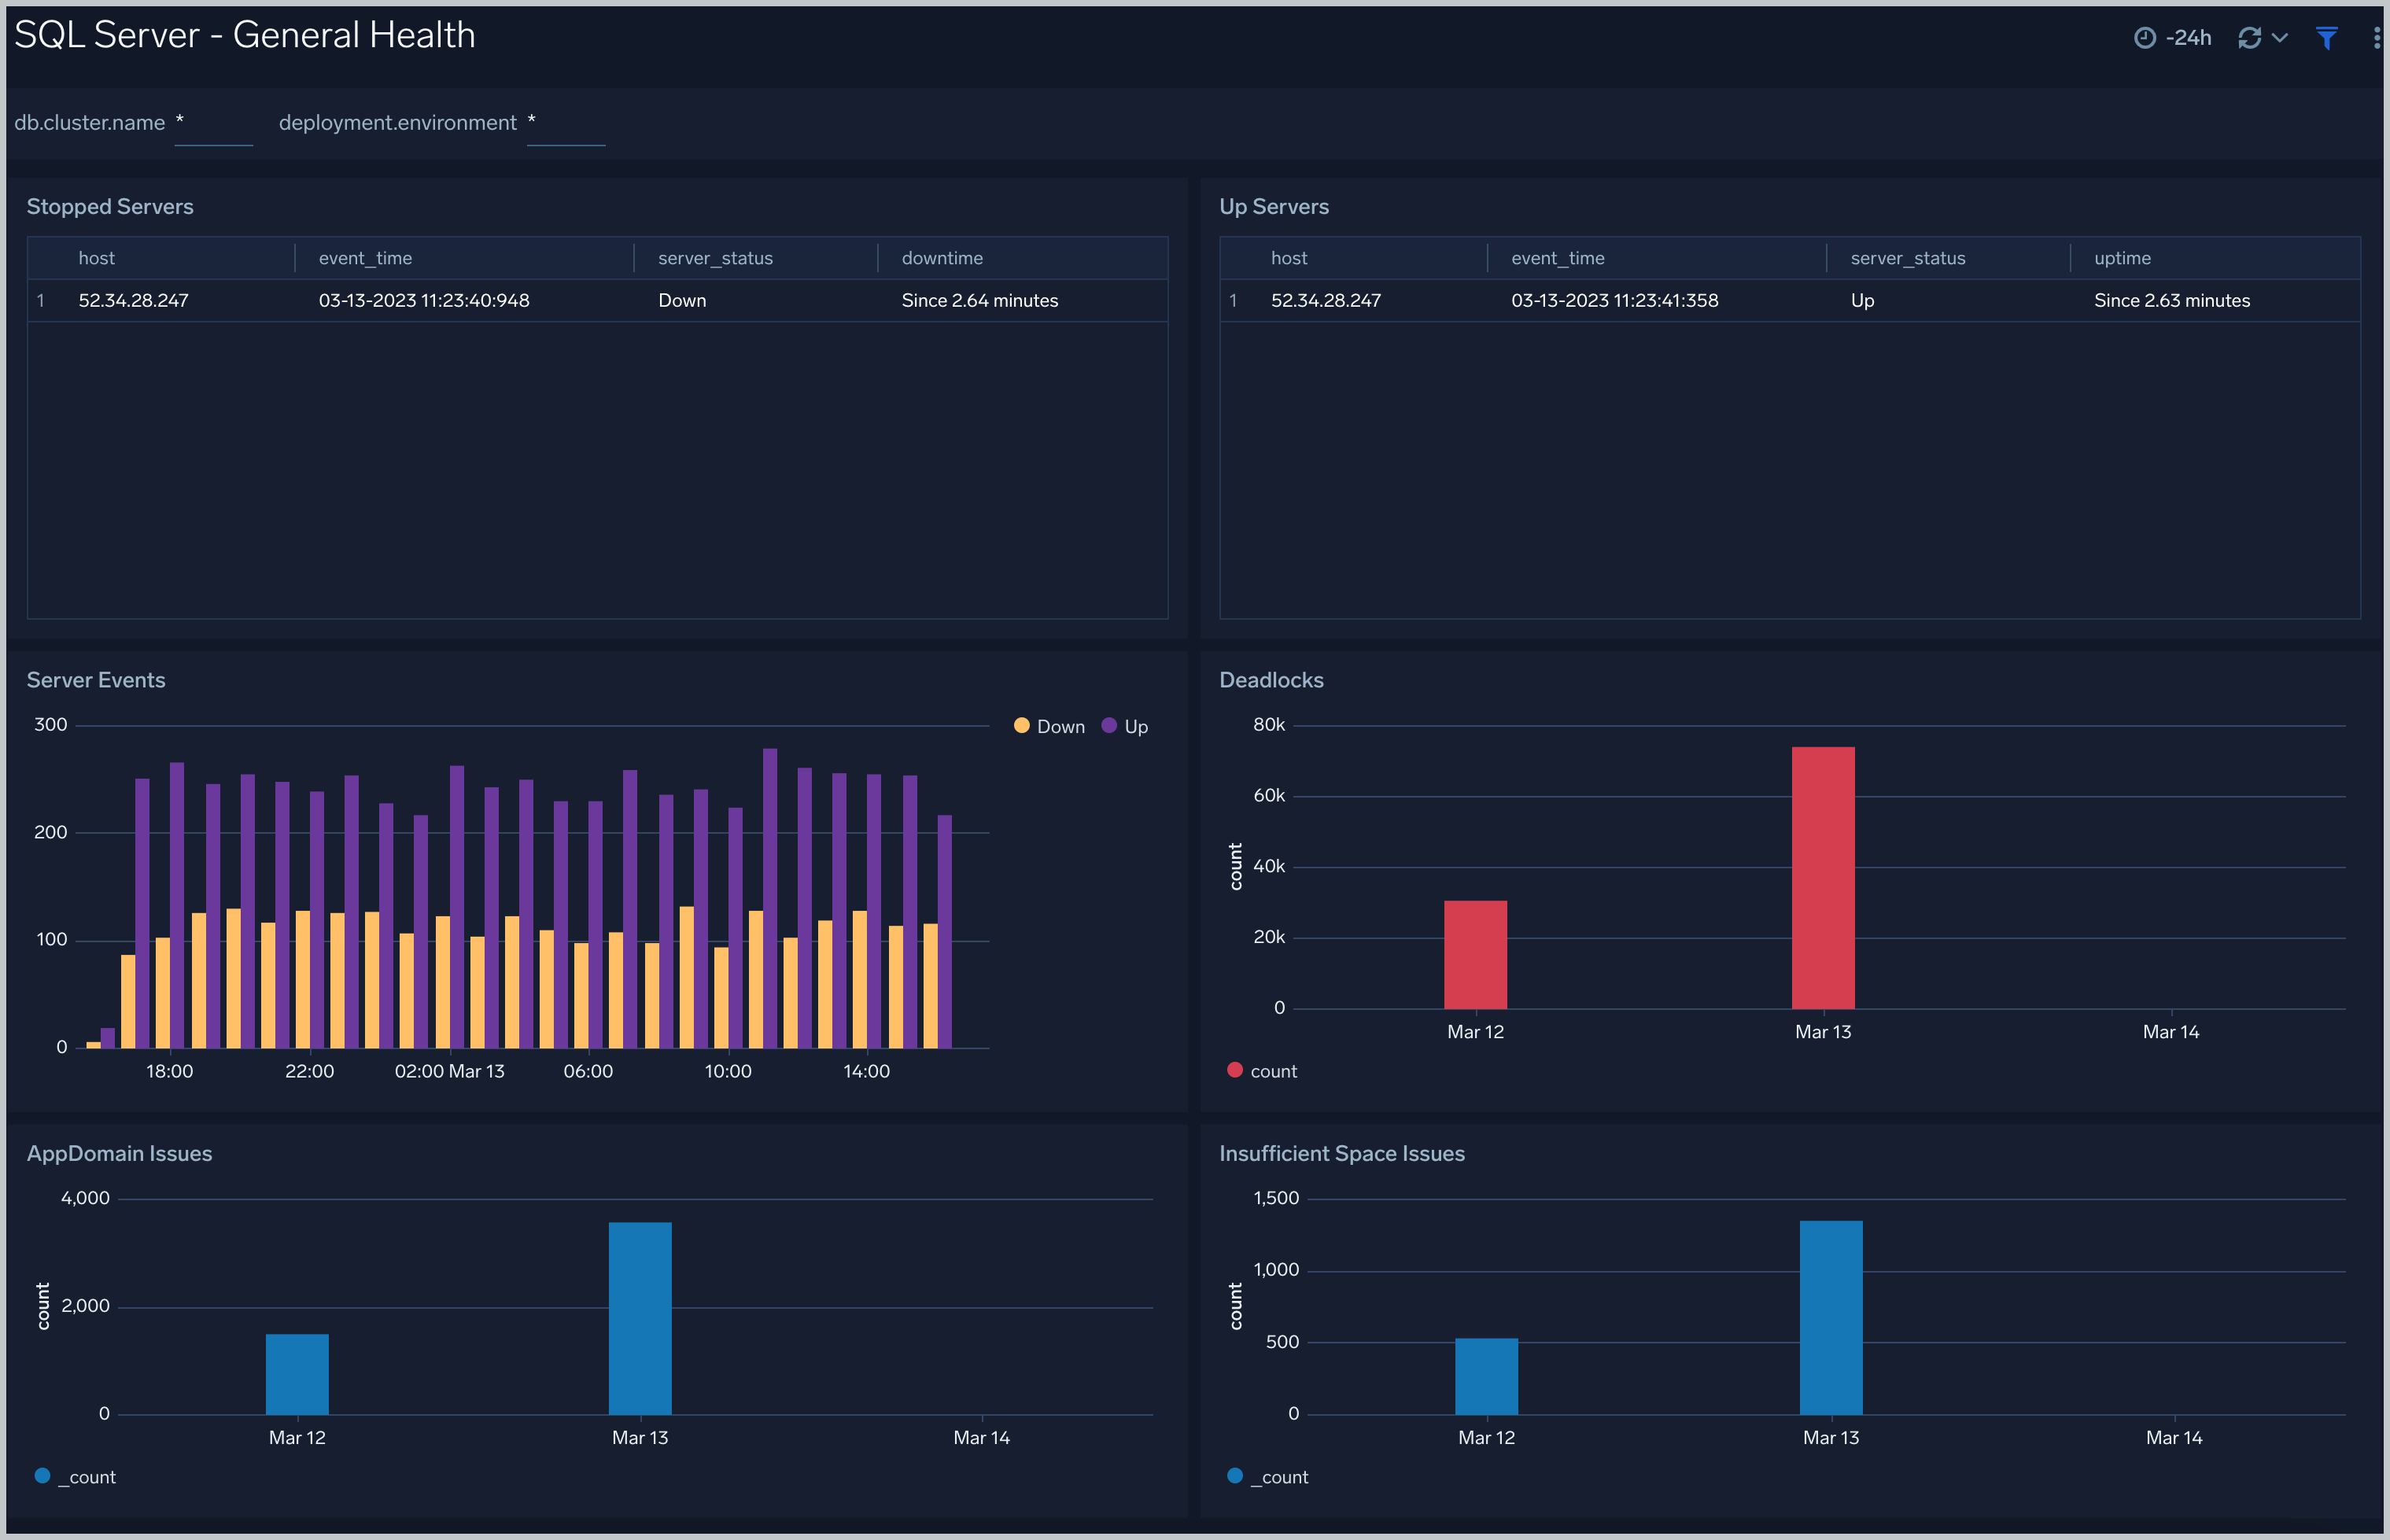
General Health
The SQL Server - General Health dashboard gives you the overall health of SQL Server. Use this dashboard to analyze server events including stopped/up servers, and corresponding down/uptime, monitor disk space percentage utilization, wait time trend, app-domain issues by SQL server.
Use this dashboard to:
- Analyze server events including stopped/up servers, and corresponding down/uptime.
- Monitor server events trends including SQL Server wait time.
- Get insight into app domain and percentage disk utilization issues by SQL Server.
Backup Restore Mirroring
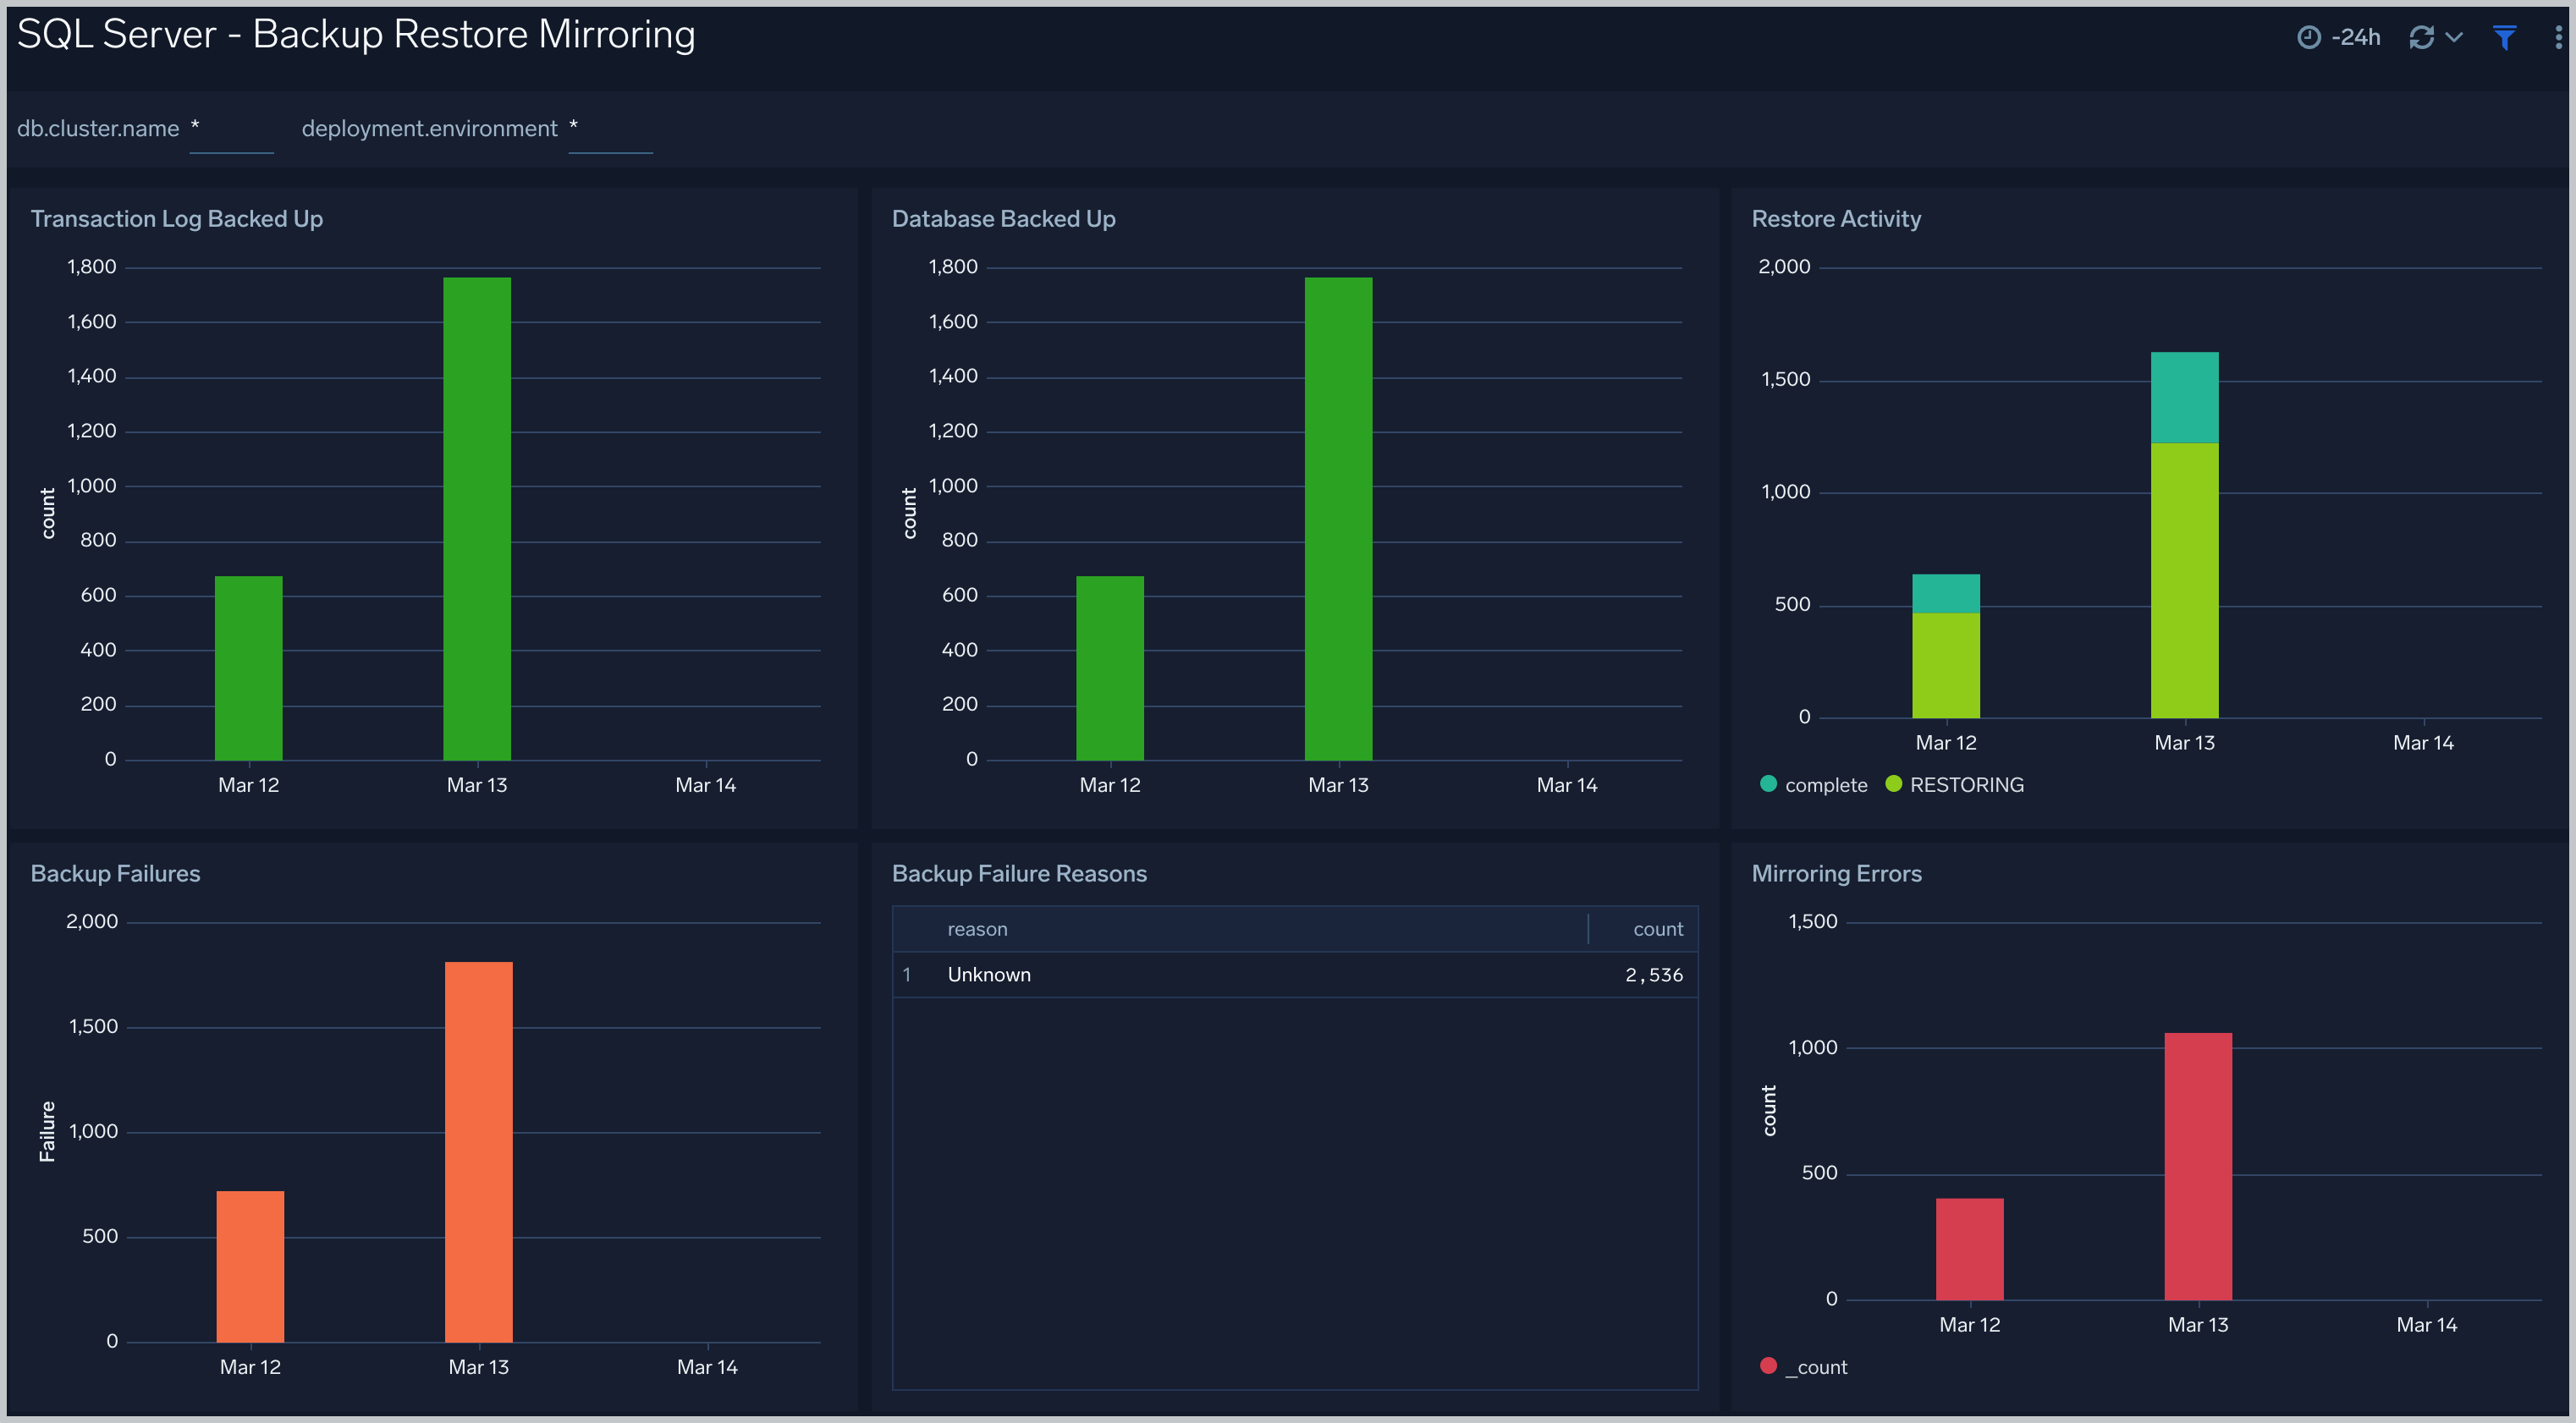
The SQL Server - Backup Restore Mirroring dashboard provides information about the Transaction log backup events, Database backup events, Restore activities, Backup failures and reasons, and Mirroring errors.
Operations
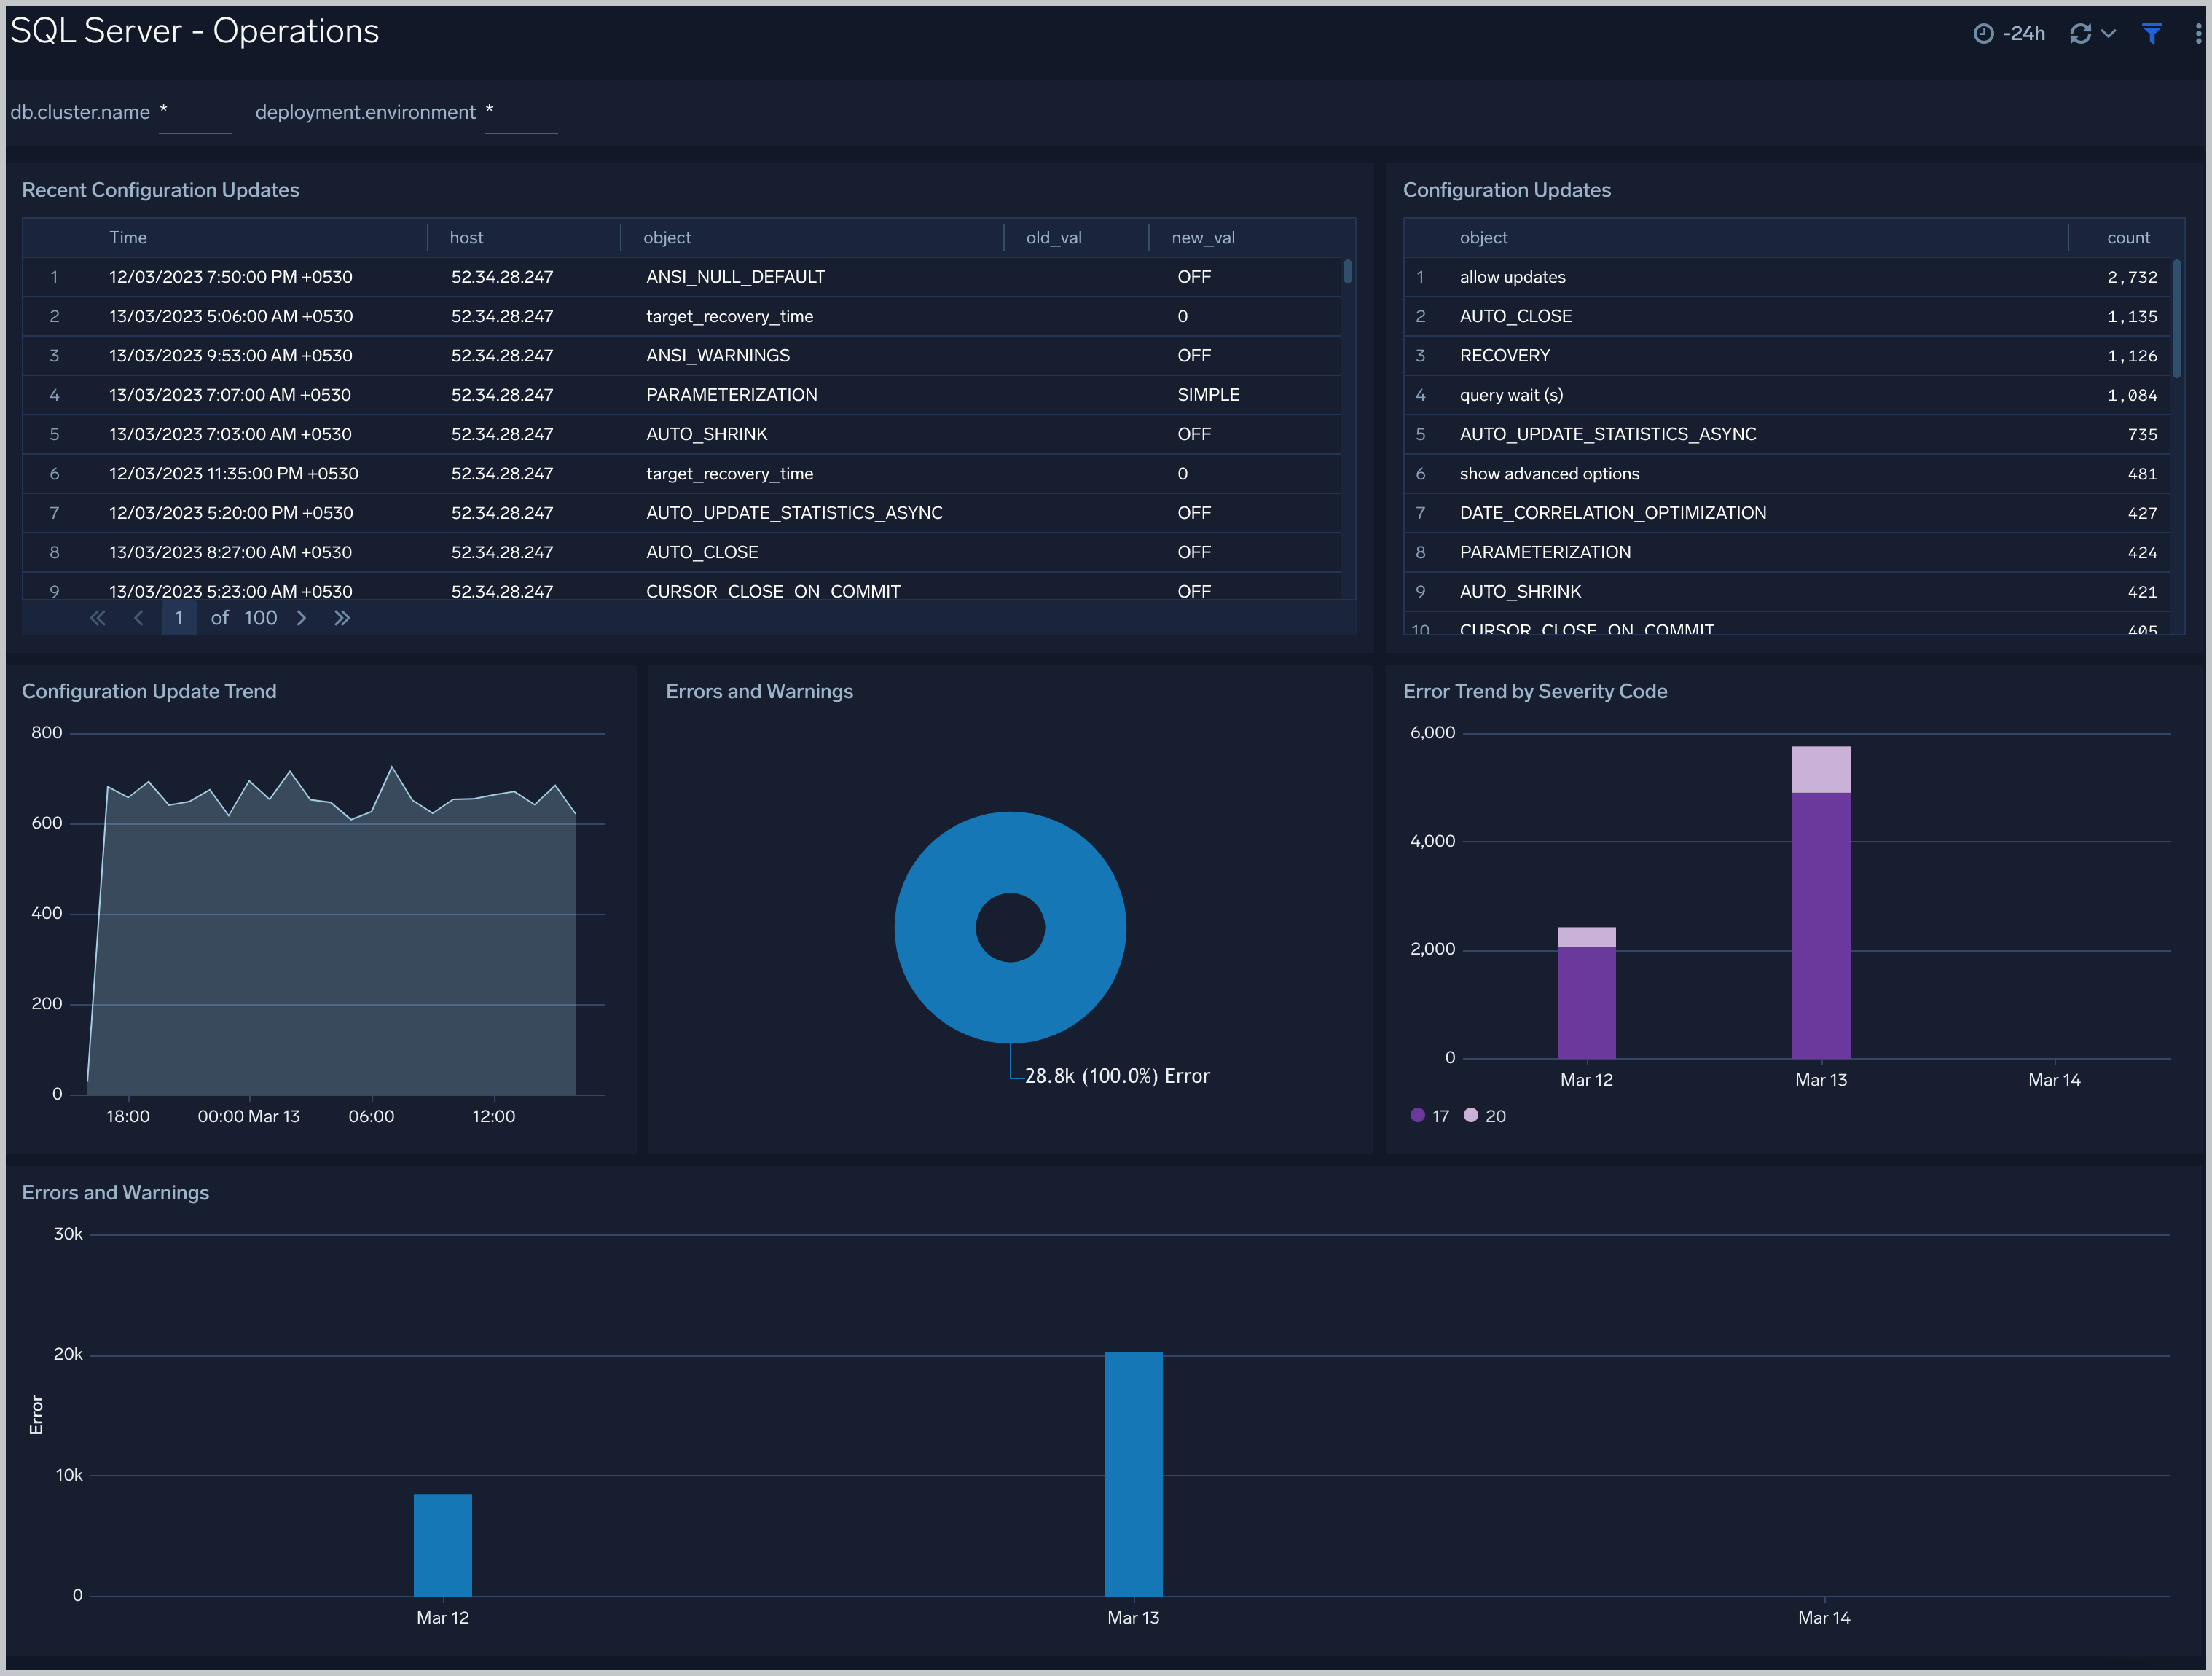
The SQL Server - Operations displays recent server configuration changes, number and type of configuration updates, error and warnings, high severity error, and warning trends.
Use this dashboard to:
- Get insights into configuration changes and updates to SQL Server instances.
- Monitor any errors and warnings.
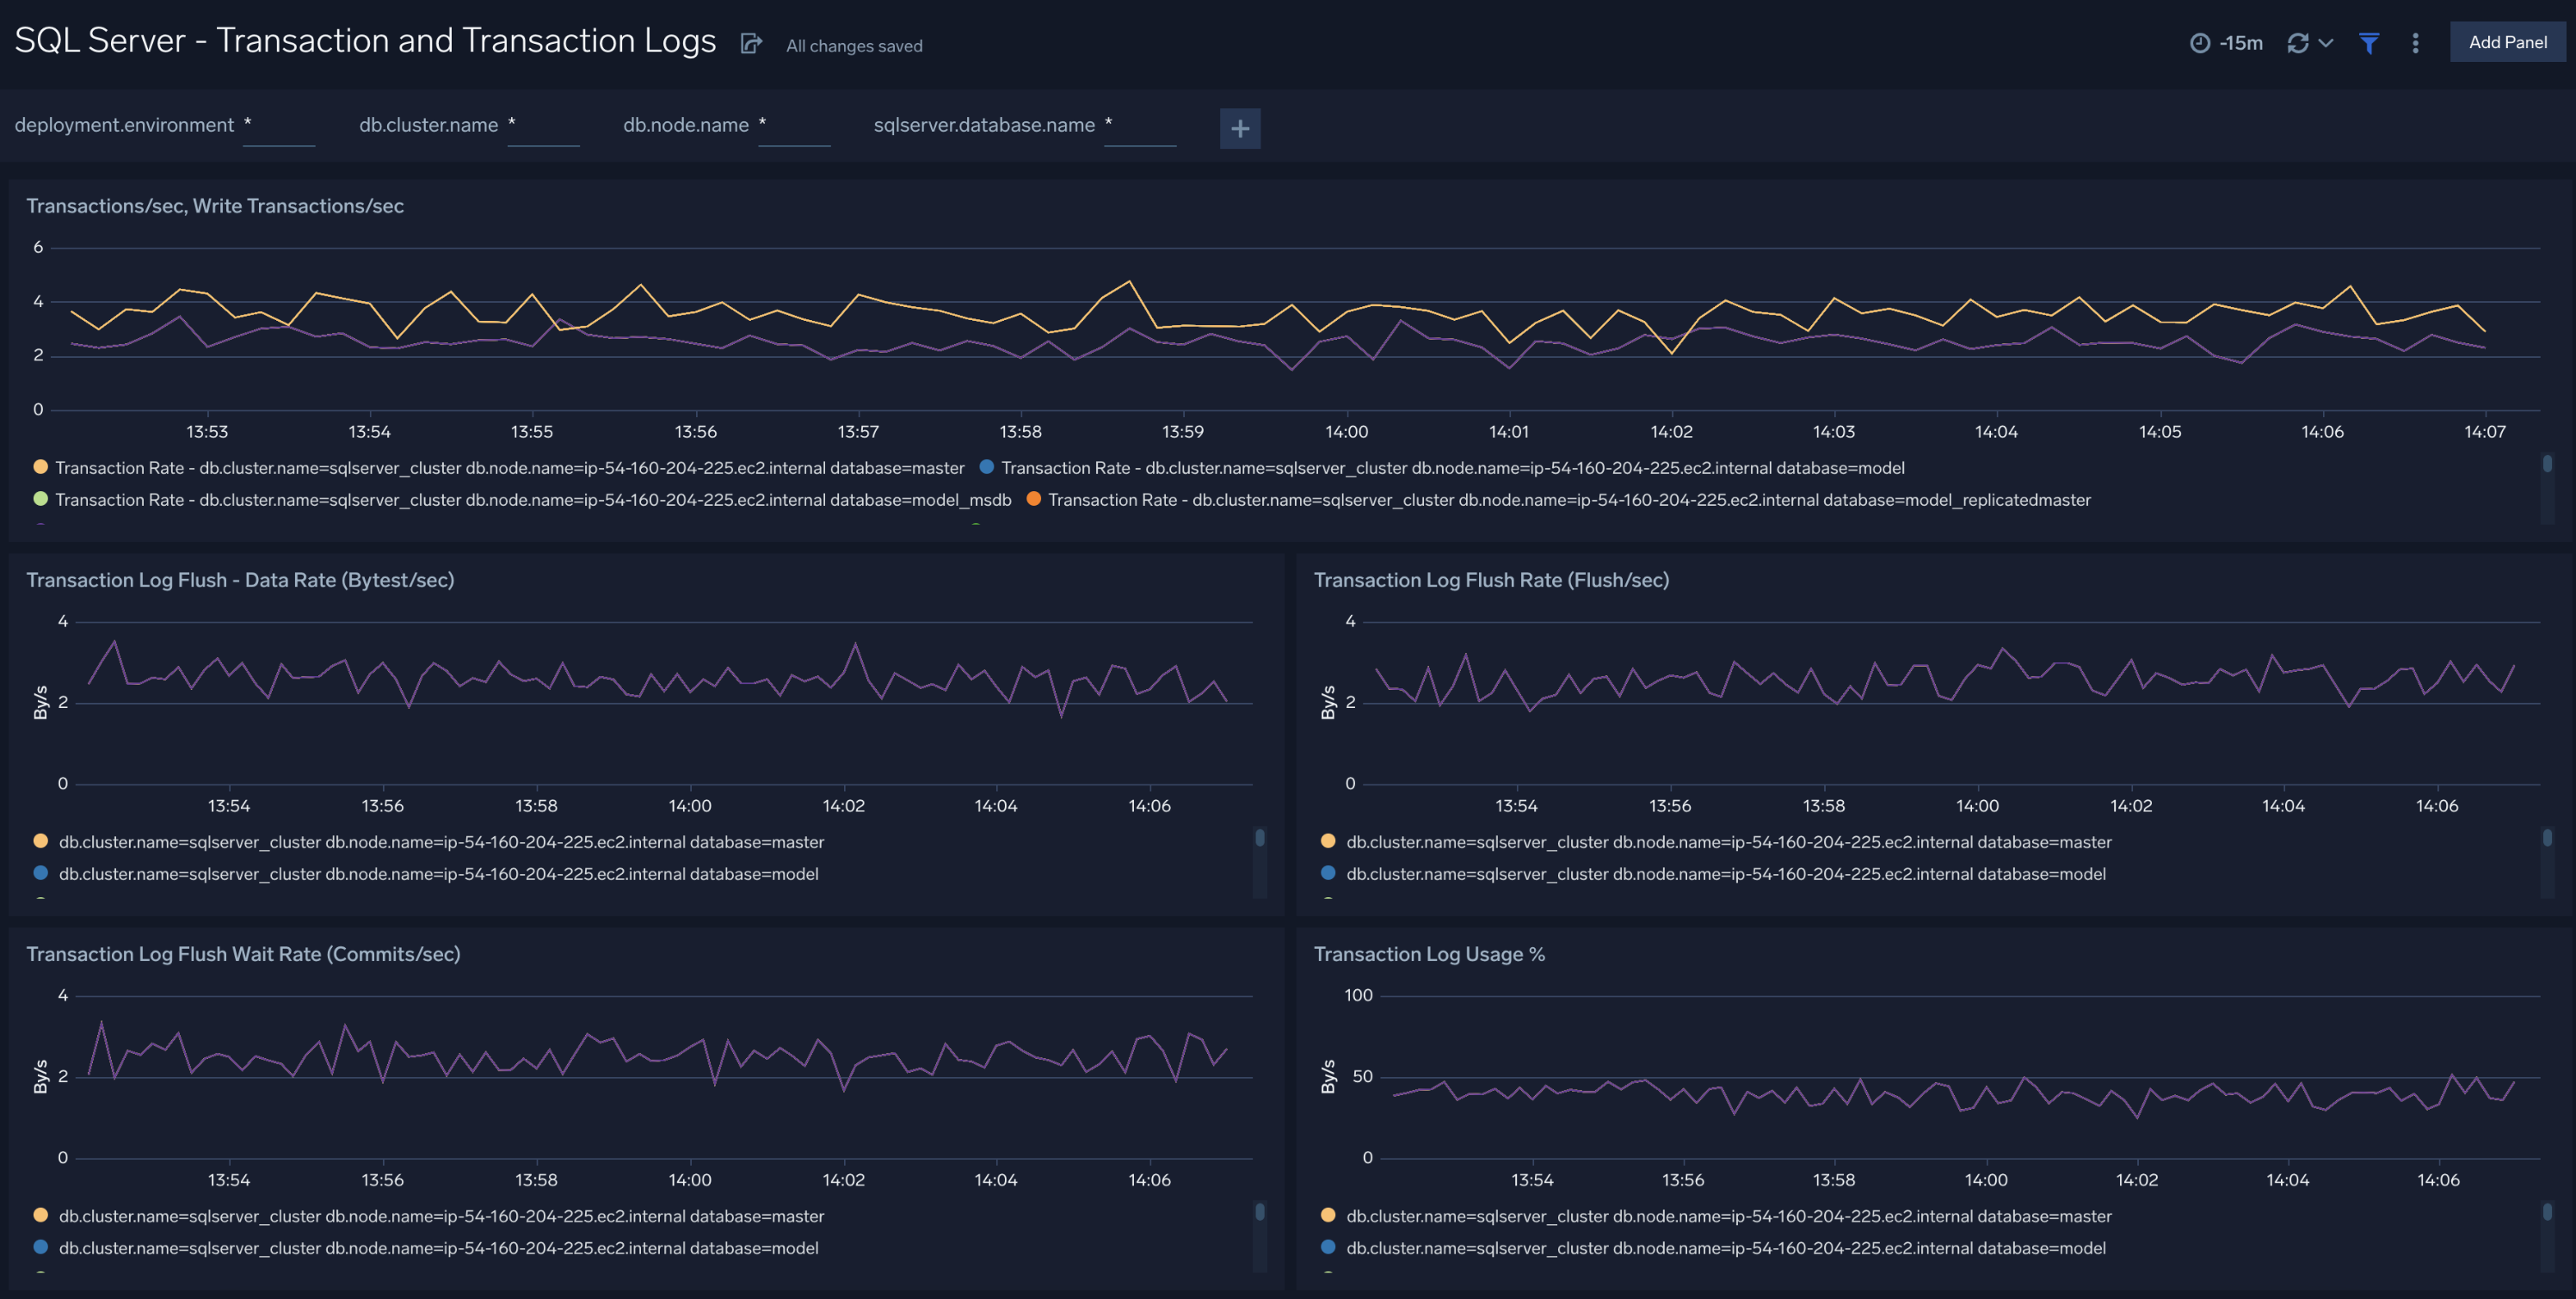
Transaction and Transaction Logs
The SQL Server - Transaction and Transaction Logs dashboard shows performance counters related metric for Transaction and Transaction Logs.
Use this dashboard to:
- Get info with respect to time for Transaction and write Transaction per sec.
- Insight into Transaction log related metrics like flush rate, flush data rate, and flush wait rate along with Transaction log % usage.
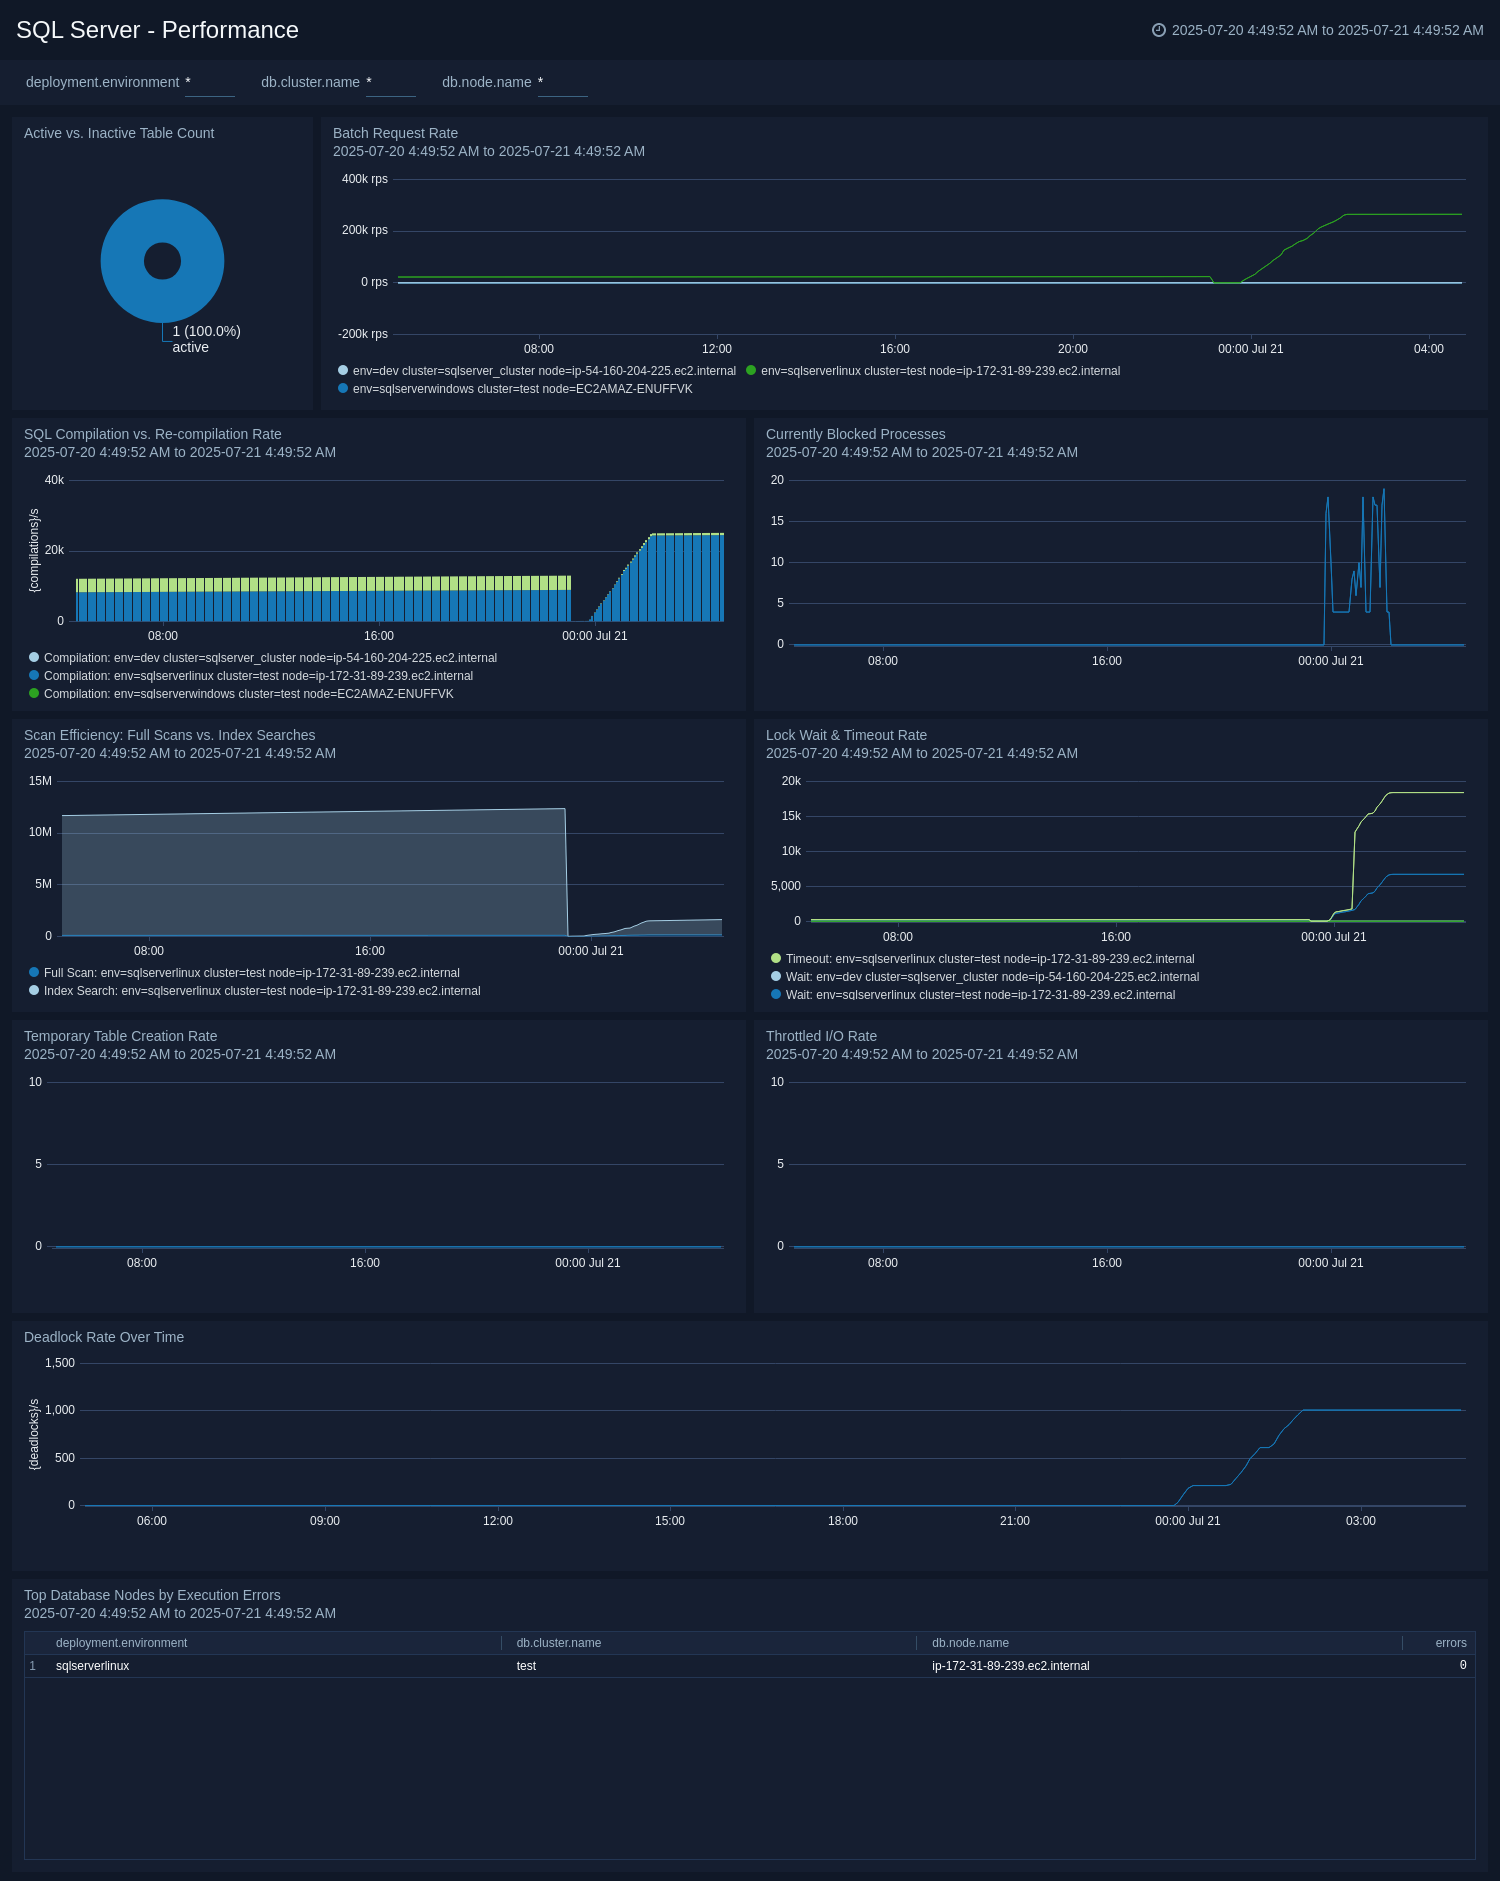
Performance
The SQL Server - Performance dashboard provides a deep dive into the internal workings of the SQL Server query engine. It helps DBAs and developers identify inefficient queries, contention issues, and opportunities for optimization.
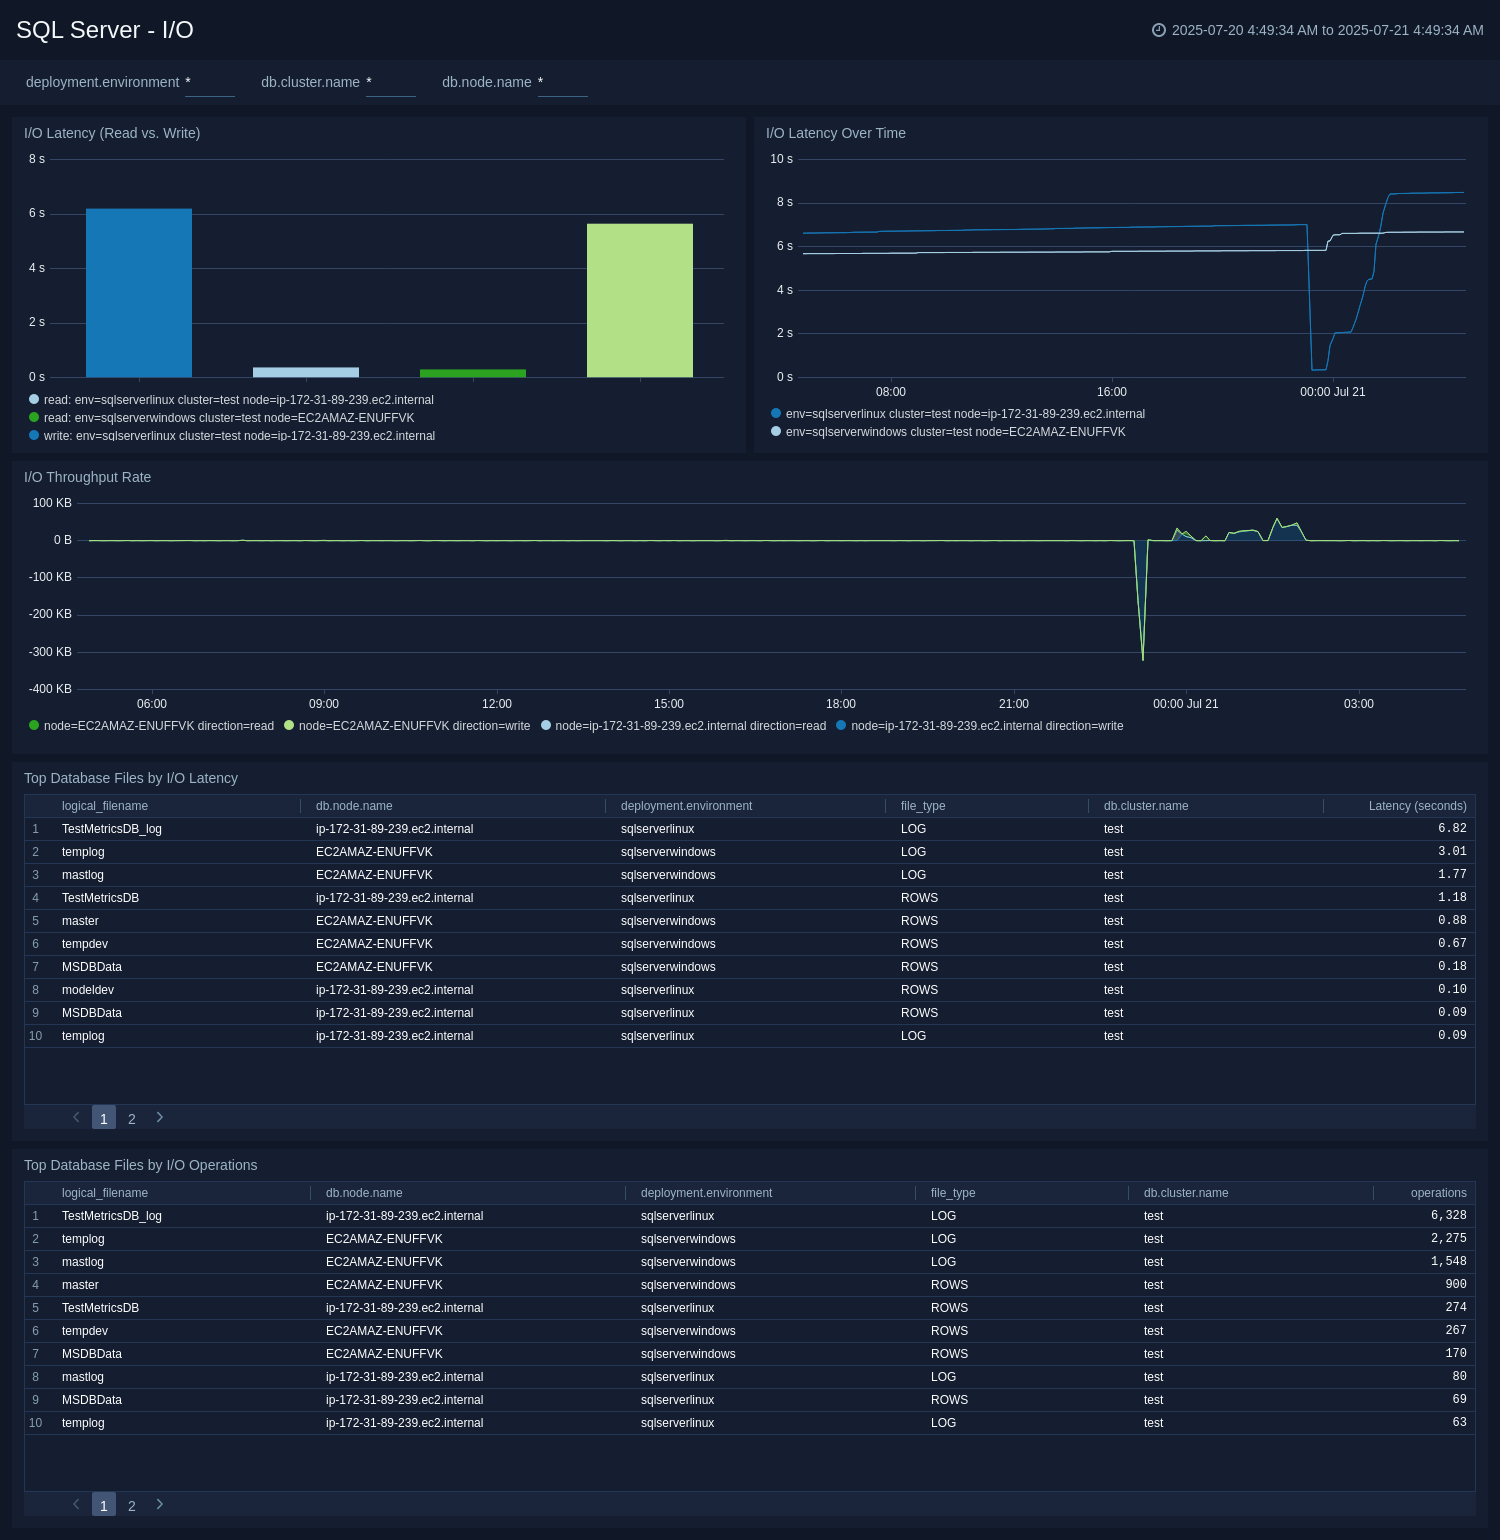
I/O
The SQL Server - I/O dashboard shows the performance of the underlying disk subsystem as it relates to SQL Server database files. It helps answer questions like, "Is slow disk performance the cause of my application slowdown?" and "Which specific files are the hottest or slowest?"
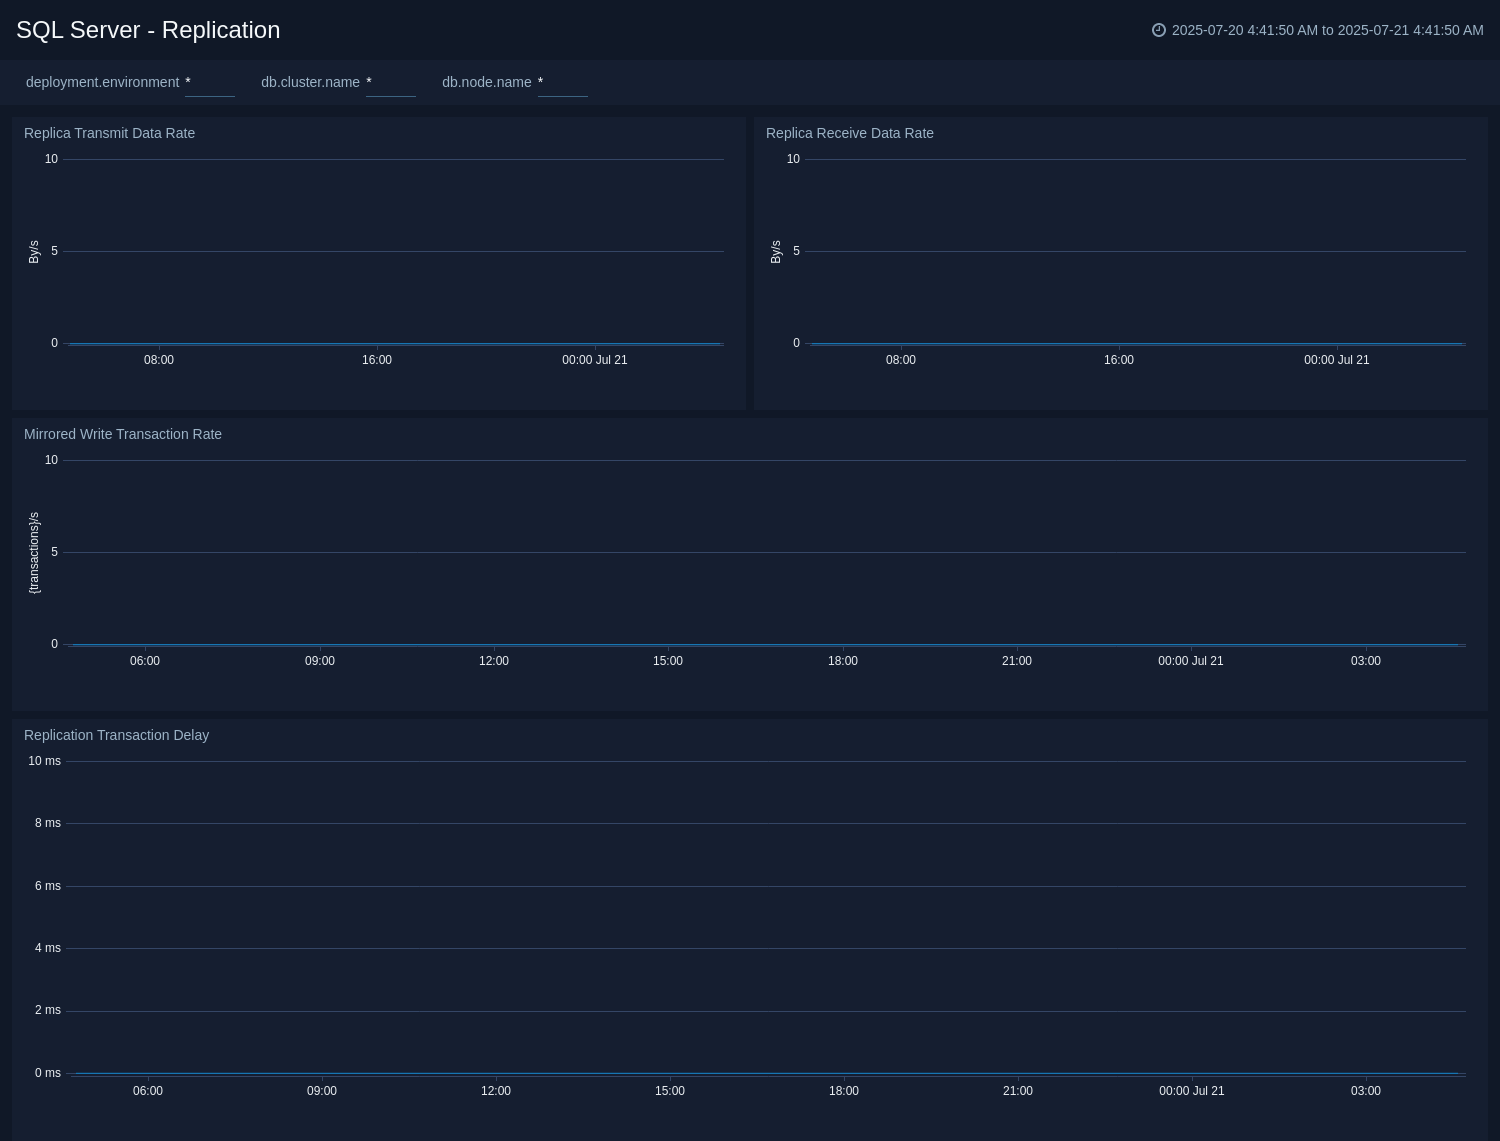
Replication
The SQL Server - Replication dashboard provide dedicated visibility into the health, throughput, and latency of SQL Server's high-availability and disaster recovery (HA/DR) features, such as Availability Groups.
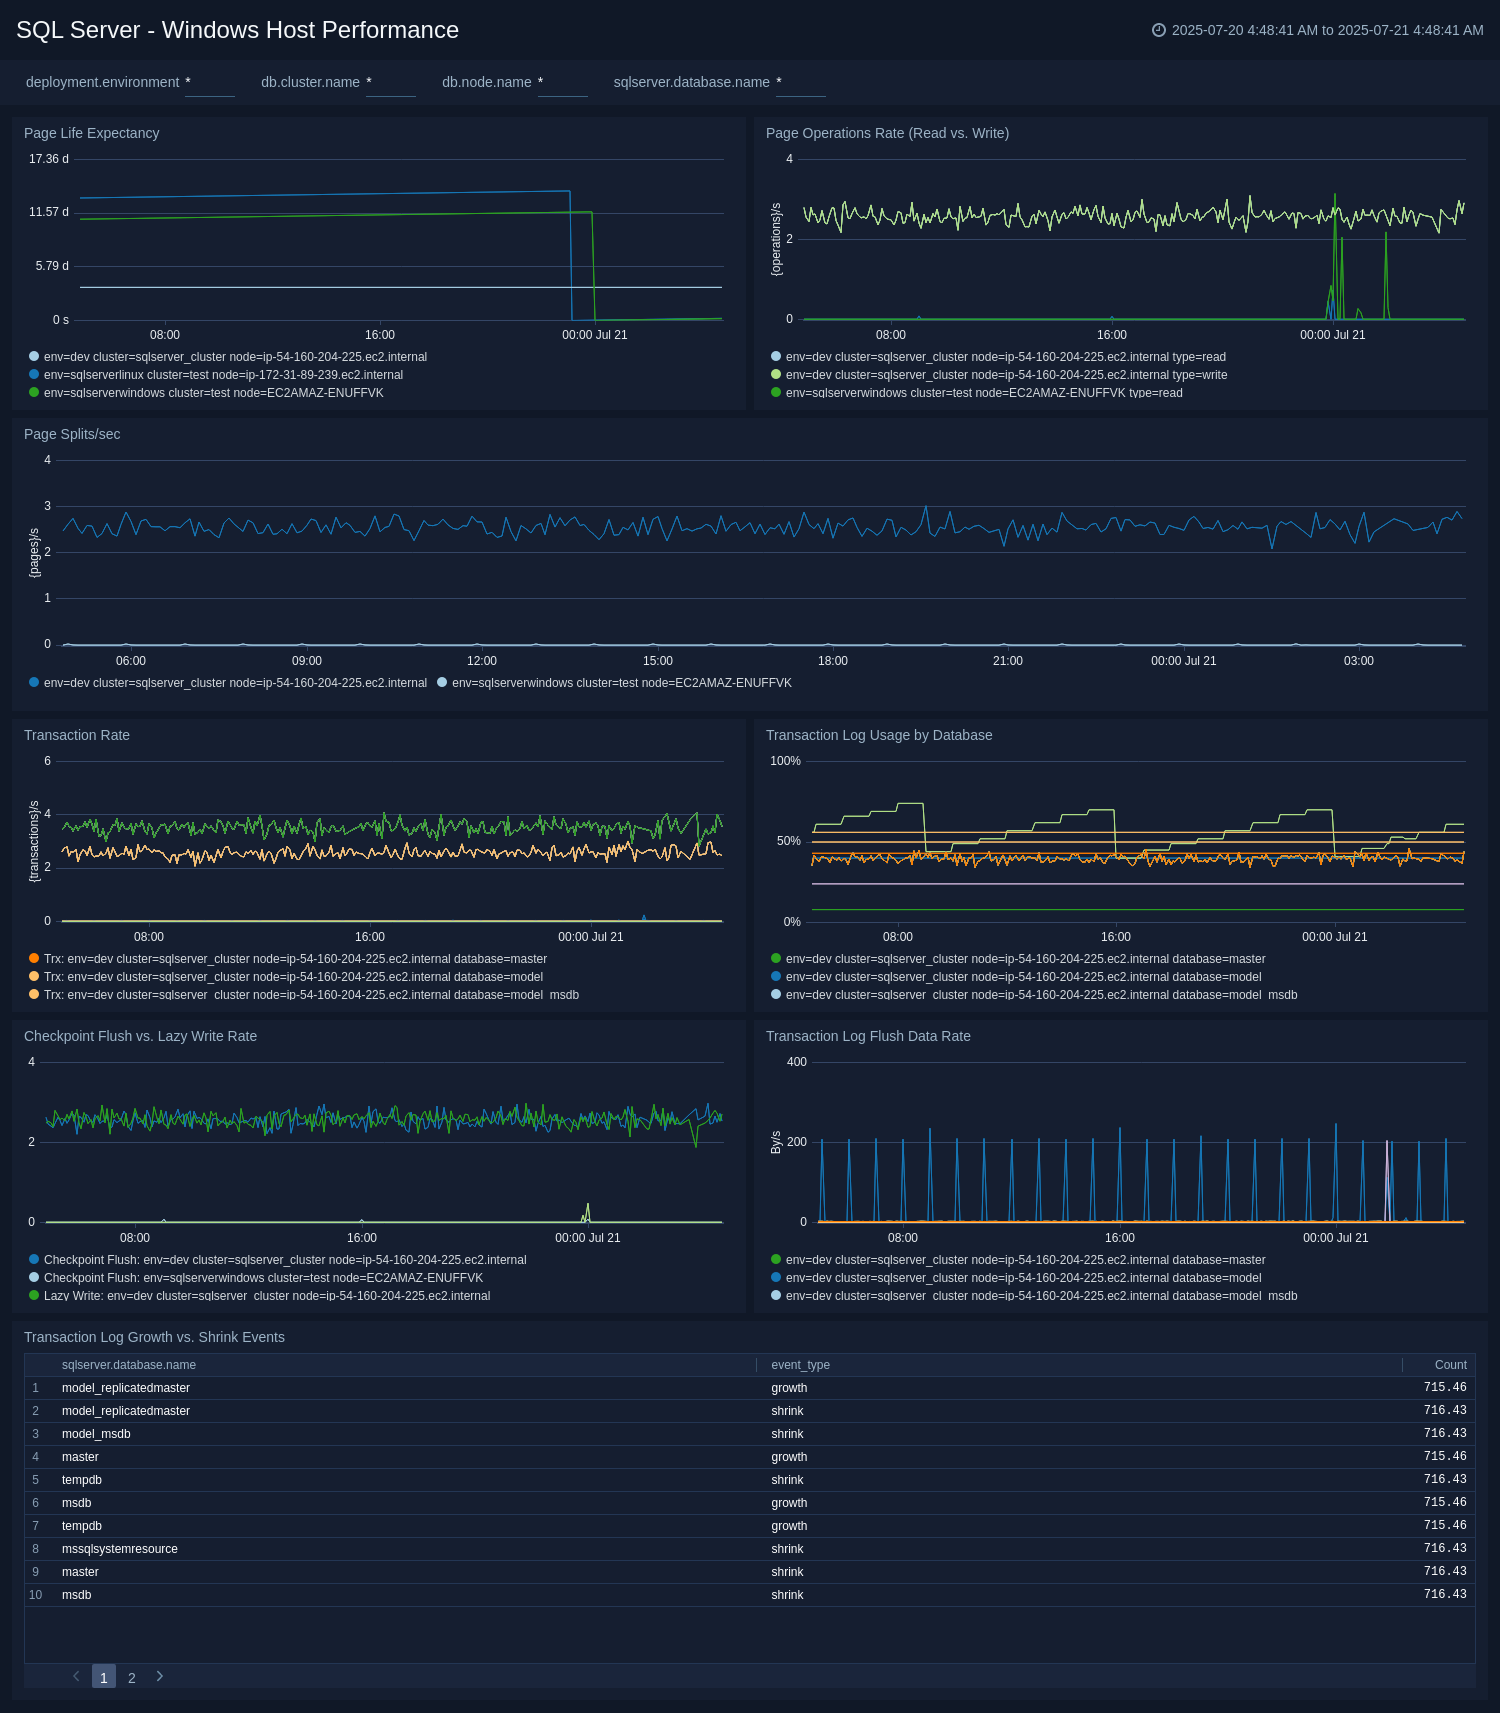
Windows Host Performance
The SQL Server - Windows Host Performance dashboard isolates metrics that are only available via Windows Performance Counters. It provides deeper insights into Windows-specific memory management and transaction log behavior. The key use case is to provide continuity for Windows DBAs familiar with these classic counters.
Create monitors for Microsoft SQL Server app
From your App Catalog:
- From the Sumo Logic navigation, select App Catalog.
- In the Search Apps field, search for and then select your app.
- Make sure the app is installed.
- Navigate to What's Included tab and scroll down to the Monitors section.
- Click Create next to the pre-configured monitors. In the create monitors window, adjust the trigger conditions and notifications settings based on your requirements.
- Scroll down to Monitor Details.
- Under Location click on New Folder.
note
By default, monitor will be saved in the root folder. So to make the maintenance easier, create a new folder in the location of your choice.
- Enter Folder Name. Folder Description is optional.
tip
Using app version in the folder name will be helpful to determine the versioning for future updates.
- Click Create. Once the folder is created, click on Save.
Microsoft SQL Server alerts
| Name | Description | Alert Condition | Recover Condition |
|---|---|---|---|
SQL Server - AppDomain | This alert is triggered when we detect AppDomain related issues in your SQL Server instance. | Count > = 1 | Count < 1 |
SQL Server - Backup Fail | This alert is triggered when we detect that the SQL Server backup failed. | Count > = 1 | Count < 1 |
SQL Server - Buffer Cache Hit Ratio | This alert is triggered when the Buffer Cache Hit Ratio drops below 95%, indicating significant memory pressure and a potential for slow performance due to increased disk reads. | Count < 95 | Count > = 95 |
SQL Server - Deadlock | This alert is triggered when we detect deadlocks in a SQL Server instance. | Count > 5 | Count < = 5 |
SQL Server - Instance Down | This alert is triggered when we detect that the SQL Server instance is down for 5 minutes. | Count > 0 | Count < = 0 |
SQL Server - Insufficient Space | This alert is triggered when SQL Server instance could not allocate a new page for database because of insufficient disk space in filegroup. | Count > 0 | Count < = 0 |
SQL Server - Login Fail | This alert is triggered when we detect that the user cannot login to SQL Server. | Count > = 1 | Count < 1 |
SQL Server - Mirroring Error | This alert is triggered when we detect that the SQL Server mirroring has error. | Count > = 1 | Count < 1 |
SQL Server - Non Operational Database | This alert is triggered if any database enters a 'suspect' or 'offline' state, indicating it is unavailable. | Count > 0 | Count < = 0 |
SQL Server - Processes Blocked | This alert is triggered when blocked processes are detected in SQL Server. | Count > 0 | Count < = 0 |