Azure Web Apps

The Azure Web Apps app allows you to collect Azure web server and application diagnostics logs and monitor the health of your Azure Web Apps environment. This app provides preconfigured dashboards that allow you to monitor server operation, traffic requests, and response times.
For more information, see Azure Web Apps.
Log and metric types
For Azure Web Apps, you can collect the following logs and metrics:
-
Resource logs, which provide an insight into operations that were performed within an Azure resource. For a complete schema for resource logs refer to the below documentation:
-
Activity logs, provides insight into any subscription-level or management group level events that have occurred in the Azure. To learn more, refer to Azure documentation.
- Metrics are available in Microsoft.Web/sites namespace. For more information on supported metrics, refer to Azure documentation.
Sample log messages
2017-09-25 23:27:36 eShopCart GET / X-ARR-LOG-ID=9b3056e8-21d5-43f7-8fd7-4aec6b29525e
80 - 60.4.192.44 Mozilla/5.0+(Macintosh+NT+6.3;+WOW64)+AppleWebKit/537.36+(KHTML,
+like+Gecko)+Chrome/60.4.192.44+Safari/537.36 PHPSESSID=tv2iv6tn8c9su542l464ibaro5;
+ARRAffinity=d6c6606b1a249bd37139b09d6c2cb4dd61f6b5cd607f934012aca86bd59515444 -
eShopCart.azurewebsites.net 200 0 0 3098 1008 1000
Sample queries
_sourceCategory=Azure/Web-app
| parse regex "\d+-\d+-\d+ \d+:\d+:\d+ (?<s_sitename>\S+) (?<cs_method>\S+) (?<cs_uri_stem>\S+) (?<cs_uri_query>\S+) (?<src_port>\S+) (?<src_user>\S+) (?<client_ip>\S+) (?<cs_user_agent>\S+) (?<cs_cookie>\S+) (?<cs_referrer>\S+) (?<cs_host>\S+) (?<sc_status>\S+) (?<sc_substatus>\S+) (?<sc_win32_status>\S+) (?<sc_bytes>\S+) (?<cs_bytes>\S+) (?<time_taken>\S+)"
| timeslice 5m
| count by _timeslice
| outlier _count
Setup
Azure service sends monitoring data to Azure Monitor, which can then stream data to Eventhub. Sumo Logic supports:
- Logs collection from Azure Monitor using our Azure Event Hubs source.
- Activity Logs collection from Azure Monitor using our Azure Event Hubs source. It is recommended to create a separate source for activity logs. If you are already collecting these logs, you can skip this step.
- Metrics collection using our Azure Metrics Source.
You must explicitly enable diagnostic settings for each web app that you want to monitor. You can forward logs to the same event hub provided they satisfy the limitations and permissions as described here.
When you configure the event hubs source or HTTP source, plan your source category to ease the querying process. A hierarchical approach allows you to make use of wildcards. For example: Azure/WebApps/Logs, Azure/WebApps/Metrics.
Configure collector
Create a hosted collector if not already configured and tag the tenant_name field. You can get the tenant name using the instructions here. Make sure you create the required sources in this collector. 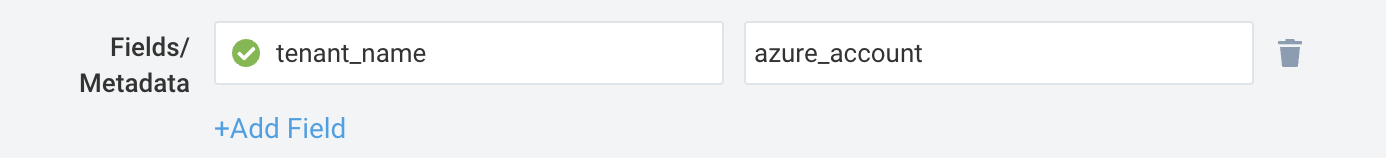
Configure metrics collection
To set up the Azure Metrics source in Sumo Logic, refer to Azure Metrics Source.
Configure logs collection
Diagnostic logs
In this section, you will configure a pipeline for shipping diagnostic logs from Azure Monitor to an Event Hub.
- To set up the Azure Event Hubs source in Sumo Logic, refer to the Azure Event Hubs Source for Logs.
- To create the Diagnostic setting in the Azure portal, refer to the Azure documentation. Perform the below steps for each Azure WebApps that you want to monitor.
- Choose
Stream to an event hubas the destination. - Select
HTTP logs,App Service Console Logs,App Service Application Logs,Access Audit Logs,IPSecurity Audit logs,App Service Platform logs,Report Antivirus Audit Logs,Site Content Change Audit Logs. - Use the Event Hub namespace and Event Hub name configured in previous step in destination details section. You can use the default policy
RootManageSharedAccessKeyas the policy name.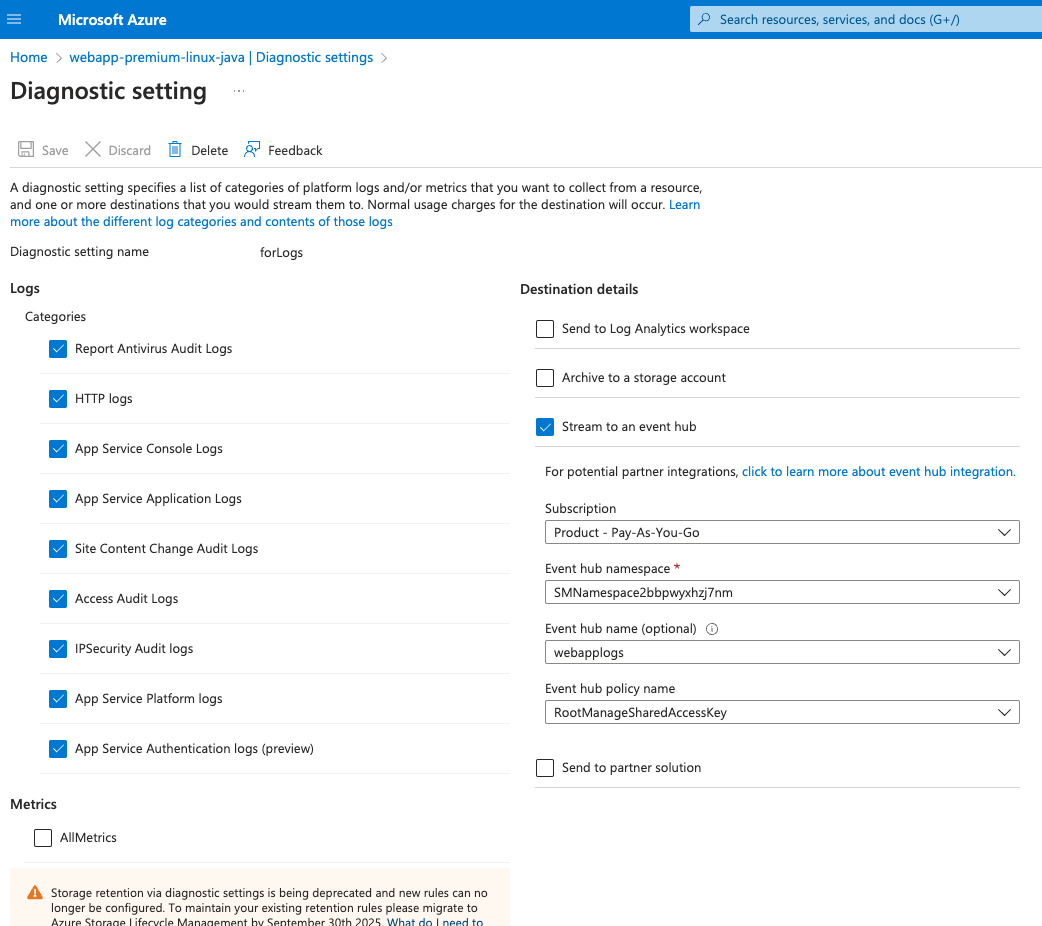
- Choose
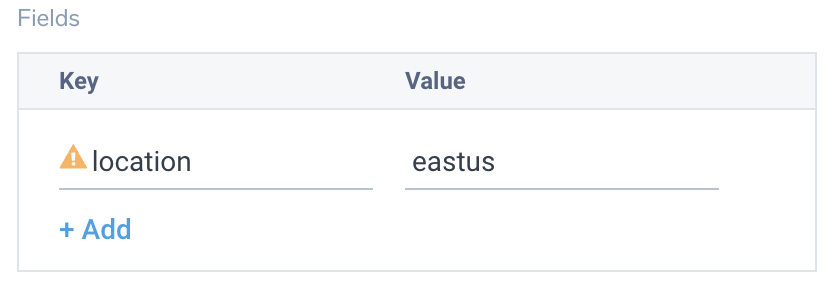
- Tag the location field in the source with right location value.
Activity logs (optional)
To collect activity logs, follow the instructions here. If you are already collecting activity logs for a subscription, you can skip this step.
Since this source includes logs from multiple regions, do not tag it with the location tag.
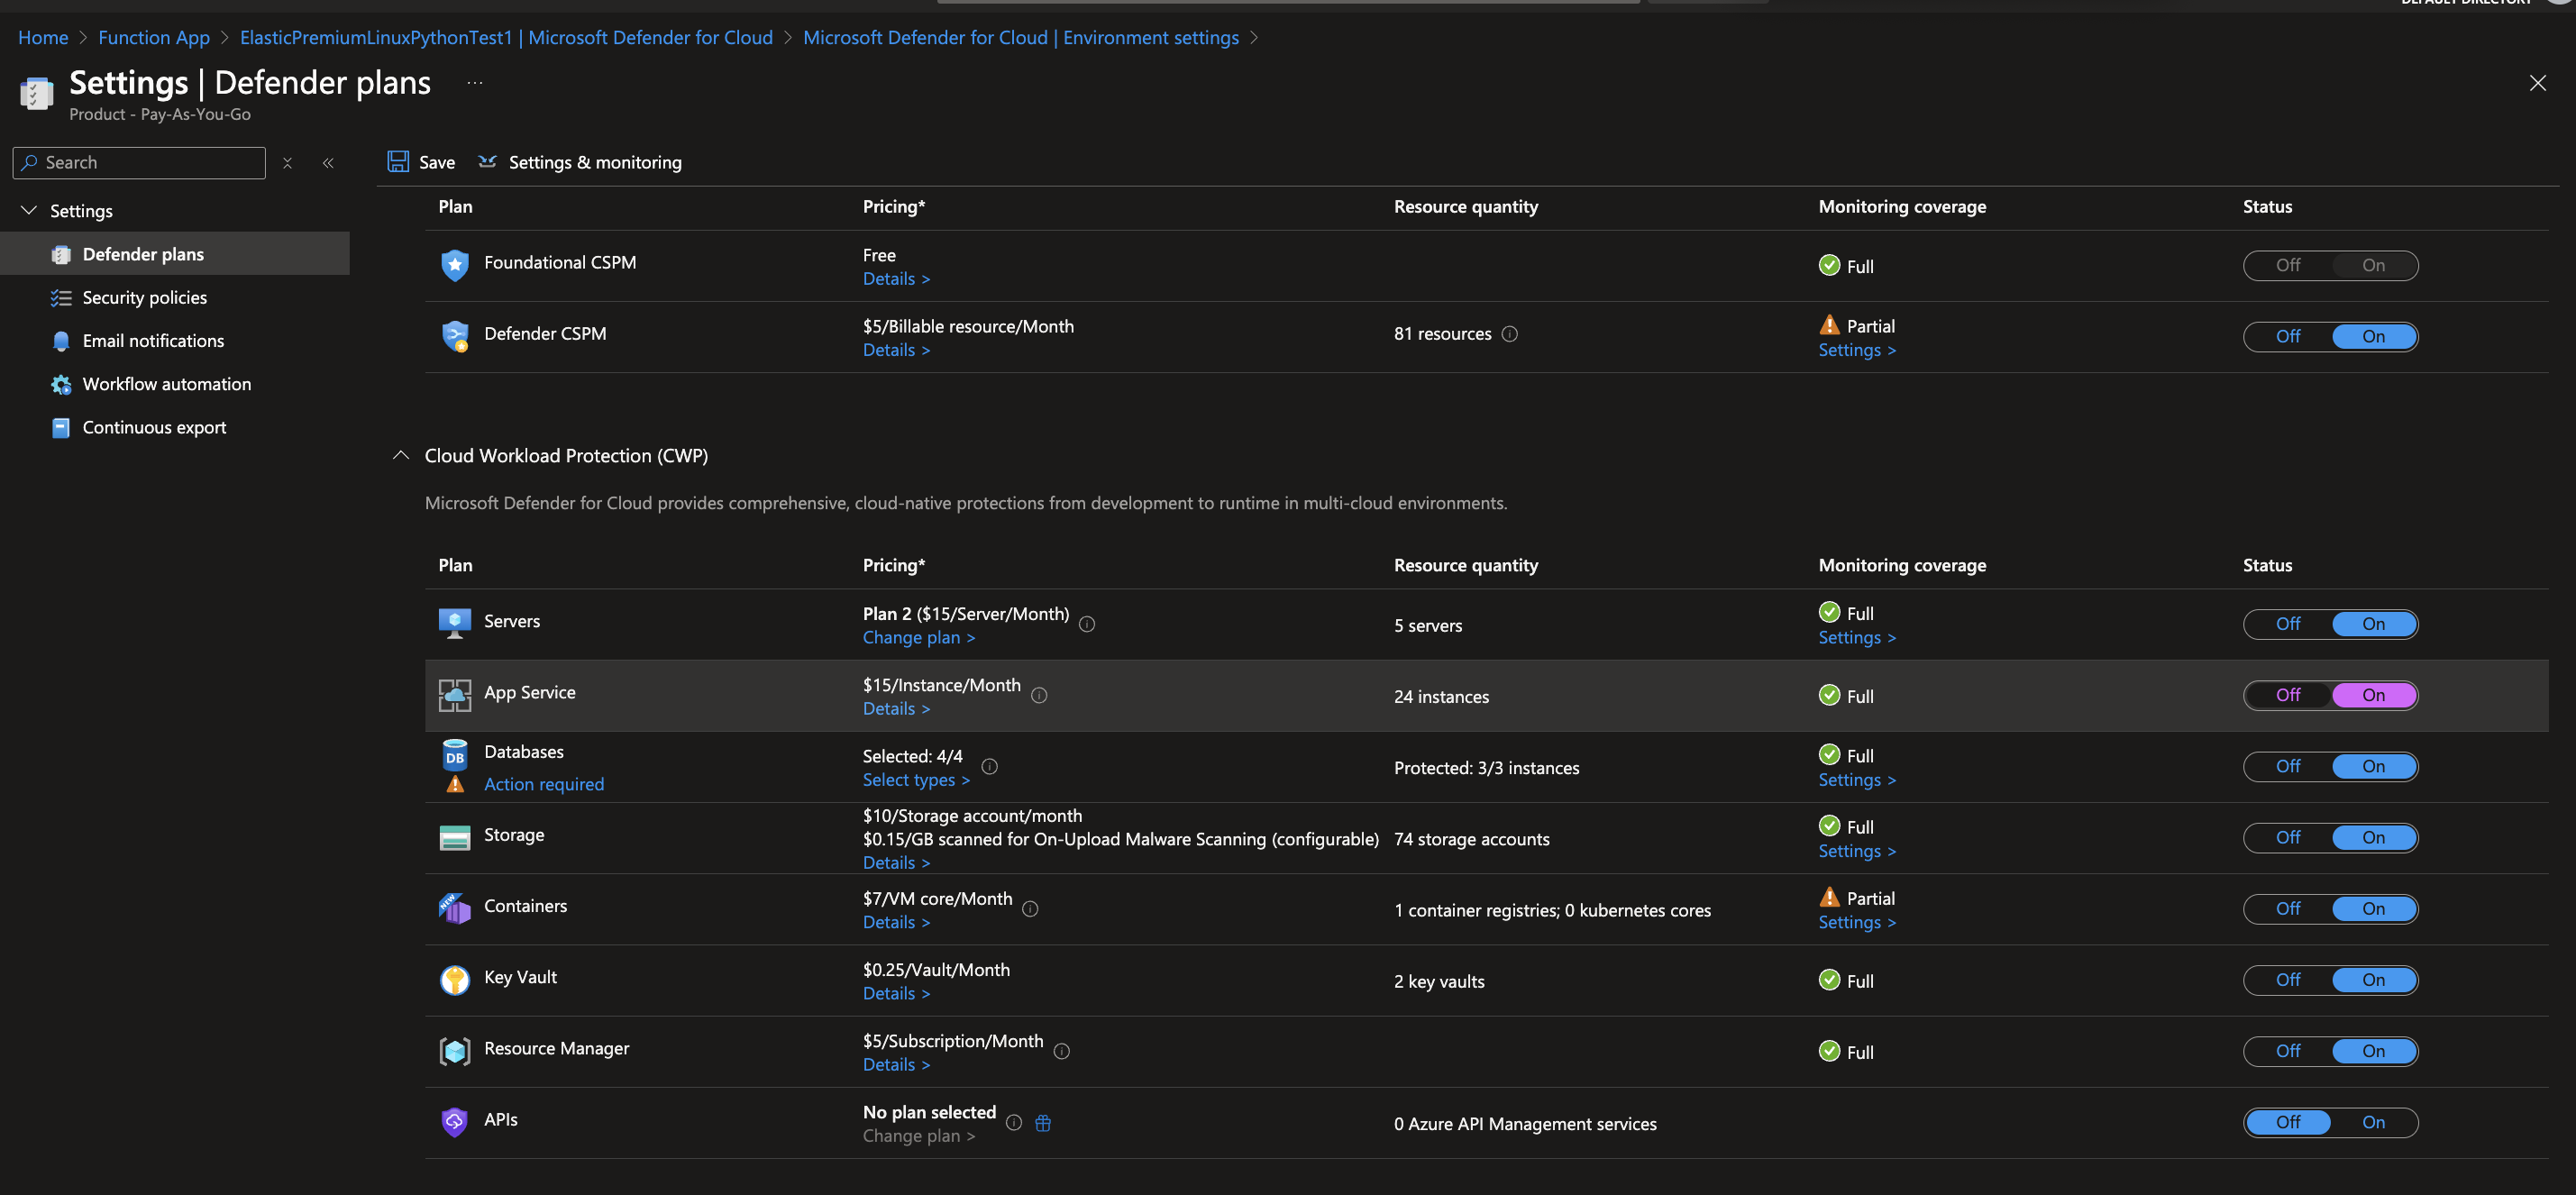
Enabling Microsoft Defender for Cloud
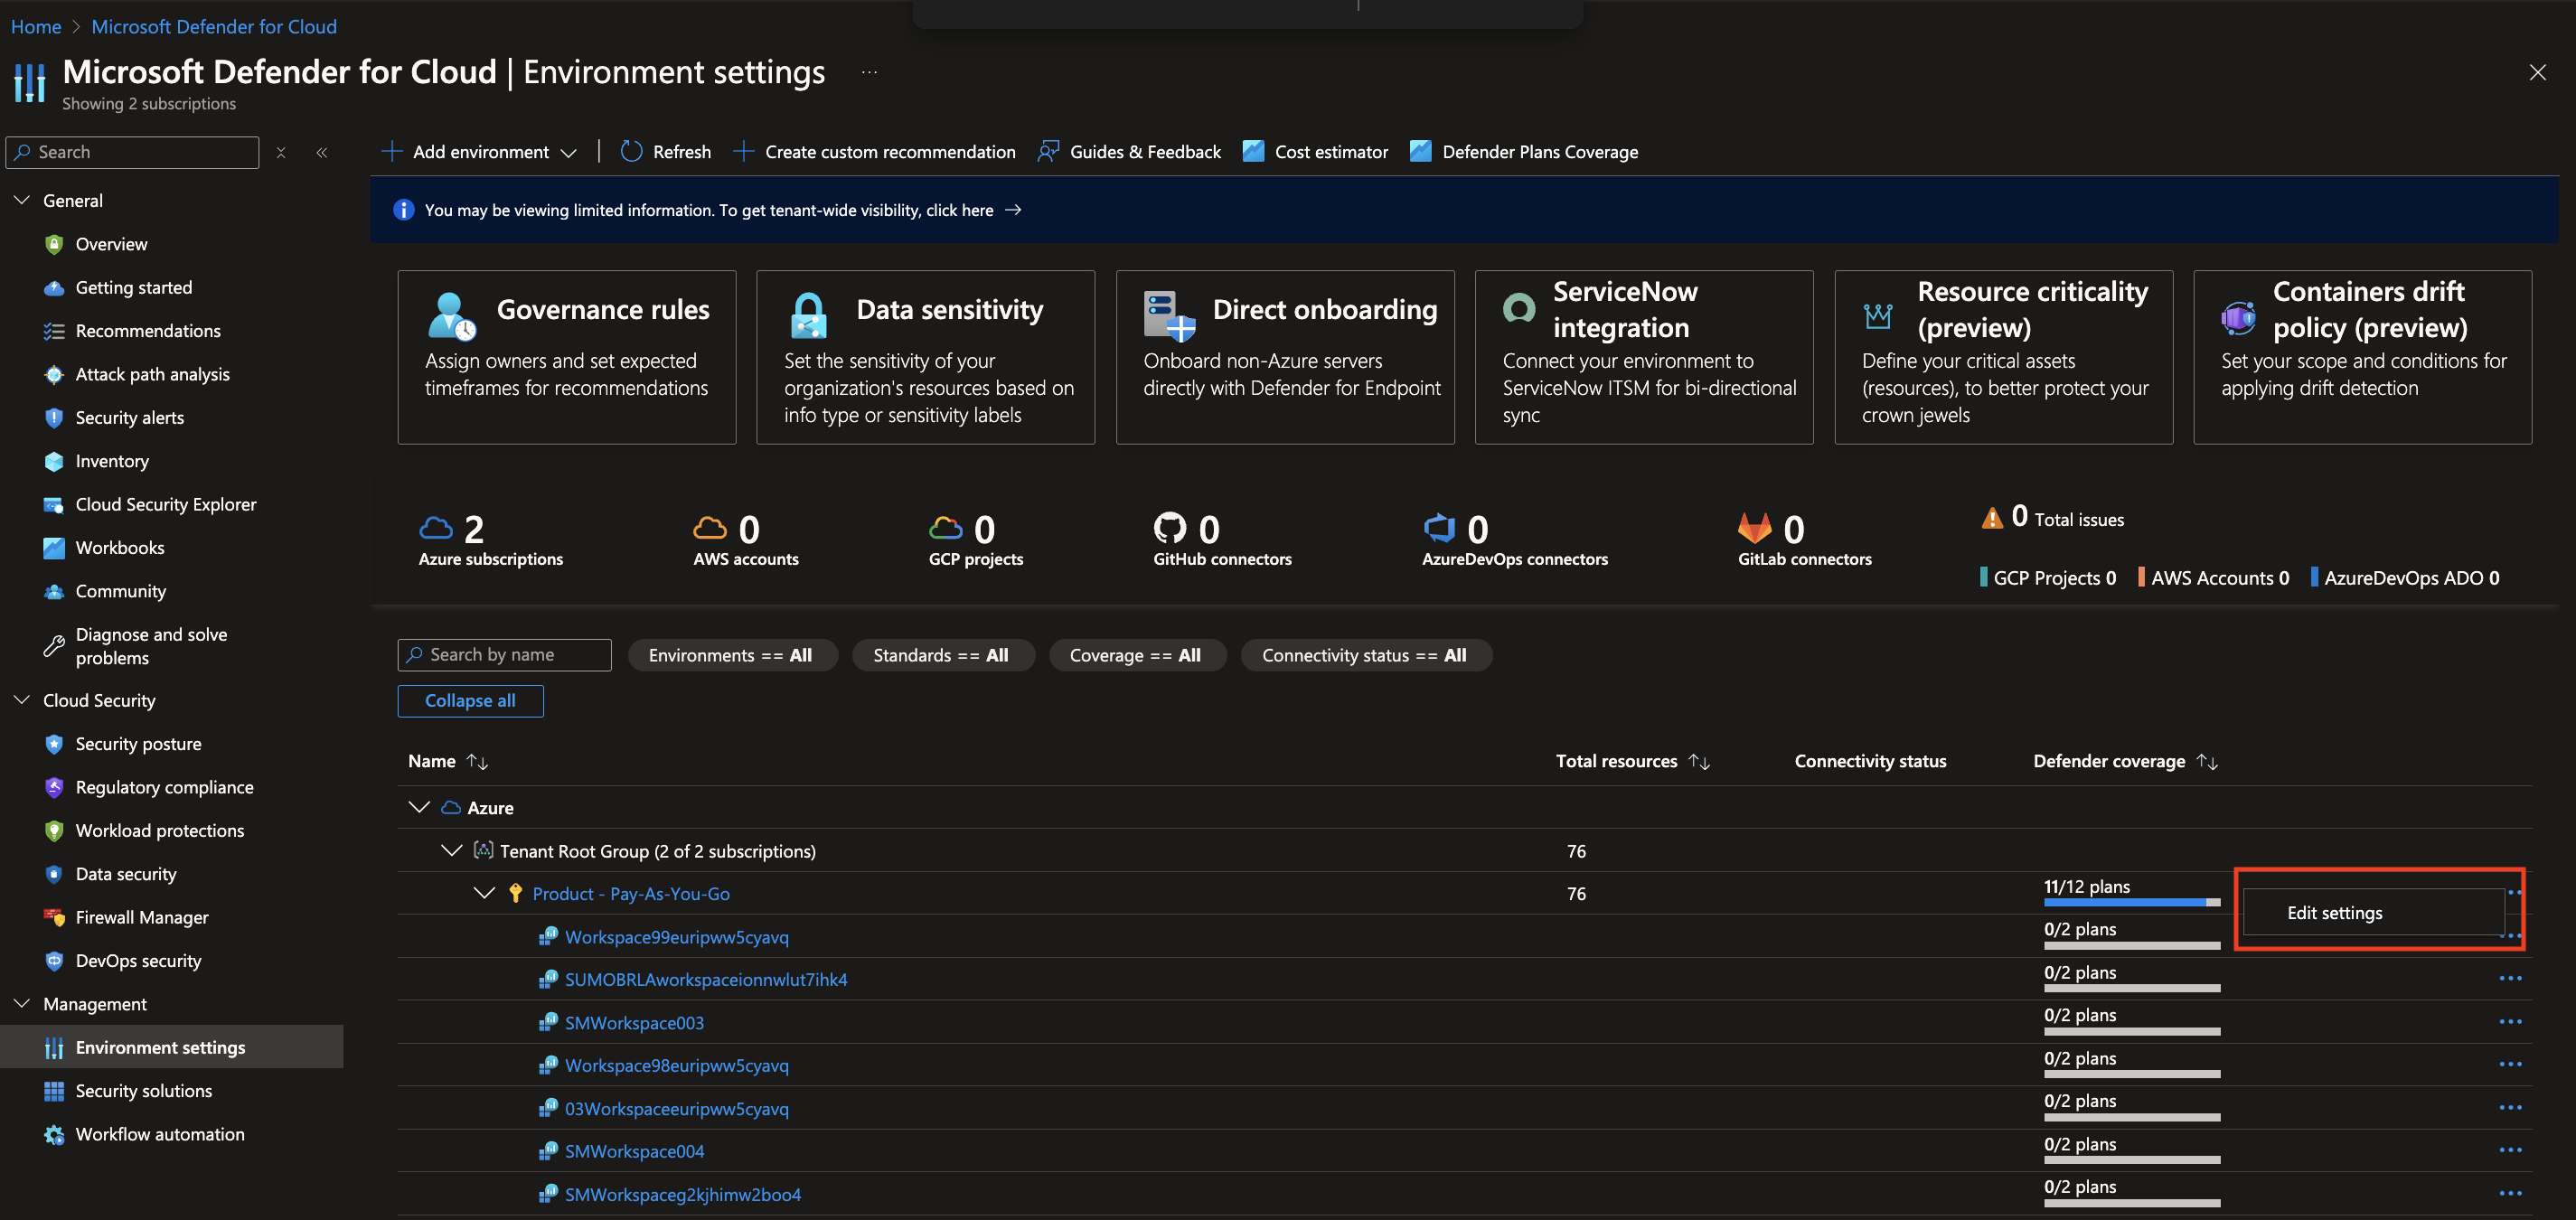
For Security events, make sure you enable Microsoft Defender for Cloud. In Defender Plans Settings page toggle the App Service status under Cloud Workload Protection section.
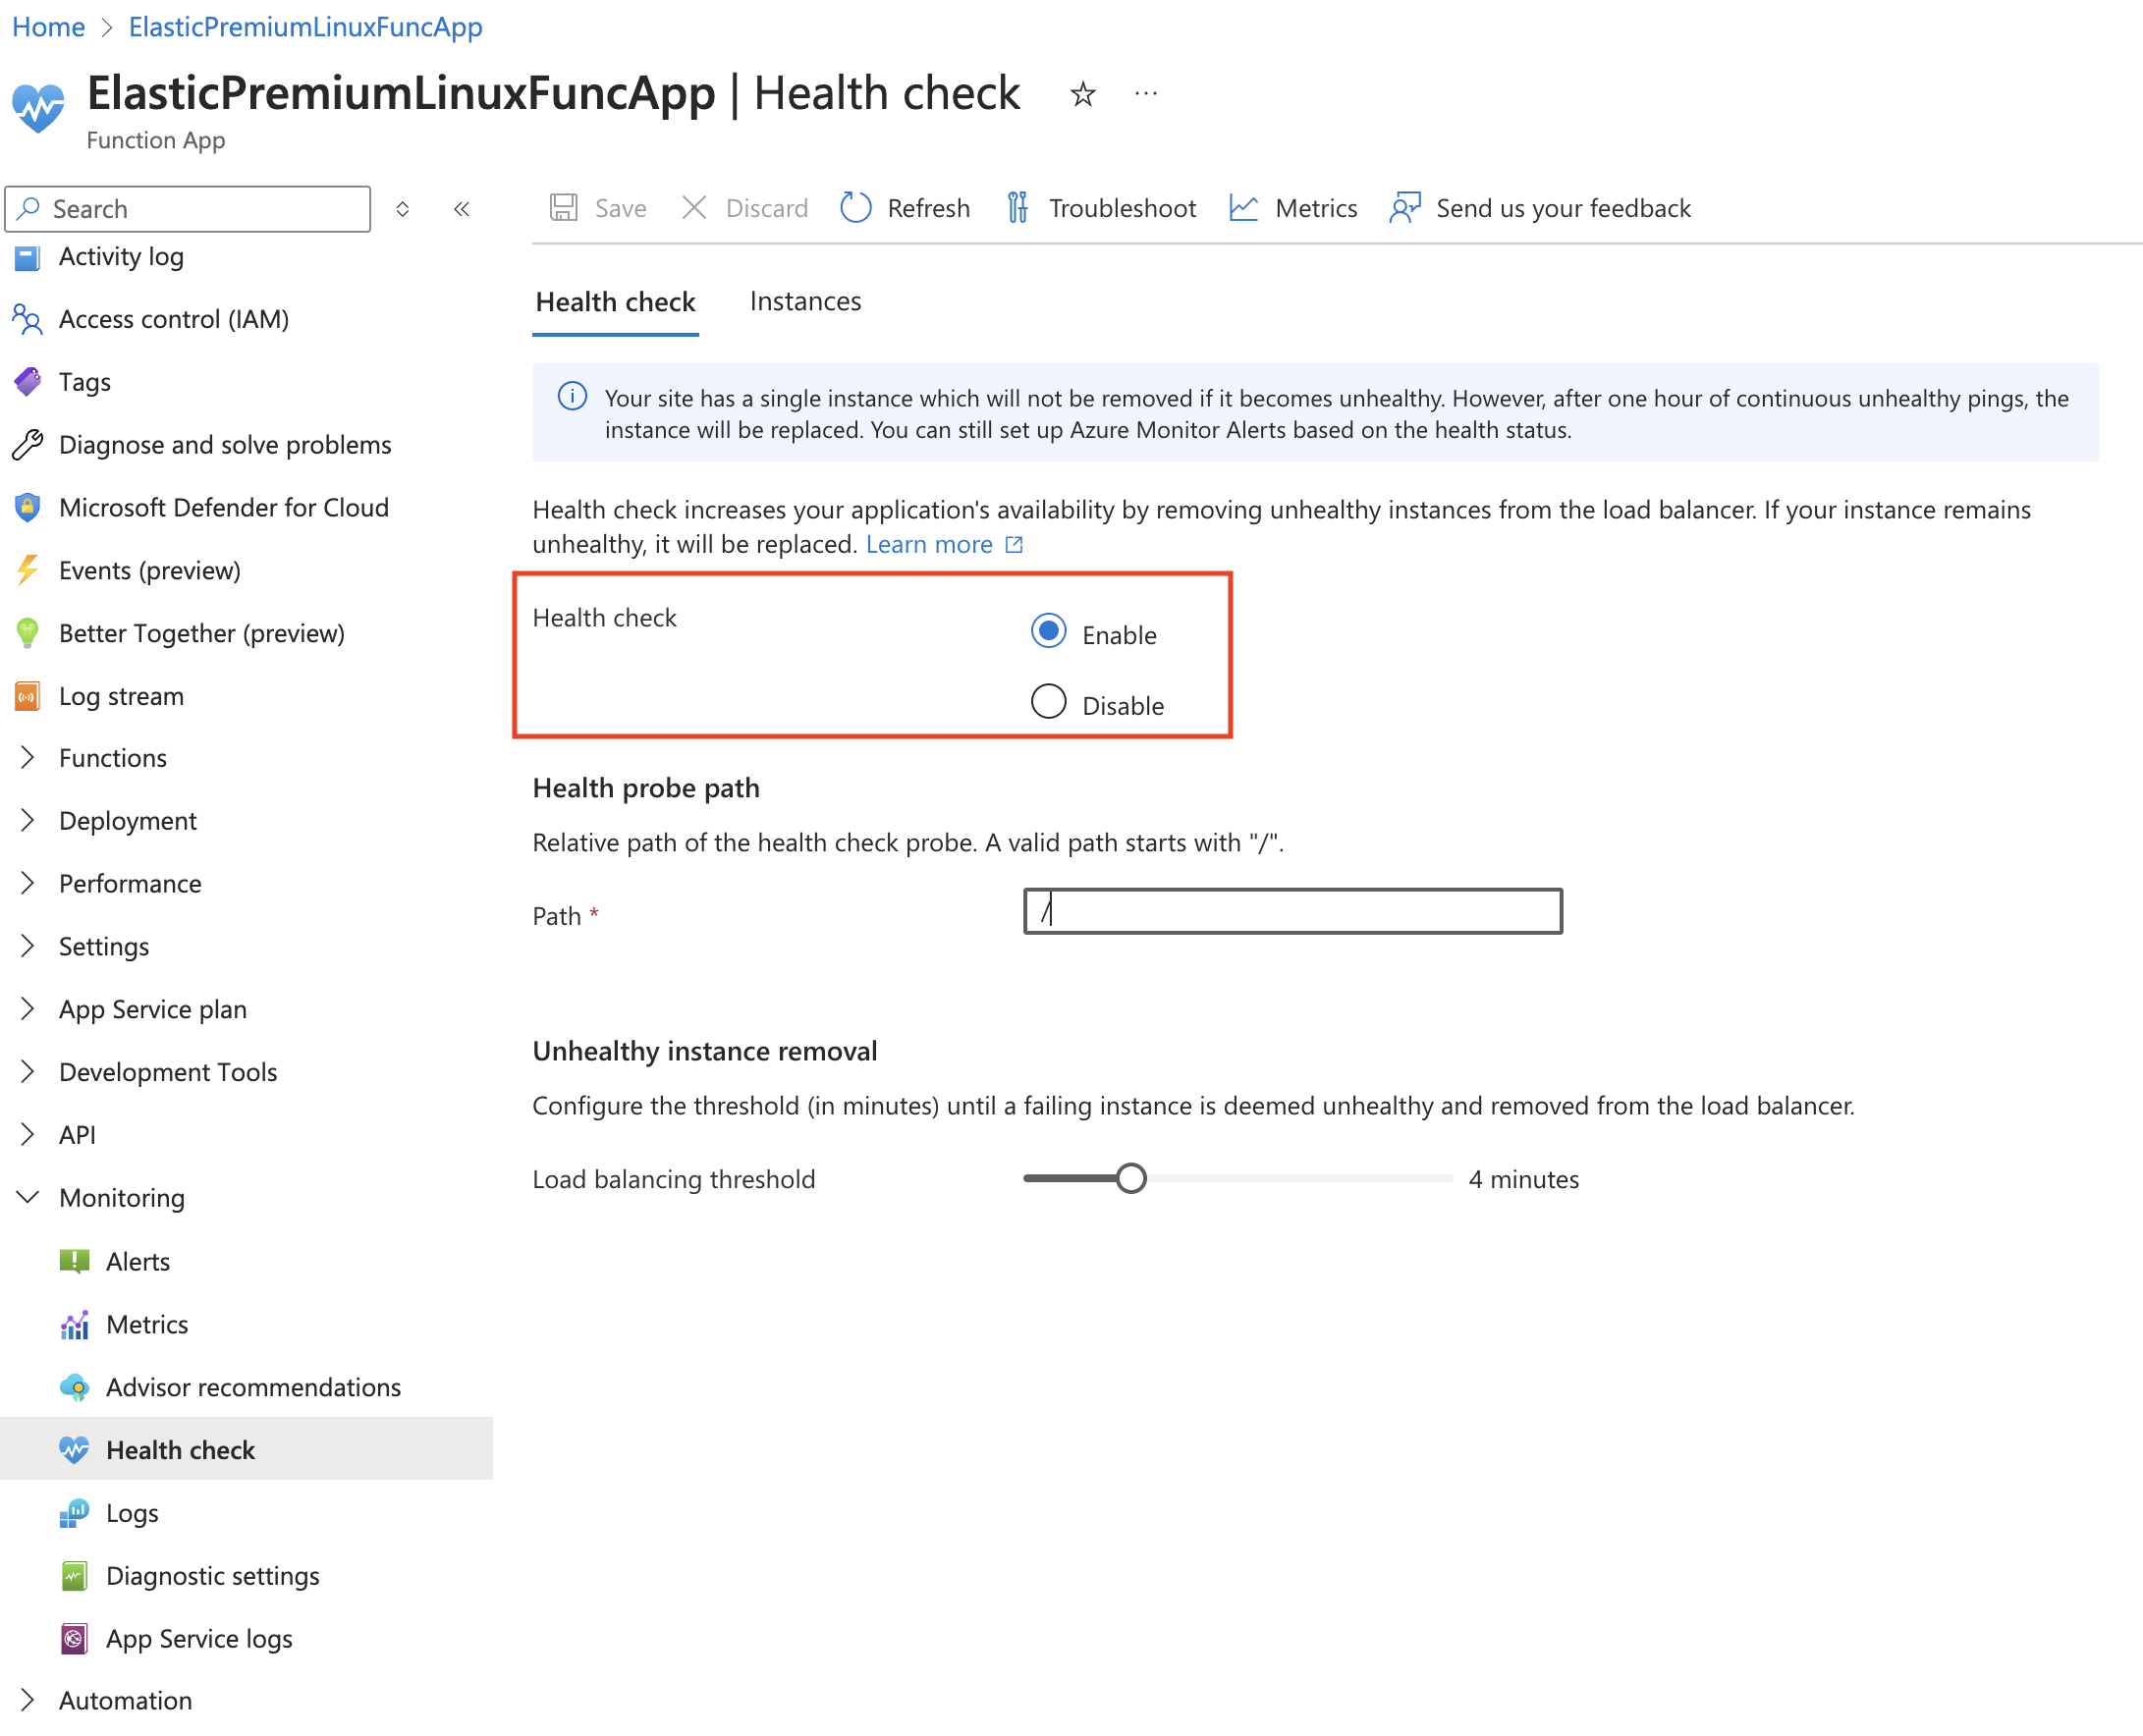
Enabling health check metric
For getting health check metric, make sure you enable Health check under the Monitoring dropdown.
Installing the Azure Web Apps app
This section provides instructions on how to install the Azure Web Apps app, and shows examples of each of the preconfigured dashboards you can use to analyze your data.
To install the app, do the following:
Next-Gen App: To install or update the app, you must be an account administrator or a user with Manage Apps, Manage Monitors, Manage Fields, Manage Metric Rules, and Manage Collectors capabilities depending upon the different content types part of the app.
- Select App Catalog.
- In the 🔎 Search Apps field, run a search for your desired app, then select it.
- Click Install App.
note
Sometimes this button says Add Integration.
- Click Next in the Setup Data section.
- In the Configure App section of your respective app, complete the following field.
- Index. Specify value for _index if the collection is configured with custom partition. Learn more. Default value is set to
sumologic_default(default partition)
- Index. Specify value for _index if the collection is configured with custom partition. Learn more. Default value is set to
- Click Next. You will be redirected to the Preview & Done section.
Post-installation
Once your app is installed, it will appear in your Installed Apps folder, and dashboard panels will start to fill automatically.
Each panel slowly fills with data matching the time range query received since the panel was created. Results will not immediately be available but will be updated with full graphs and charts over time.
As part of the app installation process, the following fields will be created by default:
tenant_name. This field is tagged at the collector level. You can get the tenant name using the instructions here.location. The region to which the resource name belongs to.subscription_id. ID associated with a subscription where the resource is present.resource_group. The resource group name where the Azure resource is present.provider_name. Azure resource provider name (for example, Microsoft.Network).resource_type. Azure resource type (for example, storage accounts).resource_name. The name of the resource (for example, storage account name).service_type. Type of the service that can be accessed with a Azure resource.service_name. Services that can be accessed with an Azure resource (for example, in Azure Container Instances the service is Subscriptions).
Viewing Azure Web Apps dashboards
All dashboards have a set of filters that you can apply to the entire dashboard. Use these filters to drill down and examine the data to a granular level.
- You can change the time range for a dashboard or panel by selecting a predefined interval from a drop-down list, choosing a recently used time range, or specifying custom dates and times. Learn more.
- You can use template variables to drill down and examine the data on a granular level. For more information, see Filtering Dashboards with Template Variables.
- Many of the Next-Gen apps allow you to provide the Index at the installation time and a default value for this key (sumologic_default). Based on your input, the app dashboards will be parameterized with a dashboard variable, allowing you to change the data partition queried by all panels. This restricts the query scope of all the dashboard queries to a specific data partition.
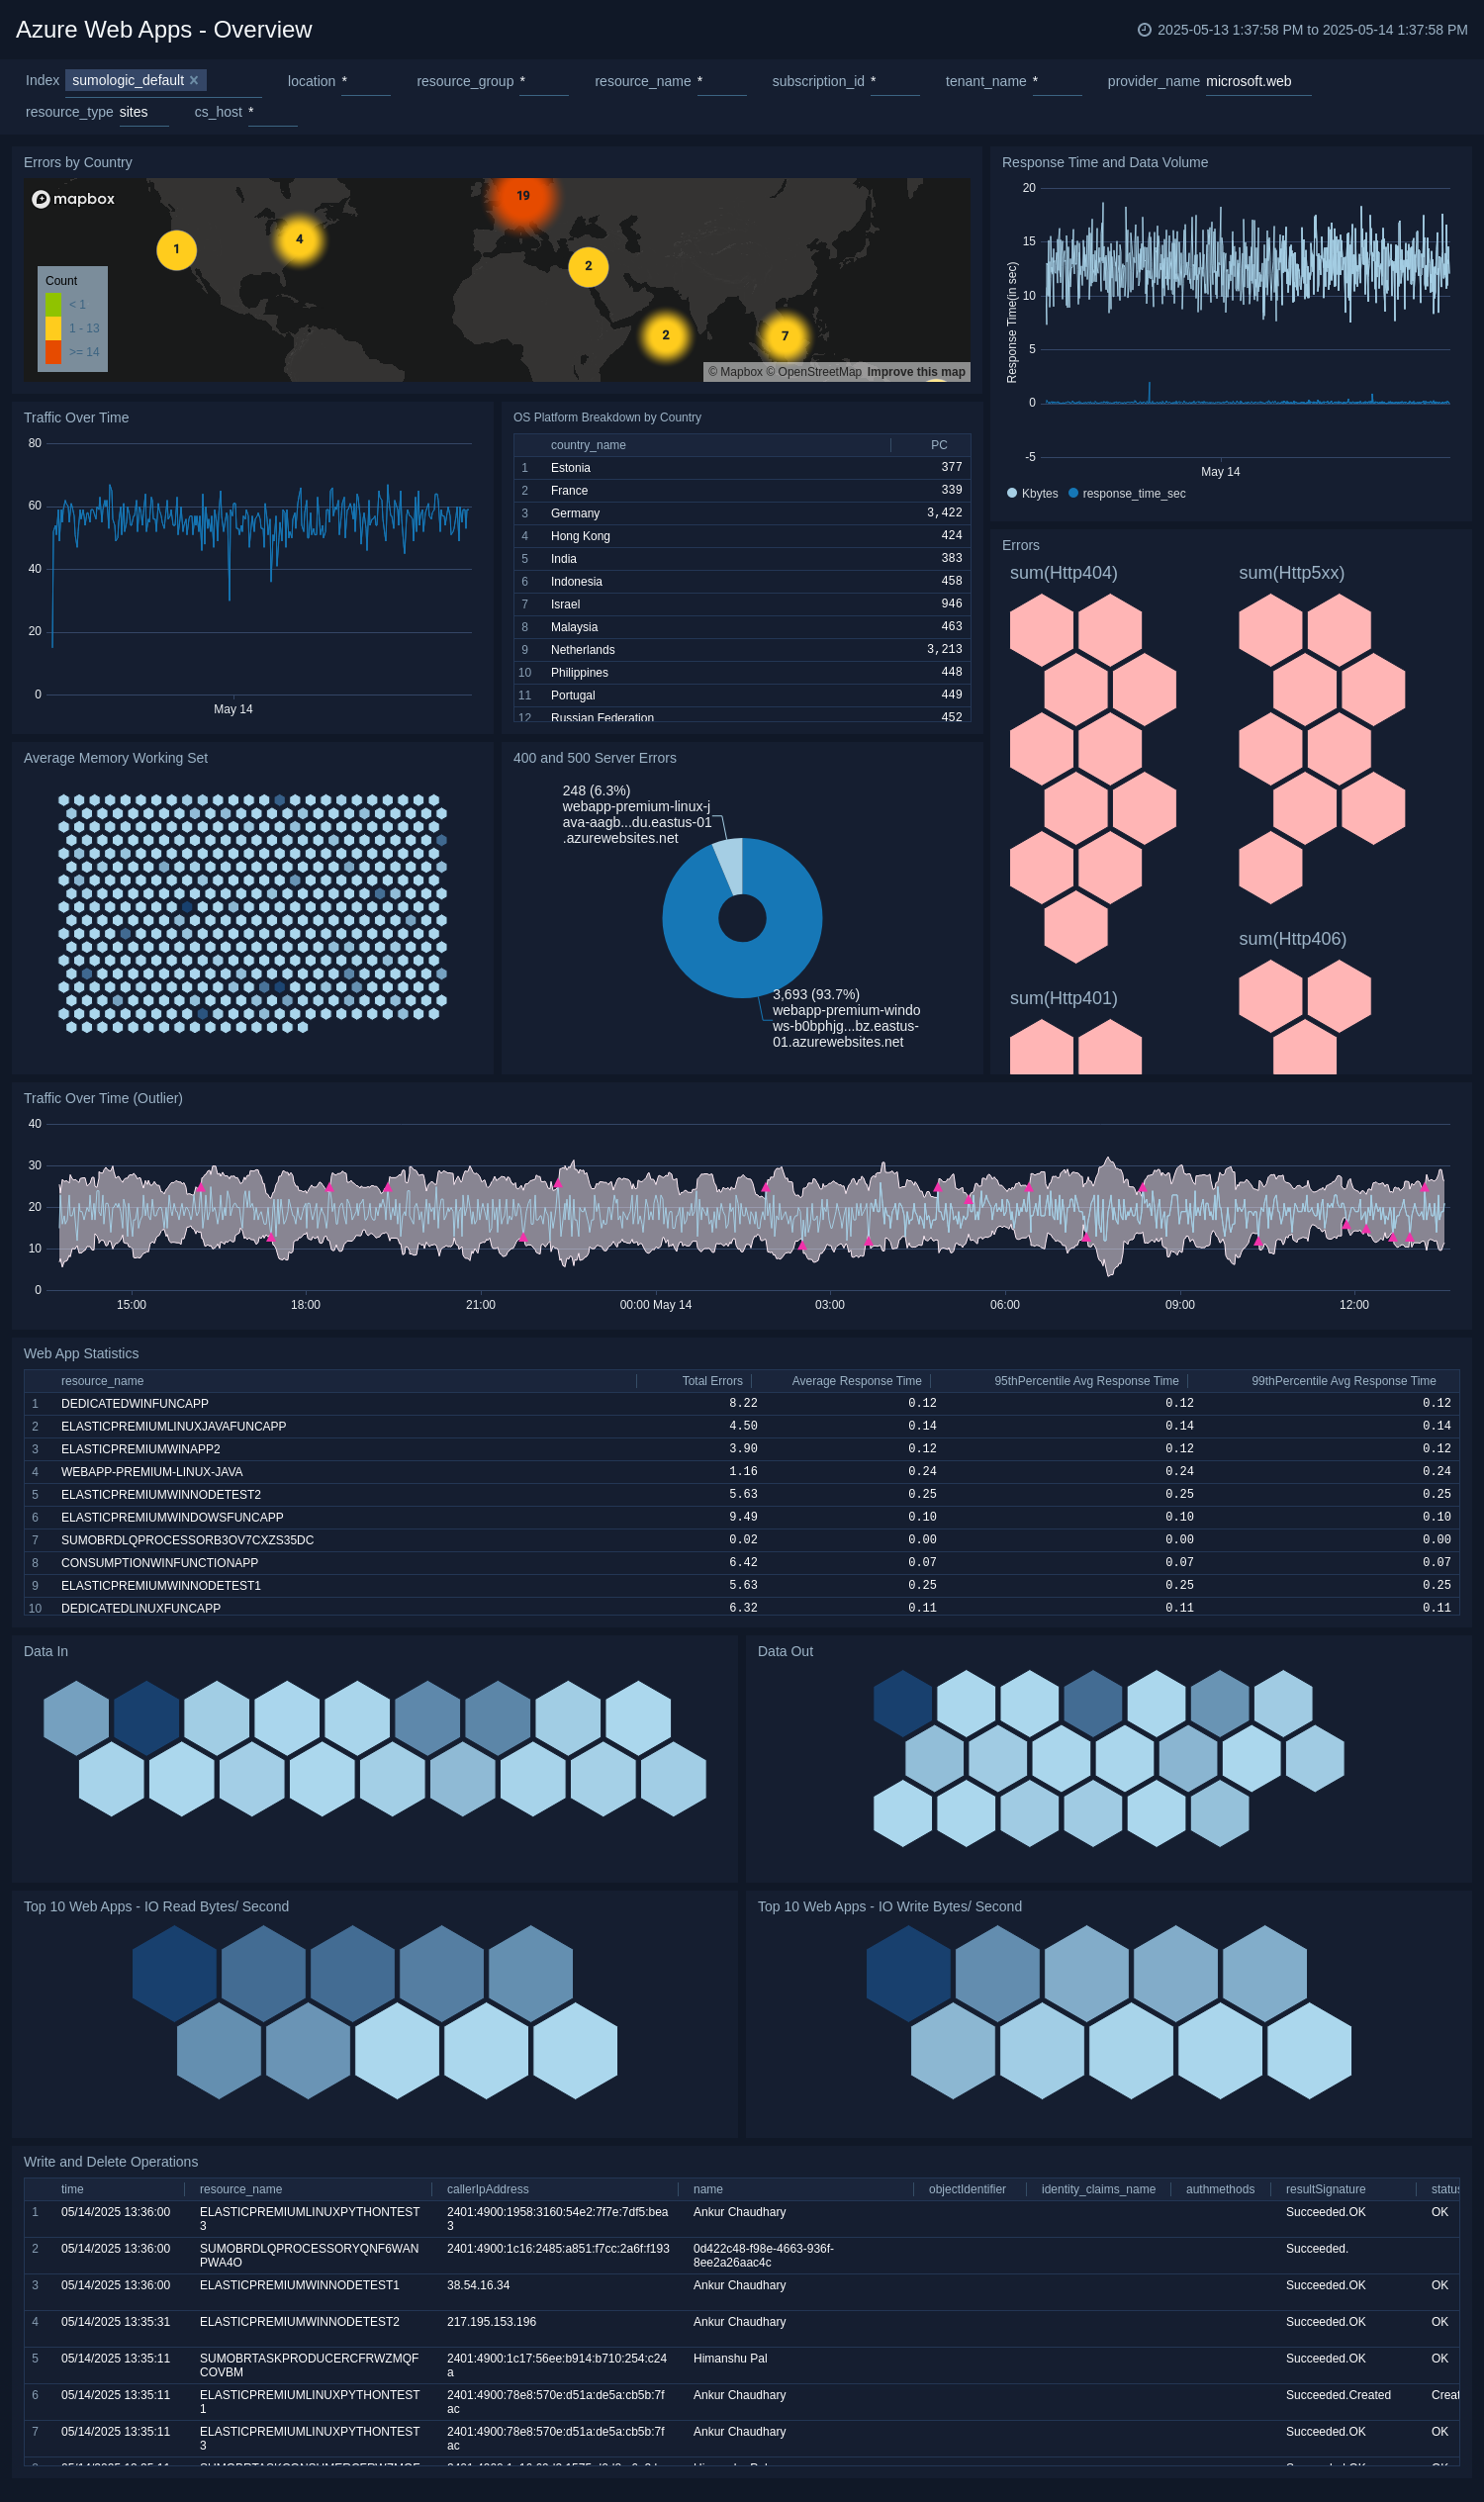
Overview
The Azure WebApps - Overview dashboard provides comprehensive information of all the service health incidents or resource health events associated with Azure WebApps in your azure account.
Use this dashboard to:
- View recent resource and service health incidents.
- View distribution of service and resource health by incident type.
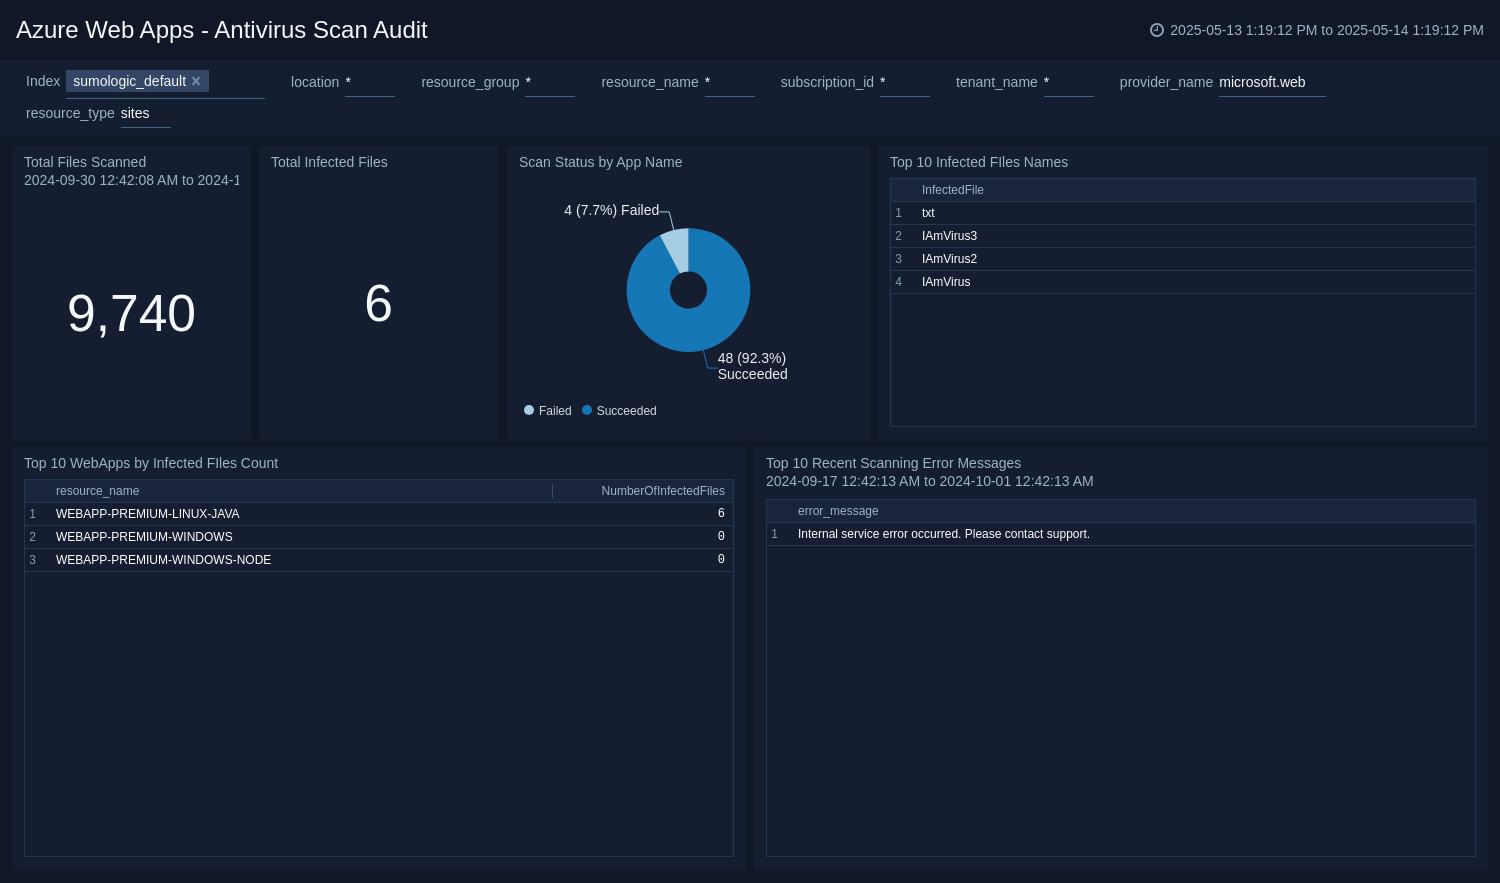
Antivirus Scan Audit
The Azure WebApps - Antivirus Scan Audit dashboard provides detailed insights into the antivirus scan results and audit logs associated with your Azure WebApps.
Use this dashboard to:
- View recent antivirus scan results and their statuses.
- Analyze audit logs for compliance and security checks.
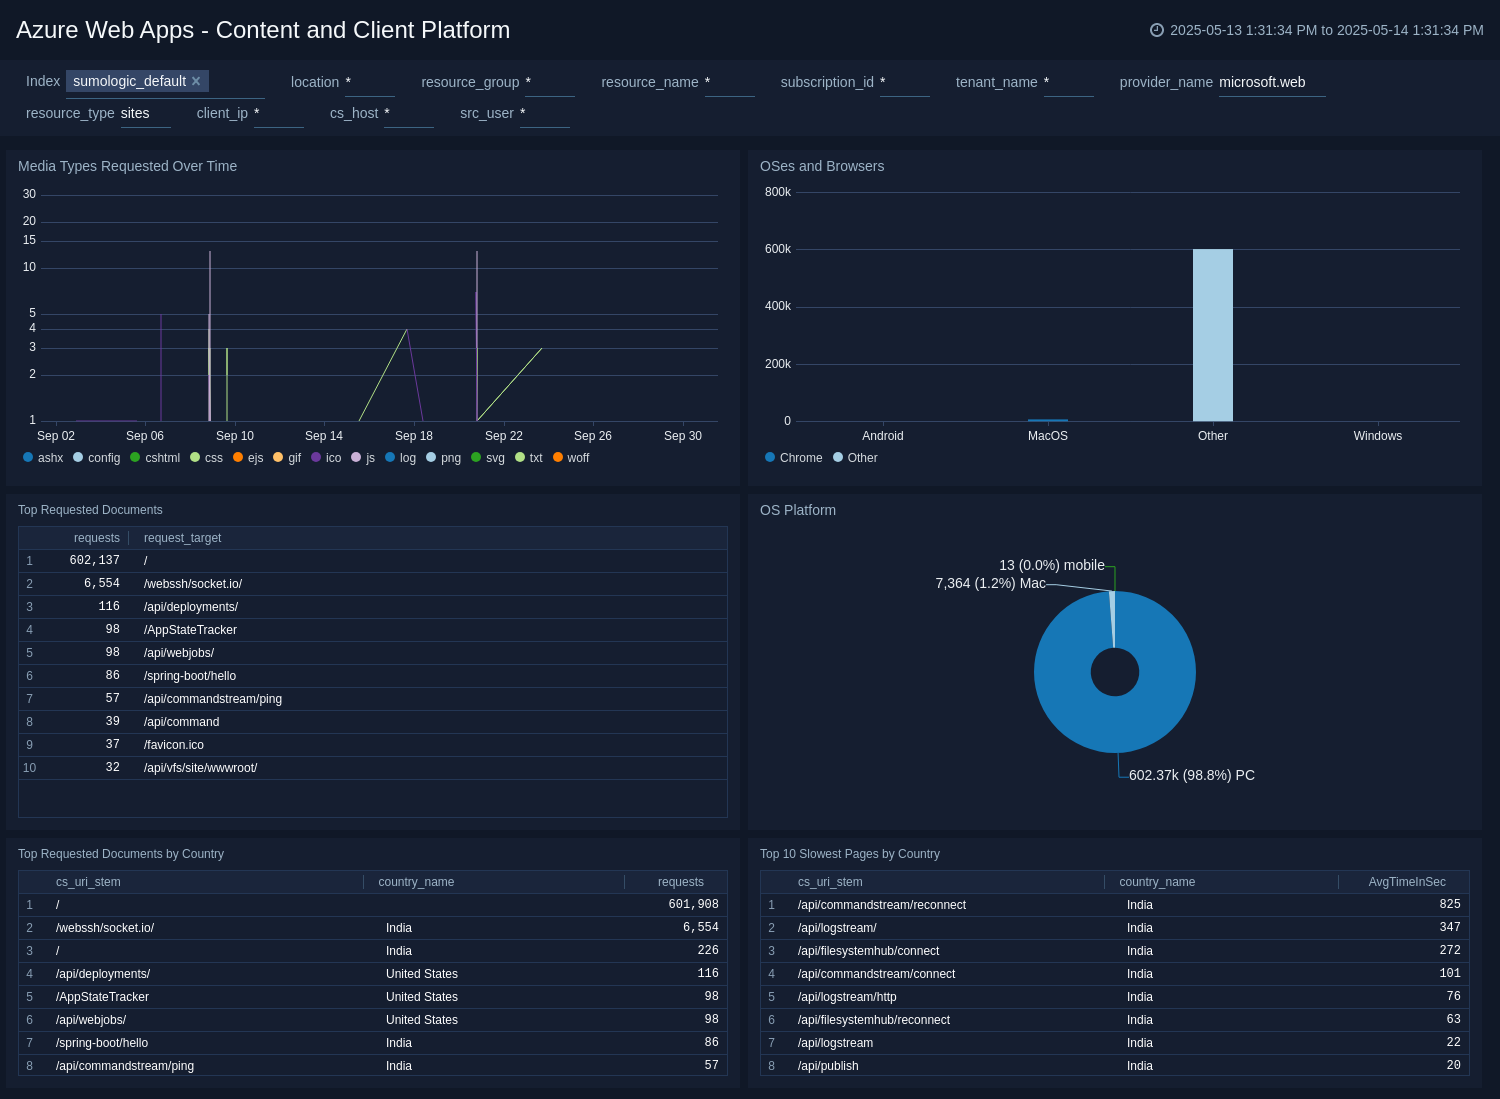
Content and Client Platform
The Azure WebApps - Content and Client Platform dashboard offers an overview of the content delivery performance and client platform statistics for your Azure WebApps.
Use this dashboard to:
- Monitor content delivery metrics and client platform usage.
- Identify trends in client platform access and performance.
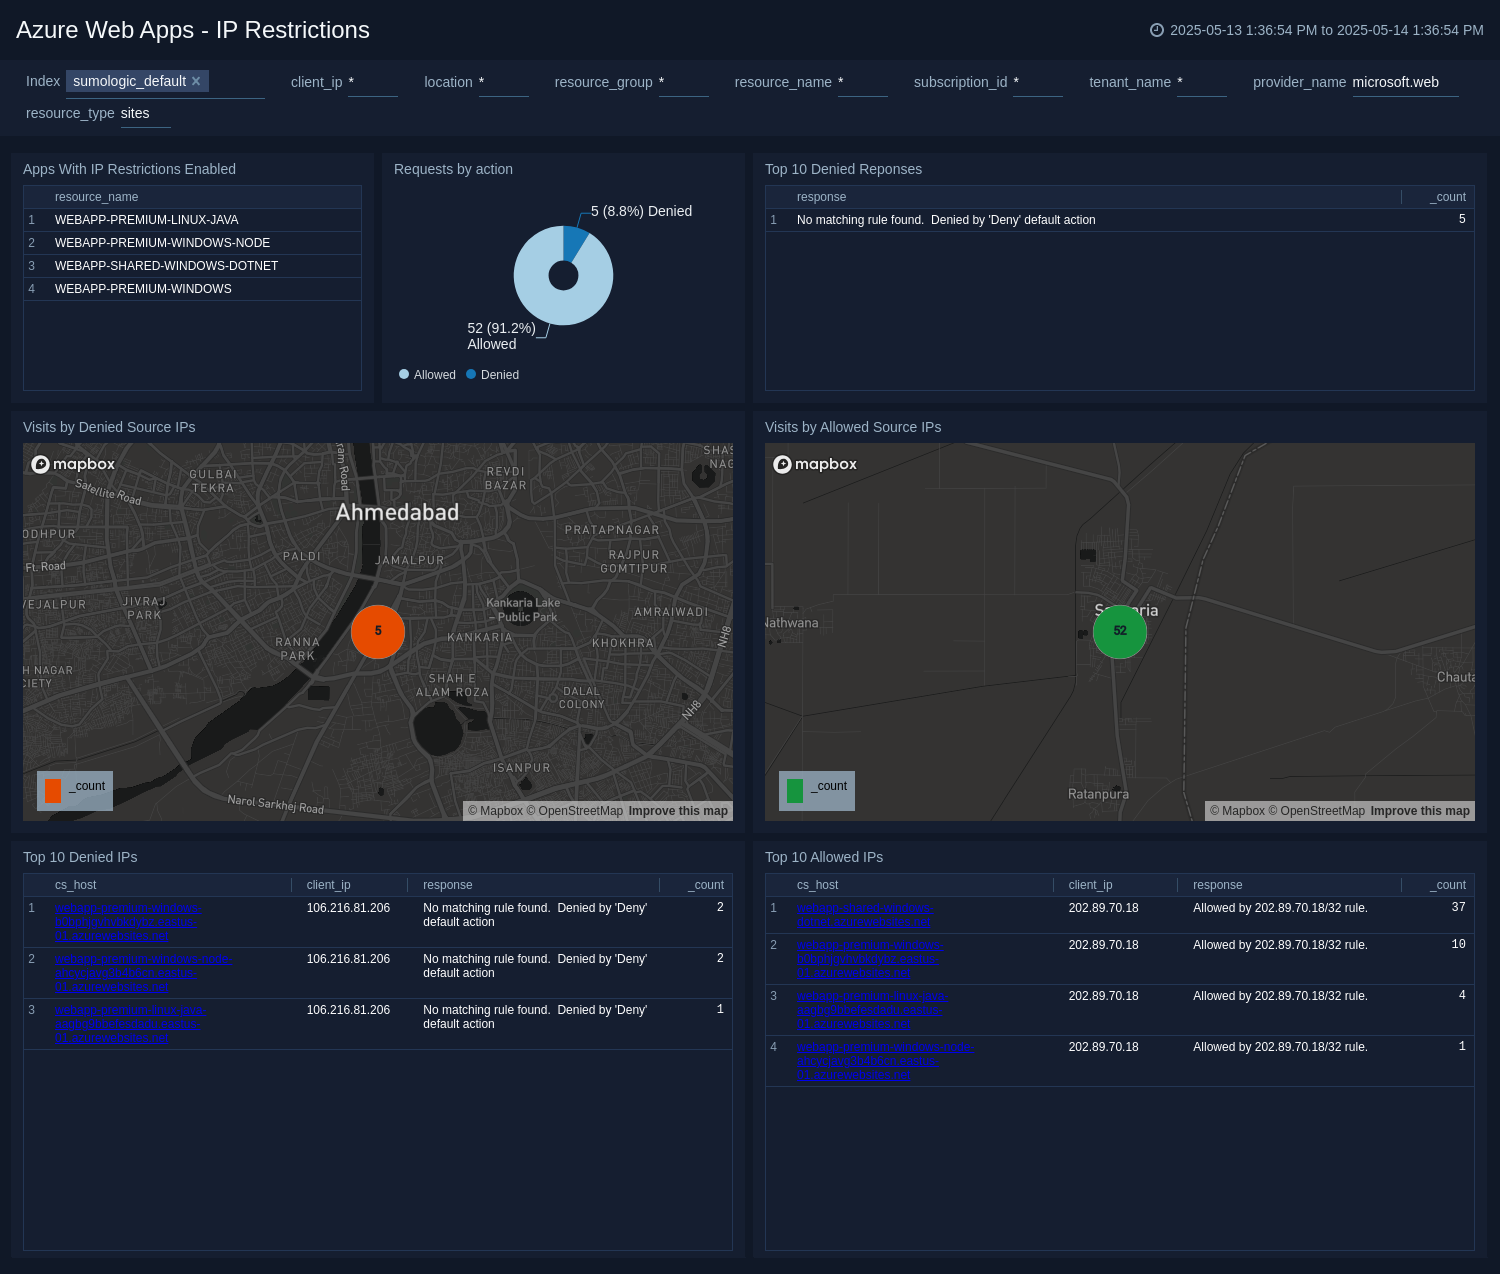
IP Restrictions
The Azure WebApps - IP Restrictions dashboard provides insights into the IP address restrictions configured for your Azure WebApps.
Use this dashboard to:
- View configured IP restrictions and their statuses.
- Monitor access attempts based on IP restrictions.
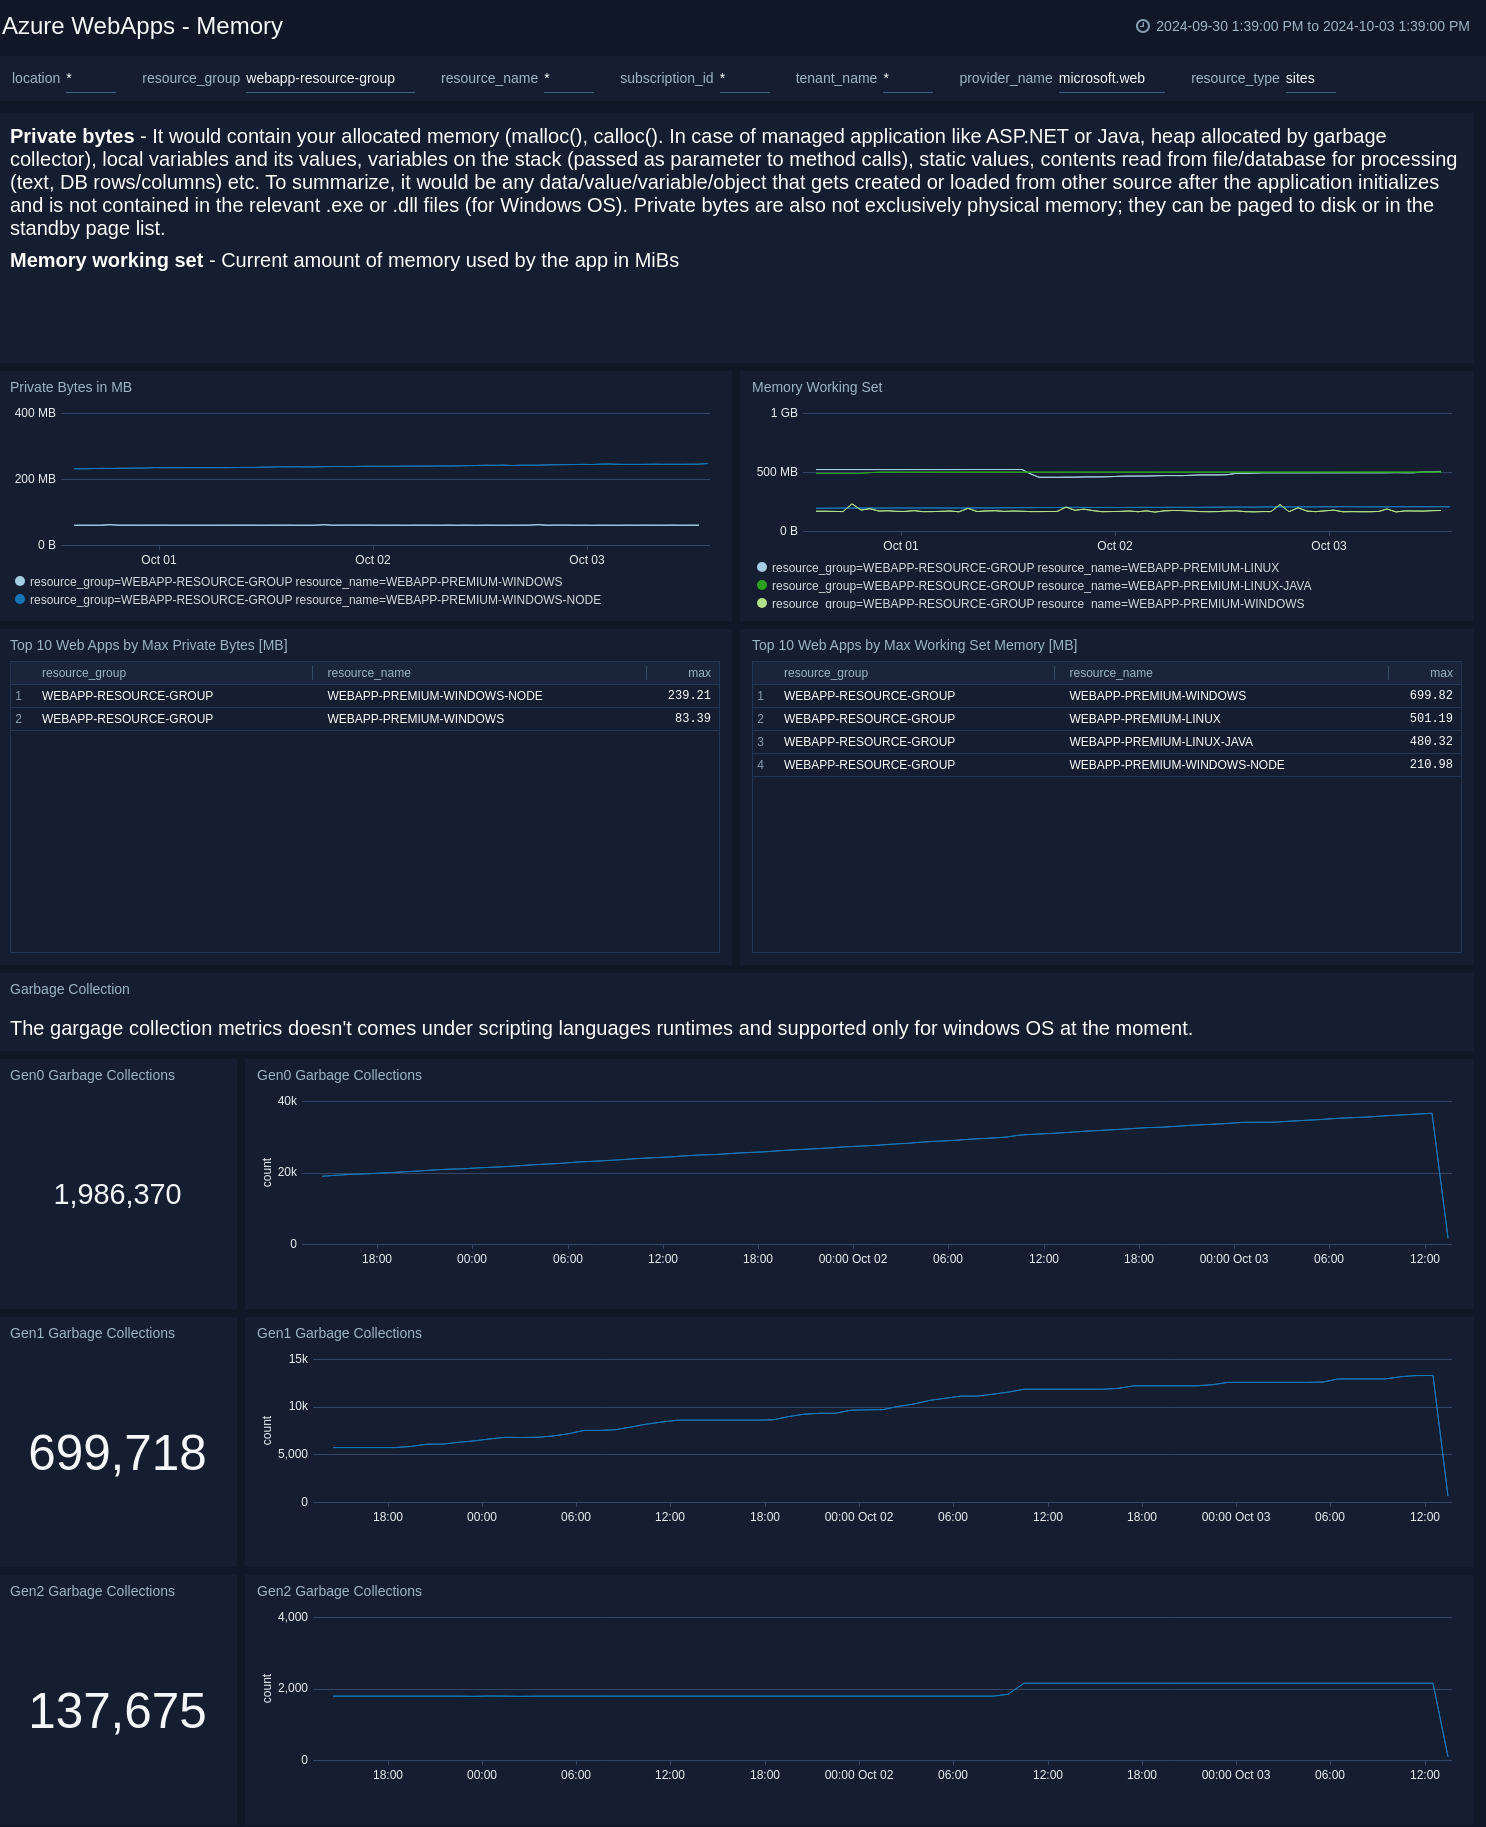
Memory
The Azure WebApps - Memory dashboard tracks memory usage and performance metrics for your Azure WebApps.
Use this dashboard to:
- Monitor real-time memory utilization and trends.
- Identify memory-related performance issues and bottlenecks.
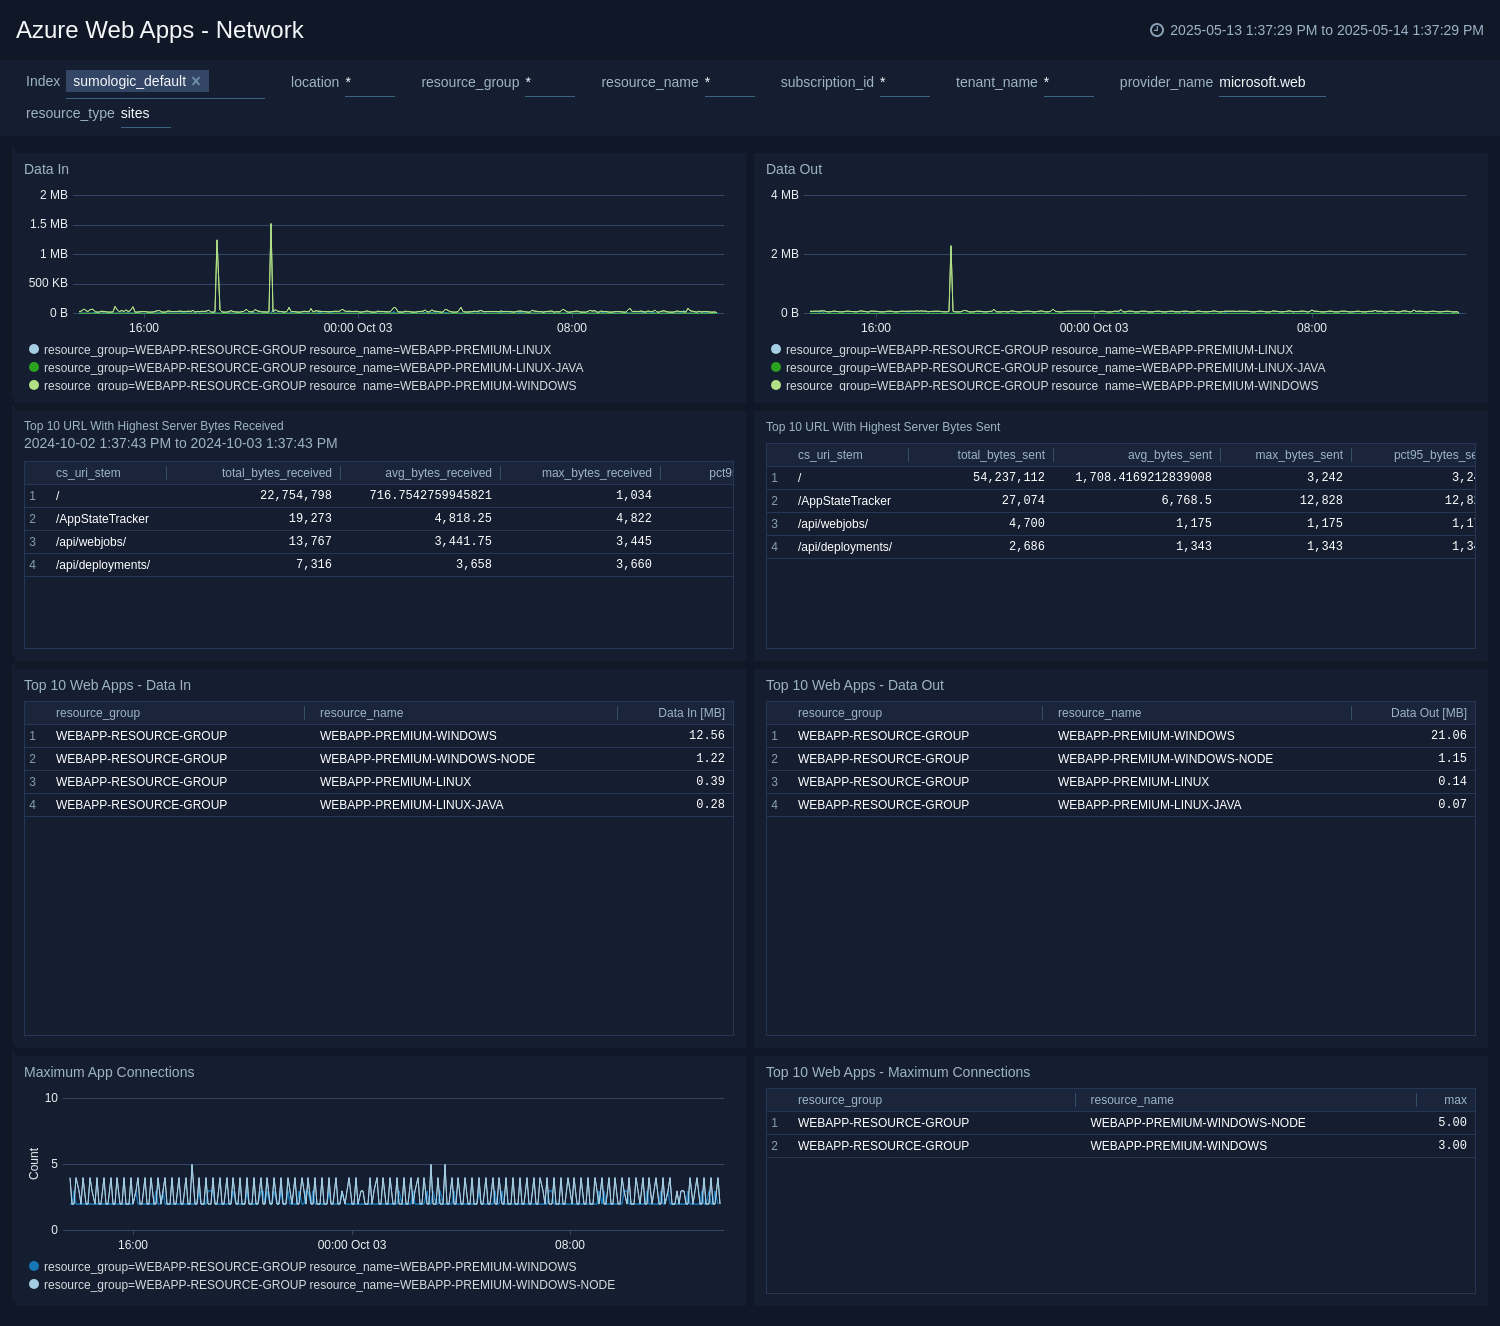
Network
The Azure WebApps - Network dashboard offers comprehensive insights into the network performance and traffic for your Azure WebApps.
Use this dashboard to:
- Analyze network traffic patterns and performance metrics.
- Identify potential network issues affecting your applications.
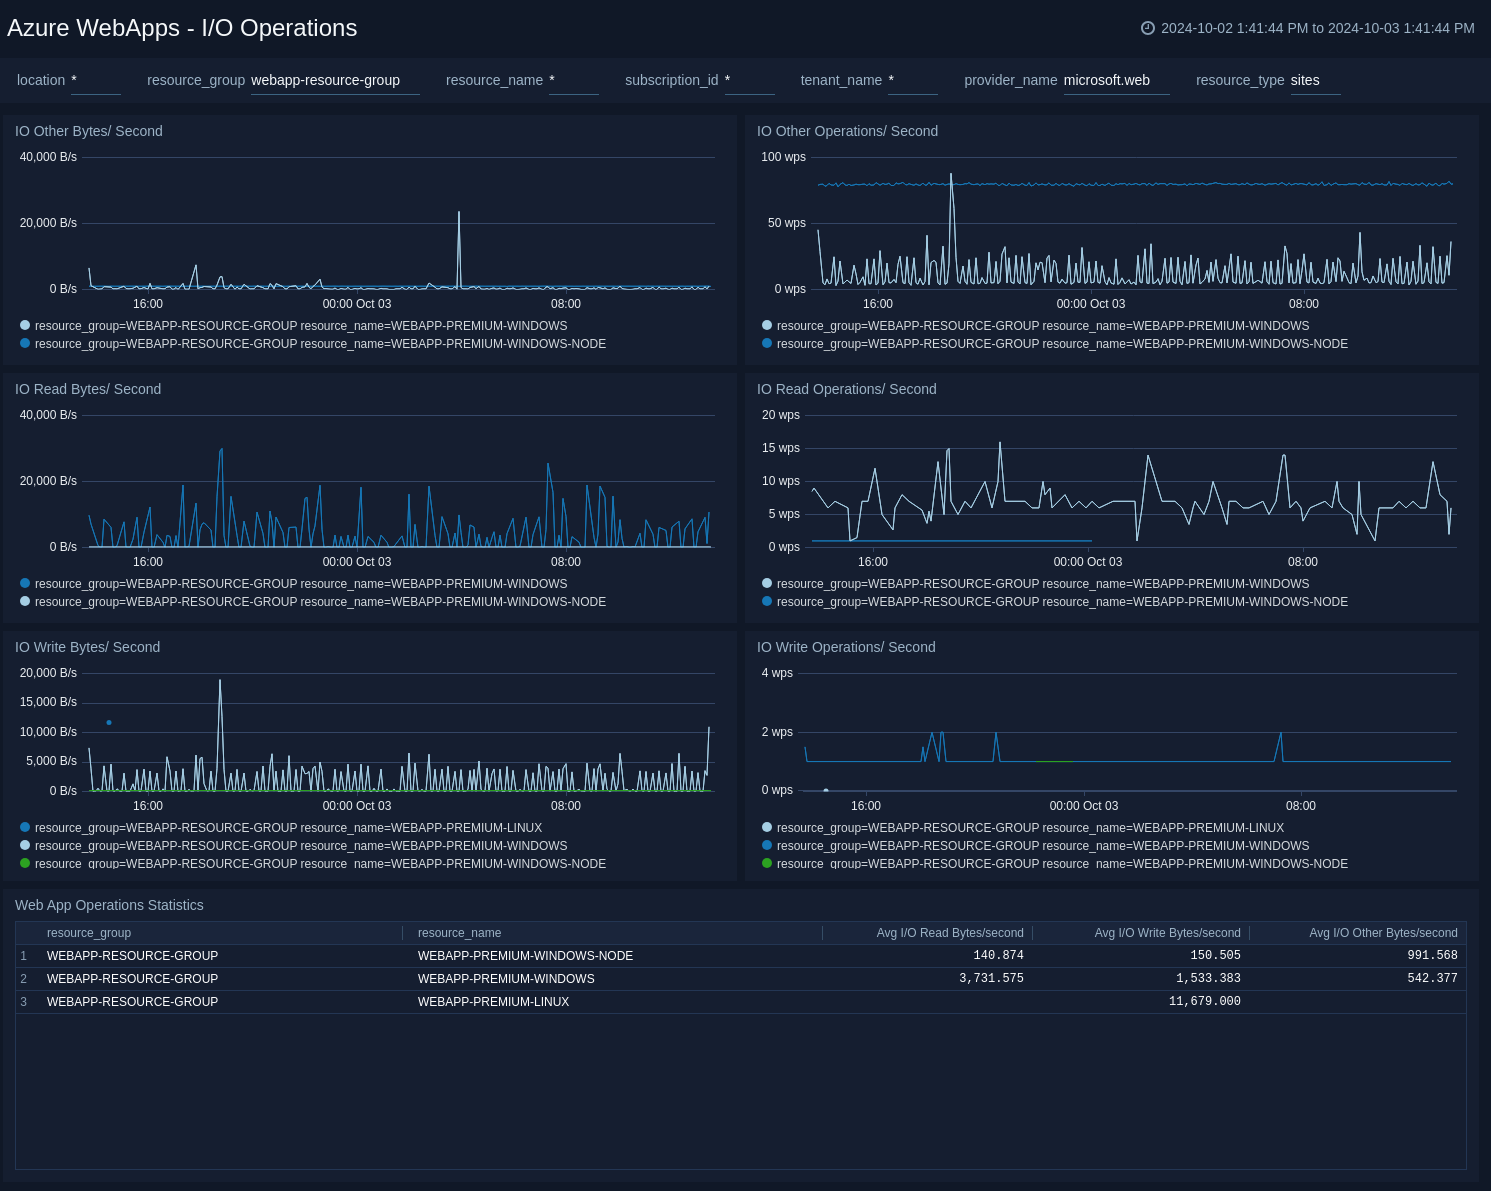
I/O Operations
The Azure WebApps - I/O Operations dashboard provides a comprehensive view of the I/O operational metrics and activities associated with your Azure WebApps.
Use this dashboard to:
- Monitor I/O operational events and their impact on service availability.
- Analyze trends in operational performance over time.
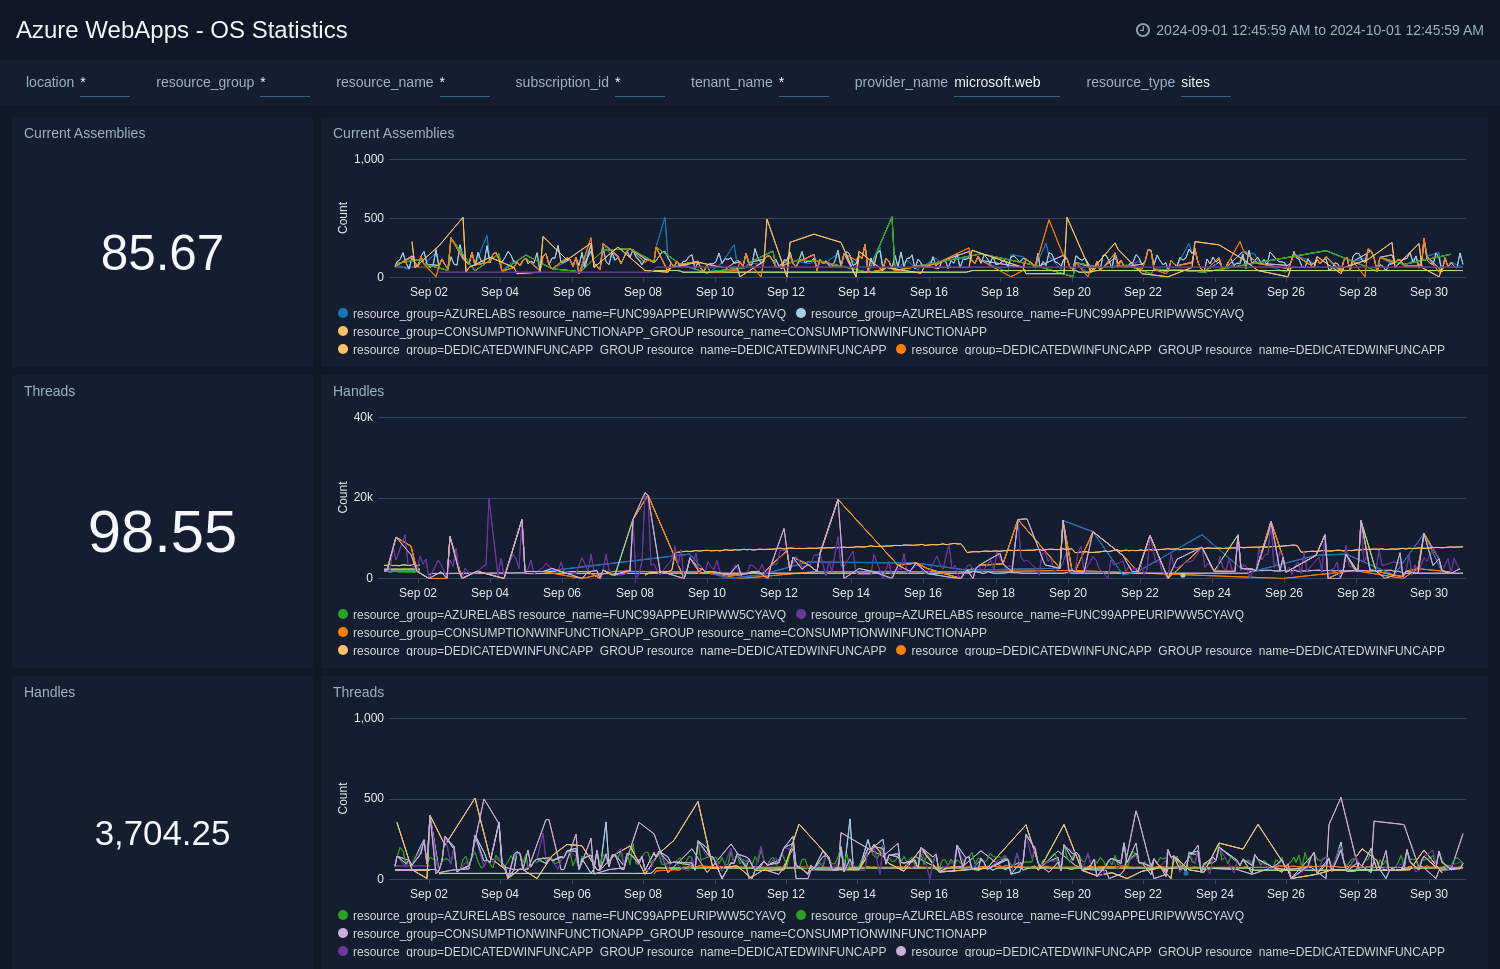
OS Statistics
The Azure WebApps - OS Statistics dashboard presents an overview of operating system metrics related to your Azure WebApps.
Use this dashboard to:
- Monitor key OS performance indicators and health metrics.
- Identify potential issues at the operating system level.
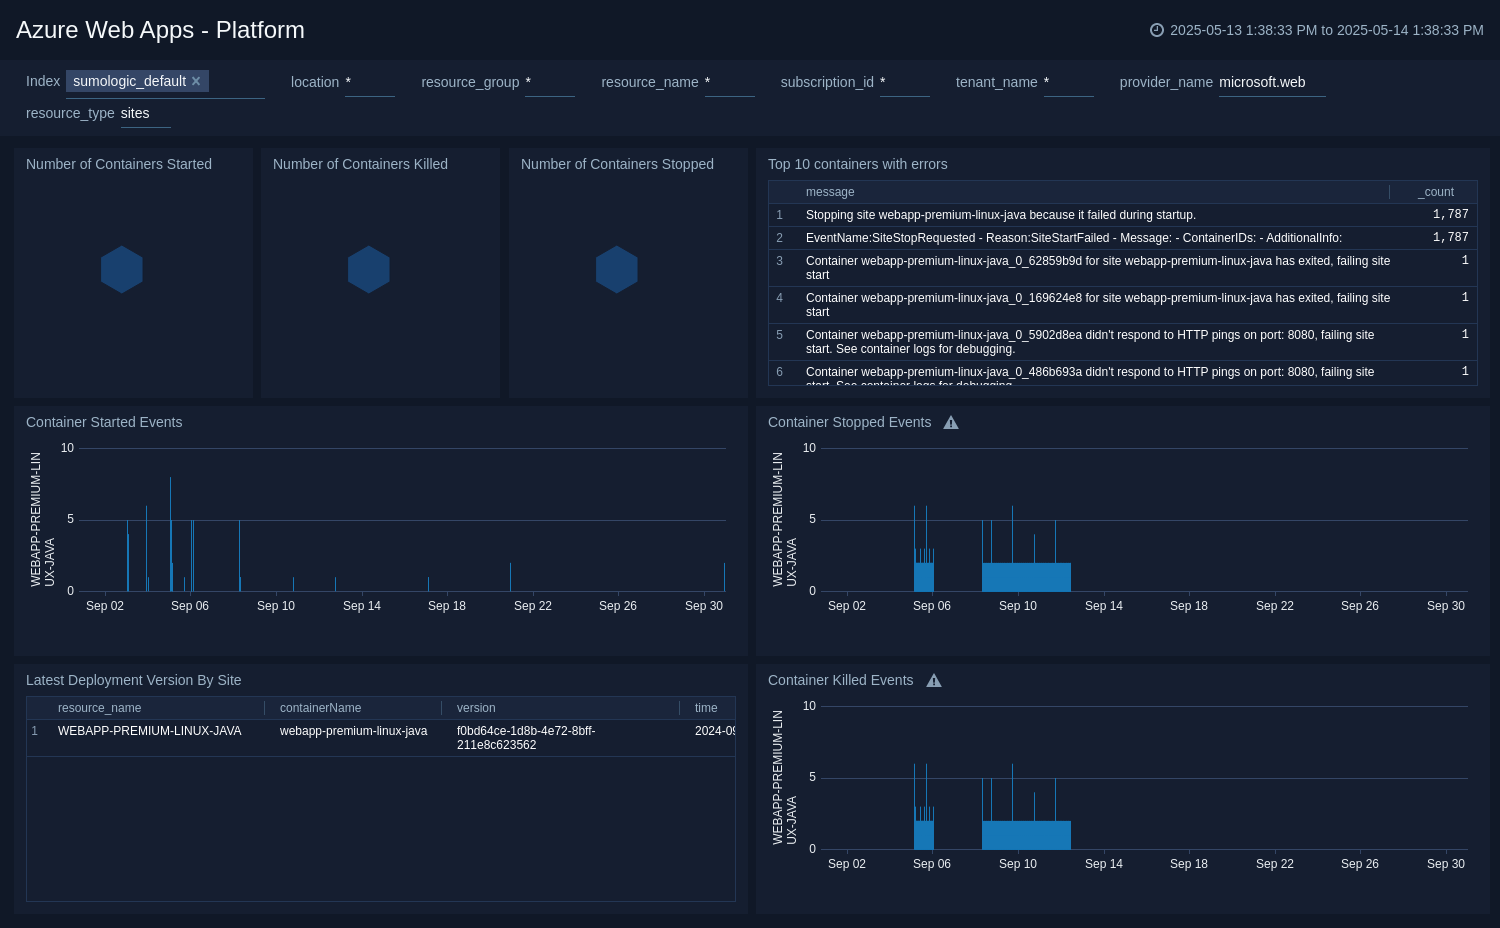
Platform
The Azure WebApps - Platform dashboard provides insights into the underlying platform performance and configurations of your Azure WebApps.
Use this dashboard to:
- Monitor platform health metrics and configurations.
- Identify trends and issues related to platform performance.
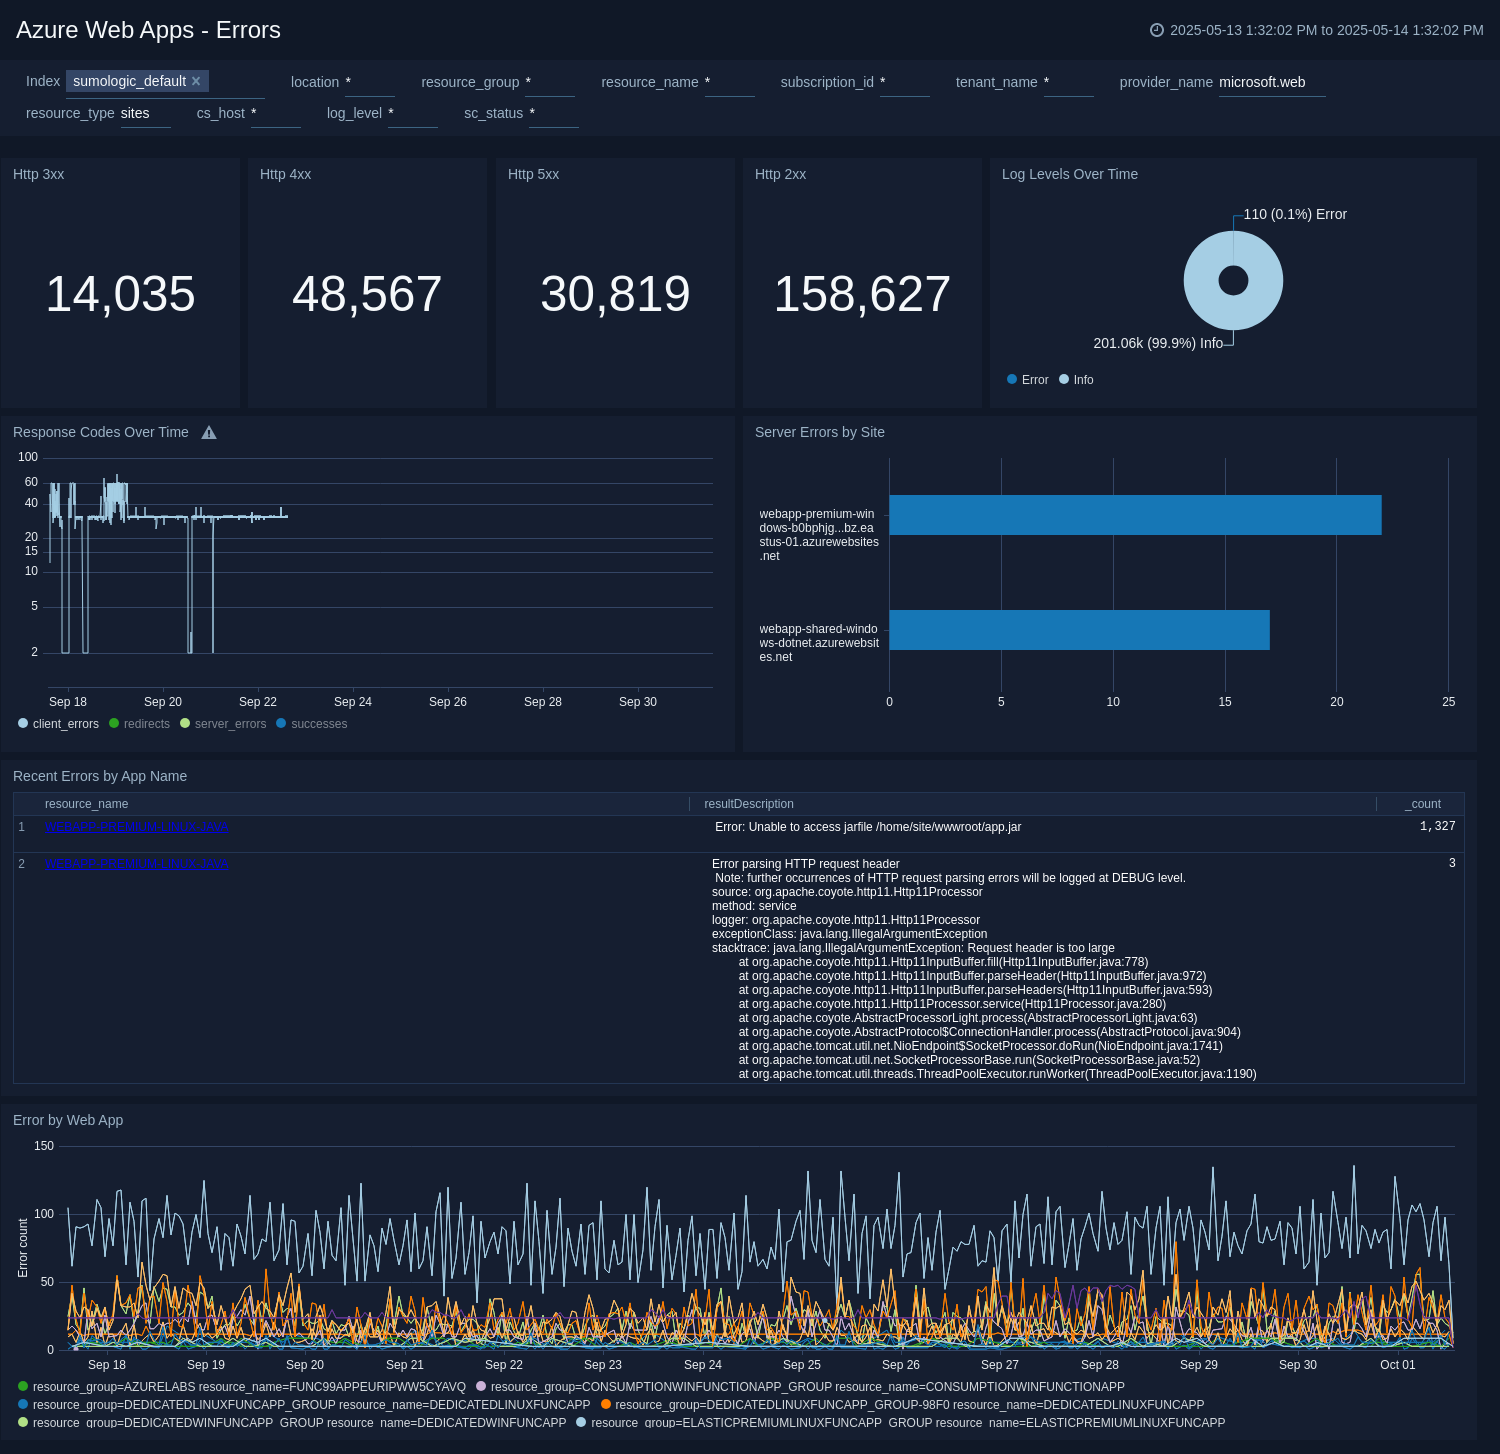
Errors
The Azure WebApps - Errors dashboard details the error rates and response codes generated by your Azure WebApps.
Use this dashboard to:
- Analyze error trends and response code distribution.
- Identify common issues affecting application performance.
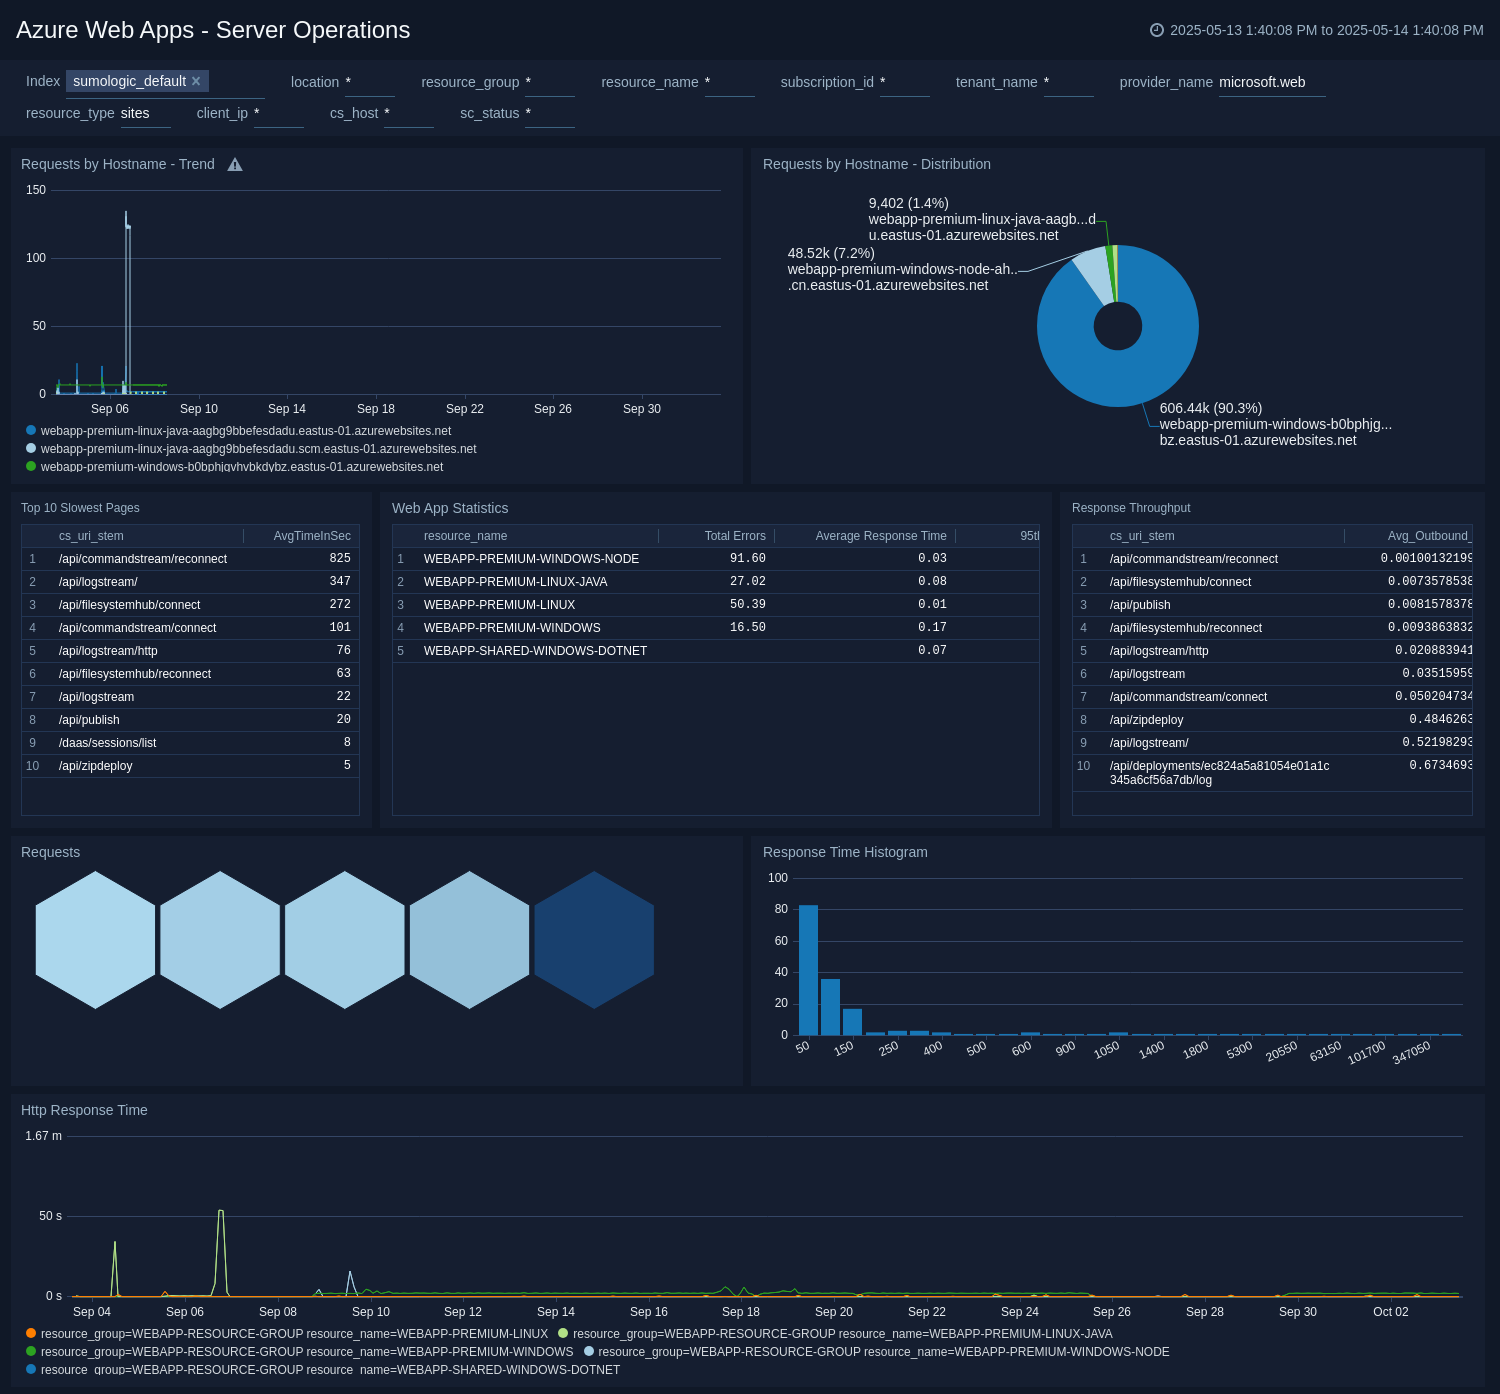
Server Operations
The Azure WebApps - Server Operations dashboard tracks request and response times for your Azure WebApps.
Use this dashboard to:
- Monitor performance metrics related to request and response times.
- Identify latency issues and optimize response performance.
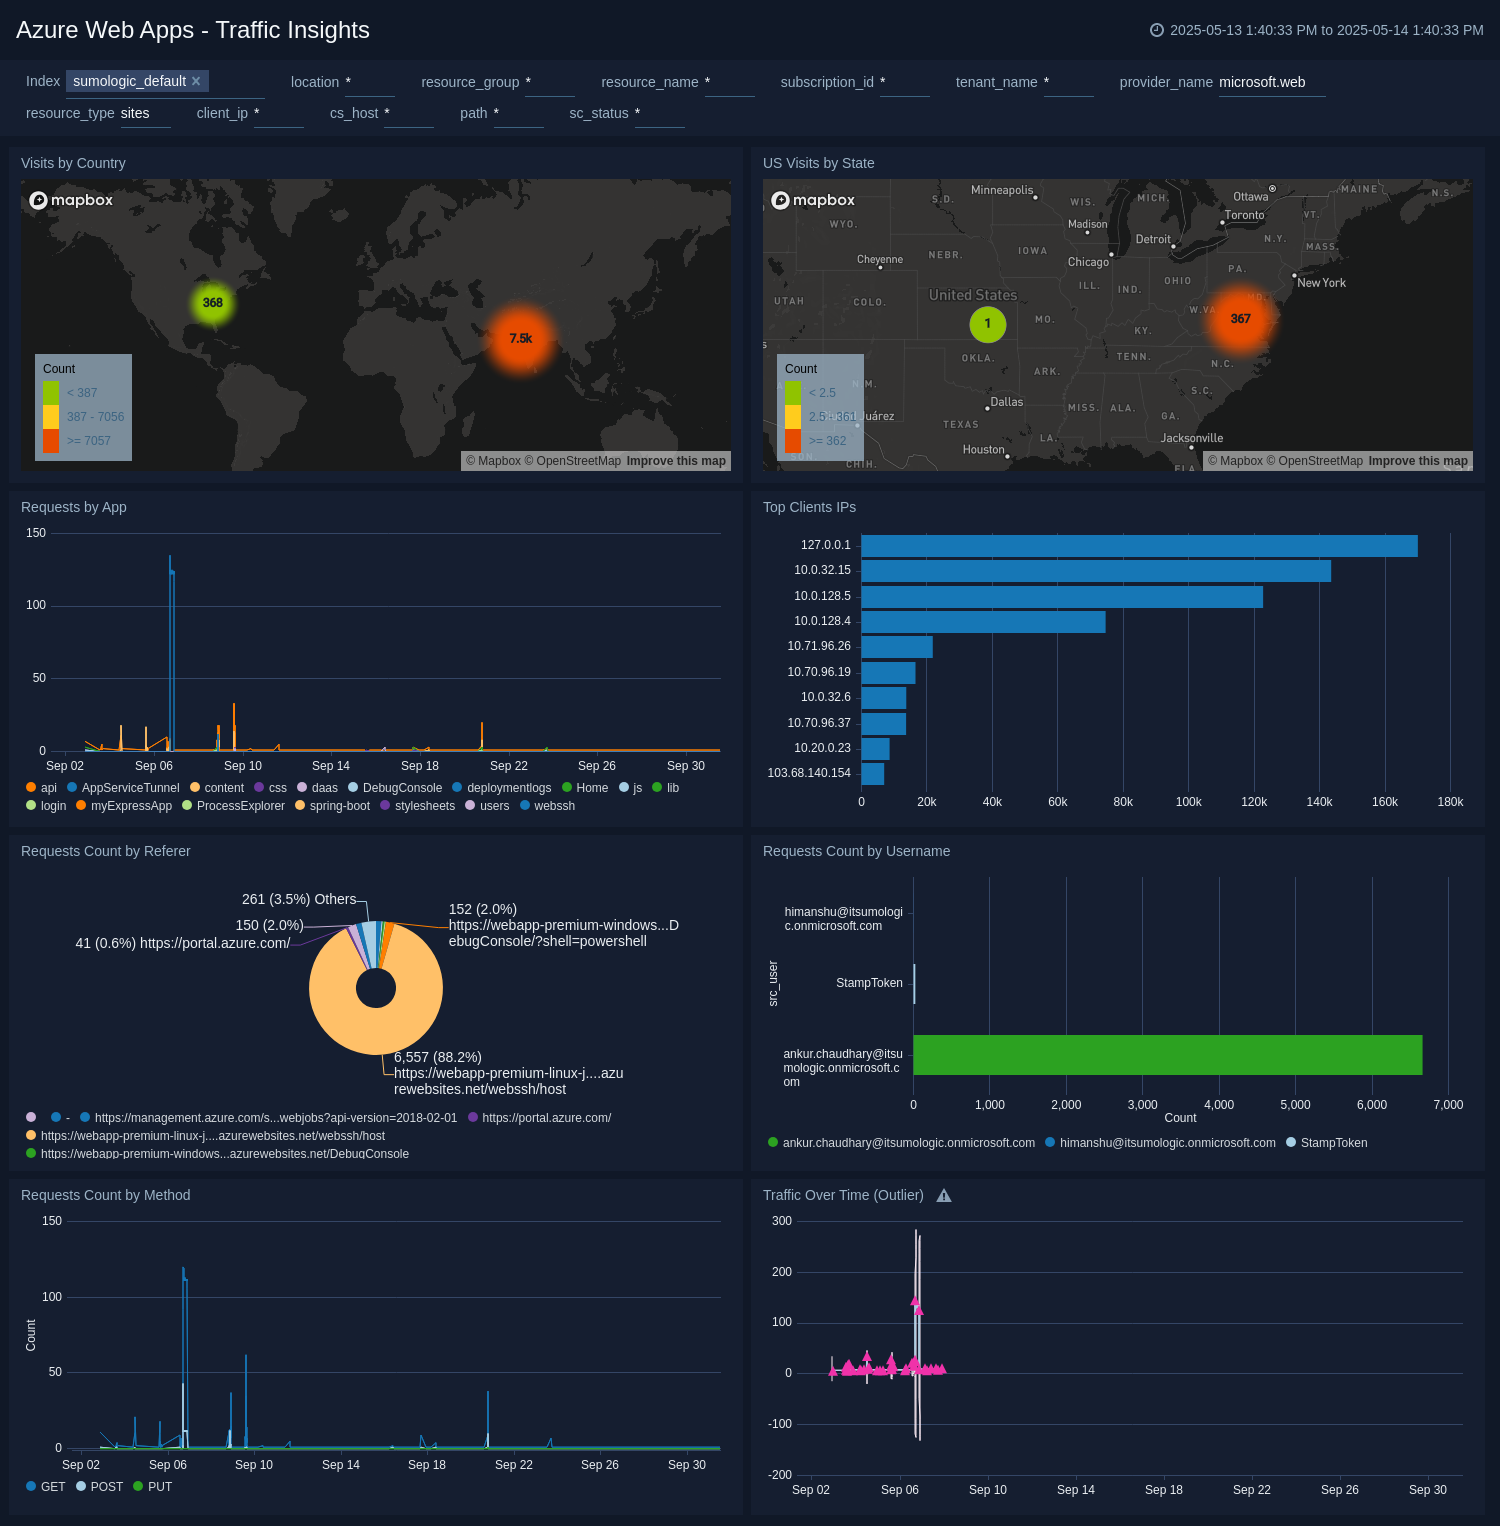
Traffic Insights
The Azure WebApps - Traffic Insights dashboard provides a comprehensive view of traffic patterns for your Azure WebApps.
Use this dashboard to:
- Analyze traffic metrics for different applications and requests.
- Identify usage trends and optimize application performance.
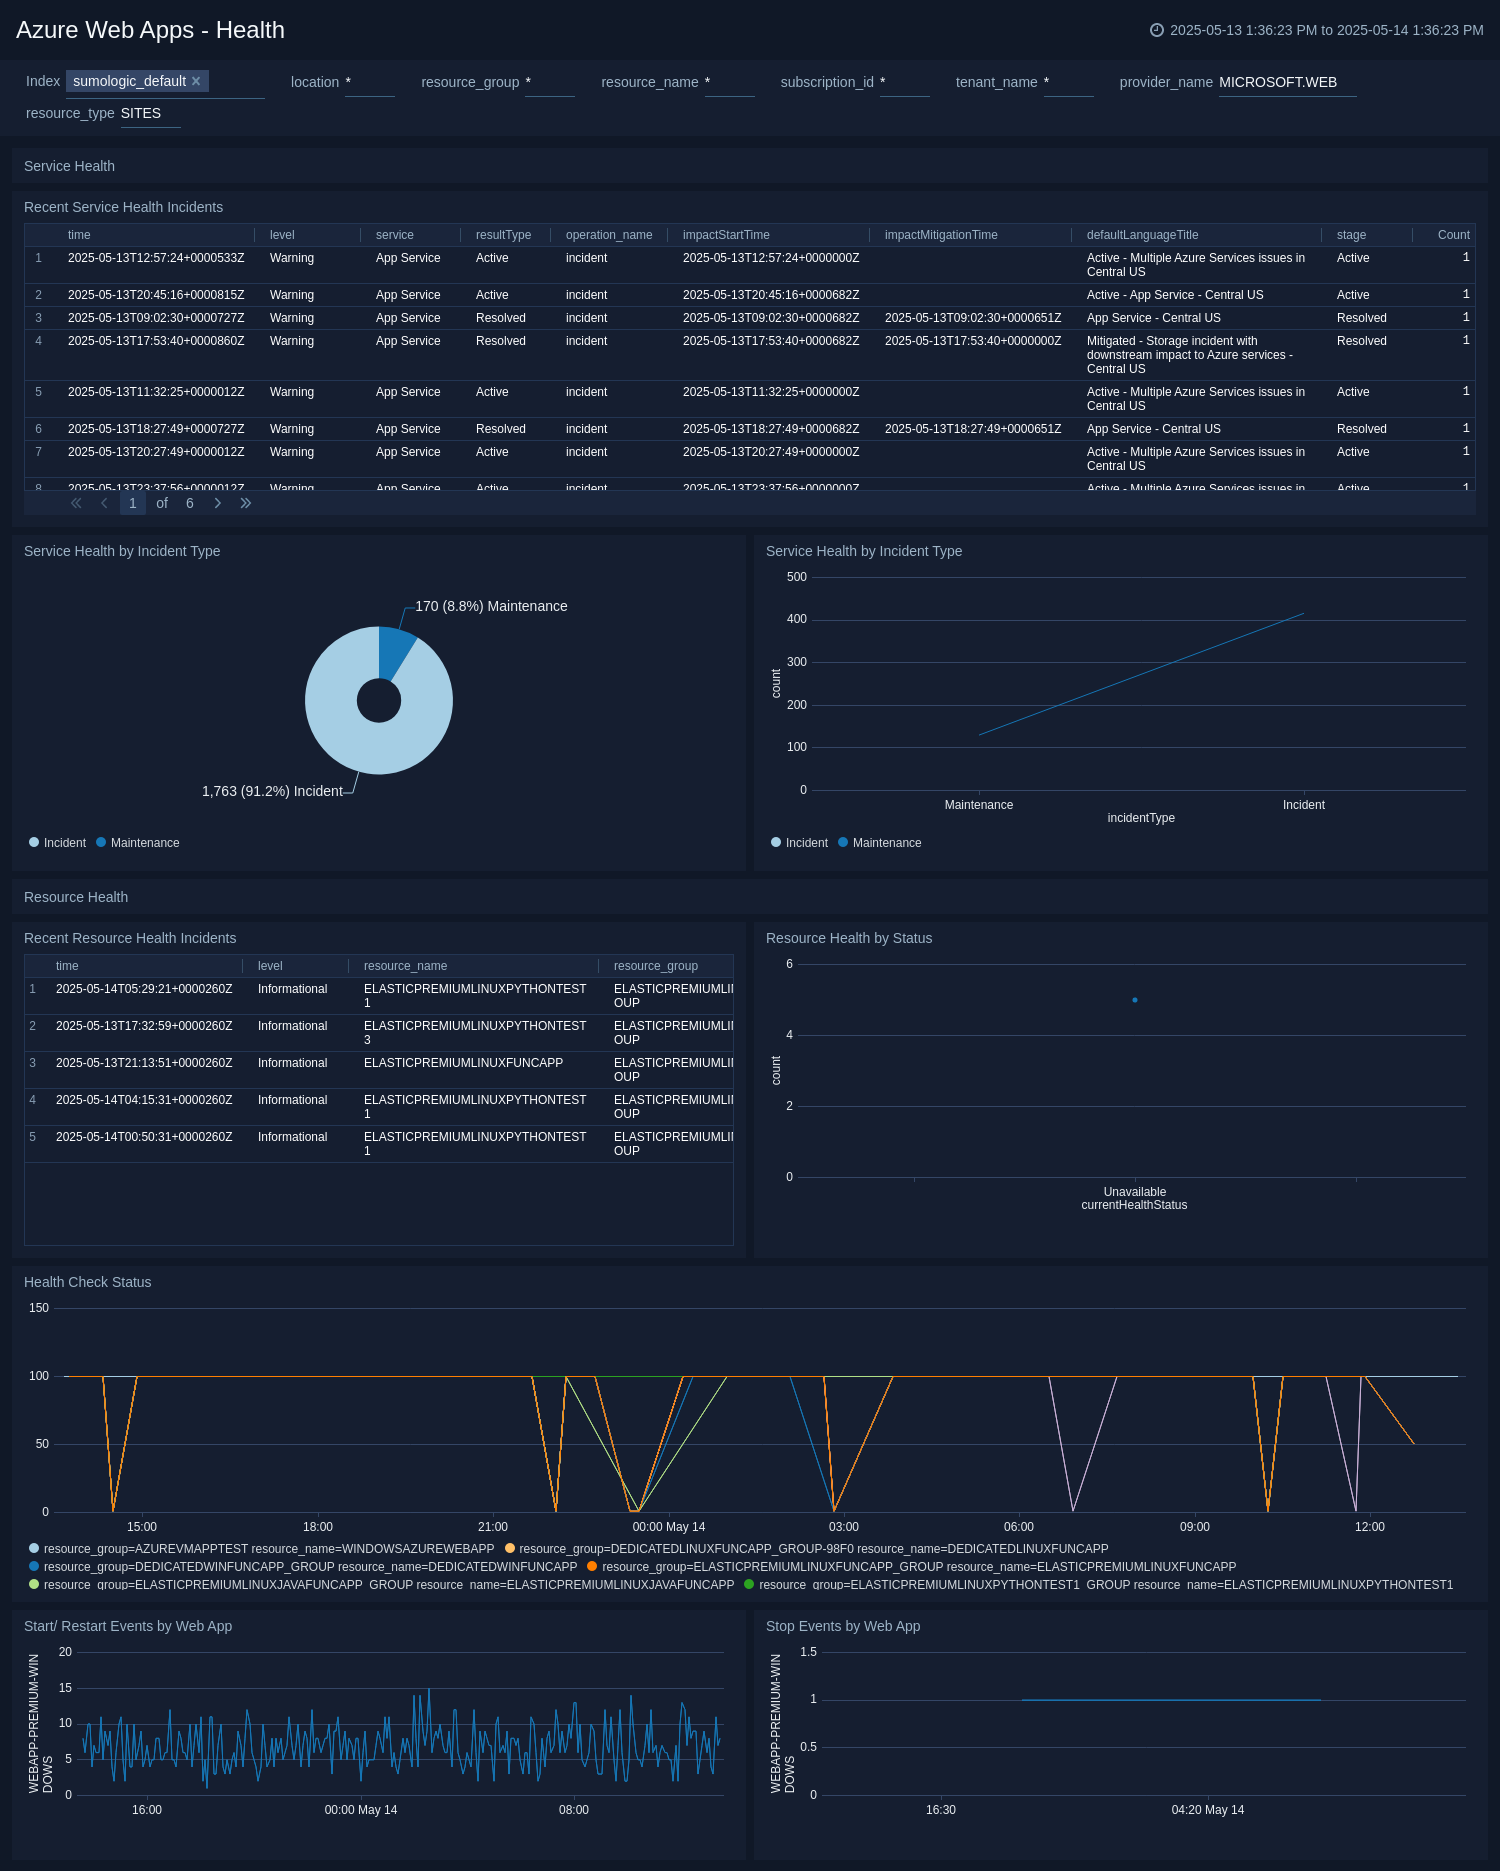
Health
The Azure WebApps - Health dashboard provides information of any service health incidents or resource health events associated with Azure WebApps in your azure account.
Use this dashboard to:
- View recent resource and service health incidents.
- View distribution of service and resource health by incident type.
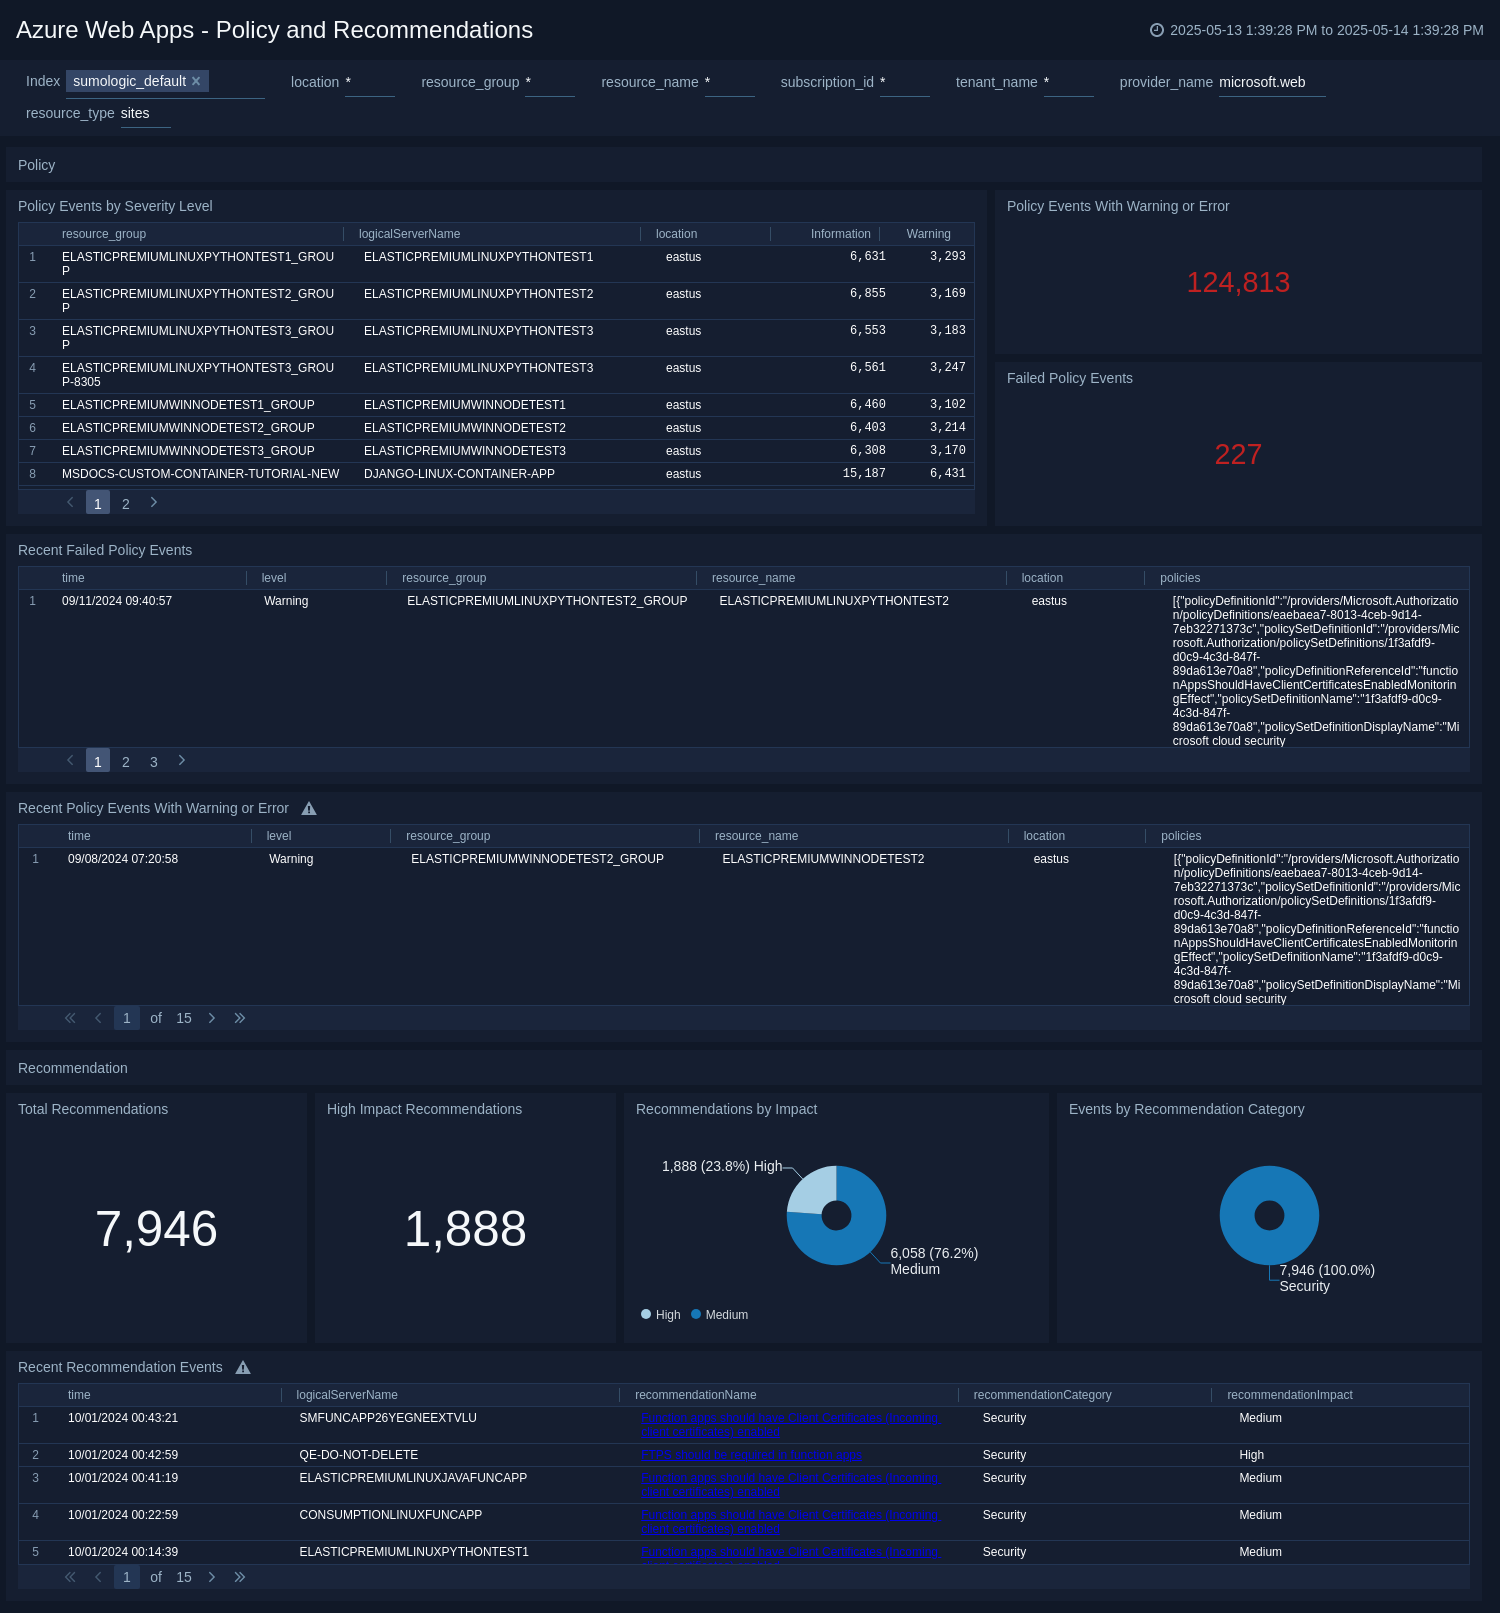
Policy and Recommendations
The Azure WebApps - Policy and Recommendations dashboard provides information of all effect action operations performed by Azure policy and recommendations events from Azure Advisor.
Use this dashboard to:
- Monitor policy events with warnings and errors.
- View recent failed policy events.
- View total recommendation events.
- Identify High Impact recommendations.
- View recent recommendation events and navigate to the affected resource.
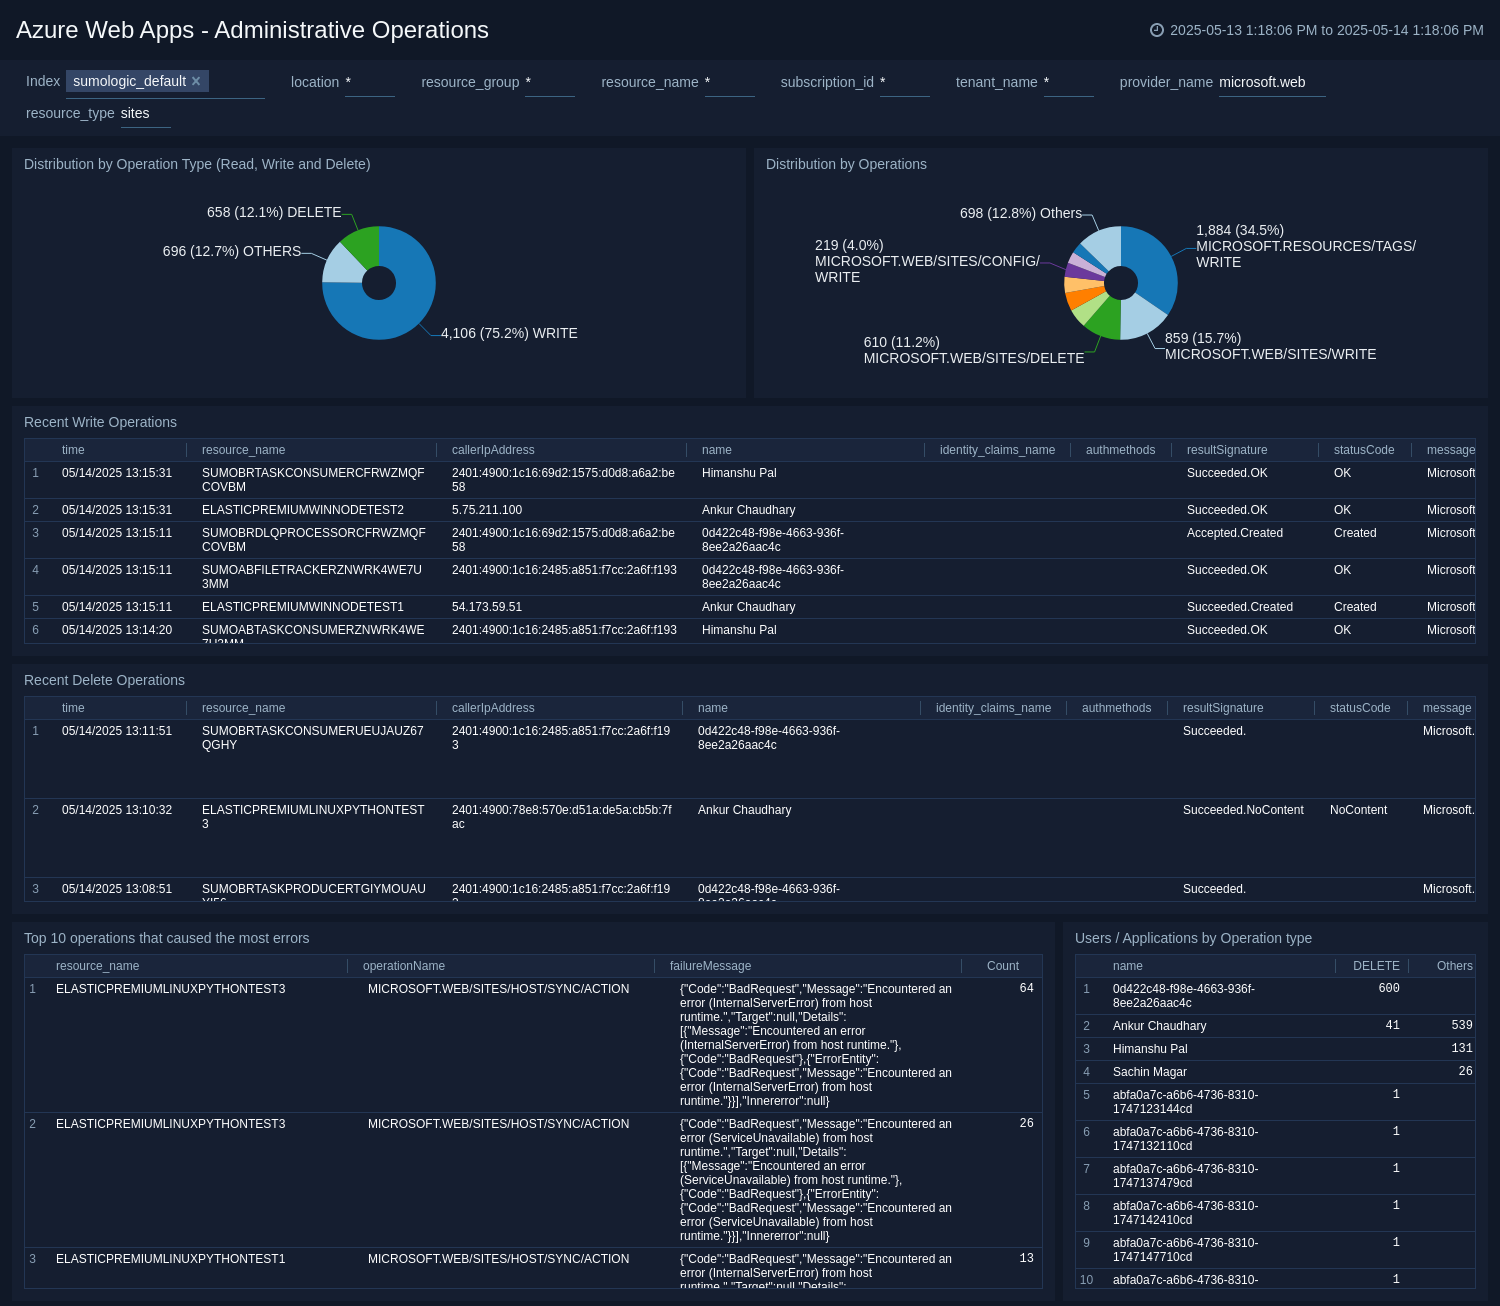
Administrative Operations
The Azure WebApps - Administrative Operations dashboard provides details on read/write/delete specific changes, different operations used, top 10 operations that caused most errors, and users performing admin operations.
Use this dashboard to:
- Identify top users performing administrative operations.
- View Top 10 operations that caused the most errors.
- View recent read, write, and delete operations.
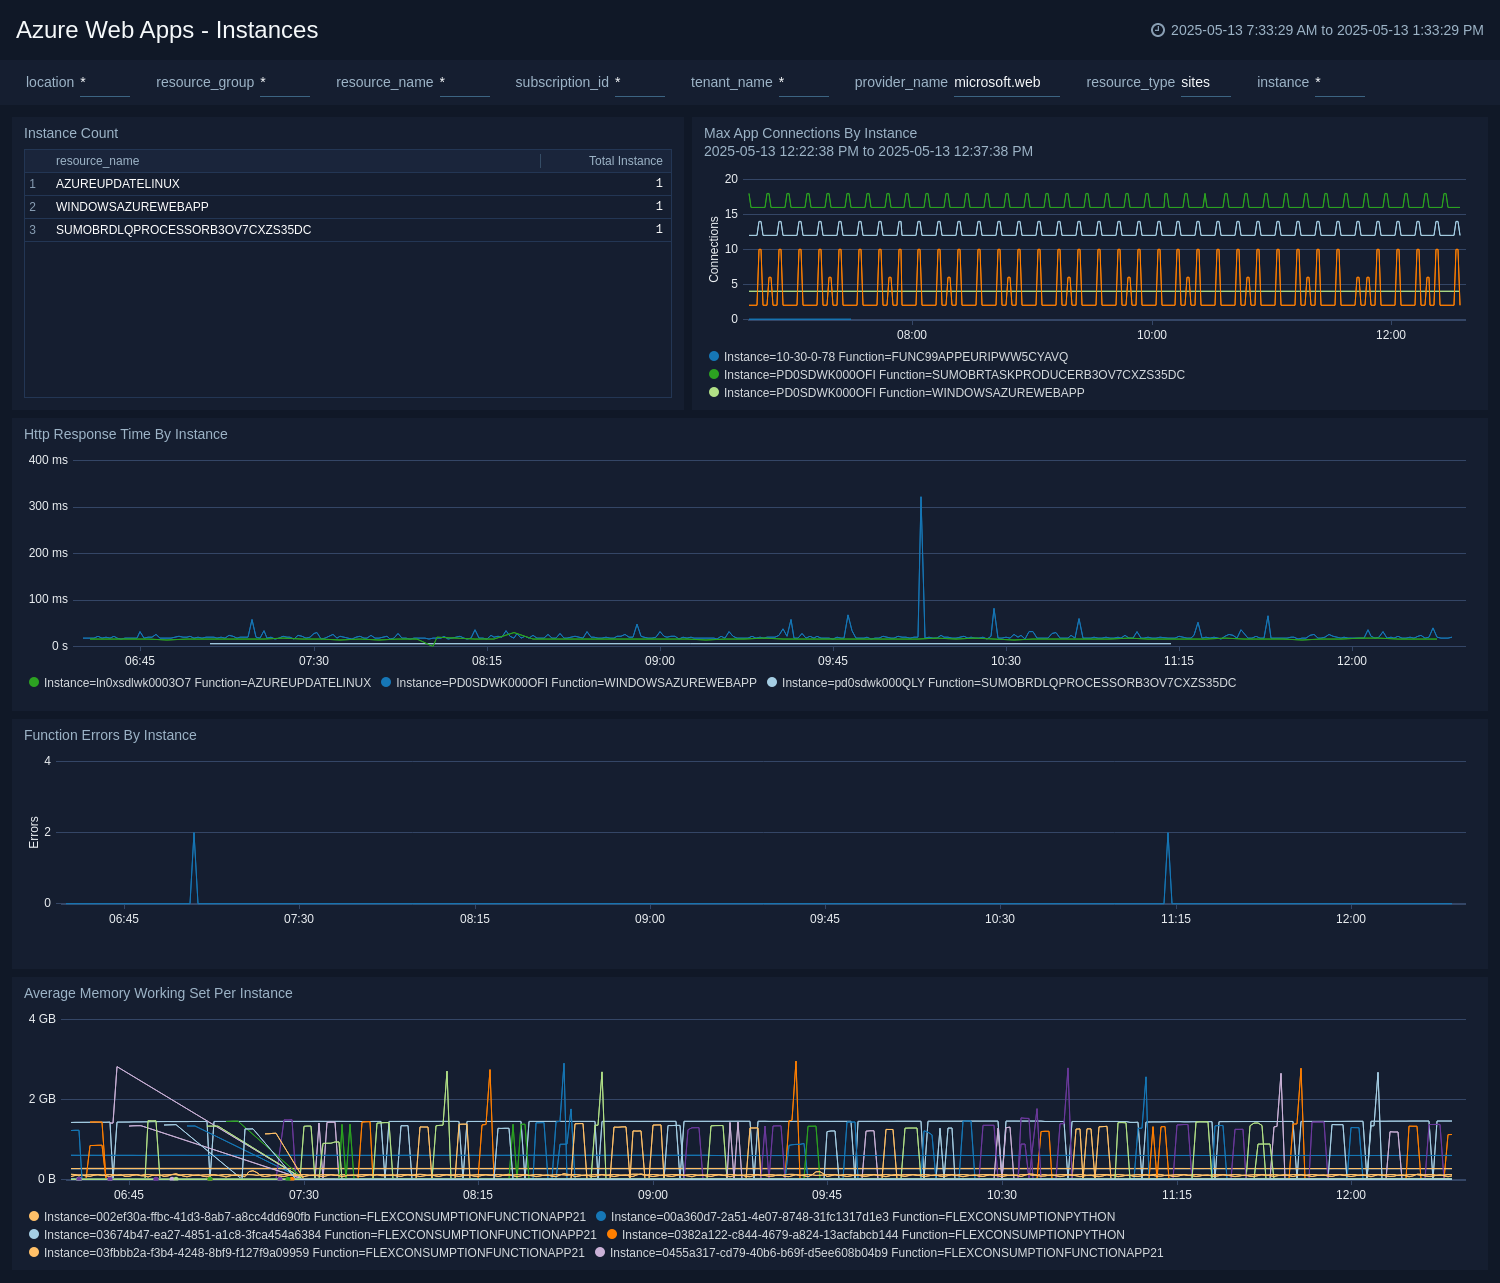
Instances
The Azure Web Apps - Instances dashboard provides information of all effect action details performed based on Azure Web Apps Instances.
Use this dashboard to:
- View recent resource usage and performance based on Instances.
- View distribution and service usage of resources by Instance.
Create monitors for Azure Web Apps app
From your App Catalog:
- From the Sumo Logic navigation, select App Catalog.
- In the Search Apps field, search for and then select your app.
- Make sure the app is installed.
- Navigate to What's Included tab and scroll down to the Monitors section.
- Click Create next to the pre-configured monitors. In the create monitors window, adjust the trigger conditions and notifications settings based on your requirements.
- Scroll down to Monitor Details.
- Under Location click on New Folder.
note
By default, monitor will be saved in the root folder. So to make the maintenance easier, create a new folder in the location of your choice.
- Enter Folder Name. Folder Description is optional.
tip
Using app version in the folder name will be helpful to determine the versioning for future updates.
- Click Create. Once the folder is created, click on Save.
Azure Web Apps alerts
These alerts are metrics-based and will work for all Web Apps.
| Alert Name | Description | Alert Condition | Recover Condition |
|---|---|---|---|
Azure Web Apps - Average Response Time | This alert gets triggered when there is high response time detected in any Azure Function. | Count < 1 | Count >= 1 |
Azure Web Apps - Delete function app | This alert gets triggered when a function app is deleted. | Count >= 1 | Count < 1 |
Azure Web Apps - Health Check Status | This alert gets triggered when there is Health Check Status average drops less than 100. | Count < 100 | Count >= 100 |
Azure Web Apps - Http 4xx Error | This alert gets triggered when HTTP 4xx errors are high in the Azure Web Apps. | Count > 25 | Count =< 25 |
Azure Web Apps - Https Server Error | This alert gets triggered when HTTP 5xx errors are high in the Azure Web Apps. | Count > 25 | Count =< 25 |
Upgrade/Downgrade the Azure Web Apps app (Optional)
To update the app, do the following:
Next-Gen App: To install or update the app, you must be an account administrator or a user with Manage Apps, Manage Monitors, Manage Fields, Manage Metric Rules, and Manage Collectors capabilities depending upon the different content types part of the app.
- Select App Catalog.
- In the Search Apps field, search for and then select your app.
Optionally, you can identify apps that can be upgraded in the Upgrade available section. - To upgrade the app, select Upgrade from the Manage dropdown.
- If the upgrade does not have any configuration or property changes, you will be redirected to the Preview & Done section.
- If the upgrade has any configuration or property changes, you will be redirected to the Setup Data page.
- In the Configure section of your respective app, complete the following fields.
- Field Name. If you already have collectors and sources set up, select the configured metadata field name (eg _sourcecategory) or specify other custom metadata (eg: _collector) along with its metadata Field Value.
- Click Next. You will be redirected to the Preview & Done section.
Post-update
Your upgraded app will be installed in the Installed Apps folder and dashboard panels will start to fill automatically.
See our Release Notes changelog for new updates in the app.
To revert the app to a previous version, do the following:
- Select App Catalog.
- In the Search Apps field, search for and then select your app.
- To version down the app, select Revert to < previous version of your app > from the Manage dropdown.
Uninstalling the Azure Web Apps app (Optional)
To uninstall the app, do the following:
- Select App Catalog.
- In the 🔎 Search Apps field, run a search for your desired app, then select it.
- Click Uninstall.
Troubleshooting
Metrics collection via Azure Metrics Source
To troubleshoot metrics collection via Azure Metrics Source, follow the instructions in Troubleshooting Azure Metrics Source.