PCI Compliance for Linux
This guide helps you set up Sumo Logic Collectors, install the PCI Compliance for Linux app, and create dashboards from samples so you can begin monitoring your usage and determine if you are meeting Compliance benchmarks.
Collect logs for PCI Compliance for Linux
The PCI Compliance for Linux app works with your existing Linux logs to identify any compliance issues.
To collect Linux logs, you'll need:
- An Installed Collector. Choose the one right for your host environment.
- A Linux Source, depending on your environment.
Required logs for Ubuntu
The following logs, located in your Linux machine's /var/log folder, are required for using the Sumo Logic app for Linux with Ubuntu:
- auth.log
- syslog
- daemon.log
- dpkg.log
- kern.log
Required logs for CentOS, Amazon Linux, and Red Hat
The following logs, located in your Linux machine's /var/log folder, are required for using the Sumo Logic app for Linux with CentOS, Amazon Linux, and most Red Hat forks:
- audit/audit.log
- secure
- messages
- yum.log
Installing the PCI Compliance for Linux app
To install the app, do the following:
Next-Gen App: To install or update the app, you must be an account administrator or a user with Manage Apps, Manage Monitors, Manage Fields, Manage Metric Rules, and Manage Collectors capabilities depending upon the different content types part of the app.
- Select App Catalog.
- In the 🔎 Search Apps field, run a search for your desired app, then select it.
- Click Install App.
note
Sometimes this button says Add Integration.
- Click Next in the Setup Data section.
- In the Configure section of your respective app, complete the following fields.
- Field Name. If you already have collectors and sources set up, select the configured metadata field name (eg _sourcecategory) or specify other custom metadata (eg: _collector) along with its metadata Field Value.
- Click Next. You will be redirected to the Preview & Done section.
Post-installation
Once your app is installed, it will appear in your Installed Apps folder, and dashboard panels will start to fill automatically.
Each panel slowly fills with data matching the time range query received since the panel was created. Results will not immediately be available but will be updated with full graphs and charts over time.
Viewing PCI Compliance for Linux dashboards
All dashboards have a set of filters that you can apply to the entire dashboard. Use these filters to drill down and examine the data to a granular level.
- You can change the time range for a dashboard or panel by selecting a predefined interval from a drop-down list, choosing a recently used time range, or specifying custom dates and times. Learn more.
- You can use template variables to drill down and examine the data on a granular level. For more information, see Filtering Dashboards with Template Variables.
- Most Next-Gen apps allow you to provide the scope at the installation time and are comprised of a key (
_sourceCategoryby default) and a default value for this key. Based on your input, the app dashboards will be parameterized with a dashboard variable, allowing you to change the dataset queried by all panels. This eliminates the need to create multiple copies of the same dashboard with different queries.
Account, User, System Monitoring
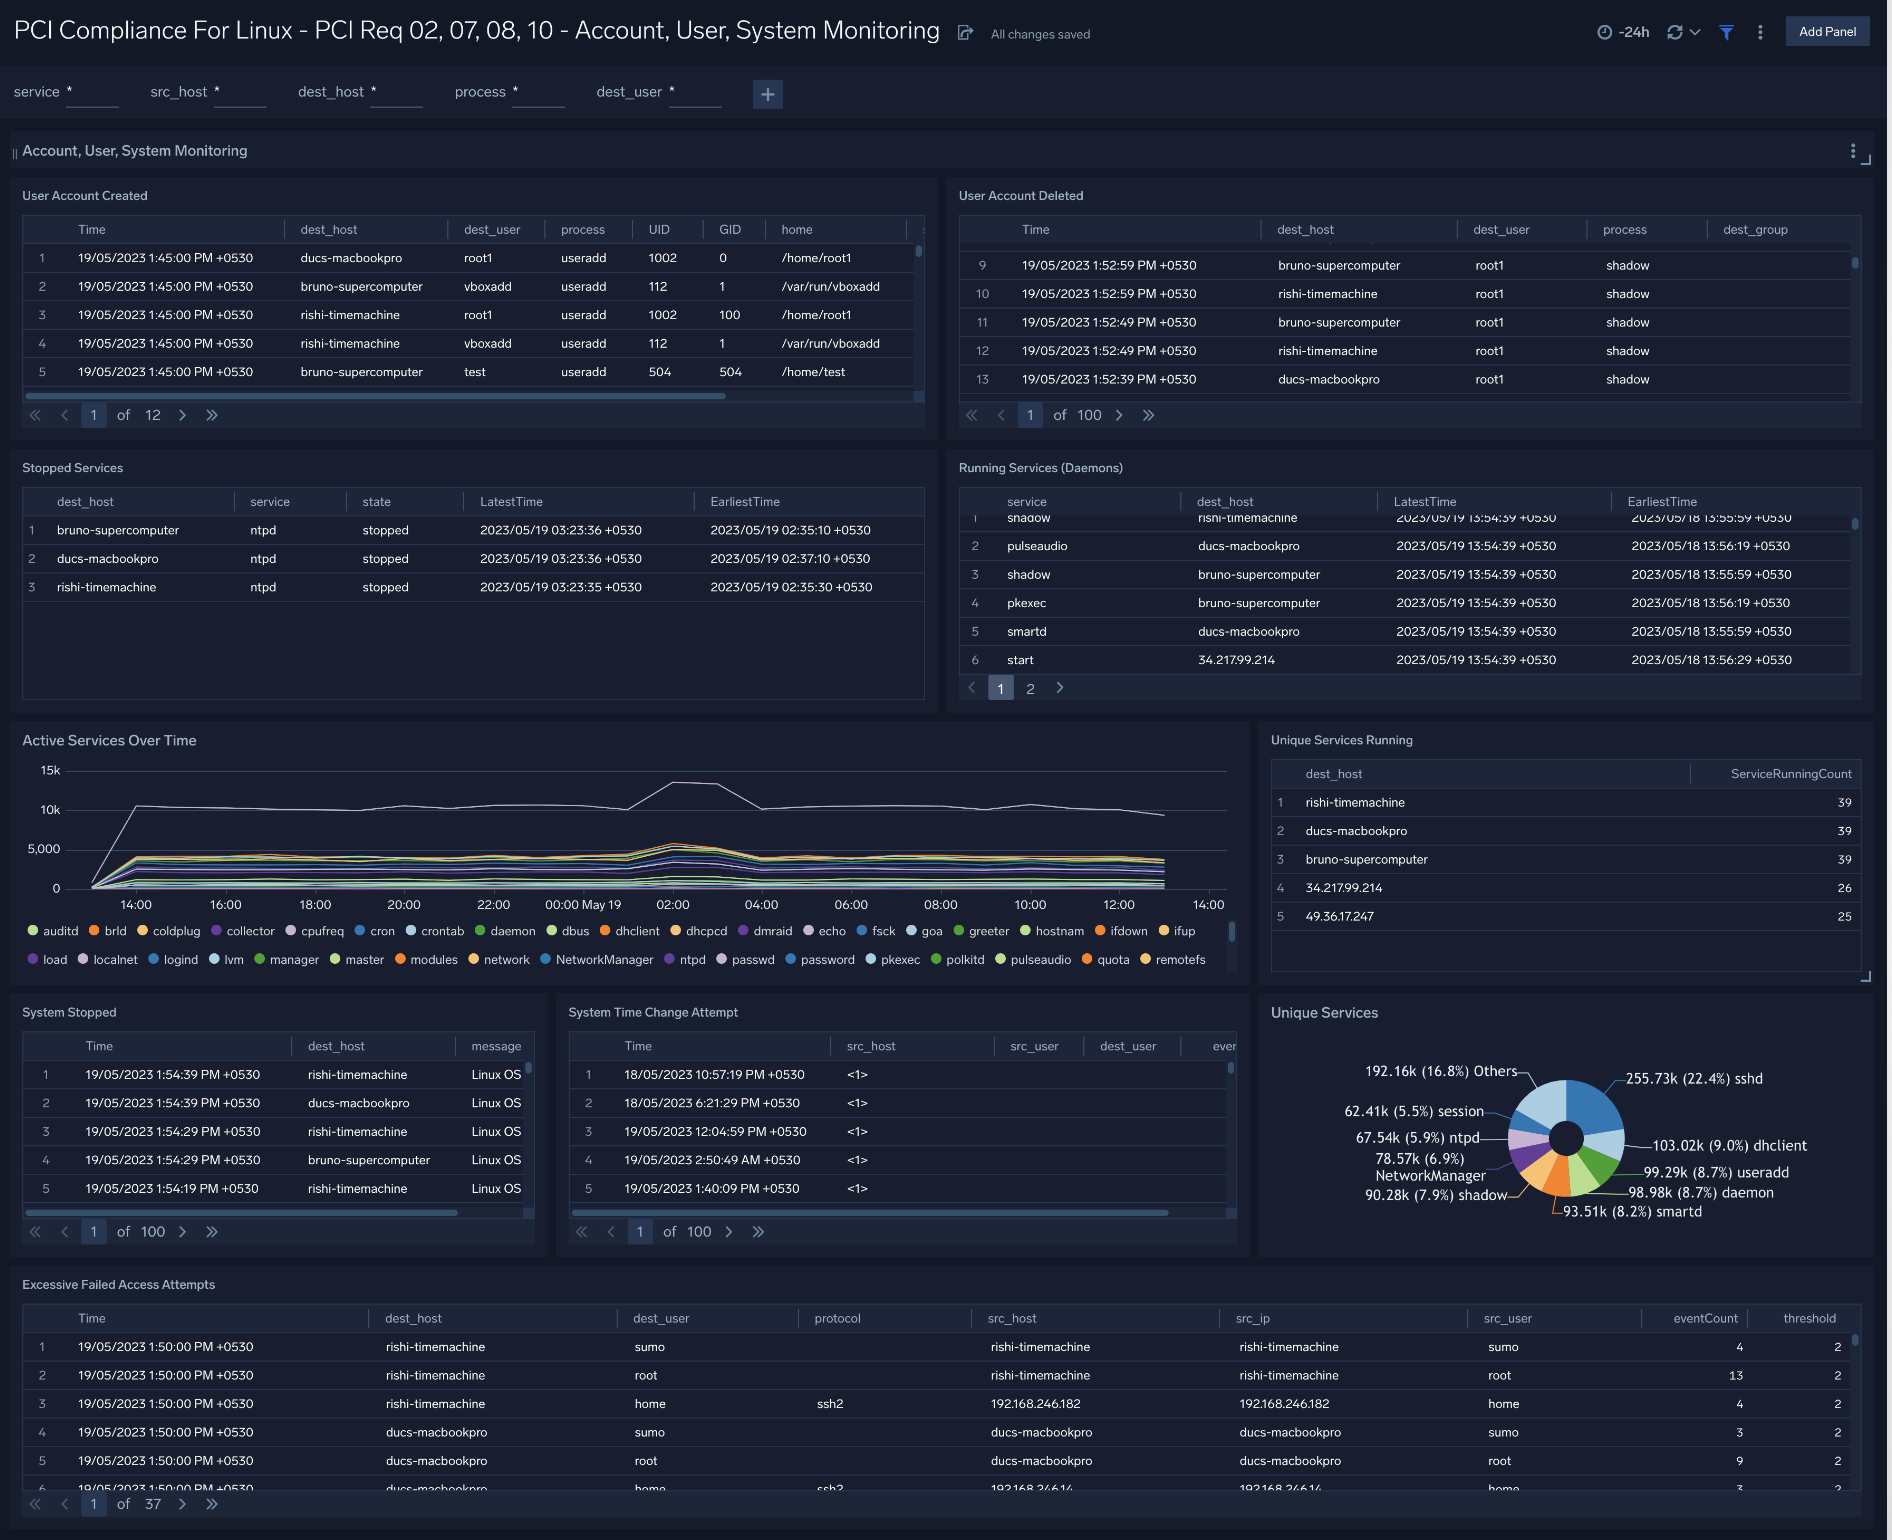
Dashboard description: This dashboard meets PCI Requirements 02, 07, 08 and 10 by monitoring user accounts and services. It presents information about user accounts created and deleted, stopped services, running services active services over time, unique services running, and running services, and more.
Use case. Use this dashboard to monitor administrative actions (create, delete users) performed by end users, ensure proper services are running on all systems, detect attempts to change the system time, and verify that critical systems are up and running.You can also monitor excessive failed login attempts to detect attempts to break into the system.
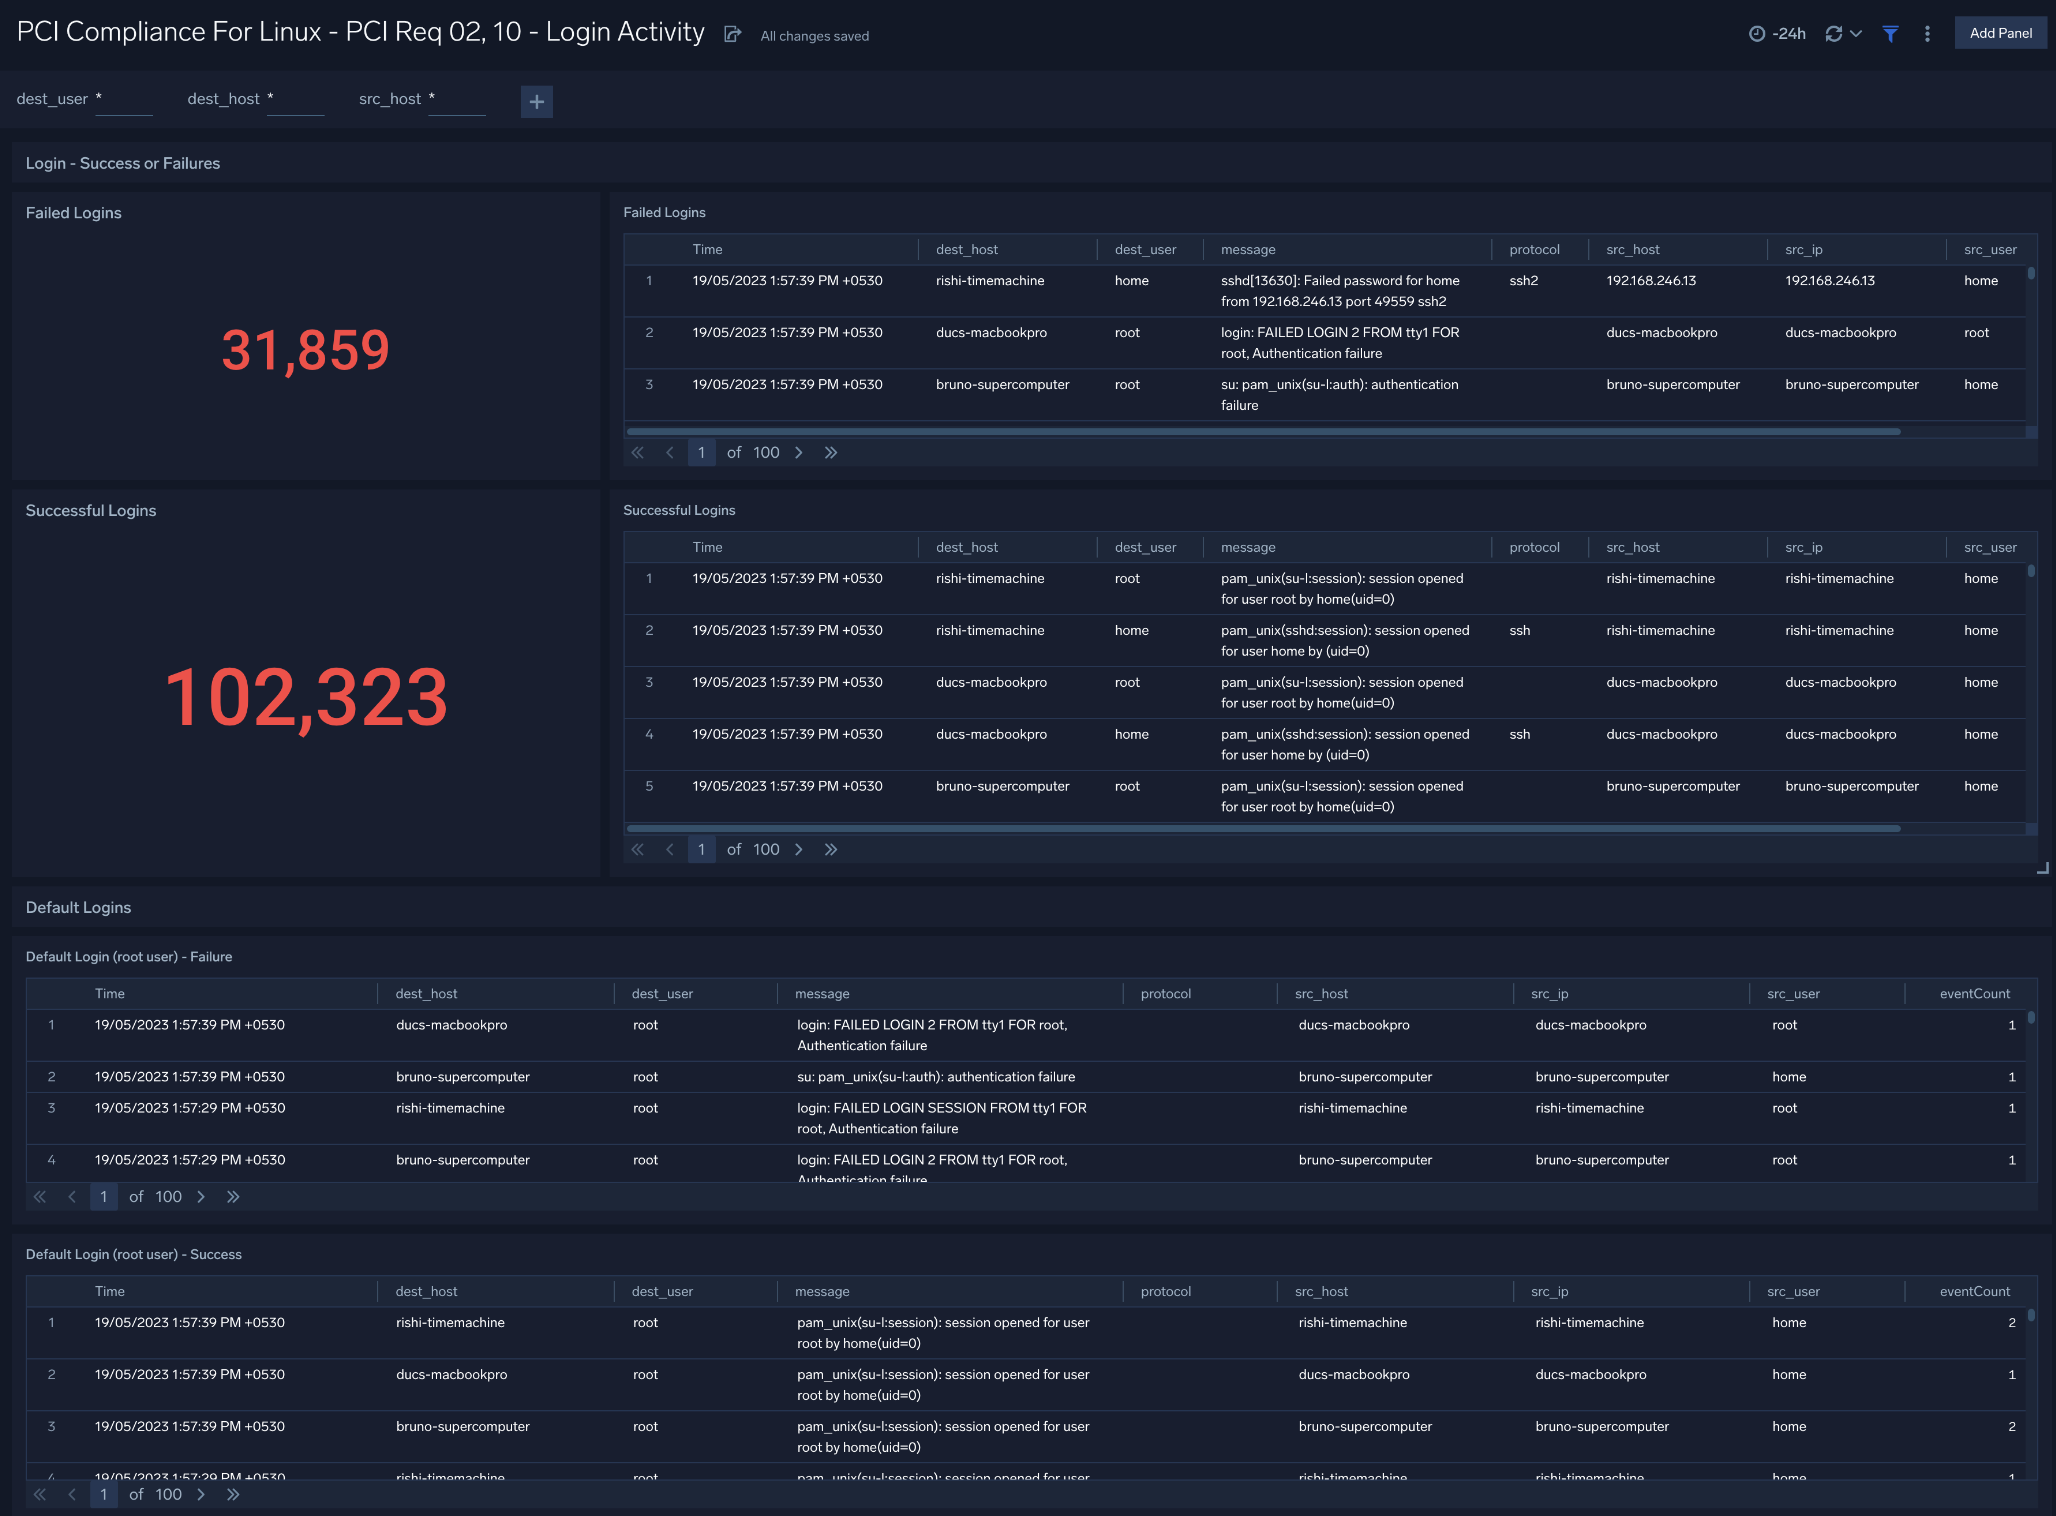
Login Activity
Dashboard description: This dashboard meets PCI Requirements 02 and 10 by tracking login activity. It provides information about failed and successful user logins, and failed and successful super-user logins.
Use case: Use this dashboard to monitor access to the cardholder data environment. You can monitor failed and successful user logins.
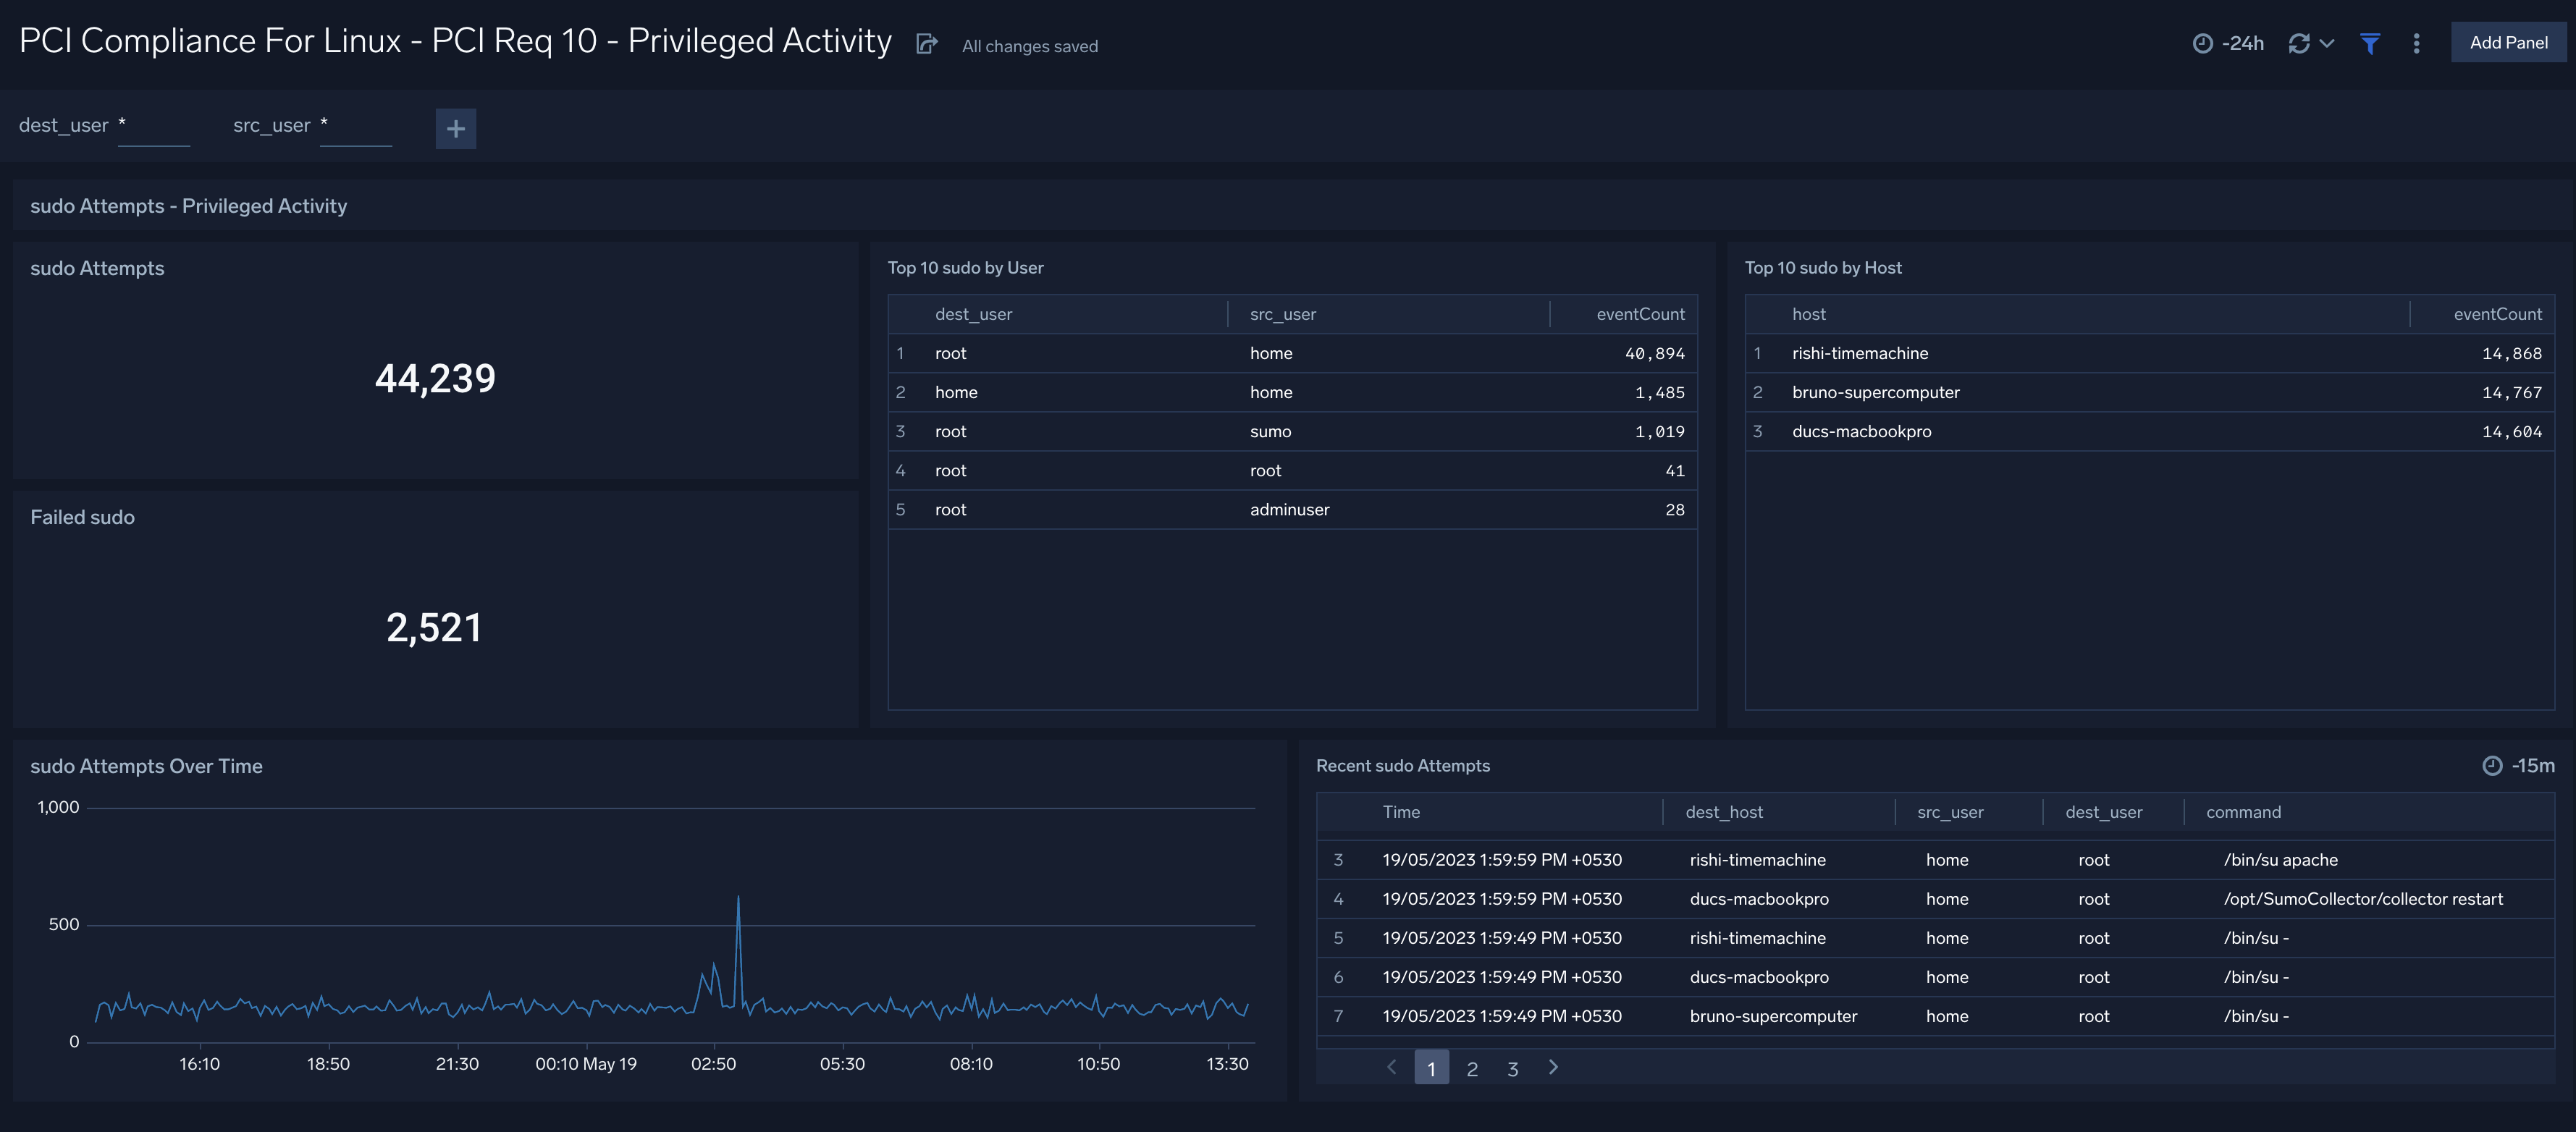
Privileged Activity
Dashboard description: This dashboard meets PCI Requirement 10. It provides information about total sudo attempts, failed sudo attempts, the top 10 users and hosts that have issued sudo attempts, recent sudo attempts, and sudo attempts over time.
Use case. Use this dashboard to monitor successful and failed access attempts to systems, especially with administrative privileges. It also helps you to monitor actions performed by users with administrative privileges.
Upgrade/Downgrade the PCI Compliance for Linux app (Optional)
To update the app, do the following:
Next-Gen App: To install or update the app, you must be an account administrator or a user with Manage Apps, Manage Monitors, Manage Fields, Manage Metric Rules, and Manage Collectors capabilities depending upon the different content types part of the app.
- Select App Catalog.
- In the Search Apps field, search for and then select your app.
Optionally, you can identify apps that can be upgraded in the Upgrade available section. - To upgrade the app, select Upgrade from the Manage dropdown.
- If the upgrade does not have any configuration or property changes, you will be redirected to the Preview & Done section.
- If the upgrade has any configuration or property changes, you will be redirected to the Setup Data page.
- In the Configure section of your respective app, complete the following fields.
- Field Name. If you already have collectors and sources set up, select the configured metadata field name (eg _sourcecategory) or specify other custom metadata (eg: _collector) along with its metadata Field Value.
- Click Next. You will be redirected to the Preview & Done section.
Post-update
Your upgraded app will be installed in the Installed Apps folder and dashboard panels will start to fill automatically.
See our Release Notes changelog for new updates in the app.
To revert the app to a previous version, do the following:
- Select App Catalog.
- In the Search Apps field, search for and then select your app.
- To version down the app, select Revert to < previous version of your app > from the Manage dropdown.
Uninstalling the PCI Compliance for Linux app (Optional)
To uninstall the app, do the following:
- Select App Catalog.
- In the 🔎 Search Apps field, run a search for your desired app, then select it.
- Click Uninstall.