Acquia

The Sumo Logic App for Acquia provides visibility into the key components of the Acquia platform with preconfigured dashboards for Apache, Varnish, PHP, FPM and Drupal.
Sumo Logic provides instant visibility across the critical components of the Acquia Platform, helping organizations become more proactive in their site monitoring as well as reducing the mean time to identify and resolve issues.
Log types
Sumo Logic analyzes the following required Acquia data for more efficient monitoring:
- Apache access logs
- Apache error log
- Drupal request log
- Drupal watchdog log
- FPM access logs
- FPM error logs
- PHP error logs
- Varnish request logs
Log samples
This section provides sample log messages for the following log types that are required Acquia data for more efficient monitoring.
200.0.0.1 - - [04/Jan/2017:23:20:38 +0000] "GET /contact_us HTTP/1.1" 404 10117 "-"
"Pingdom.com bot version 1.4 (http://www.pingdom.com/)" vhost=alphabeta.prod.acquia-sites.com
host=www.example.com hosting_site=alphabeta pid=26731 request_time=10186417 forwarded_for="200.0.0.1,
162.0.0.1" request_id="v-00000zzz-d2d4-11e6-9bed-0aeea9eaf9af" location="http://apache.example.com/"
[Fri Aug 18 20:40:36.849360 2017] [access_compat:error] [pid 11069]
[client 10.0.0.1:19924] AH01797: client denied by server configuration:
/var/www/html/alphabeta/docroot/index.php
[03/Feb/2017:00:14:36 +0000] www.example.com POST /dashboard
http_code=302 query= uid=154496 php_pid=30961 php_time=0.203 queue_wait=0
request_id="v-0000zzzz-e9a5-11e6-98b5-0aeea9eaf9af"
Aug 18 21:22:01 10.0.0.1 alphabeta: https://www.example.com|1503091321|
custom_module|151.0.0.1|https://example.com/documents||0||Warning: Invalid
argument supplied for foreach() in views_join->build_join
request_id="v-00000000-845b-0000-8178-22000ab832c9"
- -  25/Sep/2018:17:02:35 +0000 "GET /index.php" 200 memory_kb=6144 %cpu=9.16 duration_ms=218.423
request_id="v-00000000-1111-2222-3333-444444444444"
[04-Jan-2017 18:45:13] NOTICE: [pool alphabeta] child 20069 exited with code
0 after 3832.234353 seconds from start
[04-Jan-2017 14:29:27 America/New_York] PHP Fatal error:  Allowed memory
size of 367001600 bytes exhausted (tried to allocate 352591872 bytes) in
/full/path/to/module/notification.php on line 504
request_id="v-0000zzzz-d2b4-0000-b3a4-129zzzzd8266"
{
  "time":"[12/Dec/2018:23:59:59 +0000]",
  "status":"304",
  "bytes":"0",
  "method":"GET",
  "host":"website.example.com",
  "url":"/path/to/page",
  "referrer":"-",
  "user_agent":"Browser Name Here",
  "client_ip":"10.0.1.3",
  "time_firstbyte":"0.000241",
  "hitmiss":"hit",
  "handling":"hit",
  "forwarded_for":"10.0.1.3, 127.255.255.255",
  "request_id":"v-00000000-ffff-1111-aaaa-111111111111",
  "ah_log":"",
  "ah_application_id":"bbbbbbbb-3333-4444-9999-bbbbbbbbbbbb",
  "ah_environment":"prod",
  "ah_trace_id":"ZZZZZZZZZZZZZZ"
}
Sample queries
This section provides examples for Drupal request, Apache access, and PHP error queries.
_sourceCategory=Labs/Acquia drupal-requests
| parse "<133>1 * * *.* - - - [*] * * * http_code=* query=* uid=* php_pid=* php_time=* queue_wait=*
request_id=\"*\"" as timestamp,lb,host,logtype,time,appurl,method,url,http_code,query,uid,php_id,
php_time,queue_wait,request_id
| timeslice 1m
| count by _timeslice, http_code
| transpose row _timeslice column http_code as *
_sourceCategory=Labs/Acquia apache-access
| parse " - - - * - - [*] \"* * HTTP/1.1\" * * \"*\" \"*\" vhost=* host=* hosting_site=* pid=*
request_time=* forwarded_for=\"*\" request_id=\"*\" location=\"*\"" as src_ip,timestamp,method,
url,status_code,size,referrer,user_agent,vhost,host,hosting_site,pid,request_time,forwarded_for,
request_id,location
| where !(status_code matches "2*")
_sourceCategory=Labs/Acquia php-errors
| parse "* * * * - - - [*] *: * request_id=\"*\"" as head,systime,env,host,time,type,message,
request_id
| count as count by Type, message
| sort by count
Collecting logs for the Acquia App
This section provides instructions for configuring log collection from Acquia and sending those logs to Sumo Logic for monitoring and analysis in the Acquia App predefined dashboards and searches.
Sumo Logic enables you to collect logs from Acquia, with the ability to configure the log types to be collected. The logs are then forwarded to a Sumo Logic Cloud Syslog Source.
Step 1: Configure a collector
This section walks you through the process of creating a new Sumo Logic hosted collector.
To create a new Sumo Logic hosted collector, do the following:
- Classic UI. In the main Sumo Logic menu, select Manage Data > Collection > Collection.
New UI. In the Sumo Logic top menu select Configuration, and then under Data Collection select Collection. You can also click the Go To... menu at the top of the screen and select Collection. - Click Add Collector.
- Click Hosted Collector.
- Provide a Name for the Collector.
- A description is optional.
- Category. Enter any string to tag the logs collected from this Collector. This Source Category value is stored in a searchable metadata field called
_sourceCategory. See our Best Practices: Good Source Category, Bad Source Category. - Click the +Add Field link in the Fields section to define the fields you want to associate, each field needs a key and value.
 A green circle with a check mark is shown when the field exists in the Fields table schema.
 An orange triangle with an exclamation point is shown when the field doesn't exist in the Fields table schema. In this case, an option to automatically add the nonexistent fields to the Fields table schema is provided. If a field is sent to Sumo that does not exist in the Fields schema it is ignored, known as dropped.
- Assign to a Budget allows you to assign an ingest budget to the Collector. The dropdown displays your ingest budgets in the following format:
<budget name> (<field value>) (<allocated capacity>)
- Time Zone. Set the default time zone when it is not extracted from the log timestamp. Time zone settings on Sources override a Collector time zone setting.
- Review your input and when finished click Save.
After the Collector has been set up, it appears on the Collection page as a Hosted Collector.
Step 2: Configure a source
This task shows you how to configure a cloud syslog source for Acquia log collection.
Prerequisites
It's helpful to know the options you'll need to set before starting a procedure. When you're configuring a cloud syslog source, be sure to specify the following configurations:
- Source:
- Name. (Required) A name is required, the Description is optional.
- Source Category. (Required) The Source Category metadata field is a fundamental building block to organize and label Sources. Example: Acquia. For more information, see Best Practices.
- Advanced
- Enable Timestamp Parsing. True
- Time Zone. Logs are in UTC by default
- Timestamp Format. Auto Detect
Be sure to copy and paste your token in a secure location. You'll need this when you configure Syslog Settings.
Sumo Logic SSL certificate
In the procedure below, you'll configure a Cloud Syslog Source. This will generate a Sumo Logic token and the endpoint hostname. Then you'll set up TLS by downloading a cert to your server. Download the DigiCert certificate from one of the following locations:
- https://www.digicert.com/CACerts/DigiCertHighAssuranceEVRootCA.crt
- https://www.digicert.com/CACerts/DigiCertHighAssuranceEVRootCA.crt.pem
Configuring a cloud syslog source
Cloud syslog configuration requires a token that is automatically generated when you configure a cloud syslog source. The token allows Sumo to distinguish your log messages from those of other customers. The token is tied to the source, but not to any specific user.
Include the token as the Structured ID in every syslog message that is sent to Sumo Logic. The token is removed by Sumo Logic during ingestion and is not included with your syslog message in search results.
The token is deleted if you delete the source. To change a token, use the Regenerate Token option as described in the following procedure.
To configure a cloud syslog source, do the following:
- Classic UI. In the main Sumo Logic menu, select Manage Data > Collection > Collection.
New UI. In the Sumo Logic top menu select Configuration, and then under Data Collection select Collection. You can also click the Go To... menu at the top of the screen and select Collection. - On the Collection page, click Add Source next to a Hosted Collector. See Set up a Hosted Collector for information on adding Hosted Collectors.
- Select Cloud Syslog.
- Enter a Name to display for this source in Sumo. Description is optional.
- (Optional) For Source Host and Source Category, enter any string to tag the output collected from this source. (Category metadata is stored in a searchable field called
_sourceCategory). - Fields. Click the +Add Field link to add custom log metadata Fields. Define the fields you want to associate. Each field needs a name (key) and value.
- A green circle with a check mark is shown when the field exists and is enabled in the Fields table schema.
- An orange triangle with an exclamation point is shown when the field doesn't exist, or is disabled, in the Fields table schema. In this case, an option to automatically add or enable the nonexistent fields to the Fields table schema is provided. If a field is sent to Sumo that does not exist in the Fields schema or is disabled it is ignored, known as dropped.
- Set any of the following under Advanced:
- Enable Timestamp Parsing. This option is selected by default. If it's deselected, no timestamp information is parsed.
- Time Zone. There are two options for Time Zone. You can use the time zone present in your log files, and then choose an option in case time zone information is missing from a log message. Or, you can have Sumo Logic completely disregard any time zone information present in logs by forcing a time zone. It's important to have the proper time zone set, no matter which option you choose. If the time zone of logs cannot be determined, Sumo Logic assigns the UTC time zone; if the rest of your logs are from another time zone your search results will be affected.
- Timestamp Format. By default, Sumo will automatically detect the timestamp format of your logs. However, you can manually specify a timestamp format for a source. See Timestamps, Time Zones, and Time Ranges, and Date Formats.
- Create any Processing Rules you'd like for the new source.
- Click Save. The token information is displayed in a read-only dialog box, shown below.
- Click Copy to copy the information for use in the syslog client. The information is copied in the following format:
Token: 9HFxoa6+lXBmvSM9koPjGzvTaxXDQvJ4POE/WCURPAo+w4H7PmZm8H3mSEKxPl0Q@41123, Host: syslog.collection.YOUR_DEPLOYMENT.sumologic.com, TCP TLS Port: 6514
The number 41123 in the token is the Sumo Private Enterprise Number (PEN). There are two options for including the token. You can include it in the structured data field or in the message body.
In the following example, the token is in the structured data field.
<165>1 2015-01-11T22:14:15.003Z mymachine.example.com evntslog - ID47 [YOUR_TOKEN] msg
In the following example, the token is in the message body.
<165>1 2015-01-11T22:14:15.003Z mymachine.example.com evntslog - ID47 - YOUR_TOKEN msg
RFC 5424 limits the structured data field (SD-ID) to 32 characters, however our token is 64 characters long. If your logging client enforces this limit you will need to pass the token in the message body. 11. After configuring the source, you can perform these token operations from the Collectors and Sources page:
- Click Show Token to display the token for a cloud syslog source at any time.
- Click Regenerate Token if you need to generate a new token.
Step 3: Configure logging for Acquia
In order to start ingesting Acquia Cloud logs you must setup log forwarding in Acquia Cloud.
To configure Acquia log forwarding, follow the instructions in the Acquia documentation.
Installing the Acquia app
This section provides instructions on how to install the Acquia App, as well as examples of each of the dashboards. The app's pre-configured searches and dashboards provide easy-to-access visual insights into your data.
To install the app, do the following:
Next-Gen App: To install or update the app, you must be an account administrator or a user with Manage Apps, Manage Monitors, Manage Fields, Manage Metric Rules, and Manage Collectors capabilities depending upon the different content types part of the app.
- Select App Catalog.
- In the 🔎 Search Apps field, run a search for your desired app, then select it.
- Click Install App.
note
Sometimes this button says Add Integration.
- Click Next in the Setup Data section.
- In the Configure section of your respective app, complete the following fields.
- Field Name. If you already have collectors and sources set up, select the configured metadata field name (eg _sourcecategory) or specify other custom metadata (eg: _collector) along with its metadata Field Value.
- Click Next. You will be redirected to the Preview & Done section.
Post-installation
Once your app is installed, it will appear in your Installed Apps folder, and dashboard panels will start to fill automatically.
Each panel slowly fills with data matching the time range query received since the panel was created. Results will not immediately be available but will be updated with full graphs and charts over time.
Viewing Acquia dashboards
All dashboards have a set of filters that you can apply to the entire dashboard. Use these filters to drill down and examine the data to a granular level.
- You can change the time range for a dashboard or panel by selecting a predefined interval from a drop-down list, choosing a recently used time range, or specifying custom dates and times. Learn more.
- You can use template variables to drill down and examine the data on a granular level. For more information, see Filtering Dashboards with Template Variables.
- Most Next-Gen apps allow you to provide the scope at the installation time and are comprised of a key (
_sourceCategoryby default) and a default value for this key. Based on your input, the app dashboards will be parameterized with a dashboard variable, allowing you to change the dataset queried by all panels. This eliminates the need to create multiple copies of the same dashboard with different queries.
Overview
The Acquia - Overview dashboard provides a high-level view of the activity and health of the environment. Dashboard panels display visual graphs and detailed information on visitor geographic locations, traffic volume and distribution, responses over time, as well as time comparisons for visitor locations and server hits.
Use this dashboard to:
- Understand the traffic distribution across servers, to provide insights for resource planning through analysis of data volume and bytes served.
- Gain insights into traffic origin locations by region to better allocate compute resources for regions according to their needs.
- Monitor high severity threats and scan attacks.
- Identify and troubleshoot configuration issues.
- Identify ways to fine tune your product based on your data analysis.

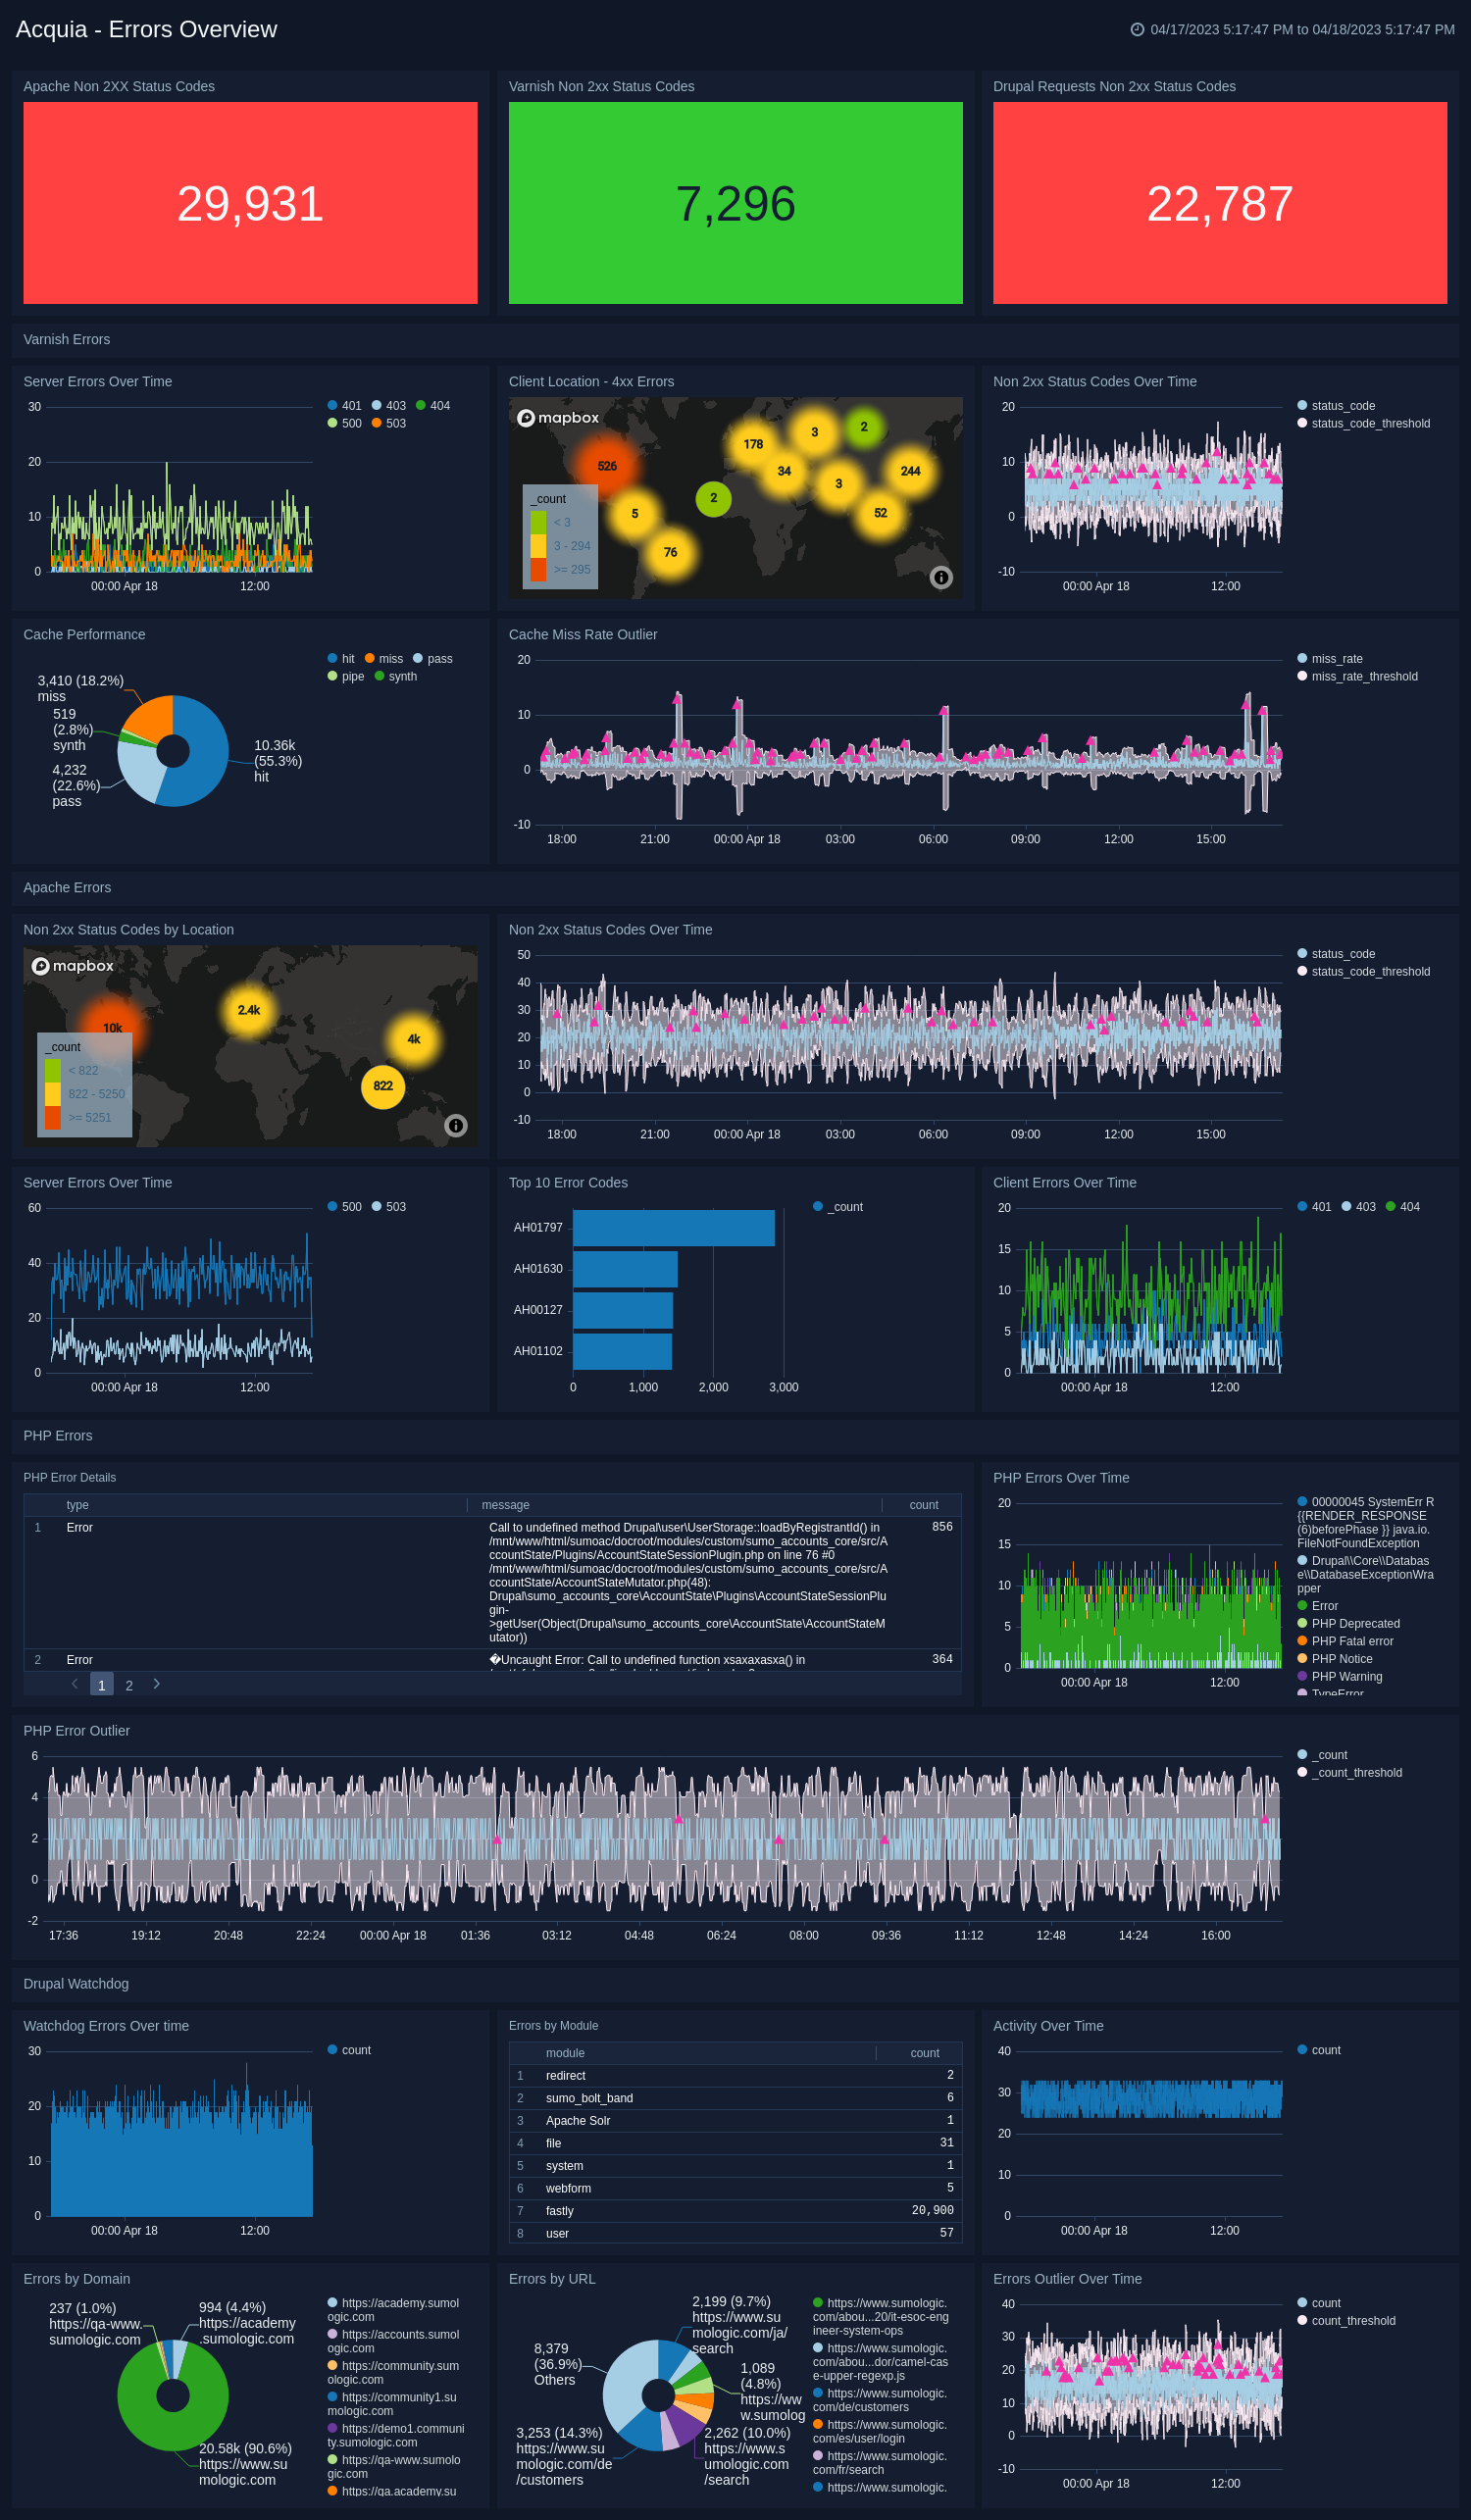
Errors Overview
The Acquia - Errors Overview dashboard provides a high-level view of events by log level, time comparisons, and trends. The panels also show the geographic locations of clients and clients with critical messages, new connections and outliers, client requests, request trends, and request outliers.
Use this dashboard to:
- Track errors by Drupal module.
- Monitor Varnish cache hit and miss rates.
- Track critical error messages from the various components of the Acquia stack.
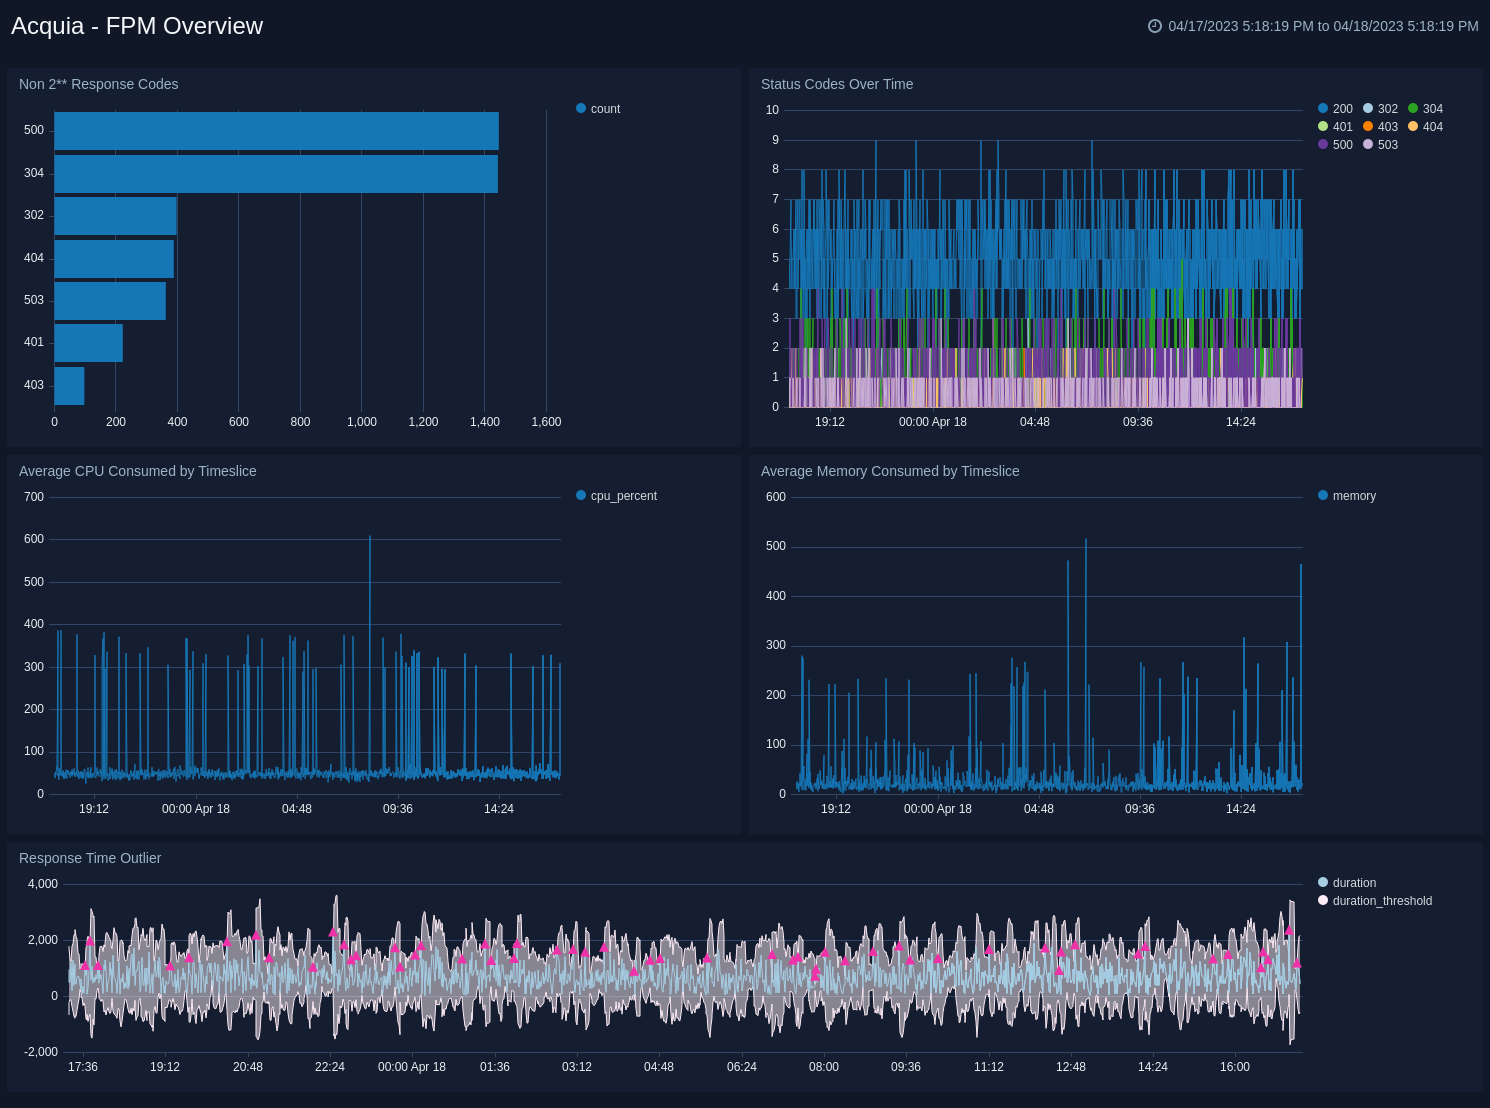
FPM Overview
The Acquia - FPM Overview dashboard provides insights for analysis of the performance of FPM (FastCGI Process Manager) in the Acqauia environment, including memory and CPU usage, status codes and response time outliers.
Use this dashboard to:
- Identify trends for consumed resources over time.
- Monitor status codes over time.
- Monitor response time latency.
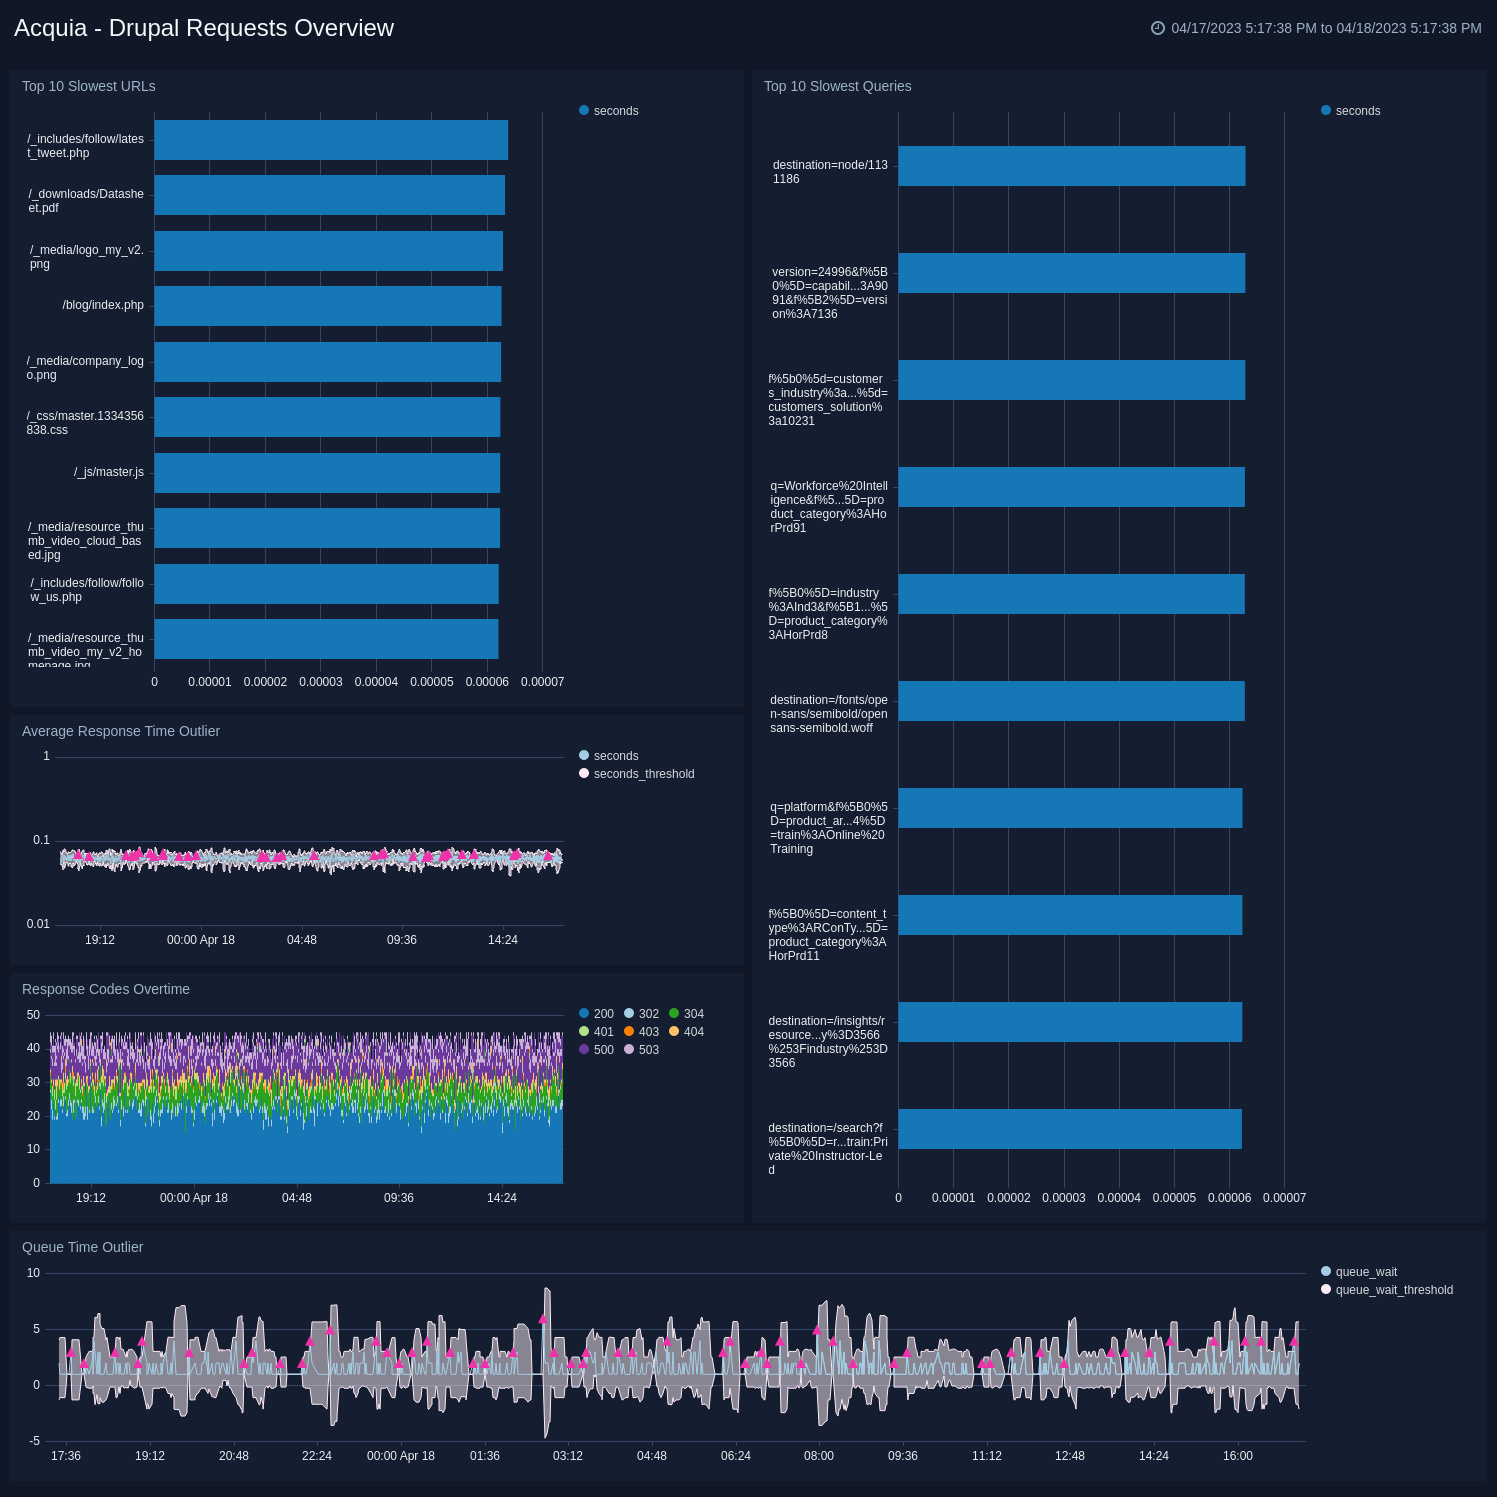
Drupal Request Overview
The Acquia - Drupal Requests Overview dashboard provides insights for analysis of the performance of the Drupal platform. The panels show response time anomalies, response codes and breakdowns of slow urls and queries.
Use this dashboard to:
- Review trends for slow URLs and slow queries
- Monitor status codes over time
- Monitor response time latency
Upgrade/Downgrade the Acquia app (Optional)
To update the app, do the following:
Next-Gen App: To install or update the app, you must be an account administrator or a user with Manage Apps, Manage Monitors, Manage Fields, Manage Metric Rules, and Manage Collectors capabilities depending upon the different content types part of the app.
- Select App Catalog.
- In the Search Apps field, search for and then select your app.
Optionally, you can identify apps that can be upgraded in the Upgrade available section. - To upgrade the app, select Upgrade from the Manage dropdown.
- If the upgrade does not have any configuration or property changes, you will be redirected to the Preview & Done section.
- If the upgrade has any configuration or property changes, you will be redirected to the Setup Data page.
- In the Configure section of your respective app, complete the following fields.
- Field Name. If you already have collectors and sources set up, select the configured metadata field name (eg _sourcecategory) or specify other custom metadata (eg: _collector) along with its metadata Field Value.
- Click Next. You will be redirected to the Preview & Done section.
Post-update
Your upgraded app will be installed in the Installed Apps folder and dashboard panels will start to fill automatically.
See our Release Notes changelog for new updates in the app.
To revert the app to a previous version, do the following:
- Select App Catalog.
- In the Search Apps field, search for and then select your app.
- To version down the app, select Revert to < previous version of your app > from the Manage dropdown.
Uninstalling the Acquia app (Optional)
To uninstall the app, do the following:
- Select App Catalog.
- In the 🔎 Search Apps field, run a search for your desired app, then select it.
- Click Uninstall.